Article

Torrefaction and Thermochemical Properties of Agriculture Residues

1
Institute of Chemical Engineering & Technology, University of the Punjab, Lahore 54590, Pakistan
2
Saudi Basic Industries Corporation (SABIC) Technology and Innovation Center, Riyadh 11551, Saudi Arabia
3
Department of Chemical & Materials Engineering, King Abdul Aziz University, Jeddah 21589, Saudi Arabia
4
Institute of Energy & Environmental Engineering, University of the Punjab, Lahore 54590, Pakistan
*
Author to whom correspondence should be addressed.
Energies 2021, 14(14), 4218; https://doi.org/10.3390/en14144218
Submission received: 1 June 2021 / Revised: 28 June 2021 / Accepted: 6 July 2021 / Published: 13 July 2021

Abstract

:
In this study, the densification of three agriculture waste biomasses (corn cobs, cotton stalks, and sunflower) is investigated using the torrefaction technique. The samples were pyrolyzed under mild temperature conditions (200–320 °C) and at different residence times (10 min–60 min). The thermal properties of the obtained bio-char samples were analyzed via thermo-gravimetric analysis (TGA). Compositional analysis of the torrefied samples was also carried out to determine the presence of hemicellulose, cellulose, and lignin contents. According to the results of this study, optimum temperature conditions were found to be 260 °C–300 °C along with a residence time of 20 min–30 min. Based on the composition analysis, it was found that biochar contains more lignin and celluloses and lower hemicellulose contents than do the original samples. The removal of volatile hemicelluloses broke the interlocking of biomass building blocks, rendering biochar brittle, grindable, and less reactive. The results of this study would be helpful in bettering our understanding of the conversion of agricultural waste residues into valuable, solid biofuels for use in energy recovery schemes. The optimum temperature condition, residence time, and GCV for torrefied corn cobs were found to be 290 °C, 20 min, and 5444 kcal/kg, respectively. The optimum temperature condition, residence time, and GCV for torrefied cotton balls were found to be 270 °C, 30 min, and 4481 Kcal/kg, respectively. In the case of sunflower samples, the mass yield of the torrefied sample decreased from 85% to 71% by increasing the residence time from 10 min to 60 min, respectively.

1. Introduction

The circular economy (CE), decarbonization, and sustainability are common words widely used by policy makers to highlight global warming potential (GWP) with the aim of improving the quality of life of their citizens [1]. Fossil fuels are extensively used to meet human needs; however, they pose serious environmental threats and possess a high GWP. Global policy makers have been engaged in a longstanding debate about the use of fossil fuels as a sustainable source of energy, mainly surrounding the limited supply of oil and the high greenhouse gas (GHG) emissions of fossil fuels. Policy makers have also been discussing the concept of carbon neutrality in order to address GWP, as per Paris accord commitments that temperature rise should be limited to 1.5 °C. The Paris accord further emphasizes the use of net negative energy technologies (NETs), such as reforestation, direct capture of CO2, bio-based energy production, the use of ocean fertilization, and biochar-based carbon sequestration [2].
Biomass-based fuels have a better sustainability footprint when compared to fossil fuels. The use of biochar is a good way to fix CO2. It involves burying CO2 from the atmosphere into biomass for long-term energy storage. The use of biochar as a fertile agent decreases the carbon footprint of soil and also increases its fertility. Unlike biomass itself, biochar as a source of energy can be stored for long periods of time without degradation in energy content. Biomass can be burned directly to produce heat; however, for its efficient utilization in industrial sectors and others, several techniques for biomass conversion have been developed, such as physical, biological, bio-chemical, and thermochemical conversion processes [3]. Bio-diesel production via transesterification is one important way of converting edible and non-edible oils into fuels. Other useful techniques include the production of bioethanol, bio-methane, bio-hydrogen, and bio-alcohol products.
Thermochemical conversion processes are the primary ways of producing biofuel, except in the case of combustion wherein heat is the main product. These processes are mainly categorized into gasification, pyrolysis, combustion, hydrothermal treatment, and torrefaction [1,2,3,4,5], and possess promising qualities, such as a small environmental footprint, a short residence time, the capacity to handle a variety of wastes, and the ability to produce a final product with a high energy yield. Out of these thermochemical conversion processes, torrefaction possesses the mildest operating conditions and is considered to be the process that has the lowest global warming potential [3]. This study is focused on the torrefaction of three indigenous biomass samples from different parts of Pakistan. Torrefaction is recognized as a useful technique in densifying the energy contents of biomass. It offsets the drawbacks of utilizing biomass as an energy source, such as moisture absorption and degradation under long-term storage conditions. Low energy content makes it difficult to transport biomass economically, and the crushing and grinding of biomass is also difficult and costly [6,7]. Torrefaction is helpful in enhancing biomass for its use in wider applications. A major advantage of torrefaction is that it can break down the fibrous character of biomass and reduce the formation of soot [8]. Torrefied biomass is easily grindable, either alone or with coal from existing coals mills at coal-fired power plants. Torrefied biomass contains properties similar to those of low-rank coal, which makes it an attractive option for use in existing coal-fired power plants, either co-generatively or 100% pure, instead of building new biomass-based power plants. Studies have shown that mild torrefaction is a good way to retain the heating contents of biomass [3]. Prolonged torrefaction at temperatures >300 °C causes damage to the calorific contents of biomass [9,10]. A comparison between the mass yields of torrefied products and their energy yields is thus necessary, as is optimizing torrefaction temperature and residence time. Additional criteria for optimizing the torrefaction conditions of biomass include the proximate contents of raw and torrefied samples as well as their combustion characteristic.
This study relates temperature and residence time with three types of biomass—corn cobs, cotton balls, and sunflower residues—to obtain an optimized torrefaction product. Experiments were carried out to investigate the effect of temperature and residence time on the proximate properties and gross calorific value (GCV) of torrefied samples. Further experiments were carried out to find fibrous content in the torrefied samples in order to determine the presence of hemicellulose, cellulose, and lignin contents, and how each of these compared with those found in the raw samples. A thermogravimetric study was also carried out to determine the thermal characteristics of the three torrefied samples in order to measure their combustibility and volatility.
Pakistan is an agro-based country, and sources of biomass are abundantly available, many of which ultimately end up being burned or biodegraded. A systematic study exploring local biomass sources and ways to effectively convert them into solid biofuel was thus imperative. Our research was conducted in an effort to bridge the knowledge gap in this field of study and to provide potentially useful information for political leaders who may want to consider using torrefied biofuels as an alternate source of fuel.

2. Experimental Details

2.1. Preparation and Procedure

Approximately 5 kg representative samples of each biomass were collected from different areas of Punjab, Pakistan. For the collection of samples, the ASTM D 346-04 procedure was followed. Samples were crushed and ground to a particle size of −60 mesh (250 µm) for proximate analysis. The sample size was between −10 and +16 mesh (−2000 and +595 µm) for the torrefaction experiments. The crushed samples were sealed in plastic bags before use in the experiments. Each of the three biomass samples was dried at 105 °C for two hours in a digital oven before torrefaction in order to remove any residual moisture. Standard ASTM procedures for (D-3173 (ash), D-3174 (volatile matter), and D-3175 (fixed carbon) were adopted for proximate analysis of raw and torrefied samples. The gross calorific value was determined by using a digital bomb calorimeter (LECO-AS500). Results of the proximate analysis and the GCV are shown in Table 1.

2.2. Torrefaction Procedure

Torrefaction experiments were performed in a tube furnace reactor. Prior to torrefaction, samples were oven-dried for 2 h to remove any residual moisture. The furnace was purged with an N2 supply at a flow rate of 2.5 mL/min for 10 min. N2 was supplied continuously during the torrefaction experiment in order to evacuate any formed gas and to keep the atmosphere inert. Torrefaction was carried out at different temperatures ranging from 200 °C to 350 °C and at different residence times. All three biomass types were torrefied under the same set of conditions. In a typical experimental run, a crushed sample of a given particle size was placed in an oven to remove any residual moisture. Every time, 4 g of the oven-dried sample was taken in a crucible and placed in a reactor. The reactor was furnished with a nitrogen supply and an exhaust vent to release torrefaction gases. Each experiment was performed three times to ensure the accuracy of the results. The torrefied product was cooled and measured for mass yield, which was determined by comparing the final weight of the torrefied product with the initial weight of the sample. Energy yield was calculated by using the mass yields and calorific values of the samples [11]. The relationships that define mass yield and energy yield are provided in Equations (1) and (2):
Mass yield = (Wtorr)/(Wraw) × 100
Energy yield = Mass yield × (GCVtorr)/(GCVraw)

2.3. Composition Analysis

The biomass and torrefied sample contents of hemicellulose, cellulose, and lignin were determined by using established measurement procedures [12,13,14,15]. In brief, extractives were determined by mixing 1.0 g of a dried biomass sample with 60 mL of acetone in a round-bottom flask at 90 °C for 2 h. Washed samples were oven-dried in order to reach a constant weight. Extractive percentages were measured by calculating the weight difference between the initial and final weight of each sample. Hemicelluloses were also determined for washed extractive samples. Then, 1.0 g (W1) of an extractive-free sample was placed in a 250 mL round-bottom flask with 30 mL of 80% acetic acid and 2 mL of nitric acid (16 M) and stirred for 20 min. Samples were filtered, washed, and then dried in an oven. The dried residue was named W2 and mixed with 3 mL–4 mL of conc. HNO3 and placed in a muffle furnace for 6 h at 500 °C. The final weight of the ash was named W3. The percentage of cellulose was measured by using the following formula: (W2 − W3)/W1 × 100. The lignin content was determined by the washed extractive-free sample (W1). Then, 1.0 g of the sample (W1) was mixed with 70 mL of 1.25% H2SO4, stirred gently for 2 h, and filtered. The filtered sample was mixed with 30 mL of 72% conc. H2SO4, stirred for 30 min, and then filtered again and washed with distilled water. Residue was dried in an oven and weighed as W2. The percentage of lignin was measured by the following formula: W2/W1 × 100.

2.4. Thermogravimetric Analysis

A thermogravimetric analyzer was used to determine the combustion characteristics of raw and torrefied samples of sunflower in an oxidizing environment by using a TGA 701 LECo, St. Joseph, MI, USA. The raw and torrefied samples of corn cobs, cotton balls, and sunflower were torrefied in a single run. All six samples of 20 mg each were placed in six 150 µL crucibles. The temperature was ramped from 25 °C to 950 °C at a heating rate of 20 °C/min with a stay time of 5 min at 110 °C for any moisture content. The weight loss, function of time, and furnace temperature were also recorded. The mean reactivity of each sample was determined according to calculations by [16,17], i.e., (100 × R/T) where R is the weight loss rate height and T is the corresponding temperature on DTG curves. The sum of all the weight loss rate peaks to corresponding temperature provided the average reactivity of the sample. The combustibility of the six samples was determined by the combustion characteristics factor (CCF), as explained in [18] and shown in Equation (3)
CCF = ( dw dt ) avg × ( dw dt ) max T i 2 × T b
where ( dw dt ) avg and ( dw dt ) max are the average and maximum weight loss rates of the samples, respectively; Ti is the initial temperature; and Tb is the final temperature.

3. Results and Discussion

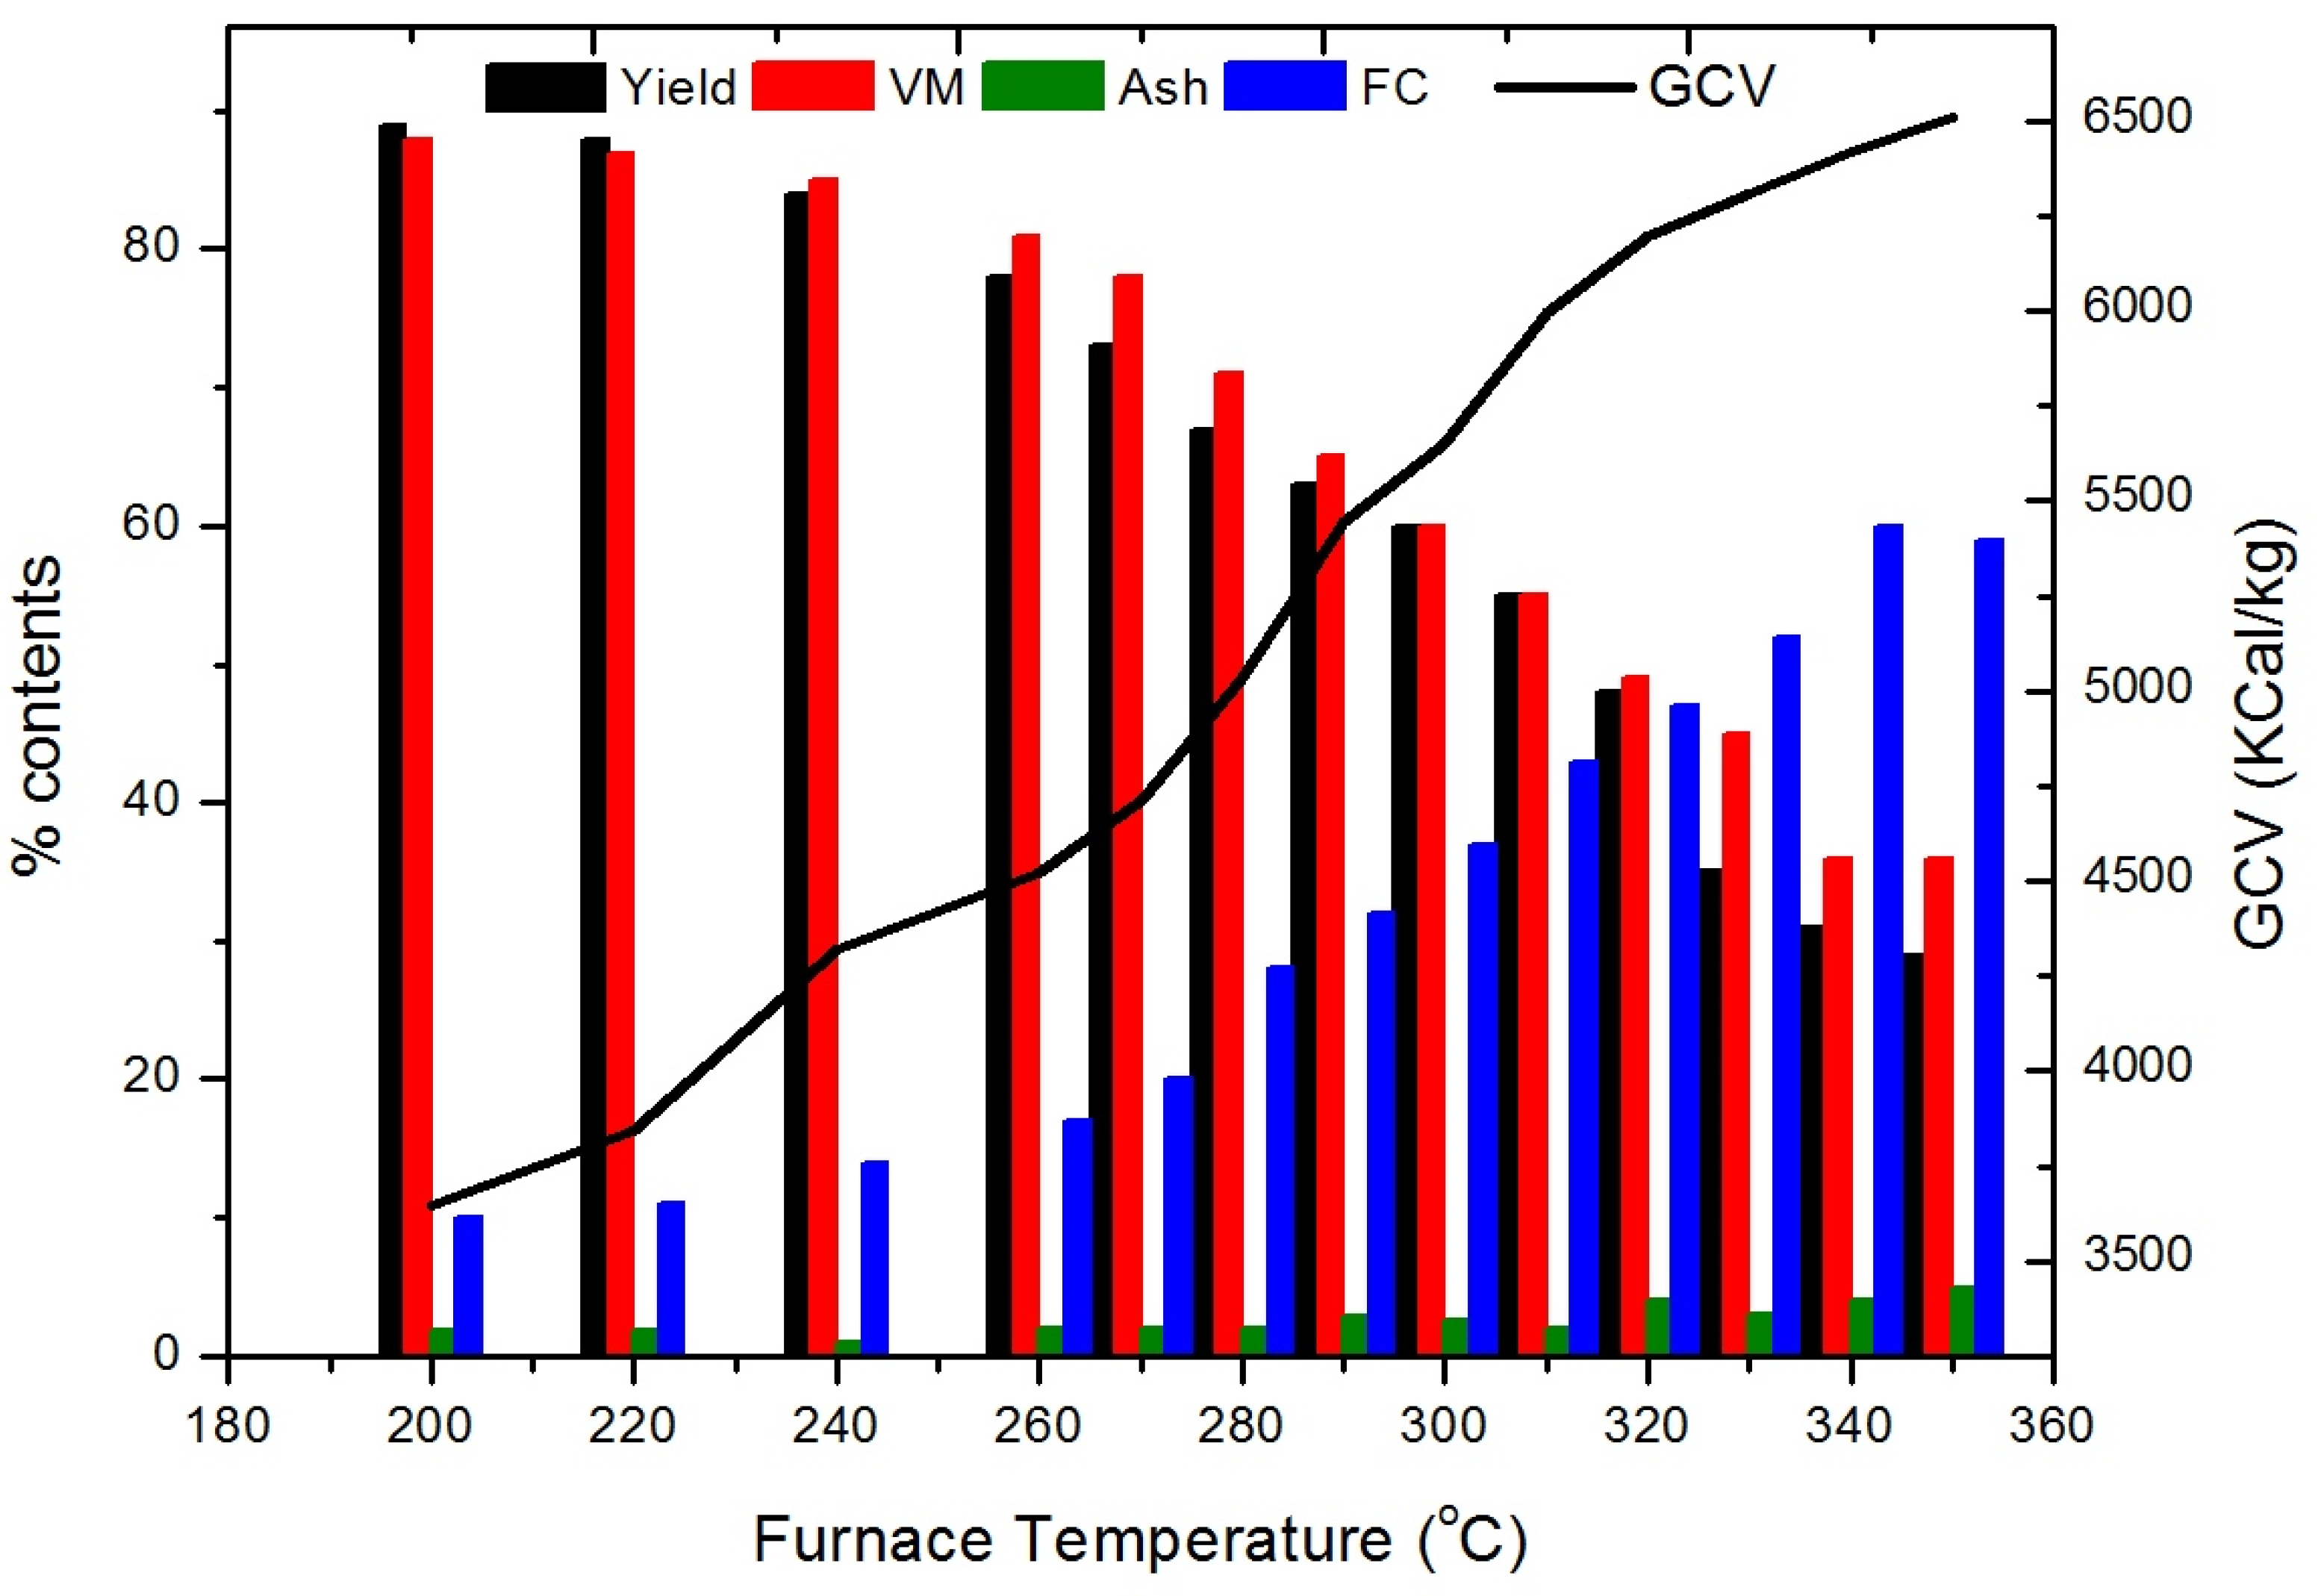
3.1. Effect of Temperature

Figure 1 shows the effect of temperature on the physicochemical properties of the corn cobs. Significant variations were observed in the proximate contents as a function of temperature. A temperature of 290 °C with a GCV of 5444 Kcal/kg and a mass yield of 63% was found to be optimum. Mass yield reduced to the significantly low value of 39% at a temperature of 350 °C, which makes it an unattractive option given its very low mass yield at high temperatures. Conceptually, decomposition is normally attributed to the release of oxygen-containing smaller molecules, such as H2O, CO2, and CO [19]. The final product was uniform and composed of high lignin contents with comparatively high C/H and C/O ratios [8]. Based on these results, temperatures in the range of 260 °C–300 °C, and more specifically in the range of 290 °C–300 °C, could be a preferred choice for effective torrefaction.
Figure 2 shows the effect of temperature on the proximate contents and GCV of cotton balls. For cotton balls, a torrefaction temperature >310 °C was not investigated based on initial experimental findings about corn cobs. A high temperature leads to excessive losses in torrefaction mass yields [20]. The GCV of cotton balls gradually increased to >4800 Kcal/kg for a maximum temperature of 310 °C where the mass yield was found to be 64.5%. The optimum temperature value and GCV were found to be 270 °C and 4481 Kcal/kg, respectively. The release of volatile matter slowed down at temperatures higher than 260 °C. The values of volatile matters and fixed carbon at 270 °C were 21% and 64%, respectively. The release of volatiles in cotton balls was relatively less than in corn cobs, which may be a reflection of their compactness at maturity [21].
Figure 3 shows the effect of temperature on the proximate contents and GCV of torrefied sunflower samples. It is evident that there is a reduction of 24% in the yield of torrefied mass at the temperature range shown in Figure 3. The volatile matter reduced from 76% to 58%, and the fixed carbon decrease was 8.5% in the same temperature range. The fixed carbon content reached a maximum of 260 °C, after which no substantial change was observed. An increase in the ash content of sunflower could be attributed to a decrease in the volatile matter content, as proximate analysis determination is based on the per kg basis of solid mass. The GCV value increased from 3654 Kcal/kg to 4703 kcal/kg. A relatively sharp increase in GCV was observed at a temperature range of 200 °C–250 °C, but for higher temperatures, the increase in GCV was not significant. This could be due to the fast release of heteroatoms from the sunflower mass as the temperature increased and also because, once sufficient heteroatoms were removed from the biomass, it was difficult to further decompose the solid mass [22].
In torrefaction, the decomposition of heteroatoms in the hemicelluloses and celluloses of biomass results in the release of oxygen-containing gases, such as CO2, H2O, and CO, etc. In this study, the final torrefied product was relatively uniform and composed of high lignin contents [23]. Therefore, the C/H or C/O ratios of torrefied sunflower would be higher than in the raw sample [3]. In Figure 3, it can be seen that the mass yield constantly decreased over the temperature span. Since sunflower contains >76% volatile matter, the decrease in the mass yield in relation to temperature was found to be very significant. However, excessive loss in the mass yield may decrease energy contents in the torrefied biomass. The energy yield of sunflower continued to increase, as a function of temperature and was found to reach its maximum in the temperature range of 250 °C–270 °C. Calculations for energy yields can be found elsewhere [11]. For temperatures >270 °C, the energy yield decreased, which may reflect the loss of carbon contents in the torrefied mass. Mass yield was found to be between 80% and 85% for a temperature range of 250 °C–270 °C. An intermediate value of 260 °C is therefore considered to be an optimum temperature at which to carry out the torrefaction of sunflower biomass samples.

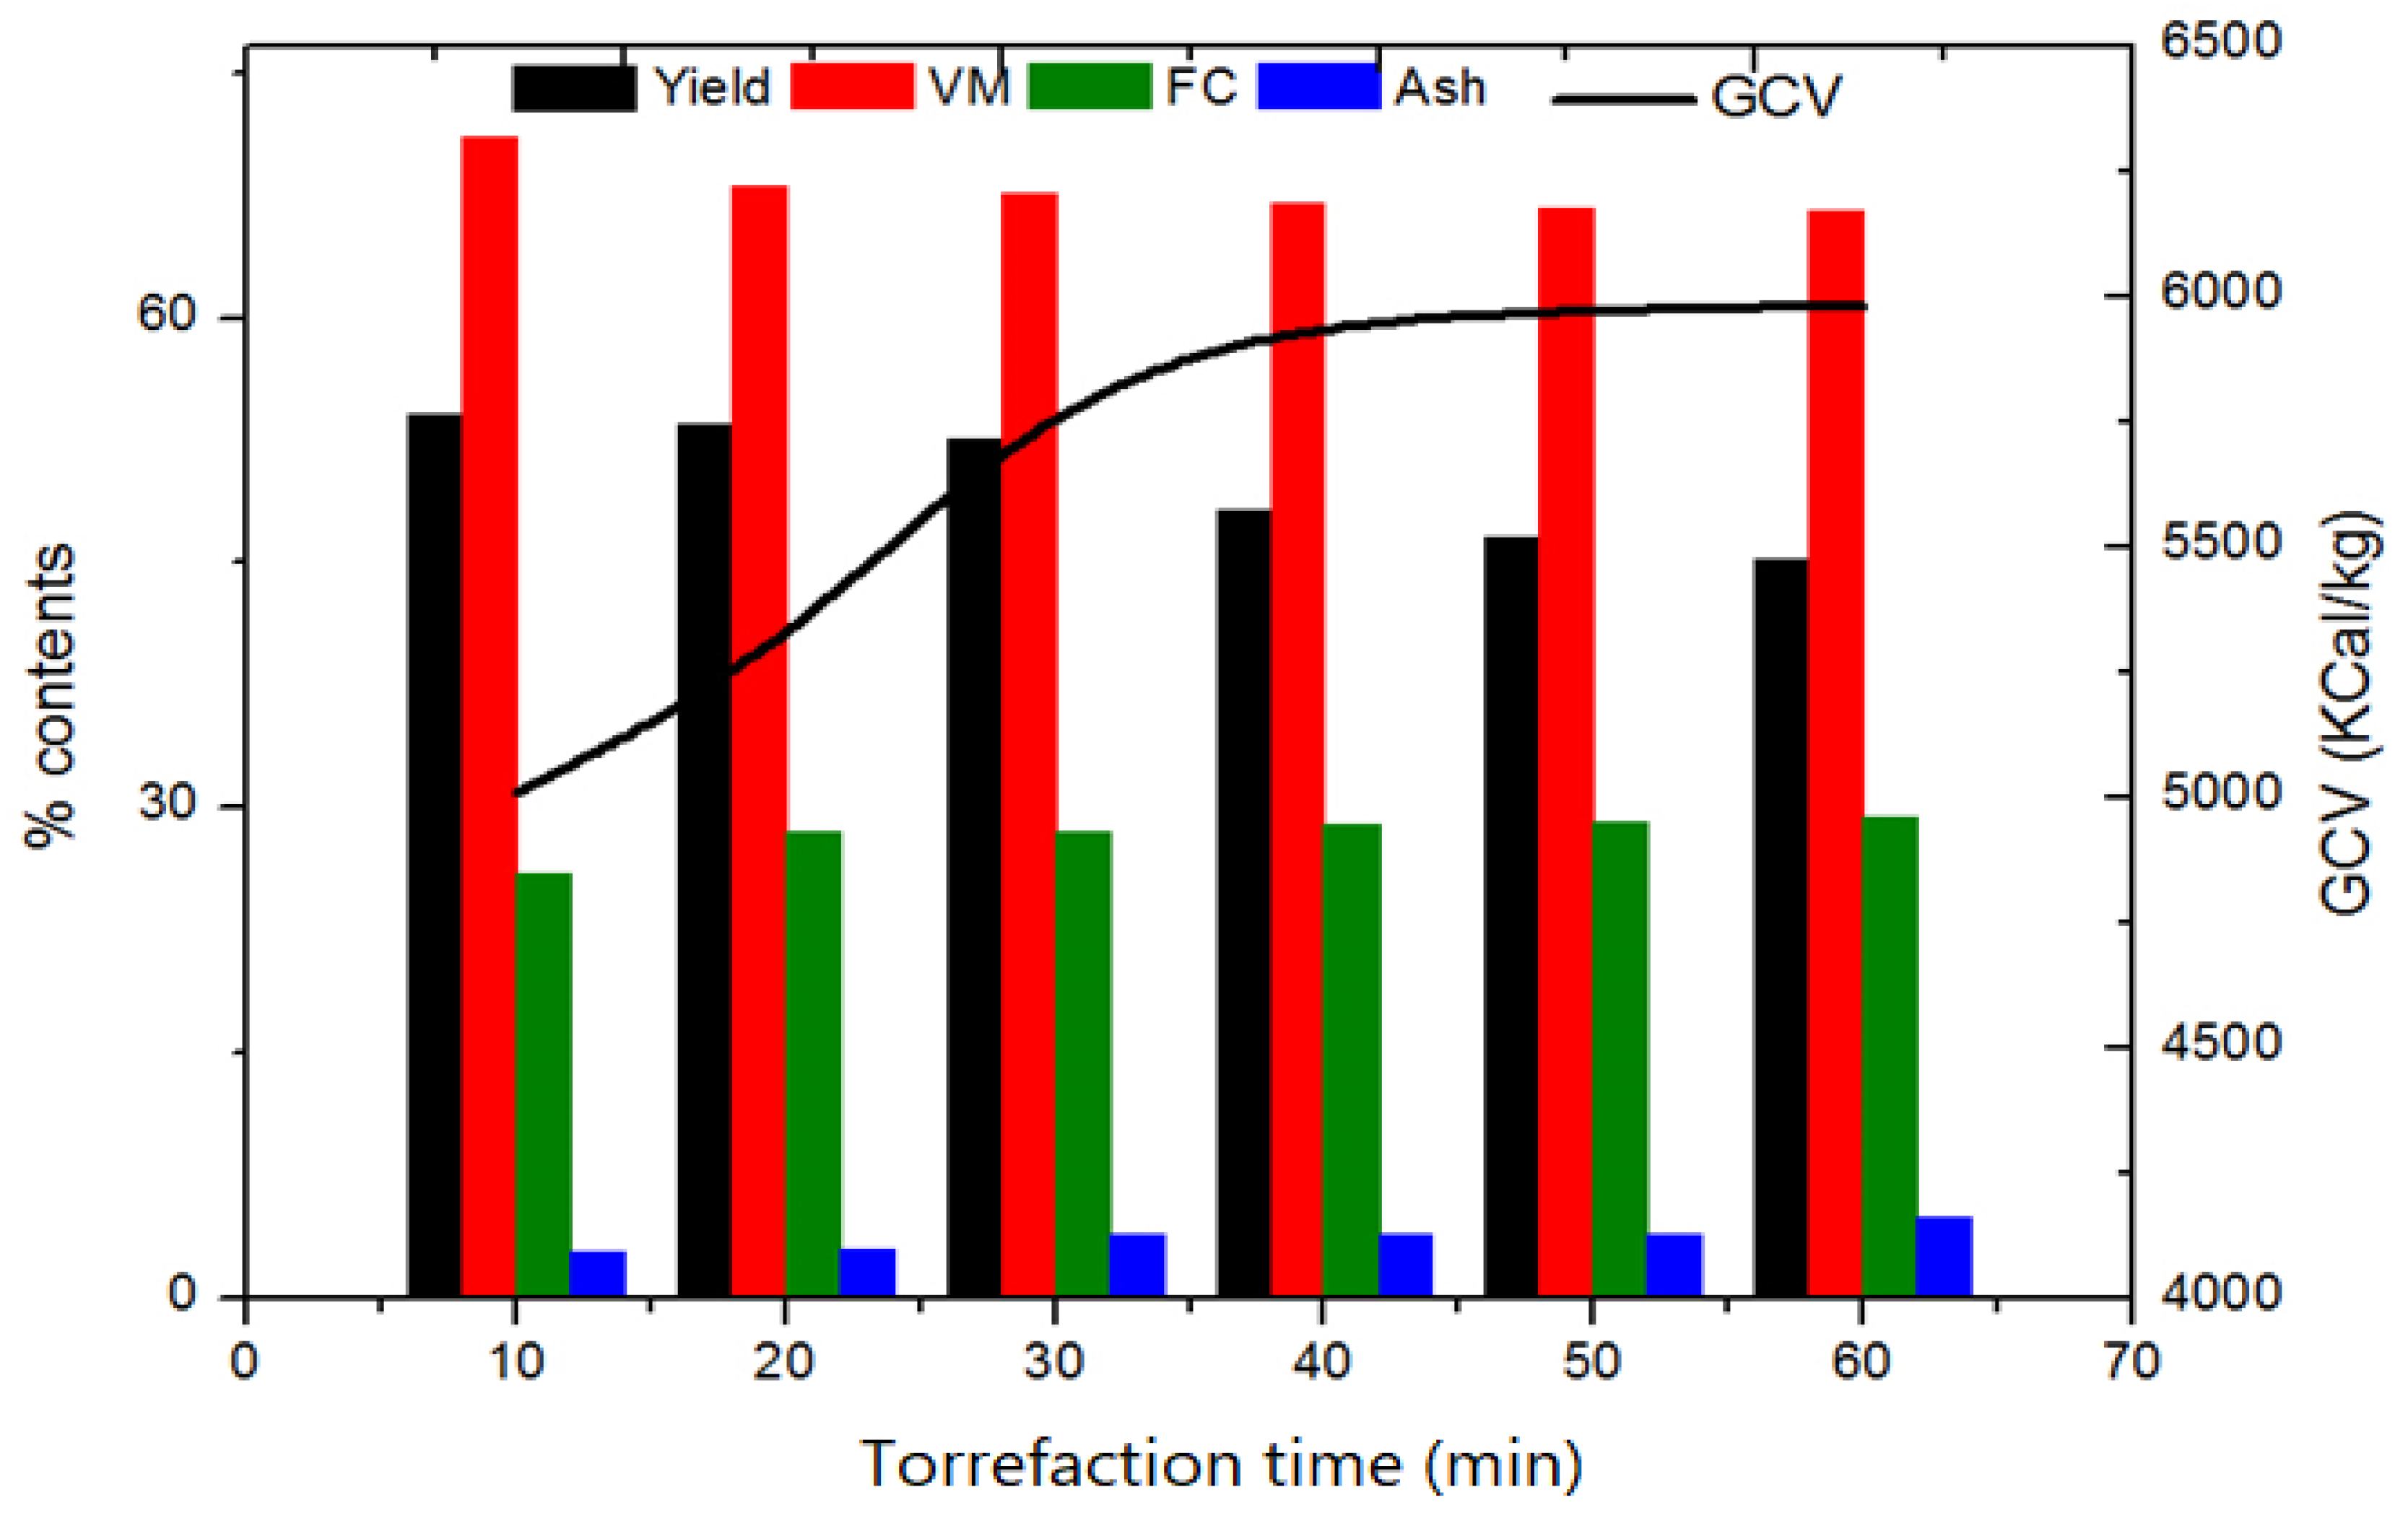
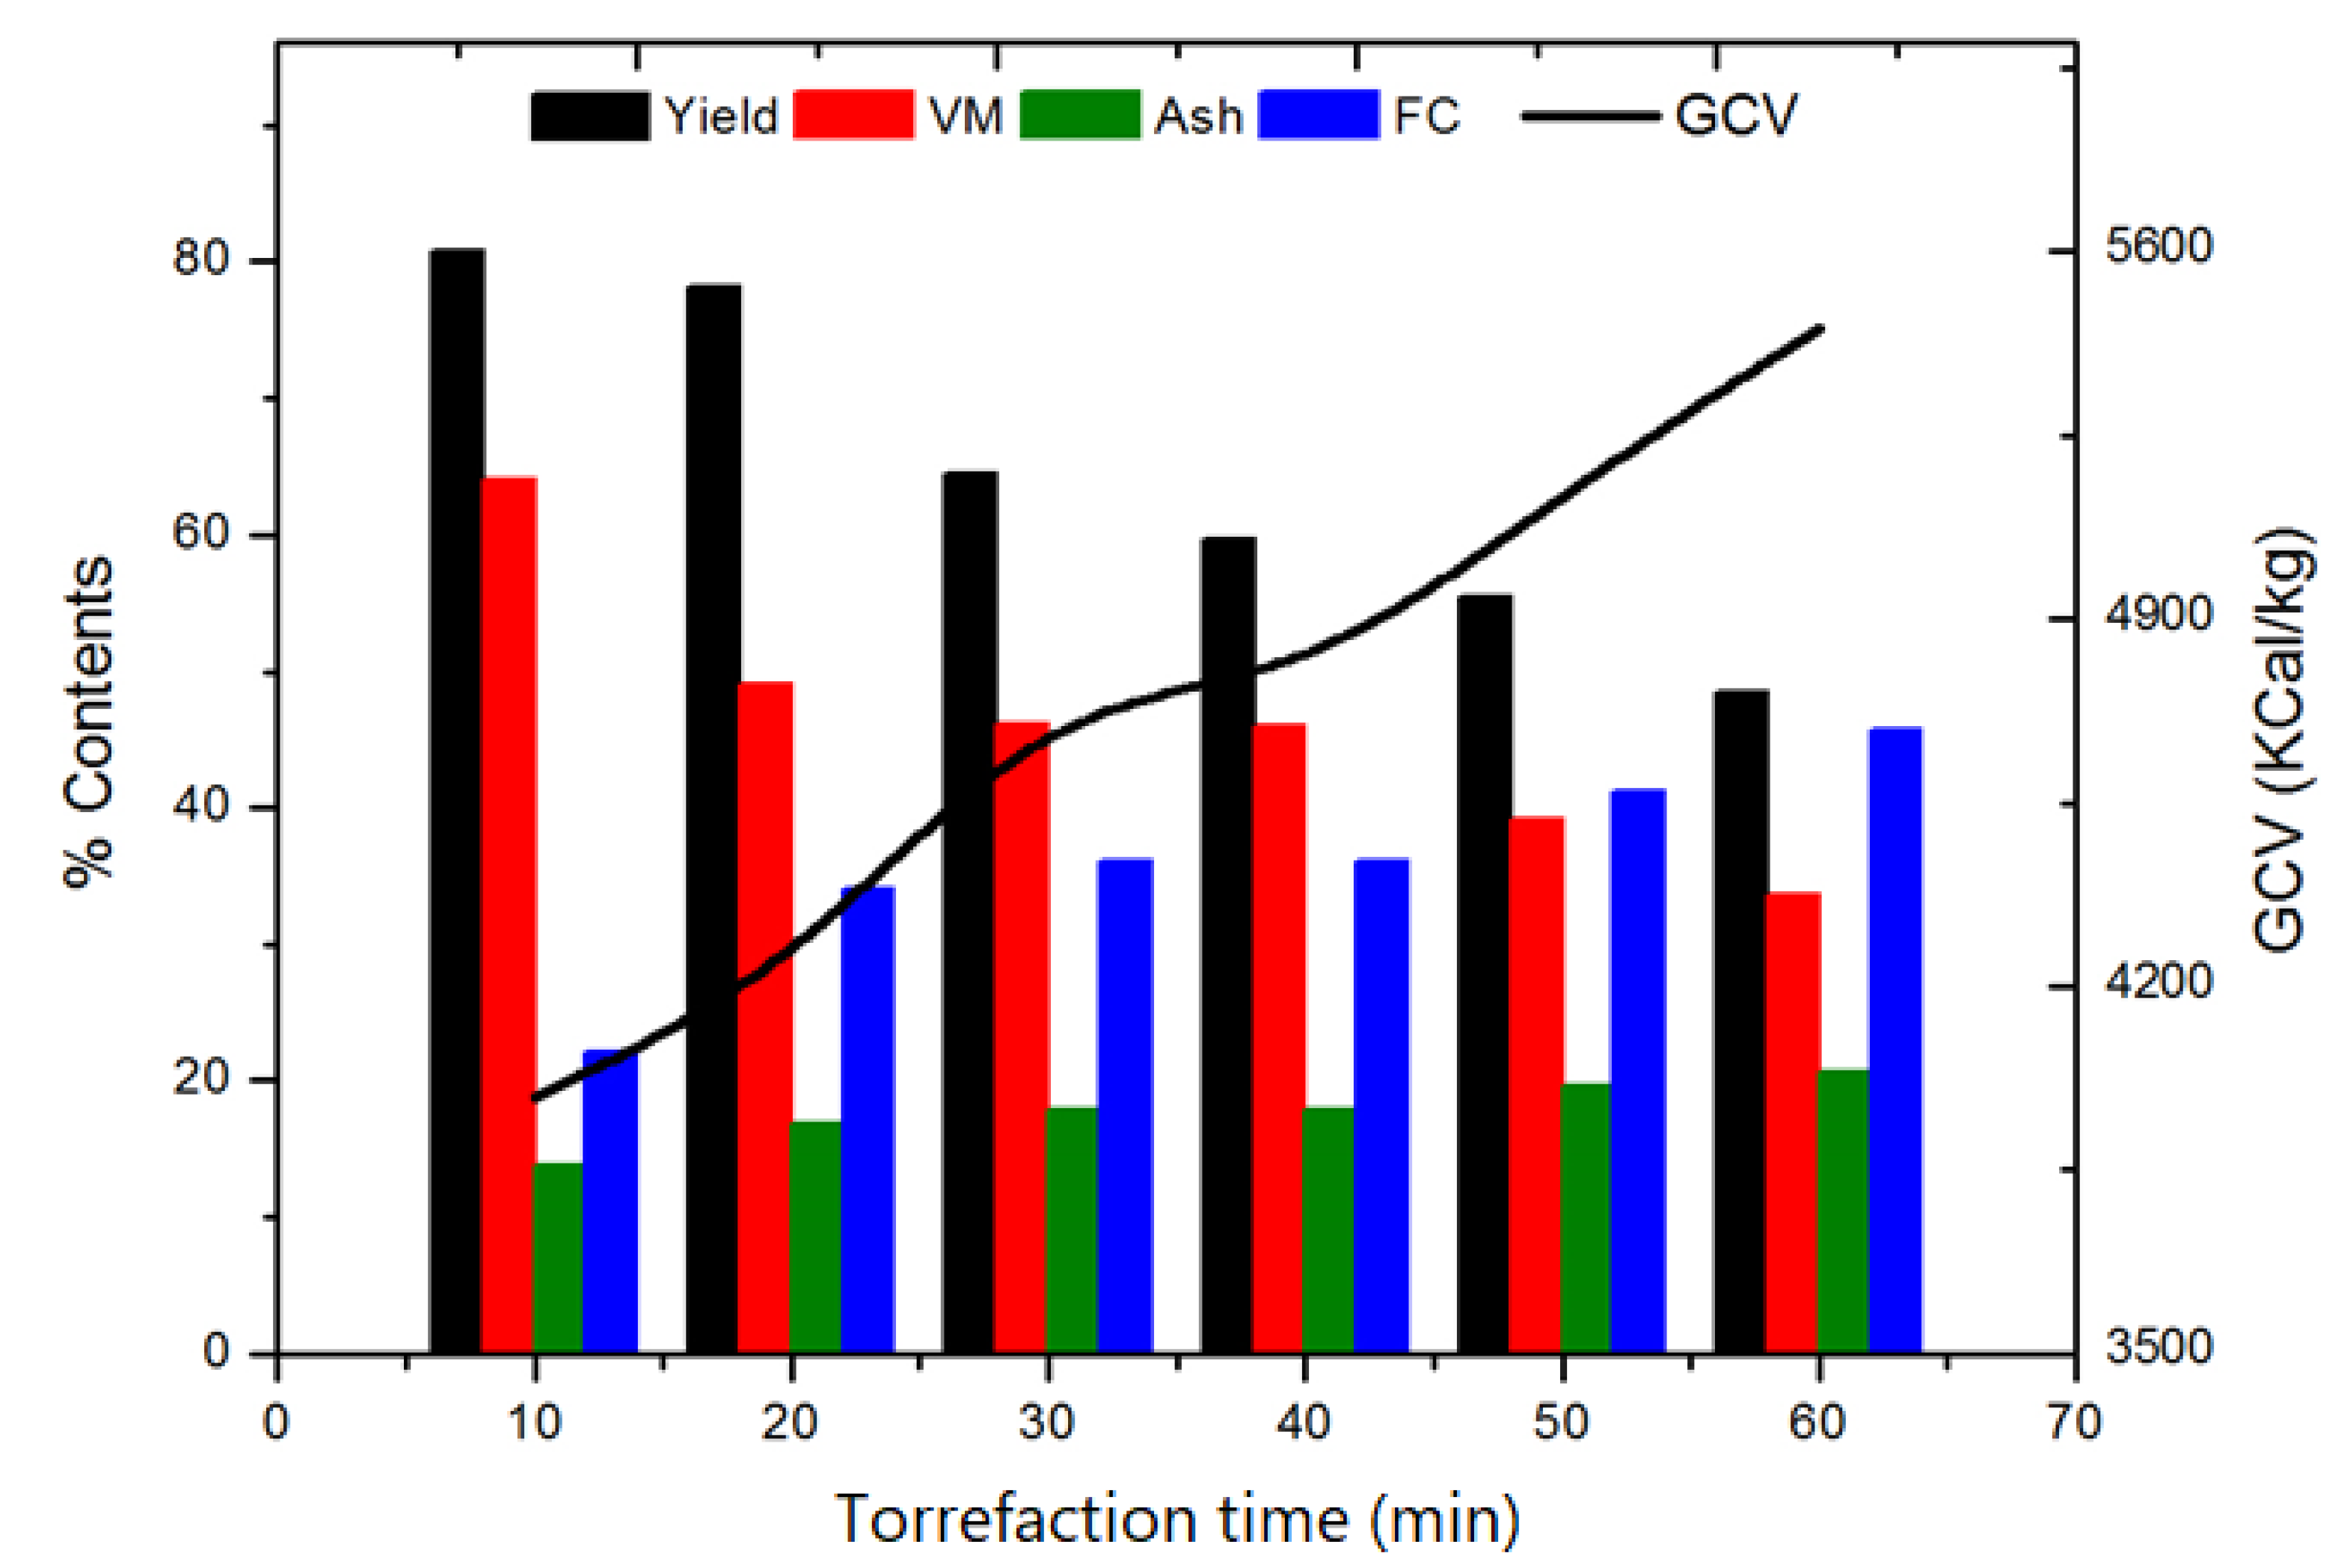
3.2. Effect of Residence Time

Figure 4 shows the effect of residence time on the proximate contents and GCV of torrefied samples at the optimum temperature condition (290 °C) for corn cobs. Mass yield decreased from 54% to 45%, corresponding to a residence time of 10 min to 60 min, respectively. The GCV of 5581 Kcal/kg at a mass yield of 52.78% and an energy yield of 79% was found to reach its maximum at a residence time of 30 min. Fixed carbon and volatile contents were found to be 28% and 67%, respectively. A residence time between 30 min and 60 min can therefore be regarded as an effective torrefaction residence time range for the above-mentioned biomasses.
Figure 5 shows the effect of residence time on the proximate contents and GCV of torrefied cotton balls at an optimum temperature of 270 °C. The mass yield decreased from 88% to 44%, corresponding to a residence time of 10 min–50 min, respectively. During this time span, volatile matters decreased from 64% to 39% and fixed carbon increased from 22% to 41%. The GCV of cotton balls increased from 3989 Kcal/kg to 5140 Kcal/kg. The optimum value of residence time according to energy yield was found to be 10 min. Energy yield constantly decreased as the residence time was increased [24]. Therefore, a lower residence would be helpful in conserving the total energy contents in cotton balls.
In further experiments, the effect of residence times on the proximate contents and GCV of torrefied sunflower at an optimum temperature condition (260 °C) was determined, as shown in Figure 6. The mass yield of torrefied sunflower residue decreased from 84% to 71% as residence time increased from 10 min to 60 min, respectively. Demonstrating a significant increase, 18.5% of fixed carbon contents were found to reach their maximum at 60 min. Ash contents increased from 17% to 23% by increasing residence time from 10 min to 60 min, respectively. There was a gradual increase in the GCV with residence time, and its value was found to be 4100 kcal/kg at a 10 min residence time, which increased to 4370 kcal/kg at a 60 min residence time. An interesting finding was observed in terms of energy yield as a function of residence time. The energy yield reached its maximum at a 10 min residence time, which was decreased to a lower value at 60 min. This observation supports our argument that a lower residence time at given experimental conditions is a preferable choice when it comes to conserving total energy contents in torrefied sunflower [25].

3.3. Compositional Analysis

Table 2 shows the compositional comparison between raw samples of corn cobs, cotton balls, and sunflower stalks and their torrefied form, when each were torrefied under the same operating conditions, i.e., at 260 °C for 20 min. The amount of extractives and hemicellulose decreased in the torrefied biomass samples. Two components might be easily attacked by thermal effects, rendering them more susceptible to decomposition. This may also suggest the presence of loose structures and heteroatoms in these components [26]. The cellulose contents of the torrefied samples also decreased, which can be attributed to thermal effects leading to the decomposition of the cellulose contents. The lignin contents of the torrefied samples were elevated after torrefaction [18]. It is to be expected that there would be no change in the amount of lignin contents before and after torrefaction. The reason for the higher value after torrefaction could be due to a decreased number of extractives, hemicellulose, and cellulose in the torrefied samples. These findings were consistent with the data reported in other literature [27,28].

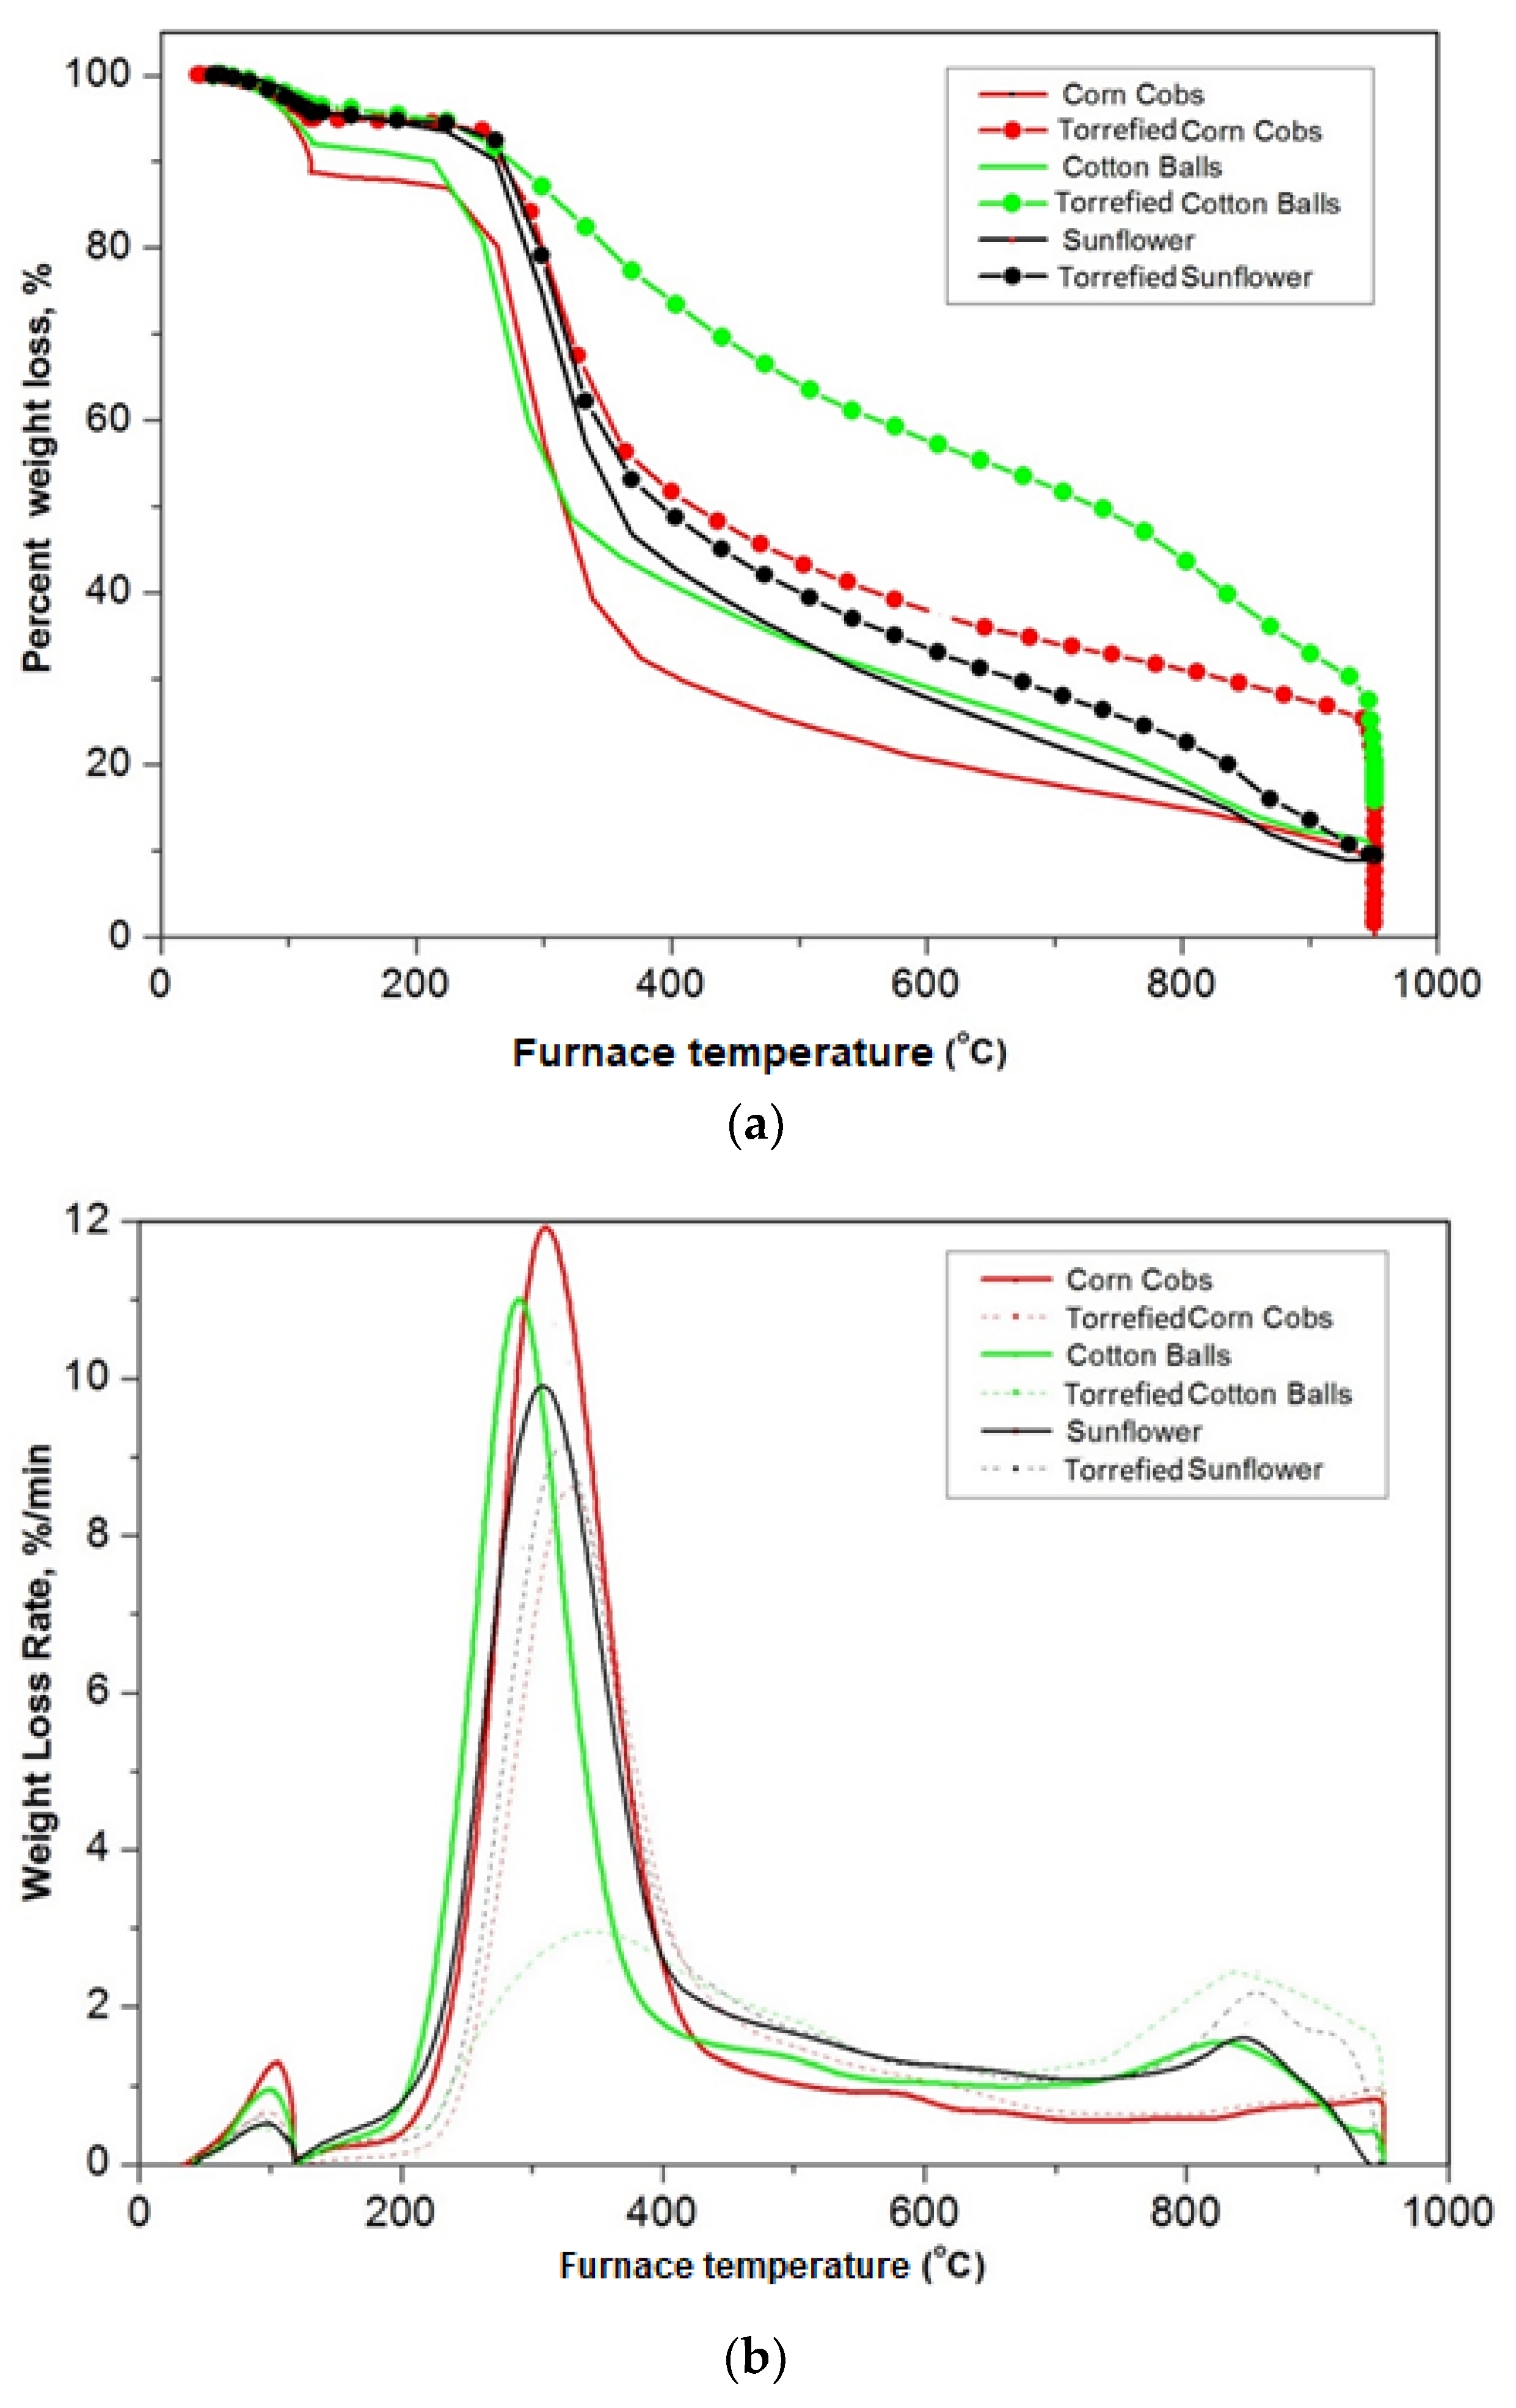
3.4. Thermogravimetric Analysis

Figure 7 shows the TGA analysis of corn cobs, cotton balls, and sunflower biomass samples. Figure 7a shows the percent weight loss vs. furnace temperature, while Figure 7b shows the weight loss rate vs. furnace temperature. For the corn cob sample (Figure 7a), three distinct mass loss regions were evident: the dehydration region (50 °C–110 °C), the devolatilization and fast combustion region (225 °C–444 °C), and a final slow combustion and low weight loss region (444 °C–950 °C). Devolatilization in the raw corn cob sample was initiated 30 °C earlier than in the torrefied sample. According to Figure 7b, the weight loss rate of the raw corn cob sample was higher than that of the torrefied sample. The maximum weight loss rate for the raw corn cob was found to be 11.87%/min at approximately 300 °C, while it was 9.85%/min for the torrefied sample at 330 °C. The average weight loss rate of the raw and torrefied corn cobs was found to be 0.010%/min and 0.006%/min, respectively.
The weight loss characteristics of cotton ball samples are shown in Figure 7a. A similar pattern was observed in the corn cob samples, with three regions identified: dehydration (50 °C–110 °C), fast combustion (225 °C–444 °C), and slow combustion (440 °C–900 °C). The maximum weight loss rate for raw cotton balls was found to be 11.05%/min at around 295 °C (Figure 7b). The torrefied cotton ball sample did not show a significant weight loss rate compared to the raw samples, and the weight loss peak was shifted to around 360 °C with a maximum weight loss rate of 2.9%/min. In general, devolatilization of hemicellulose and cellulose occurs below 400 °C, and lignin degradation occurs above 300 °C. Yang et al. [29] reported that hemicellulose decomposed between 220 °C and 300 °C, cellulose between 300 °C and 340 °C, and lignin between 340 °C and 900 °C. Our findings are consistent with the literature, as the bulk decomposition of torrefied samples occurred at relatively higher temperatures with a relatively lower weight loss rate due to the removal of volatiles in the torrefaction stage [30]. Torrefied samples have a lower quantity of hemicelluloses and are richer in lignin content than the raw samples. The presence of high lignin contents would cause low reactivity [31,32]. The combustion characteristics factor (CCF) was calculated and is reported in Table 2. The values of CCF are higher in the case of raw samples, which shows the low reactivity of the torrefied samples compared to that of the raw samples.
Figure 7 also shows the weight loss characteristics of raw and torrefied sunflower samples. In raw sunflower samples, bulk decomposition was found in the temperature range of 240 °C–350 °C, during which 44% of the total weight loss occurred. The weight loss curve followed a constant decomposing rate with a slope of −0.0648 during a temperature range of 360 °C–900 °C. Torrefied sunflower showed the same weight loss pattern as that of its parent sample. A bulk weight loss of 39% was observed during the temperature range of 255 °C–365 °C. A weight loss slope of −0.069 was observed for torrefied sunflower during the temperature range of 365 °C–920 °C. A total time of 1.8 h was required to complete combustion. The decomposition of torrefied sunflower was initiated at a relatively higher temperature than for raw sunflower. The bulk decomposition of torrefied sunflower was lower, which may be attributed to the removal of volatile matter during the torrefaction process [30]. Maximum weight loss rates of 9.9%/min and 9.20%/min were observed in the raw and torrefied sunflower samples, respectively. The average weight loss rate for raw sunflower was found to be 9.14%/min during a temperature range of 205 °C–425 °C, while the average weight loss rate for the torrefied sunflower was found to be 8.9%/min for the temperature range of 216 °C–402 °C. The torrefied sample had a lower quantity of hemicelluloses and was richer in lignin content than that of the raw sample. The presence of high lignin content would cause low reactivity [31,32].
Table 3 shows the values of the maximum weight loss rate, the average weight loss rate, and the combustion characterization factor (CCF). The CCF for the raw sample was higher than for the torrefied one. The mean reactivity of the raw and torrefied sunflower samples was found to be 1.07 and 0.686%/min/°C, respectively. The data in Table 3 illustrate that the relatively smaller values of CCF for torrefied samples mean that the torrefied samples show lower reactivity than do the raw samples, which is consistent with the literature.

4. Conclusions

In this study, three agricultural residues were investigated for thermal and chemical properties that could be used as an alternate solid fuel in the industrial sector. Torrefaction of corn cobs, cotton balls, and sunflower residue was carried out under mild torrefaction conditions. We investigated the effect of two operating parameters, i.e., temperature and residence time, on the mass yield, proximate contents, and combustion properties of the torrefied mass. According to this study, the optimum temperature condition, residence time, and GCV for torrefied corn cobs were found to be 290 °C, 20 min, and 5444 kcal/kg, respectively. According to the TGA results, maximum weight loss rates were found to be 11.87%/min at 300 °C and 9.85%/min at 330 °C for raw corn cob and torrefied corn cob samples, respectively. The optimum temperature condition, residence time, and GCV for torrefied cotton balls were found to be 270 °C, 30 min, and 4481 Kcal/kg, respectively. Maximum weight loss rates were found to be 11.05%/min and 2.9%/min for raw and torrefied cotton balls, respectively. In the case of sunflower samples, the mass yield of the torrefied sample decreased from 85% to 71% by increasing the residence time from 10 min to 60 min, respectively. Volatile matter contents showed an 18% decrease, while the fixed carbon contents showed a 10% increase in the torrefied sample. The weight loss rates of the raw and torrefied samples were found to be 9.9%/min and 9.20%/min at peak temperatures of 317 °C and 328 °C, respectively. In conclusion, by using the torrefaction technique, it seems possible and commercially viable to convert abundantly available domestic agriculture biomasses in Pakistan into solid fuels, which could be considered for use as an alternative fuel for existing coal-based boilers.

Author Contributions

Conceptualization, J.A. and R.K.B.; methodology, A.M.A. and R.K.B.; validation, A.M. and R.K.B.; formal analysis, A.M., M.S.J. and H.A.N.; investigation, M.I. and Z.N.; data curation, A.M.A., M.S.J. and H.A.N.; writing—original draft preparation, J.A.; writing—review and editing, M.I. and Z.N. All authors have read and agreed to the published version of the manuscript.

Funding

This research received no external funding.

Institutional Review Board Statement

Not applicable.

Informed Consent Statement

Not applicable.

Data Availability Statement

The data presented in this study are available on request from the corresponding author.

Acknowledgments

The authors would like to acknowledge the contributions of Naseer Sheikh, Sania Aslam, Saba Zaheer, and Hafiza Javeria for their support in characterizing the samples and improving the quality of this work.

Conflicts of Interest

The authors declare no conflict of interest.

References

  1. Cucchiella, F.; D’Adamo, I.; Gastaldi, M. An economic analysis of biogas-biomethane chain from animal residues in Italy. J. Clean. Prod. 2019, 230, 888–897. [Google Scholar] [CrossRef]
  2. Cheng, F.; Luo, H.; Colosi, L.M. Slow pyrolysis as a platform for negative emissions technology: An integration of machine learning models, life cycle assessment, and economic analysis. Energy Convers. Manag. 2020, 223, 113258. [Google Scholar] [CrossRef]
  3. Chen, W.-H.; Lin, B.–J.; Lin, Y.-Y.; Chu, Y.-S.; Ubando, A.; Show, P.; Ong, H.; Chang, J.-S.; Ho, S.-H.; Culaba, A.; et al. Progress in biomass torrefaction: Principles, applications and challenges. Prog. Energy Combust. Sci. 2021, 82, 100887. [Google Scholar] [CrossRef]
  4. Samadi, S.; Ghobadian, B.; Nosrati, M. Prediction and estimation of biomass energy from agricultural residues using air gasification technology in Iran. Renew. Energy 2020, 149, 1077–1091. [Google Scholar] [CrossRef]
  5. Abdelhady, S.; Shalaby, M.; Shaban, A. Techno-Economic Analysis for the Optimal Design of a National Network of Agro-Energy Biomass Power Plants in Egypt. Energies 2021, 14, 3063. [Google Scholar] [CrossRef]
  6. Chen, W.-H.; Lin, B.-J.; Colin, B.; Pétrissans, A.; Pétrissans, M. A study of hygroscopic property of biomass pretreated by torrefaction. Energy Procedia 2019, 158, 32–36. [Google Scholar] [CrossRef]
  7. Akhtar, J.; Yaseen, A.; Munir, S. Effect of rice husk co-combustion with coal on gaseous emissions and combustion efficiency. Energy Sources Part A Recover. Util. Environ. Eff. 2018, 40, 1010–1018. [Google Scholar] [CrossRef]
  8. Meng, J.; Park, J.; Tilotta, D.; Park, S. The effect of torrefaction on the chemistry of fast-pyrolysis bio-oil. Bioresour. Technol. 2012, 111, 439–446. [Google Scholar] [CrossRef] [PubMed]
  9. He, Q.; Ding, L.; Gong, Y.; Li, W.; Wei, J.; Yu, G. Effect of torrefaction on pinewood pyrolysis kinetics and thermal behavior using thermogravimetric analysis. Bioresour. Technol. 2019, 280, 104–111. [Google Scholar] [CrossRef] [PubMed]
  10. Kai, X.; Meng, Y.; Yang, T.; Li, B.; Xing, W. Effect of torrefaction on rice straw physicochemical characteristics and particulate matter emission behavior during combustion. Bioresour. Technol. 2019, 278, 1–8. [Google Scholar] [CrossRef]
  11. Sumaira, K.; Nawaz, C.; Shahid, M.; Hafiza, S. Effect of torrefaction conditions on the physicochemical characterization of agricultural wastes (sugar cane baggase). Waste Manag. 2019, 88, 280–290. [Google Scholar]
  12. Di, B. Product distribution from pyrolysis of wood and agricultural residues. Ind. Eng. Chem. Res. 1999, 38, 2216–2224. [Google Scholar]
  13. Irfan, M.; Gulsher, M.; Abbas, S.; Syed, Q.; Nadeem, M.; Baig, S. Effect of various pretreatment conditions on enzymatic saccharification. Songklanakarin J. Sci. Technol. 2011, 33, 397–404. [Google Scholar]
  14. Ranzi, E.; Cuoci, A.; Faravelli, T.; Frassoldati, A.; Migliavacca, G.; Pierucci, S.; Sommariva, S. Chemical Kinetics of Biomass Pyrolysis. Energy Fuels 2008, 22, 4292–4300. [Google Scholar] [CrossRef]
  15. Carrier, M.; Loppinet-Serani, A.; Denux, D.; Lasnier, J.-M.; Ham-Pichavant, F.; Cansell, F.; Aymonier, C. Thermogravimetric analysis as a new method to determine the lignocellulosic composition of biomass. Biomass Bioenergy 2011, 35, 298–307. [Google Scholar] [CrossRef]
  16. Munir, S.; Daood, S.S.; Nimmo, W.; Cunliffe, A.; Gibbs, B. Thermal analysis and devolatilization kinetics of cotton stalk, sugar cane bagasse and shea meal under nitrogen and air atmospheres. Bioresour. Technol. 2009, 100, 1413–1418. [Google Scholar] [CrossRef]
  17. Ghetti, P.; Ricca, L.; Angelini, L. Thermal analysis of biomass and corresponding pyrolysis products. Fuel 1996, 75, 565–573. [Google Scholar] [CrossRef]
  18. Ayoub, G.; Akhtar, J.; Rana, M.; Qasim, M.; Sheikh, N.; Munir, S. Investigation of forestry wastes: Torrefaction and their thermal properties for use in energy recovery schemes. Energy Sources Part A Recover. Util. Environ. Eff. 2017, 40, 1–8. [Google Scholar] [CrossRef]
  19. Welker, C.M.; Balasubramanian, V.K.; Petti, C.; Rai, K.M.; DeBolt, S.; Mendu, V. Engineering Plant Biomass Lignin Content and Composition for Biofuels and Bioproducts. Energies 2015, 8, 7654–7676. [Google Scholar] [CrossRef] [Green Version]
  20. Poudel, J.; Karki, S.; Oh, S.C. Valorization of Waste Wood as a Solid Fuel by Torrefaction. Energies 2018, 11, 1641. [Google Scholar] [CrossRef] [Green Version]
  21. Anukam, A.I.; Goso, B.P.; Okoh, O.O.; Mamphweli, S.N. Studies on Characterization of Corn Cob for Application in a Gasification Process for Energy Production. J. Chem. 2017, 2017, 1–9. [Google Scholar] [CrossRef] [Green Version]
  22. Ren, X.-Y.; Feng, X.-B.; Cao, J.-P.; Tang, W.; Wang, Z.-H.; Yang, Z.; Zhao, J.-P.; Zhang, L.-Y.; Wang, Y.-J.; Zhao, X.-Y. Catalytic Conversion of Coal and Biomass Volatiles: A Review. Energy Fuels 2020, 34, 10307–10363. [Google Scholar] [CrossRef]
  23. Cahyanti, M.; Doddapaneni, T.; Madissoo, M.; Pärn, L.; Virro, I.; Kikas, T. Torrefaction of Agricultural and Wood Waste: Comparative Analysis of Selected Fuel Characteristics. Energies 2021, 14, 2774. [Google Scholar] [CrossRef]
  24. Karlsson, H.; Ahlgren, S.; Sandgren, M.; Passoth, V.; Wallberg, O.; Hansson, P.-A. A systems analysis of biodiesel production from wheat straw using oleaginous yeast: Process design, mass and energy balances. Biotechnol. Biofuels 2016, 9, 1–13. [Google Scholar] [CrossRef] [Green Version]
  25. Olugbade, T.O.; Ojo, O.T. Biomass Torrefaction for the Production of High-Grade Solid Biofuels: A Review. BioEnergy Res. 2020, 13, 999–1015. [Google Scholar] [CrossRef]
  26. Ribeiro, J.M.C.; Godina, R.; Matias, J.C.d.O.; Nunes, L.J.R. Future Perspectives of Biomass Torrefaction: Review of the Current State-Of-The-Art and Research Development. Sustainability 2018, 10, 2323. [Google Scholar] [CrossRef] [Green Version]
  27. Sumaira, K.; Shahid, M.; Nawaz, C.; Hafiza, S. Physicochemical characterization of Thar coal and torrefied corn cob. Energy Exploration and Exploitation 2019, 37, 1286–1305. [Google Scholar] [CrossRef]
  28. Bajcar, M.; Zaguła, G.; Saletnik, B.; Tarapatskyy, M.; Puchalski, C. Relationship between Torrefaction Parameters and Physicochemical Properties of Torrefied Products Obtained from Selected Plant Biomass. Energies 2018, 11, 2919. [Google Scholar] [CrossRef] [Green Version]
  29. Yang, H.; Yan, R.; Chin, T.; Liang, D.T.; Chen, A.H.; Zheng, C. Thermogravimetric Analysis−Fourier Transform Infrared Analysis of Palm Oil Waste Pyrolysis. Energy Fuels 2004, 18, 1814–1821. [Google Scholar] [CrossRef]
  30. Dacres, O.D.; Tong, S.; Li, X.; Zhu, X.; Edreis, E.M.; Liu, H.; Luo, G.; Worasuwannarak, N.; Kerdsuwan, S.; Fungtammasan, B.; et al. Pyrolysis kinetics of biomasses pretreated by gas-pressurized torrefaction. Energy Convers. Manag. 2019, 182, 117–125. [Google Scholar] [CrossRef]
  31. Munir, S.; Sattar, H.; Nadeem, A.; Azam, M. Thermal and kinetic performance analysis of corncobs, Falsa sticks, and Chamalang coal under oxidizing and inert atmospheres. Energy Sources Part A Recover. Util. Environ. Eff. 2017, 39, 1–8. [Google Scholar] [CrossRef]
  32. Talero, G.; Rincón, S.; Gómez, A. Torrefaction of oil palm residual biomass: Thermogravimetric characterization. Fuel 2019, 242, 496–506. [Google Scholar] [CrossRef]
Figure 1. Effect of temperature on the proximate contents and GCV of raw corn cobs at a 10 min residence time and a N2 flow rate of 2.5 mL/min.
Energies 14 04218 g001
Figure 2. Effect of temperature on the proximate contents and GCV of torrefied cotton balls at a 10 min residence time and a N2 flow rate of 2.5 mL/min.
Energies 14 04218 g002
Figure 3. Effect of temperature on the proximate contents and GCV values at a 10 min residence time and a N2 flow rate of 2.5 mL/min.
Energies 14 04218 g003
Figure 4. Effect of residence times on the proximate contents and GCV of raw corn cobs.
Energies 14 04218 g004
Figure 5. Effect of residence times on the proximate contents and GCV of torrefied cotton balls.
Energies 14 04218 g005
Figure 6. Effect of residence times on the proximate contents and GCV values at an operating temperature of 260 °C for sunflower samples.
Energies 14 04218 g006
Figure 7. (a) TGA percent weight loss vs. temperature. (b) TGA weight loss rate vs. temperature.
Energies 14 04218 g007
Table 1. Results of the proximate analysis and the GCV of corn cobs, cotton balls, and sunflower samples.
SampleMoisture
%
Volatile Matter (VM)
%
Fixed Carbon (FC)
%
Ash
%
Sulfur
%
GCV
(Kcal/kg)
Maize Stalks (Corn Cobs)6.9884.120.40.513600
Cotton Stalks (Cotton Balls)6.2375.245.4913.030.443696
Sunflower Stalks5.8736.19.340.373435
Table 2. Comparison of the extractives, hemicellulose, cellulose, and lignin contents of corn cobs, cotton balls, and sunflower biomass samples.
State of SampleType of BiomassExtractives
(%)
Hemicellulose
(%)
Cellulose
(%)
Lignin
(%)
RawCorn Cobs7273822
Cotton Balls7.429.8332.5924
Sunflower12.3331.9733.3117.64
TorrefiedCorn Cobs5183536
Cotton Balls5.624.2229.4434.2
Sunflower9.5529.353124.73
Table 3. Combustion properties of raw and torrefied samples of corn cobs, cotton balls, and sunflower.
Sample TypeSample NameTemperature Range
(°C)
Peak Temperature
(°C)
Maximum Weight Loss Rate
(%/min)
Average Weight Loss Rate
(%/min)
CCF
OriginalCorn Cob225–41130013.675.114.59942 × 10−6
Cotton213–42728813.324.654.7403 × 10−6
Sunflower205–42531710.699.145.68835 × 10−11
TorrefiedCorn Cob252–4363269.853.821.81753 × 10−6
Cotton213–5653593.121.93.63961 × 10−7
Sunflower216–43432810.28.99.7401 × 10−12
Publisher’s Note: MDPI stays neutral with regard to jurisdictional claims in published maps and institutional affiliations.

