Article

Biomethane Potential of Selected Organic Waste and Sewage Sludge at Different Temperature Regimes

Faculty of Environmental Engineering and Infrastructure, Czestochowa University of Technology, Dabrowskiego 73, 42-201 Czestochowa, Poland
*
Author to whom correspondence should be addressed.
Energies 2021, 14(14), 4217; https://doi.org/10.3390/en14144217
Submission received: 17 May 2021 / Revised: 9 July 2021 / Accepted: 10 July 2021 / Published: 13 July 2021
(This article belongs to the Special Issue Energy and Matter Recovery from Organic Waste Processing and Reuse)

Abstract

:
Sewage sludge (SS) generation and its management still pose a problem in many countries. Anaerobic co-digestion (AcD) of SS with grease trap sludge (GTS) and organic fraction of municipal sewage waste (OFMSW), which are two easily biodegradable substrates, may improve biogas production and AcD kinetics. Algae biomass (AB) of the species Undaria pinnatifida can be the third co-digestion component that may also affect the AcD performance. The aim of the study was therefore to evaluate the performance of mesophilic and thermophilic SS batch AcD with OFMSW, GTS as well as AB through biochemical methane potential (BMP) assay in relation to cumulative specific biogas (YB) and methane yields (Ym). Three kinetic models were applied within the scope of the kinetic study. Results of the study showed that the mixture containing SS, GTS and AB brought the most noticeable improvements in Ym compared to other studied mixtures and in respect to standalone SS digestion, the improvement amounted to 88.37% at mesophilic temperature (260.83 ± 15.02 N mL CH4/g-VSadd and for standalone SS 138.47 ± 4.70 N mL CH4/g-VSadd) and 71.09%, respectively, at the thermophilic one (275.66 ± 4.11 N mL-CH4/g-VSadd and for SS standalone 161.13 ± 13.11 N mL-CH4/g-VSadd).

1. Introduction

With an increase in the global population, the energy demand has induced thorough search for alternative energy sources, in particular, renewable sources. Biomass, one of the examples of such a renewable energy source, has been under constant examination for quite some time due to its positive effect on the environment, and it is utilized as a substitute to “inexhaustible” fossil fuels, i.e., reduction of greenhouse gas emissions—primal contributors to global warming. The dependency of mankind on fossil fuels is deemed to be the major contributor to that global environmental problem [1,2].
Biomass is a sustainable renewable energy source that is characterised by its availability and safety in the application, and one of the examples of such an application is anaerobic digestion (AD) [3,4]. AD, a process that is technologically simple and has low energy requirements, is conducted by anaerobic bacteria during multiple stages: hydrolysis, acidogenesis, acetogenesis and methanogenesis [1]. The final stage yields digested residuals as well as biogas—a valuable energy product. The biogas is rich in energy and is a mixture of principally methane (CH4), carbon dioxide (CO2) as well as traces of other gases in small amounts such as hydrogen sulphide (H2S) and carbon monoxide (CO) [5]. The other equally valuable product of AD is digested residuals that can be applied, in some cases, as a soil fertilizer owing to their high nutrient content [3]. The transformation of biomass into biogas is considered to be the most environmentally and energy beneficial process that is highly exploited nowadays. Furthermore, the addition of various substrates to feedstock can significantly increase the resultant biogas potential [3]. The typical feedstock includes such wastes as farm slurries, municipal organic waste, sewage sludge (SS), etc. The management of SS is a veritable “heel of Achilles” in some developed and still developing countries; hence, its utilisation is crucial, and so, AD can be a suitable choice to address both issues: energy demand and waste management [4,5]. Anaerobic co-digestion (AcD) is an optional and popular practice nowadays that can improve the methane yield from sewage sludge and its overall biodegradability due to enhancements in physicochemical characteristics (e.g., optimisation of the content of micro and macronutrients such as ammonium nitrogen, potassium, calcium, magnesium and others) that can appear upon mixing of various mediums [4,6]. Such a method of digestion mostly involves digestion of feedstock with one substrate and there are, however, few studies related to the co-digestion of two types of substrates in addition to the feedstock, so this study may provide the data related to that practice [7,8,9,10]. There is a variety of representatives of biomass that can be co-digested with SS, for example, AB, carcasses, animal and human excrements, plant residuals, dedicated energy crops, food waste, etc. [11]. The former one is an interesting substrate that can be potentially applied to co-digestion. Many species of algae exist, and not all of them are well studied. AB and macroalgae, in particular, have been deemed as an auspicious variant for biogas production owing to their high availability (especially, in eutrophic bodies of water such as lakes, rivers, etc.) and low lignin as well as cellulose content [12]. However, their addition into co-digestion mixtures is not always increased biodegradability, which may be linked with the presence of complex polysaccharides such as alginates [13]. The other promising substrate for co-digestion is GTS, which is still relatively unstudied, especially at thermophilic temperature. GTS consists of mostly fats, oils and solid organic particles. It is essentially a fat part of wastewater that was separated in a mechanical way. Standalone GTS digestion is not practical, due to the fact that there is an accumulation of substances that can inhibit digestion [14]. However, its co-digestion was reported to be feasible [6]. In turn, OFMSW co-digestion may bring improvements in carbon to nitrogen ratio (C/N ratio) as well as micro and macronutrients optimisation [15]. However, the data related to its co-digestion at thermophilic temperate is lacking. Moreover, there exist few publications in which a three-substrate co-digestion is studied, especially applying AB as the third co-substrate. For instance, Grosser et al. [16] obtained an improved methane yield up to 82% for co-digestion of sewage sludge, organic fraction of municipal solid waste and grease trap sludge. In turn, Ahmed et al. [17] recorded a 179% increase in biogas production for a mixture containing sewage sludge, microalgae and sawdust, while Solé-Bundó et al. [18] observed a significant increase in methane yield during the co-digestion process. The mentioned Authors noted that the addition of fat, oil and grease (from WWTP) to the co-digestion mixture of primary sludge and microalgae led to an increase in methane production up to 42%. The digestate after co-digestion of these mentioned substrates (SS, OFMSW and GTS) may be found applicable as soil fertilizer provided that they are properly sterilized to remove pathogens, however, they may still contain a variety of heavy metals and organic pollutants. For these reasons, some European countries such as, e.g., Austria, Switzerland and Netherlands decided to ban the application of SS and any SS containing products for agriculture [19]. As far as digestate with the addition of SS and the agricultural applications of its products in Poland are concerned, they can be used as fertilizers provided that all requirements concerning the digestate quality are fulfilled [20,21]. However, an additional study should be conducted to address SS/GTS/AB and SS/OFMSW/AB digestate applicability for agriculture.
Thus, the objective of the study was to conduct batch AcD of SS with substrates such as OFMSW, GTS and AB at mesophilic and thermophilic temperatures, evaluate the efficiency of prepared mixtures through BMP assay, study the effect that a particular mixture has in relation to physicochemical characteristics as well as the effect on parameters related to kinetic study, i.e., potential methane yield (Pm), maximum rate of methane yield (Rm) and specific biogas (YB) and methane (Ym) yields. The scope of the study includes the statistical evaluation of obtained results.

2. Materials and Methods

2.1. Materials

SS feedstock of two types, i.e., mixture of primary and excess (waste activated sludge) as well as digested sludge, i.e., inoculum (IN), were collected from an anaerobic digester located at WWTP in the Silesian region, Częstochowa, Poland. The WWTP treats 90,000 m3/d (16 mln m3 per annual) of wastewater and serves an equivalent population of 314,835. SS and IN for the mesophilic part were obtained in December 2019, whereas that for the thermophilic one was obtained in 2020. The following substrates for SS co-digestion were used (Figure S1), and their organic composition is presented in Table 1:
AB, “Wakame”, which is an edible seaweed referring to the superphylum Heterokonta, that includes a genus Undaria, in particular, the species U. pinnatifida [22]. It is referred to as the macroalgae group. The reasons that encouraged the authors to apply this substrate for AcD are: availability of algae, in 2018, it became listed in the top 100 worst globally invasive species of the world; for this reason, it can be found applicable not only in the food industry, but it can also serve as a source of renewable energy [22,23]. The project, entitled “Integrated technology for improved energy balance and reduced greenhouse gas emissions at municipal wastewater treatment plants (BARITECH)”, inspired the authors to evaluate the applicability of AB as a substrate to be applied for AcD.
  • OFMSW, which was prepared in accordance with the recipe mentioned by [24] owing to the difficulty in its actual obtainment [6]. The content of volatile solids (VS) for this type of a substrate was determined as 19.70%. The C/N ratio is 29.3 ± 0.7.
  • GTS, which was obtained from the grease traps that are installed at the facility of a meat processing plant in the Silesian region of Poland. The content of VS. for this type of substrate was determined as 57.80%. The C/N ratio was 12.8.

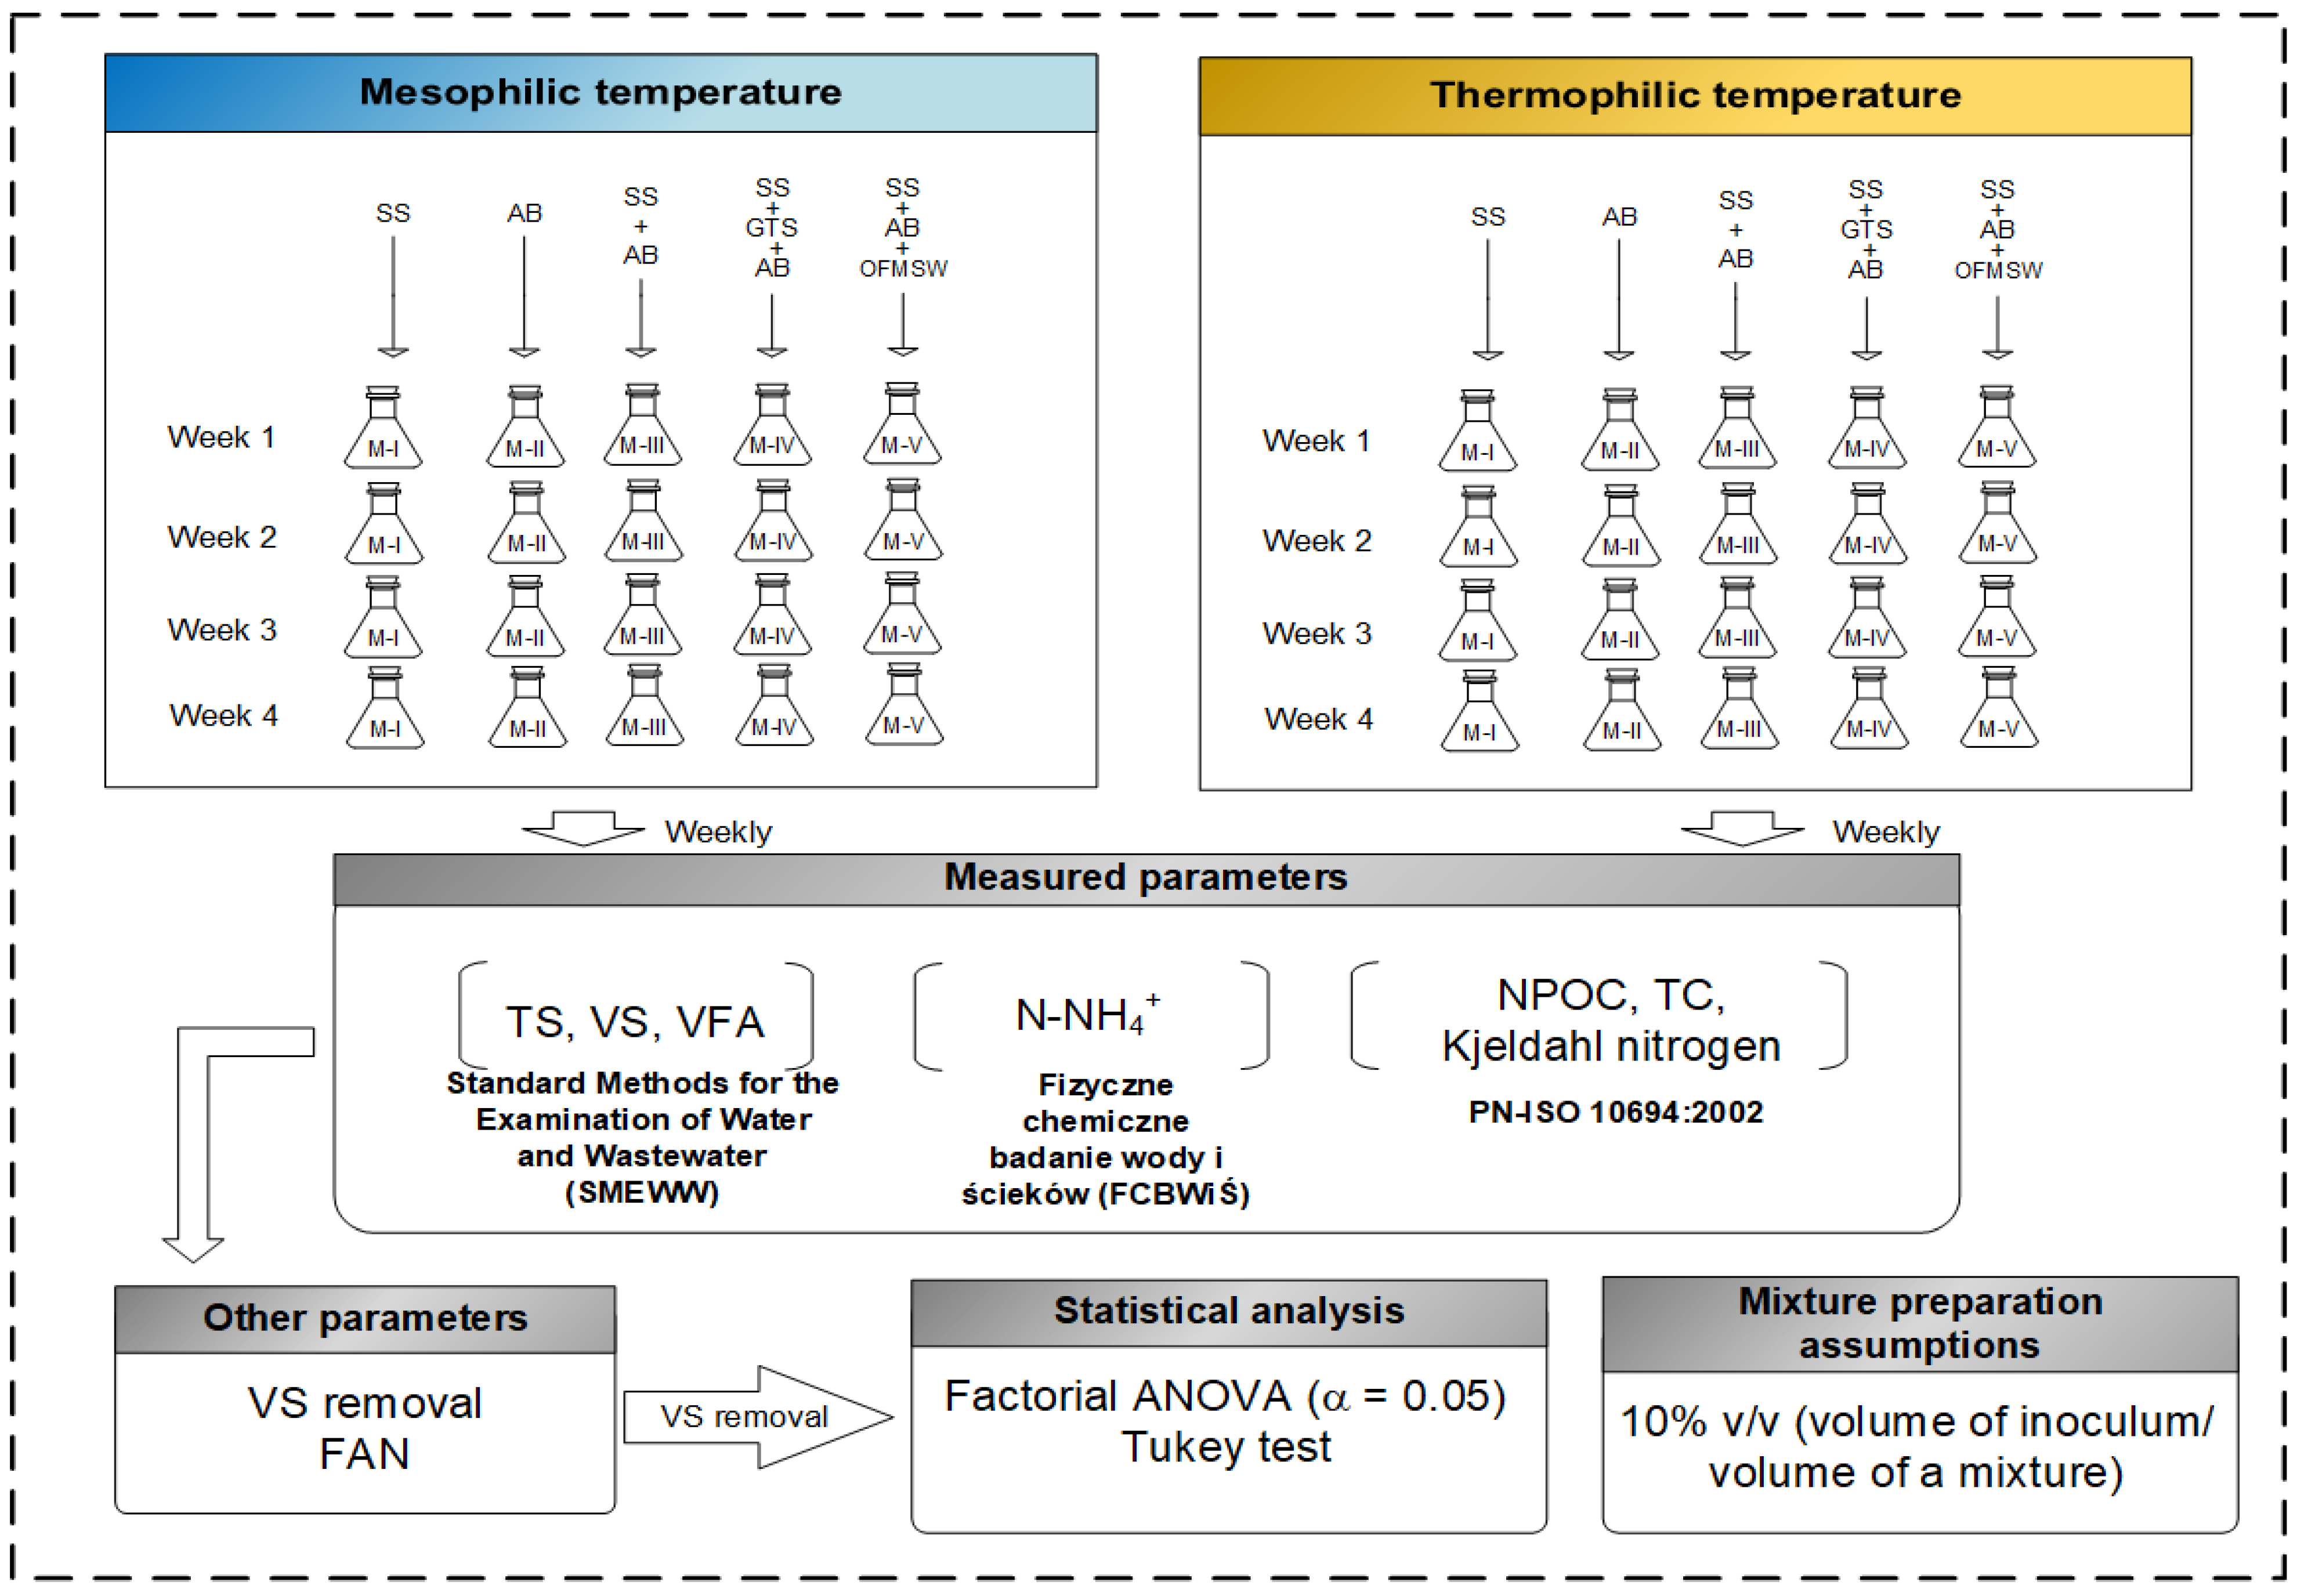
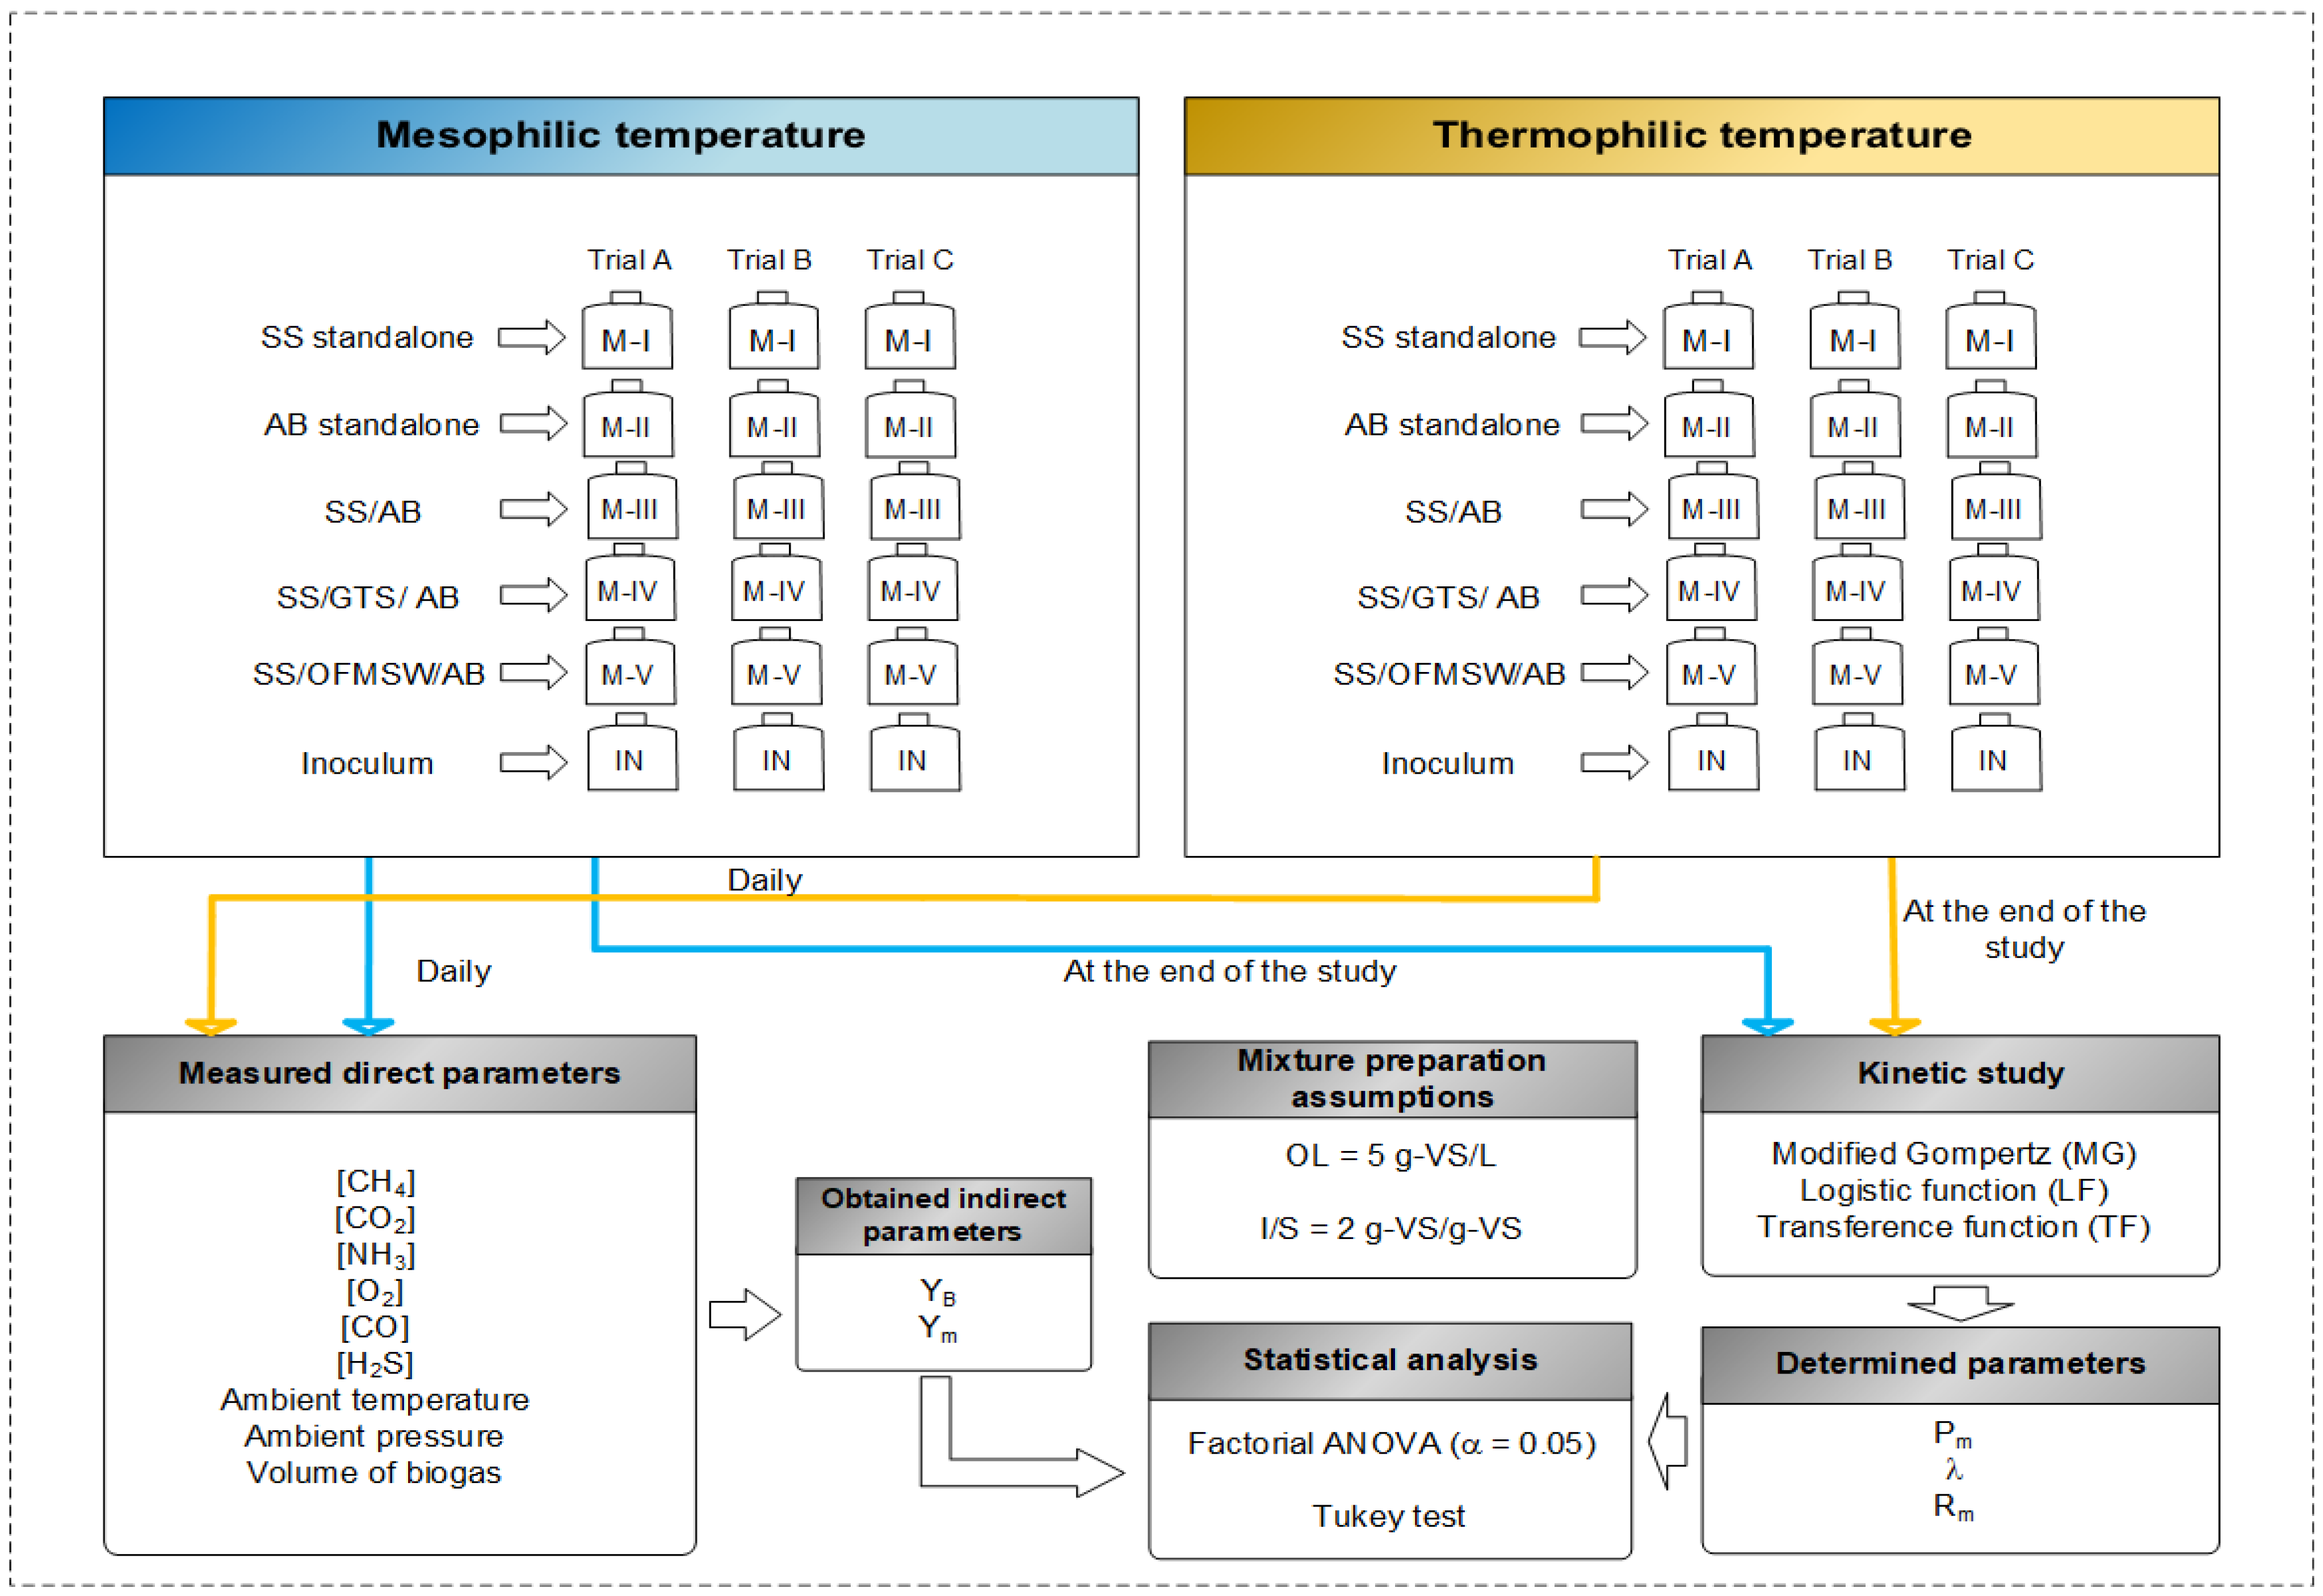
2.2. Experimental Procedure

The study was divided into two parts, i.e., BMP assay and physicochemical analysis which were further subdivided according to the temperature regime (the study was conducted at mesophilic and thermophilic temperatures). Both BMP assay and physicochemical analyses were conducted in parallel and in a batch mode, which means that the mixtures were put into fermentation bottles and closed until the end of the digestion process. The duration of both BMP assay and physicochemical analyses digestions were 30 days. The next subsections discuss each of these parts separately.

2.2.1. BMP Assay

As is presented on the Table 2 and Figure 1, five mixtures were prepared based on the VS. content of each substrate used, namely, M-I was standalone SS; M-II was standalone AB; M-III was a mixture of SS and AB; M-IV was a mixture containing SS, GTS and AB and lastly, M-V that contained SS, OFMSW and AB. The biogas was measured using a liquid displacement system (LDS). Biogas measurements were done daily during the first week of digestion and gradually decreasing the frequency of taking the biogas measurements in later weeks until the actual cessation.
Blank control sample digestion (standalone inoculum) was also done (Figure 1). Prior to the actual mesophilic digestion, the inoculum was put into an incubation chamber for 5 days in order to decrease the residual amount of VS. The operational temperature in the incubator was 37 °C. The C/N of the inoculum at this temperature was 8.85, as is presented in Table 1. In terms of the thermophilic digestion part, the inoculum was first put into a reactor, whose temperature was increased daily for 1 °C up to the moment of reaching the thermophilic temperature conditions in the reactor (51.5 °C). It was done to allow microorganisms to acclimatise to the thermophilic temperature conditions. The C/N ratio of the inoculum at this temperature was 8.65. The YB and Ym results of the inoculum itself were excluded from the contribution to the results of mixtures.
Table 2 shows the percentage composition of each mixture based on the VS. content of each substrate, with the reference to which the mixtures were prepared. The Table 2 also provides information regarding their organic characteristics at the start, i.e., TS, VS, VS/TS and C/N ratios. The addition of OFMSW and GTS for co-digestion mixtures preparation was determined based on previous research [9,16,25]. The digestion was conducted in wet conditions, and the TS content of the final prepared mixtures (when inoculum was added) was within the range 3.22–5.54%. As reported, there is wet digestion when the TS of final mixtures is lower than 10%, whereas higher values correspond to the semi-dry (TS = 10–15%) and dry (when TS is about 20% and higher) digestions [26,27].
For the purposes of the BMP test, the basic anaerobic medium was prepared in accordance with the reference [28], and further introduced into each bottle. The organic loading (OL) for both parts of digestion was 5 g-VS/L and an inoculum to substrate ratio (I/S) was 2 g-VSinoculum/g-VSsubstrate.
Before the bottles with mixtures intended for the BMP test were sealed, the remaining oxygen that was present in headspaces was purged by means of N2 gas for 30 s. The pH of each mixture was corrected up to 7 ± 0.1 before each digestion.
For the purpose of the digestions, incubators were used whose temperatures were adjusted correspondingly for each part of the experiment. For the mesophilic digestion, the temperature was set to be 37 °C, whereas for the thermophilic digestion 51.5 °C.
The percentage of each gas component produced during the digestion and other technical gas parameters was determined with help of a portable gas analyser that had pressure as well as temperature sensors. The arrangement of bottles with mixtures in incubators is shown in Figure S2.
All the necessary biogas and methane calculations were done at standard temperature and pressure (STP), i.e., T = 273.15 K, P = 101,325 Pa, and the results of YB and Ym are presented in N mL/g-VSadd and N mL-CH4/g-VSadd units, respectively.

2.2.2. Physicochemical Analysis of Mixtures

As Figure 2 shows, the physicochemical analyses included pH, alkalinity, volatile fatty acids (VFA), ammonium nitrogen (N-NH4+), non-purgeable organic carbon (NPOC), TS, VS. and total carbon (TC). All the parameters were analysed each digestion week.
For this part, the addition of inoculum was done in accordance with 10% v/v ratio (volume of inoculum added to the volume of a studied mixture), and the procedure of its adaptation was the same as in the case of BMP, i.e., for the mesophilic part, the incubator was first applied and for the thermophilic part, the inoculum was put to the reactor before the actual digestion. The parameters such as TS and VS. were required to be measured during the process because of the necessity to know the organic composition of the studied mixtures as well as VS. removal. pH and VFA are good indicators of process stability, and they may indicate how fast the biodegradation is. Generally, the lower the pH, the higher the VFA concentration, but relying solely on pH parameter may not always show whether a process inhibition is present due to high alkalinity. Along with VFA accumulation, N-NH4+ increase can also lead to process instability, so measurement of this parameter was crucial. N-NH4+ is one of the two forms of reduced inorganic nitrogen, the other form is free ammonia nitrogen (FAN), which both change with pH and temperature and exist in equilibrium [29,30]. Both of these forms are inhibitory in AD systems; however, as was pointed out in the literature, there is no universal threshold that indicates the presence of inhibition [31,32]. Therefore, based on the results of measured pH and N-NH4+, the concentration of free ammonia nitrogen (FAN) was also calculated, as proposed by Yun et al. [33] as well as Di Capua et al. [34] using the following equations:
FAN = TAN 1 + 10 ( pK a pH )
pK a = 0.09018   × 2729.92 T + 272.15
where pKa is the dissociation constant for ammonium ions, T is the temperature in degrees Celsius, TAN—total ammonium nitrogen (FAN + NH4+).
N-NH4+ and VFA measurements were performed with help of “BÜCHI distillation unit K355”. N-NH4+ was analysed in accordance with the procedure mentioned in the literature [35]. All the parameters, except NPOC, TC, and N-NH4+ were measured in accordance with [36].
NPOC in liquid samples was measured using “Multi N/C 2100 HT1300 Analitykjena”, and TC was measured in solid samples with “Multi N/C 3100 Analytikjena” in accordance with the norm PN-ISO 10694:2002. Table S1 represents the summarizing information regarding each analysed parameter.

2.3. Kinetic Study and Statistical Analysis

Three mathematical kinetic models were applied to study the effect of operational temperatures in relation to the Pm, λ and Rm parameters [9]: modified Gompertz model (MG), transference function (TF) as well as logistic function (LF). The equation for MG is given as
Ym = Pm × exp{–exp[((Rm × e)/Pm) × (λ − t) + 1]}
where Ym is cumulative specific methane yield in N mL CH4/g-VSadd; Pm is potential specific methane yield in N mL-CH4/g-VSadd; Rm is the maximum rate of specific methane yield and expressed in N mL-CH4 ∗ g-VSadd−1 ∗ d−1; t represents a time of measurement and is expressed in days; e is base of the natural logarithm; represents lag phase time that is expressed in days.
The equation that represents LF is given as
Ym = Pm/{1 + exp[((4 × Rm × (λ − t))/Pm) + 2]}
The equation that represents TF is given below:
Ym = Pm × {1−exp[−((Rm × (λ − t))/Pm)]}
The mentioned kinetic parameters were determined by means of non-linear estimation in the “StatSoft STATISTICA 10” software. Moreover, the software calculated the coefficient of determination R2, and it serves as an indicator of reliability and accuracy of an applied kinetic model with respect to the actual measurement results. The effect of individual factors such as temperature, mixture and time, regarding parameters such as YB and Ym as well as other important ones such as VS. removal and variation of methane in biogas was studied with help of One-Way and factorial ANOVA analyses using the same software. The significance level (α) was 0.05 with a confidence limit of 0.95. The Tukey honestly significant difference (HSD) test was also performed with homogenous groups (post hoc).

3. Results and Discussion

3.1. Physicochemical Analysis
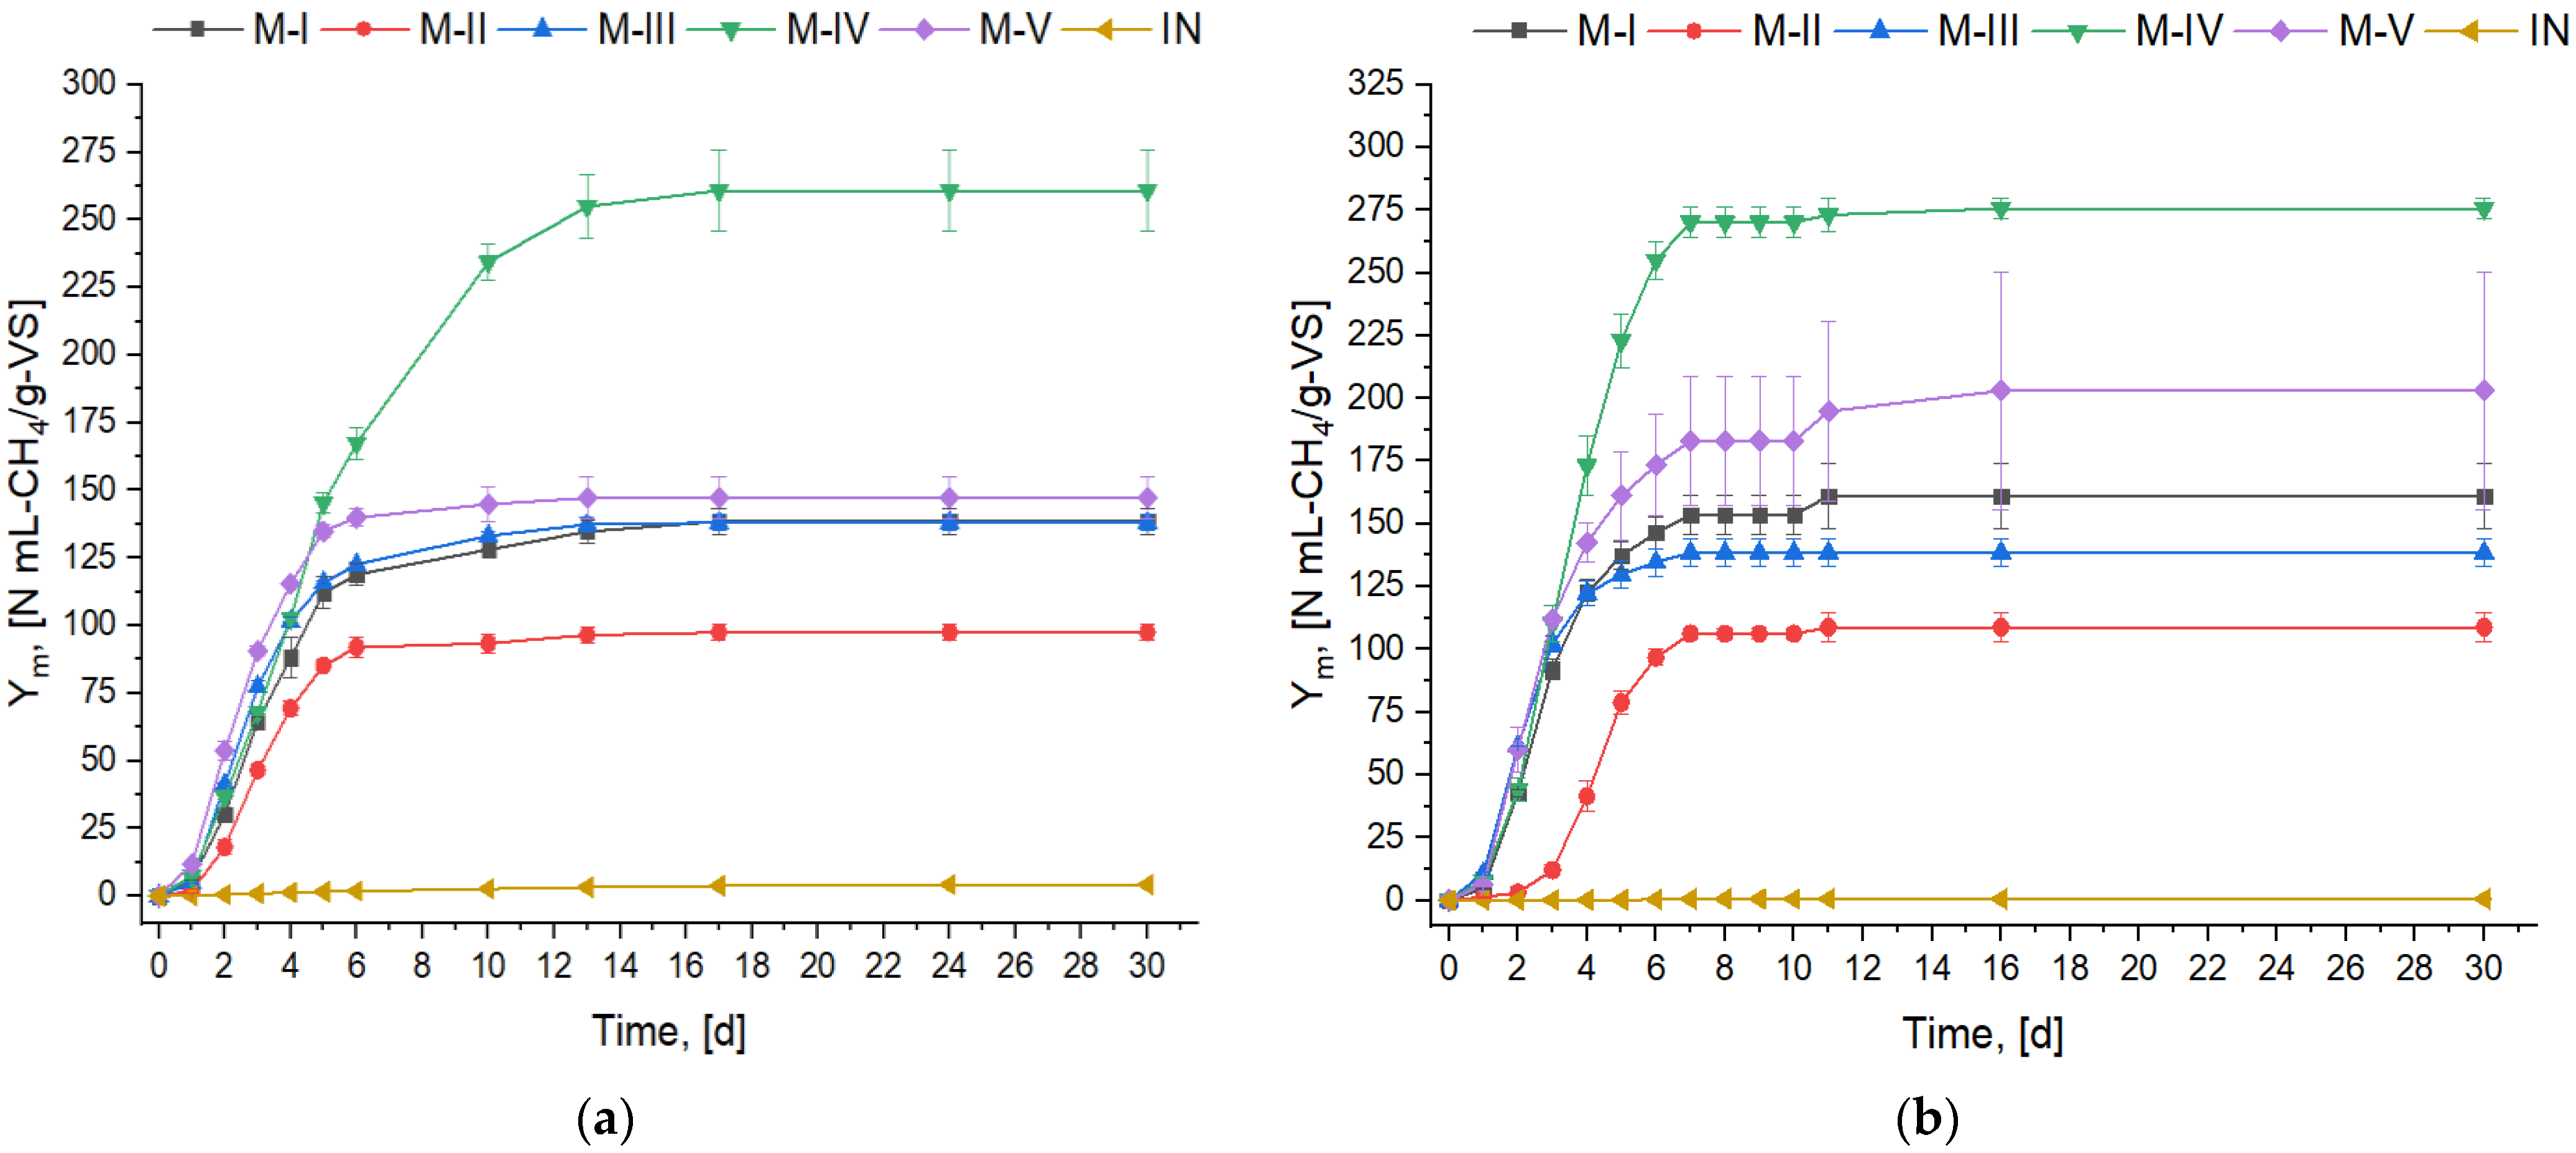
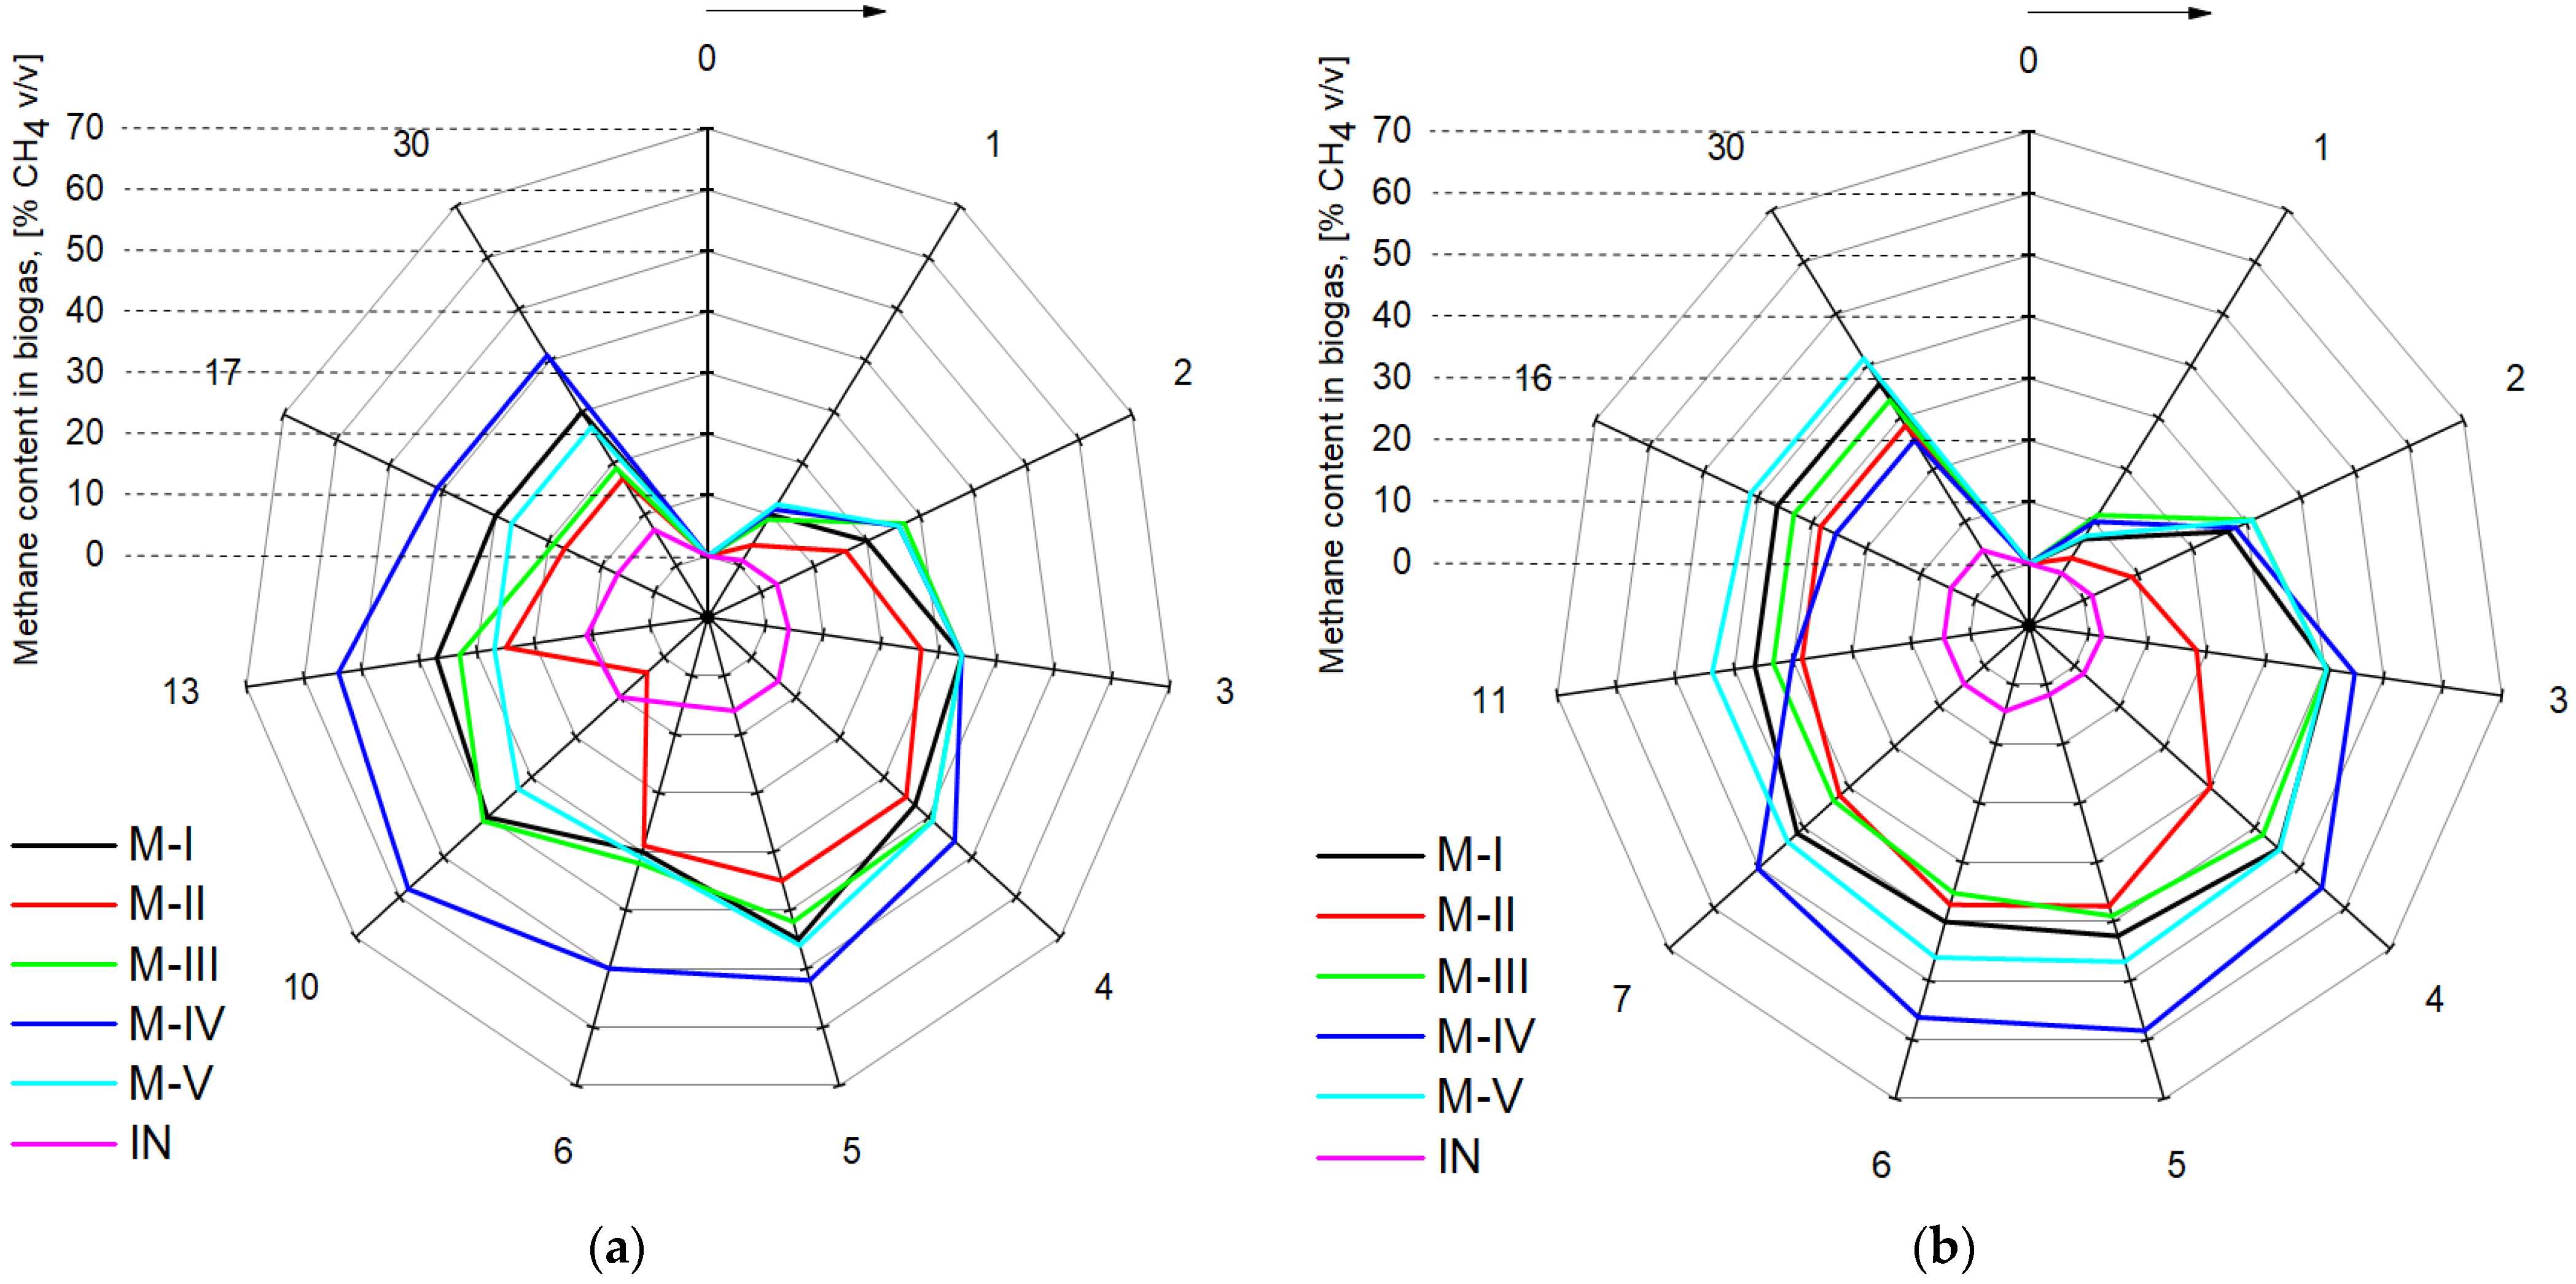
Five types of batch co-digestion mixtures were evaluated during a period of four weeks at mesophilic and thermophilic operational temperatures. The three most important parameters were measured, i.e., pH, N-NH4+ and FAN. These parameters, as reported by many researchers, serve as indicators of the process stability [30,37,38]. The selection was also based on the fact that one of the challenges in the anaerobic stabilization of algae is the possibility of inhibition process by releasing ammonia (the above-mentioned indicators are correlated) [39]. All other studied parameters appertaining to the physicochemical characteristics, besides these three mentioned, are listed in Table S2.
The pH of start-up mixtures at mesophilic temperature (before pH correction was performed) was 5.5 ± 0.01, 7.1 ± 0.00, 5.6 ± 0.00, 5.3 ± 0.00 and 6 ± 0.01 for mixtures M-I, M-II, M-III, M-IV and M-V, respectively, whereas at thermophilic temperature pH was 6.3 ± 0.01, 7.5 ± 0.01, 6.3 ± 0.01, 5.8 ± 0.01 and 6 ± 0.01, respectively. Described the slight difference in pH between the thermophilic and mesophilic regimes might be linked with the characteristics of the sewage sludge (samples were collected at 4-week intervals; see Table S2 mixture I). As shown in Table S2, in the case of a mixture, I, III and IV, despite slight fluctuations, the pH gradually increased along the duration of the process. In 4 weeks, the pH was above the recommended range, which has been reported in the literature for anaerobic digestion (e.g., 6.7–7.5 [40]). The opposite trend was noted for the mixture of MII (AD of algae alone) and mixture V (SS + A + OFMSW).
As it should be expected, the concentration of both N-NH4+ and, especially, FAN, at the first week of the thermophilic digestion, increased as Figures S3 and S4 show. In terms of N-NH4+, it was higher for approximately 21.6–50.3% for mixtures M-I, M-II, M-III and M-IV (736.40 ± 16.8, 362.60 ± 12.42, 725.90 ± 10.06 and 946.40 ± 18 mg/L, respectively) in comparison to the values that were obtained at mesophilic temperature (490 ± 23.54, 298.20 ± 73.35, 505.40 ± 54.17 and 757.87 ± 59.35 mg/L, respectively for the mentioned mixtures), and this is one of the reasons why thermophilic operational temperature can be unstable [41]. However, for the M-V, the concentration of N-NH4+ decreased by 31.7% at the end of the first thermophilic digestion week (358.40 ± 15.84 mg/L, whereas for mesophilic temperature the value was 525 ± 7.05 mg/L). The highest N-NH4+ concentration was observed for the M-IV at the end of the fourth digestion week (1038.8 ± 10.72 mg/L at mesophilic temperature and 1262.8 ± 48.71 mg/L at thermophilic one). The lowest N-NH4+ concentration during the mesophilic digestion period was achieved by the M-II at the third week (209.07 ± 91.05 mg/L). As far as FAN is concerned, it dramatically increased for all mixtures at thermophilic temperature, i.e., the start-up concentration was within the range 0.54–10.96 mg/L, and the highest start-up FAN concentration was for M-II; however, it decreased up to 1.28 mg/L at the fourth digestion week. Three mixtures, i.e., M-I, M-III and M-IV (especially M-III), had a substantial increase in FAN concentration at the end of the thermophilic digestion part, and their concentrations were 113.99, 238.50 and 115.04 mg/L, respectively. This agrees with the results obtained by Olsson et al. [42] who concluded that thermophilic conditions are more preferable for releasing ammonium and converting it into ammonia. FAN concentration within the range of 80–204 mg/L is inhibitory for methanogens, whereas N-NH4+ is inhibitory when the concentration is higher than 3–3.3 g-NH4-N/L [33]. However, in other literature source, the range of inhibitory FAN concentration was reported as 220–690 mg/L (in this range 50% methane production decrease was observed) [30]. The other important parameter is VS. removal, and it indicates the microbial activity during the anaerobic digestion process and, ultimately, the degree of stabilization. The VS. removal is attributed to microbial degradation of organic solids that are present in substrates and, as indicated, operational temperature affects this parameter [43]. As Figure 3 represents, at the end of the mesophilic digestion VS. reduced the most for M-V (39.96%) then followed by M-IV (36.27%). However, VS. reduction for these mixtures was much lower at thermophilic temperature i.e., 18.31% and 21.24%, respectively, and instead, the highest VS. removal was observed for M-III amounting to 45.93%. It may indicate that M-IV and M-V were much more stable (in terms of biodegradability) at mesophilic temperature rather than the thermophilic one, and therefore, their VS. reduced better. It may be also inferred that VS. removal was much slower at thermophilic temperature (this can also be seen from the steepness of the graph), and at the first digestion week, the values were within the range 6.18–12.04%, whereas at mesophilic temperature, the values were 2–3 times higher (within the range 15.87–34.56%).

3.2. BMP Assay

The highest YB at two studied operational temperatures was achieved by M-IV, which contained SS, GTS as well as AB, i.e., 641.34 ± 33.88 N mL/g-VSadd at mesophilic temperature and 673.36 ± 8.96 N mL/g-VSadd at the thermophilic one, respectively, as Figure 4 shows. These values were much higher than those obtained in the literature, i.e., the range is 310–450 mL/g-VSadd, in the case of SS/GTS co-digestion [6]. Moreover, the values at both temperatures were within the range 441–728 mL/g-VSadd (depending on the SS/GTS ratio) as was obtained in the study from the literature [44].
In regards to Ym, as the Figure 5 shows, M-IV obtained the highest results as well (260.83 ± 15.02 N mL CH4/g-VSadd and 275.66 ± 4.11 N mL-CH4/g-VSadd at mesophilic and thermophilic temperature, respectively). It should have been predicted at the start because M-IV contained easily biodegradable VS. that was provided by GTS, and it also had the highest TS and VS. contents (Table 2) at the beginning of both digestions in comparison to other mixtures, which amounted to TS = 5.54%, VS. = 4.51% at mesophilic temperature, and TS = 4.99%, VS. = 3.99% at thermophilic one. It is reported by some researchers that GTS is much more biodegradable than SS alone and that it contributes greatly to biogas and methane productions because of its high fat content [45]. YB values for that mixture were therefore 35% higher in comparison to the standalone SS digestions (M-I) at both temperatures (M-I had YB = 474.61 N mL/g-VSadd at mesophilic temperature and 497.23 N mL/g-VSadd at thermophilic one). Ym value for M-IV obtained at thermophilic temperature (275.66 ± 4.11 N mL-CH4/g-VSadd) was within the range that is mentioned in literature for SS/GTS mixtures, i.e., 273–788 mL-CH4/g-VSadd; however, the value obtained at mesophilic temperature was also close (260.83 ± 15.02 N mL-CH4/g-VSadd) [9,44,45]. It may seem that AB addition did not influence the results in terms of Ym parameter because the obtained value was within the range or lower than the typical reported SS/GTS values. It can be attributed to an inappropriate SS/GTS/AB ratio which requires further studies to be done for its optimization.
The second highest YB and Ym values at both temperatures were obtained by M-V, which contained SS, AB as well as OFMSW. At mesophilic temperature, the values were 512.55 ± 30.05 N mL/g-VSadd and 147.18 ± 7.88 N mL-CH4/g-VSadd and at thermophilic one 592.74 ± 98.36 N mL/g-VSadd and 203.07 ± 47.49 N mL-CH4/g-VSadd, respectively. The obtained Ym values in this study were comparable to those mentioned in the literature, i.e., 187 mL-CH4/g-VSadd, 50–200 mL-CH4/g-VSadd, 186–222 mL-CH4/g-VSadd, 234 mL-CH4/g-VSadd and 212 mL-CH4/g-VSadd, respectively in [46,47,48,49] and [9]. The percentage increase of YB and Ym achieved by the M-V at thermophilic temperature, especially in terms of YB, was even higher than it was in the case of M-IV (15.65% and 37.97%, respectively, for YB and Ym), and therefore, the increase in operational temperature, in comparison to other analysed mixtures, affected this mixture the most. In terms of YB, as the results show, the value of YB obtained at mesophilic temperature was similar to the one that was found in the literature [50] and even higher at thermophilic temperature (500 mL/g-VSadd for standalone digestion of separately collected OFMSW). It should be noted that due to the presence of other substrates and the synthetic nature of the OFMSW used in the study, the YB could be lower if OFMSW was digested alone. The Ym value for that mixture was similar to that in literature [9] (212 mL-CH4/g-VSadd), although it was a standalone OFMSW digestion.
The lowest Ym was obtained by M-II at mesophilic temperature (Figure 5) which contained only algae biomass of the species Undaria pinnatifida, and it was 97.50 ± 2.85 N mL-CH4/g-VSadd (lower in 29.59% in comparison to standalone SS digestion at the same temperature). That value was comparable to the one found in the literature [51], in particular, to a mixture of Gracilariopsis longissimi with Chaetomorpha linum, 53–157 mL-CH4/g-VSadd. VS. content of this mixture was similar to M-III, which contained sewage sludge and algae biomass (VS = 3.15% for the M-III and VS. = 3.20% for the M-II). Such a low result should be expected, for mixture II had the lowest C/N as well as VS/TS ratios (C/N = 8.3 and VS/TS = 0.67). YB values of the M-II and M-III were remarkably close at mesophilic temperature (456.61 ± 13.60 N mL/g-VSadd and 451.3 ± 9.97 N mL/g-VSadd, respectively). At thermophilic temperature, M-II was the only mixture that had a decrease in YB parameter, and it amounted to 12.92% (397.64 ± 36.06 N mL/g-VSadd); however, its Ym increased by 11.58% (108.79 ± 5.38 N mL-CH4/g-VSadd).
The addition of AB of the particular species studied to SS (M-III) did not bring improvements in relation to YB and Ym parameters, and at thermophilic temperature, the values were lower than standalone SS (M-I), i.e., YB = 452.11 ± 8.97 N mL/g-VSadd and Ym = 138.57 ± 5.38 N mL-CH4/g-VSadd for M-III and YB = 497.23 ± 33.31 N mL/g-VSadd and Ym = 161.13 ± 13.11 N mL-CH4/g-VSadd for standalone SS. In terms of mesophilic temperature, the results were also lower than standalone SS (in terms of YB, the values were 451.30 ± 9.97 N mL/g-VSadd for M-III and 474.61 ± 11.94 N mL/g-VSadd for M-I); however, Ym was remarkably close (138.04 ± 2.94 N mL-CH4/g-VSadd for SS + AB and 138.47 ± 4.70 N mL-CH4/g-VSadd for standalone SS), notwithstanding the fact that in this study the values of YB for SS + AB mixture were higher than those reported in the literature, i.e., the range 271–440 mL/g-VSadd (at mesophilic temperature) and 185–261 mL/g-VSadd (at thermophilic temperature). In that study, it was also observed that the SS + AB co-digestion did not bring results that were higher than standalone SS [52].
As far as standalone SS digestion (M-I) results are concerned, YB values at both temperatures were lower than the one found in the literature [52], i.e., 566 ± 5 mL/g-VSadd. The Ym values (138.47 ± 4.70 N mL-CH4/g-VSadd at mesophilic temperature and 161.13 ± 13.11 N mL CH4/g-VSadd at thermophilic one, which was higher for 11.58%), on the other hand, were similar to that obtained in literature [9], i.e., 143 mL CH4/g-VSadd at mesophilic temperature, although almost twice as lower in comparison to [53], i.e., 292.76 mL CH4/g-VSadd for control that contained 100% waste activated sludge; however, C/N ratios were similar, i.e., 10 at mesophilic and 10.3 at a thermophilic temperature in this study, whereas C/N = 10 ± 0.2 in the mentioned literature.
It should be emphasized that it is difficult to compare the results obtained in this study with other comparable studies because information on co-digestion of three-component mixtures is scarce in the literature. It is difficult to compare the results from biogas production after co-digestion of sewage sludge, grease trap sludge and algae with other comparable studies, as relevant data have simply not been published. For this reason, the performance of the process can be assessed only in relation to the data from mesophilic/thermophilic co-digestion of sewage sludge (being the main component of the feedstock) with GTS, OFMSW or algae. The selected results of the mentioned studies are summarized and shown in Tables S3 and S4. Differences in the efficiency of the process presented in Table S3 can be explained by species characteristics of algae as well as conditions of AcD process (such as I/S ratio, duration of the process, source of inoculum, type of anaerobic digestion (wet, dry), etc.) [50,52,54,55].
As Figure 6 shows, methane content in biogas was close to 60% CH4 v/v for M-IV at day 10 at mesophilic temperature and day 5 at thermophilic, respectively; therefore, the maximum methane content in biogas was achieved faster at thermophilic temperature. As an average for the whole digestion period, in comparison to the standalone SS digestion, the methane content in biogas for M-II and M-III decreased by 34.95% and 7.5%, respectively, whereas for M-IV the methane content in biogas increased by 31.6%. However, in comparison to SS standalone digestion, the M-V had almost the same methane content in biogas throughout the whole mesophilic digestion period. For M-IV and M-V at the thermophilic temperature, there was an increase in methane content in biogas that amounted to 11.10% and 10.20%, respectively, in comparison to M-I, whereas the M-II had again the decrease in methane content in biogas amounting to 31.73%.
As a whole, the digestion of all mixtures at thermophilic temperature, except M-II in terms of YB, brought higher results of YB and Ym in comparison to the mesophilic one, and it can be attributed to the faster reaction speed, higher growth of methanogenic bacteria, and reduction of pathogens (e.g., Faecal coliform, Salmonella and Enterococcus) [56]. The values of the obtained specific biogas and, particularly, methane yields for the studied mixtures may appear to be low in comparison to those found in literature, although, as pointed out by [57], the dissimilarities that appear in studies, in which the same type of substrate is used, are due to many factors, e.g., origin or source of a substrate, its particle size, presence or absence of other substrates, source of inoculum and its composition, composition of anaerobic medium applied, substrate/inoculum ratio, headspace/working volume ratio, methods applied for the physicochemical analysis and BMP test, the precision of a gas measuring device and STP corrections of biogas/methane volumes and many others [58,59,60]. Moreover, in this study, the possibilities of the mixture pre-treatment were not included in the research scope, and it can be an interesting topic for future study, in which particular attention could be paid to the mixture M-IV. The summary of the YB and Ym results are represented in Table 3 where they were also grouped (with letters a, b, c, d, e and f) based on the One-Way ANOVA and Tukey HSD test results (see Figures S5–S7).

3.3. Kinetic Study

As it is represented in the Table 4 all tested kinetic models fit relatively well, and the coefficient of determination (R2) was in most cases higher than 0.99, especially at mesophilic temperature, in which only 4 of 15 studied cases (5 mixtures × 3 models) R2 was less than 0.99 for the LF model (for mixtures M-I, M-II, M-III and M-IV). That observation indicated that the applied models, particularly MG and TF, can be used for successful evaluation and prediction of the co-digestion process parameters with three substrate components at mesophilic temperature. However, at thermophilic temperature, the fitting was worse, and in 7 of 15 studied cases, R2 was less than 0.99, and in 4 of those 15 cases, it was again for the LF model (for standalone SS and mixtures M-II, M-III and M-IV). Because of the relatively good fit, Pm values were close to the actual methane yield values, and the percentage difference was within the range of 0.1–5.6%.
The λ parameter (Table 4) was small for most of the mixtures (within the range of 0.808–1.433 d at mesophilic temperature and 0.853–2.975 d at thermophilic one, taking into account the values obtained only with the highest R2), and the digestion started especially rapidly for a mixture that contained SS, AB and OFMSW at both temperatures (0.808 d at mesophilic and 0.853 d at thermophilic temperatures). Therefore, it can be inferred that this mixture was particularly easily biodegradable, and microorganisms adopted fast to the process. The same observation was noted in the literature (1.3 ± 0.15 d was reported); however, in this study, the values of λ parameter for that mixture were lower [9]. Moreover, these values were much lower than those obtained in [61], i.e., 8.9 d and 9.1 d, respectively, for OFMSW/vegetable oil and OFMSW/animal fat. However, the values were much higher than those obtained in other studies related to food waste, i.e., 0.01 d for TF and 0.29 d for MG [62].
The highest lag phase was obtained for M-II at both temperatures, i.e., 1.433 d at mesophilic temperature for MG and 2.975 d at thermophilic temperature for TF. In this study, λ value for standalone AB digestion at mesophilic temperature was twice as low in comparison to the one found in literature, in which microalgae species Spirulina platensis was studied (3.95 d), and 17% higher in comparison to the literature value at thermophilic temperature, i.e., 2.53 d [63]. Moreover, MG model fitting at thermophilic temperature gave R2 = 0, which indicated that it was unsuitable for the evaluation of that mixture in thermophilic conditions.
It should be noted that the values of λ for the mixture containing SS, GTS and AB at mesophilic temperature were much lower than those obtained for standalone GTS digestion, i.e., 7.05–8.27 d in [9], whereas in this study, mentioned parameter was equal 1.234 d at mesophilic temperature and 1.507 d at thermophilic one (taking into account the values obtained with the highest R2). The observations may indicate that the addition of SS and AB to the GTS increased the speed of digestion initiation; however, other factors such as inoculum to substrates adaptation can have a serious impact too.
The highest value of the Rm at mesophilic temperature was achieved by M-V (Rm = 42.78 mL-CH4 × g-VSadd−1 × d−1) with R2 = 0.9995, whereas at thermophilic temperature the highest value was obtained for M-IV (Rm = 74.34 mL-CH4 × g-VSadd−1 × d−1) with R2 = 0.9994. For M-V, the Rm value was higher in comparison to the one that was found in the literature [61], 14–35 mL-CH4 × g-VSadd−1 × d−1, and also obtained through MG.

3.4. Statistical Analysis

As it is represented in the Table 5, for both parameters such as VS. removal and variation of methane in biogas all factors had p lower than the significance level (α = 0.05). “Temperature” was the decisive factor for both of these parameters (F = 602.70 for VS. removal and F = 59.791 for variation of methane in biogas).
Regarding the YB, factor, “Mixture” influenced the results the most (F = 13.953), and both “Temperature” and “Mixture” mutually influenced the results as proved by F > 1 value (F = 3.345).
In terms of Ym parameter, factors “Temperature” and “Time”, respectively, had statistical significance (p = 0–0.00162); however, “Time” influenced the results the most (F = 57.53). The mutual influence of “Temperature” and “Time” was also confirmed (p = 0.013855 and F = 3.391).
Table 6 presents the results of the Tukey HSD test that was conducted only for those results that were obtained at the fourth digestion week. The results were grouped with letters, i.e., from “a” to “f”.

4. Conclusions

The study investigated the efficiency of the mesophilic and thermophilic sewage sludge anaerobic co-digestion with such substrates as OFMSW, GTS and algae biomass of the species Undaria pinnatifida. The main results can be summarized as follows:
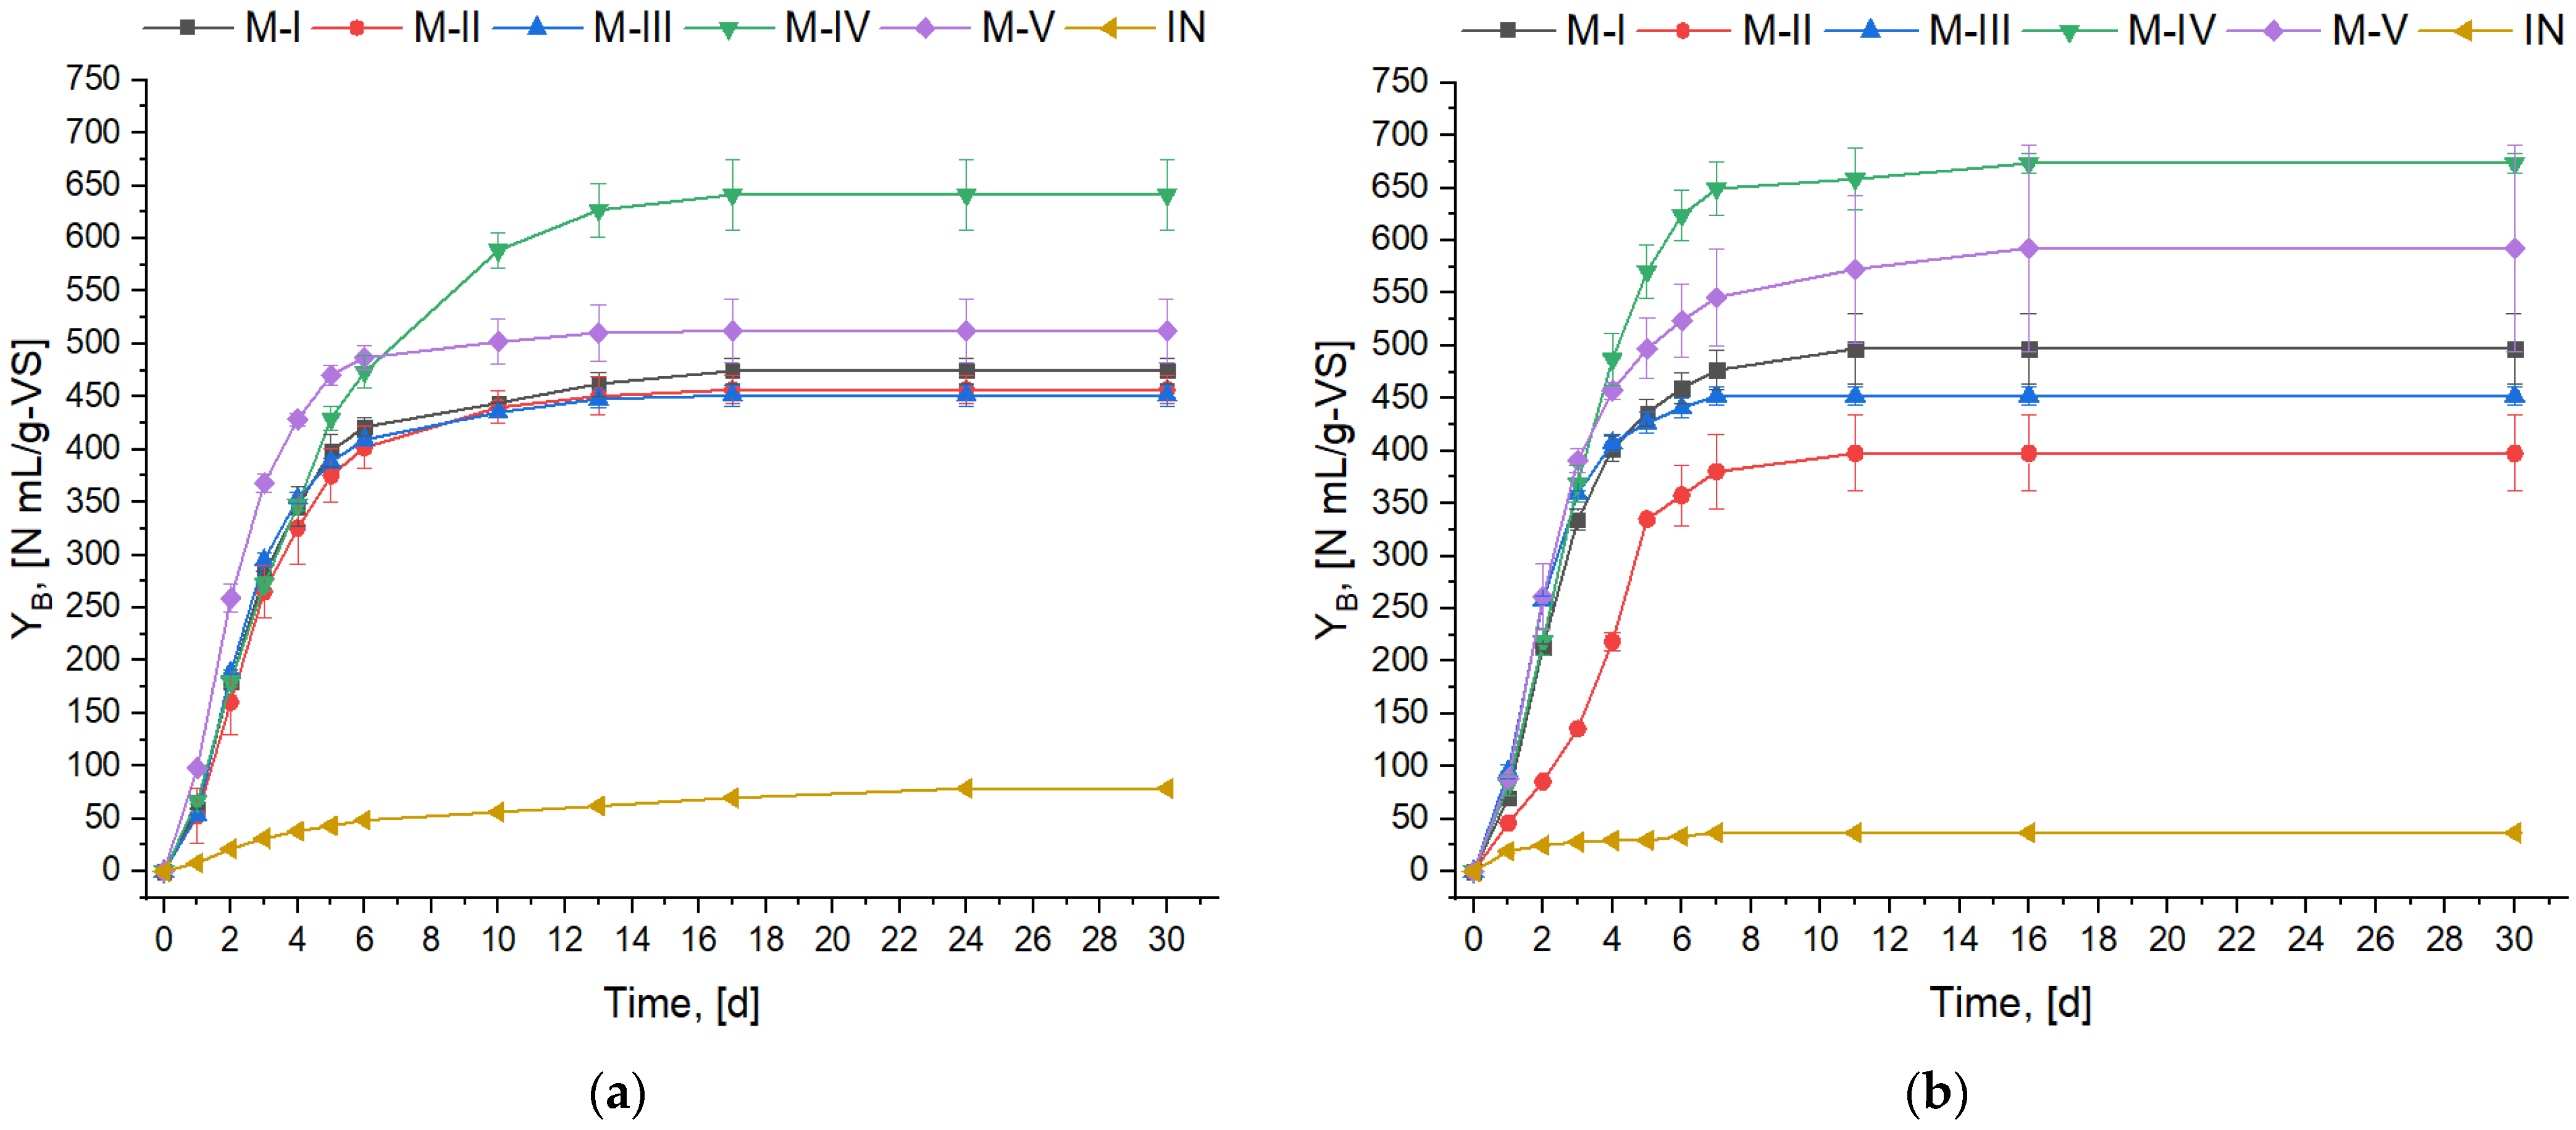
  • Application of GTS and AB substrates for SS co-digestion with feed composition 60/30/10% (SS/GTS/AB) improved both YB and Ym parameters for 35.13% and 88.37%, respectively, at mesophilic temperature and 35.42% and 71.09% at thermophilic one in comparison to standalone SS; however, its λ was the second highest one compared to other mixtures. This mixture also had the highest potential methane yield, particularly at thermophilic temperature.
  • Application of OFMSW and AB for SS co-digestion shows rapid adaptation as proved by the kinetic study (its λ was the lowest one at both temperatures among other studied mixtures).
  • Thermophilic temperature significantly increased N-NH4+ and FAN concentration.
  • All the applied models proved that they can be used for efficient evaluation of three component AcD; however, the best fitting was obtained for the MG model (9 of 10 cases) and the worst fitting for the LF (9 of 10 cases).
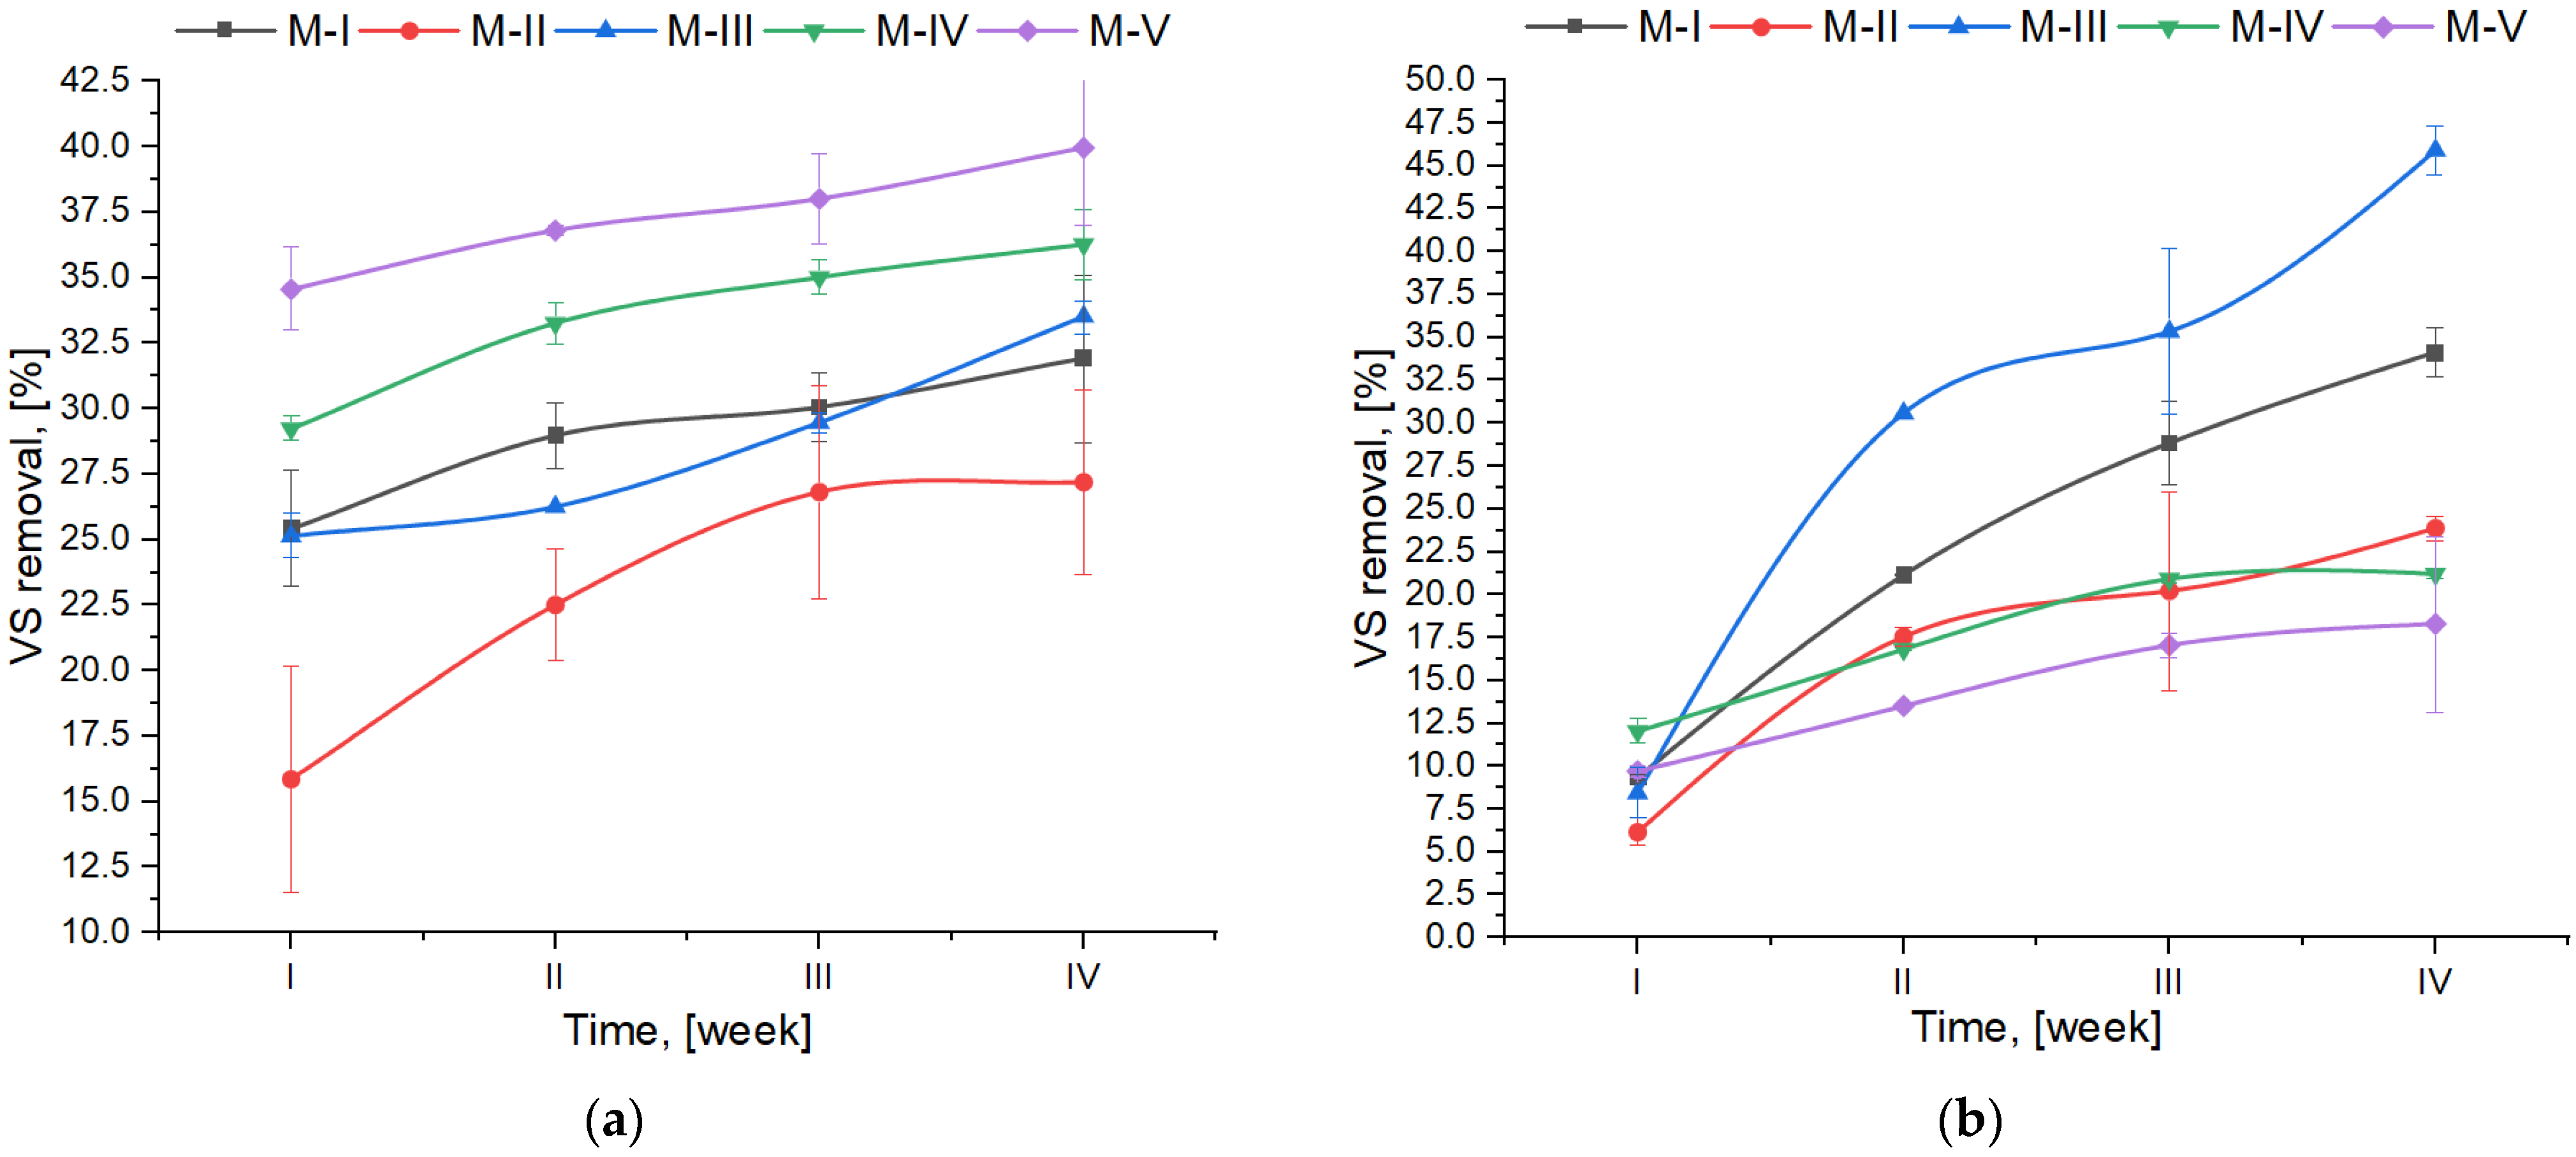
  • VS removal was much slower at thermophilic temperature, and the values were lower for 64% (as an average for all mixtures) at the first thermophilic digestion week in comparison to the mesophilic one. As confirmed by the statistical analysis, temperature influenced this parameter the most.
  • Statistical analysis confirmed that the YB results depended highly on the choice of substrates (factor “mixture”) for mixture preparation and operational temperature of the digestion as was also proved with the Tukey HSD test.

Supplementary Materials

The following are available online at https://www.mdpi.com/article/10.3390/en14144217/s1, Figure S1: Substrates that were used in the study: (a) algae substrate “Wakame”, Undaria pinnatifida; (b) OFMSW that was prepared in accordance with the recipe presented in the reference [1]; (c) GTS from the meat processing plant, Silesian region, Poland, Figure S2: Arrangement in incubators: (a) BMP assay; (b) physicochemical analysis, Figure S3: Change of N-NH4+ during four-week digestion period: (a) mesophilic temperature; (b) thermophilic temperature, Figure S4: Change of FAN during four-week digestion period: (a) mesophilic temperature; (b) thermophilic temperature, Figure S5: Factorial ANOVA results in relation to the YB, Figure S6: Factorial ANOVA results in relation to the Ym, Figure S7: Observed versus predicted values: (a) VS removal; (b) Ym; (c) YB; (d) variation of methane in biogas, Table S1: Summarizing information regarding to the section and page in [2] for the parameters measured, Table S2: Measured physicochemical parameters of the studied mixtures, Table S3: Comparison of methane yields of different co-digestion mixture after treated in wet AcD. Table S4: Methane potential of different raw organic waste, title, Video S1: title, and Nomenclature used in this manuscript.

Author Contributions

Conceptualization, A.G. and G.S.; methodology, A.G.; software, G.S. and A.G.; validation, A.G.; formal analysis, G.S. and A.G.; investigation, G.S. and A.G.; resources, A.G. and E.N.; data curation, A.G.; writing—original draft preparation, G.S.; writing—review and editing, G.S. and A.G.; visualization, G.S.; supervision, A.G. and E.N.; project administration, A.G.; funding acquisition, A.G. and E.N. All authors have read and agreed to the published version of the manuscript.

Funding

The scientific research was funded by the statute subvention of Czestochowa University of Technology, Faculty of Infrastructure and Environment (BS/PB-400/301/21). The presentation of results in this research has been financed from the EnviSafeBioC project—contract No. PPI/APM/2018/1/00029/U/001—the project is financed by the Polish National Agency for Academic Exchange NAWA.

Institutional Review Board Statement

Not applicable.

Informed Consent Statement

Not applicable.

Data Availability Statement

Not applicable.

Conflicts of Interest

Authors declare there is no conflict of interests. The authors of the manuscript are the contractors of the project financed from the Nawa and members of the research team as part of the statute subvention of the Czestochowa University of Technology.

References

  1. Al Seadi, T.; Rutz, D.; Prassl, H.; Kottner, M.; Finsterwalder, T.; Silke Volk, R.J. Biogas-Handbook; Al Seadi, T., Ed.; University of Southern Denmark: Esbjerg, Denmark, 2008; ISBN 9788799296200. [Google Scholar]
  2. Calise, F.; Cappiello, F.L.; D’Accadia, M.D.; Infante, A.; Vicidomini, M. Modeling of the anaerobic digestion of organic wastes: Integration of heat transfer and biochemical aspects. Energies 2020, 13, 2702. [Google Scholar] [CrossRef]
  3. Iacovidou, E.; Ohandja, D.G.; Voulvoulis, N. Food waste co-digestion with sewage sludge—Realising its potential in the UK. J. Environ. Manag. 2012, 112, 267–274. [Google Scholar] [CrossRef]
  4. Kouas, M.; Torrijos, M.; Sousbie, P.; Harmand, J.; Sayadi, S. Modeling the anaerobic co-digestion of solid waste: From batch to semi-continuous simulation. Bioresour. Technol. 2019, 274, 33–42. [Google Scholar] [CrossRef]
  5. Giordano, A.; Di Capua, F.; Esposito, G.; Pirozzi, F. Long-term biogas desulfurization under different microaerobic conditions in full-scale thermophilic digesters co-digesting high-solid sewage sludge. Int. Biodeterior. Biodegradation 2019, 142, 131–136. [Google Scholar] [CrossRef]
  6. Neczaj, E.; Grosser, A.; Worwąg, M. Boosting production of methane from sewage sludge by addition of grease trap sludge. Environ. Prot. Eng. 2013, 39, 125–133. [Google Scholar] [CrossRef]
  7. Bień, J.; Matysiak, B.; Wystalska, K. Stabilization and Dewatering of Sewage Sludge; Wydawnictwo Politechniki Częstochowskiej: Częstochowa, Poland, 1999; ISBN 8371930615. (In Polish) [Google Scholar]
  8. Neczaj, E.; Bien, J.; Grosser, A.; Worwag, M.; Kacprzak, M. Anaerobic treatment of sewage sludge and grease trap sludge in continuous co-digestion. Glob. Nest J. 2012, 14, 141–148. [Google Scholar]
  9. Grosser, A. Determination of methane potential of mixtures composed of sewage sludge, organic fraction of municipal waste and grease trap sludge using biochemical methane potential assays. a comparison of BMP tests and semi-continuous trial results. Energy 2018, 143, 488–499. [Google Scholar] [CrossRef]
  10. Chernysh, Y.; Roy, I.; Chubur, V.; Shulipa, Y.; Roubík, H. Co-digestion of poultry litter with cellulose-containing substrates collected in the urban ecosystem. Biomass Convers. Biorefinery 2021. [Google Scholar] [CrossRef]
  11. Poeschl, M.; Ward, S.; Owende, P. Prospects for expanded utilization of biogas in Germany. Renew. Sustain. Energy Rev. 2010, 14, 1782–1797. [Google Scholar] [CrossRef]
  12. Bux, F.; Chisti, Y. Algae Biotechnology: Products and Processes; Springer International Publishing: Cham, Switzerland, 2016; ISBN 3319123343. [Google Scholar]
  13. Tsapekos, P.; Alvarado-Morales, M.; Kougias, P.G.; Konstantopoulos, K.; Angelidaki, I. Co-digestion of municipal waste biopulp with marine macroalgae focusing on sodium inhibition. Energy Convers. Manag. 2019, 180, 931–937. [Google Scholar] [CrossRef]
  14. Davidsson, Å.; Lövstedt, C.; la Cour Jansen, J.; Gruvberger, C.; Aspegren, H. Co-digestion of grease trap sludge and sewage sludge. Waste Manag. 2008, 28, 986–992. [Google Scholar] [CrossRef]
  15. Keucken, A.; Habagil, M.; Batstone, D.; Jeppsson, U.; Arnell, M. Anaerobic co-digestion of sludge and organic food waste-performance, inhibition, and impact on the microbial community. Energies 2018, 11, 2325. [Google Scholar] [CrossRef] [Green Version]
  16. Grosser, A.; Neczaj, E.; Singh, B.R.; Almås, Å.R.; Brattebø, H.; Kacprzak, M. Anaerobic digestion of sewage sludge with grease trap sludge and municipal solid waste as co-substrates. Environ. Res. 2017, 155, 249–260. [Google Scholar] [CrossRef] [PubMed]
  17. Ahmed, D.; Wagdy, R.; Said, N. Evaluation of biogas production from anaerobic co-digestion of sewage sludge with microalgae and agriculture wastes. BioResources 2019, 14, 8405–8412. [Google Scholar]
  18. Solé-Bundó, M.; Garfí, M.; Ferrer, I. Pretreatment and co-digestion of microalgae, sludge and fat oil and grease (FOG) from microalgae-based wastewater treatment plants. Bioresour. Technol. 2020, 298, 122563. [Google Scholar] [CrossRef] [PubMed]
  19. Al Seadi, T.; Lukehurst, C. Quality management of digestate from biogas plants used as fertiliser. IEA Bioenergy 2012, 37, 40. [Google Scholar]
  20. Minister of the Environment. Regulation of the Minister of the Environment of 6 February 2015 on the Municipal 572 Sewage Sludge (J. L. 2015, No. 0, Item. 257). 2015. Available online: http://isap.sejm.gov.pl/isap.nsf/download.xsp/WDU20150000257/O/D20150257.pdf (accessed on 24 June 2021). (In Polish)
  21. Ministry of the Environment Regulation of the Minister of the Environment of 20 January 2015 Regarding the 576 R10 Recovery Process. 2015. (Journal of Laws 2015 Item 132). 2015. Available online: http://www.fao.org/faolex/577results/details/en/c/LEX-FAOC151955/ (accessed on 24 June 2021). (In Polish).
  22. Epstein, G.; Smale, D.A. Undaria pinnatifida: A case study to highlight challenges in marine invasion ecology and management. Ecol. Evol. 2017, 7, 8624–8642. [Google Scholar] [CrossRef]
  23. Global Invasive Species Database. 2021. Available online: http://www.iucngisd.org/gisd/?st=100ss&fr=1&str=&lang=EN (accessed on 22 June 2021).
  24. Sosnowski, P.; Klepacz-Smolka, A.; Kaczorek, K.; Ledakowicz, S. Kinetic investigations of methane co-fermentation of sewage sludge and organic fraction of municipal solid wastes. Bioresour. Technol. 2008, 99, 5731–5737. [Google Scholar] [CrossRef]
  25. Grosser, A. The influence of decreased hydraulic retention time on the performance and stability of co-digestion of sewage sludge with grease trap sludge and organic fraction of municipal waste. J. Environ. Manag. 2017, 203, 1143–1157. [Google Scholar] [CrossRef]
  26. Petracchini, F.; Liotta, F.; Paolini, V.; Perilli, M.; Cerioni, D.; Gallucci, F.; Carnevale, M.; Bencini, A. A novel pilot scale multistage semidry anaerobic digestion reactor to treat food waste and cow manure. Int. J. Environ. Sci. Technol. 2018, 15, 1999–2008. [Google Scholar] [CrossRef]
  27. Zhang, E.; Li, J.; Zhang, K.; Wang, F.; Yang, H.; Zhi, S.; Liu, G. Anaerobic digestion performance of sweet potato vine and animal manure under wet, semi-dry, and dry conditions. AMB Express 2018, 8, 45. [Google Scholar] [CrossRef]
  28. Owen, W.F.; Stuckey, D.C.; Healy, J.B.; Young, L.Y.; McCarty, P.L. Bioassay for monitoring biochemical methane potential and anaerobic toxicity. Water Res. 1979, 13, 485–492. [Google Scholar] [CrossRef]
  29. Alleman, J.E. Free Ammonia-Nitrogen Calculator & Information. Available online: http://home.eng.iastate.edu/~jea/w3-research/free-ammonia/nh3.html (accessed on 20 June 2021).
  30. Chen, Y.; Cheng, J.J.; Creamer, K.S. Inhibition of anaerobic digestion process: A review. Bioresour. Technol. 2008, 99, 4044–4064. [Google Scholar] [CrossRef]
  31. Capson-Tojo, G.; Moscoviz, R.; Astals, S.; Robles, A.; Steyer, J.P. Unraveling the literature chaos around free ammonia inhibition in anaerobic digestion. Renew. Sustain. Energy Rev. 2020, 117, 109487. [Google Scholar] [CrossRef]
  32. Massé, D.I.; Rajagopal, R.; Singh, G. Technical and operational feasibility of psychrophilic anaerobic digestion biotechnology for processing ammonia-rich waste. Appl. Energy 2014, 120, 49–55. [Google Scholar] [CrossRef]
  33. Yun, Y.M.; Kim, D.H.; Cho, S.K.; Shin, H.S.; Jung, K.W.; Kim, H.W. Mitigation of ammonia inhibition by internal dilution in high-rate anaerobic digestion of food waste leachate and evidences of microbial community response. Biotechnol. Bioeng. 2016, 113, 1892–1901. [Google Scholar] [CrossRef] [PubMed]
  34. Di Capua, F.; Spasiano, D.; Giordano, A.; Adani, F.; Fratino, U.; Pirozzi, F.; Esposito, G. High-solid anaerobic digestion of sewage sludge: Challenges and opportunities. Appl. Energy 2020, 278, 115608. [Google Scholar] [CrossRef]
  35. Hermanowicz, W.; Dożańska, W.; Dojlido, J.; Koziorowski, B.; Zerbe, J. Physico-Chemical Analysis of Water and Sewage; Arkady: Warszawa, Poland, 1999; ISBN 978-83-213-4067-8. (In Polish) [Google Scholar]
  36. Jenkins, S.H. Standard Methods for the Examination of Water and Wastewater. Water Res. 1982, 16, 1495–1496. [Google Scholar] [CrossRef]
  37. Jha, A.K.; Li, J.; Zhang, L.; Ban, Q.; Jin, Y. Comparison between wet and dry anaerobic digestions of cow dung under mesophilic and thermophilic conditions. Adv. Water Resour. Prot. 2013, 1, 28–38. [Google Scholar]
  38. Zhao, H.W.; Viraraghavan, T. Analysis of the performance of an anaerobic digestion system at the Regina wastewater treatment plant. Bioresour. Technol. 2004, 95, 301–307. [Google Scholar] [CrossRef]
  39. Choudhary, P.; Assemany, P.P.; Naaz, F.; Bhattacharya, A.; de Castro, J.S.; de do Couto, E.A.C.; Calijuri, M.L.; Pant, K.K.; Malik, A. A review of biochemical and thermochemical energy conversion routes of wastewater grown algal biomass. Sci. Total Environ. 2020, 726, 137961. [Google Scholar] [CrossRef]
  40. Zhang, C.; Su, H.; Baeyens, J.; Tan, T. Reviewing the anaerobic digestion of food waste for biogas production. Renew. Sustain. Energy Rev. 2014, 38, 383–392. [Google Scholar] [CrossRef]
  41. Weiland, P. Biogas production: Current state and perspectives. Appl. Microbiol. Biotechnol. 2010, 85, 849–860. [Google Scholar] [CrossRef]
  42. Olsson, J.; Feng, X.M.; Ascue, J.; Gentili, F.G.; Shabiimam, M.A.; Nehrenheim, E.; Thorin, E. Co-digestion of cultivated microalgae and sewage sludge from municipal waste water treatment. Bioresour. Technol. 2014, 171, 203–210. [Google Scholar] [CrossRef] [Green Version]
  43. Elango, D.; Pulikesi, M.; Baskaralingam, P.; Ramamurthi, V.; Sivanesan, S. Production of biogas from municipal solid waste with domestic sewage. J. Hazard. Mater. 2007, 141, 301–304. [Google Scholar] [CrossRef] [PubMed]
  44. Luostarinen, S.; Luste, S.; Sillanpää, M. Increased biogas production at wastewater treatment plants through co-digestion of sewage sludge with grease trap sludge from a meat processing plant. Bioresour. Technol. 2009, 100, 79–85. [Google Scholar] [CrossRef] [PubMed]
  45. Girault, R.; Bridoux, G.; Nauleau, F.; Poullain, C.; Buffet, J.; Peu, P.; Sadowski, A.G.; Béline, F. Anaerobic co-digestion of waste activated sludge and greasy sludge from flotation process: Batch versus CSTR experiments to investigate optimal design. Bioresour. Technol. 2012, 105, 1–8. [Google Scholar] [CrossRef] [Green Version]
  46. Guendouz, J.; Buffière, P.; Cacho, J.; Carrère, M.; Delgenes, J.-P. Dry anaerobic digestion in batch mode: Design and operation of a laboratory-scale, completely mixed reactor. Waste Manag. 2010, 30, 1768–1771. [Google Scholar] [CrossRef]
  47. Kelly, R.J.; Shearer, B.D.; Kim, J.; Goldsmith, C.D.; Hater, G.R.; Novak, J.T. Relationships between analytical methods utilized as tools in the evaluation of landfill waste stability. Waste Manag. 2006, 26, 1349–1356. [Google Scholar] [CrossRef]
  48. Sosnowski, P.; Wieczorek, A.; Ledakowicz, S. Anaerobic co-digestion of sewage sludge and organic fraction of municipal solid wastes. Adv. Environ. Res. 2003, 7, 609–616. [Google Scholar] [CrossRef]
  49. Owens, J.M.; Chynoweth, D.P. Biochemical methane potential of municipal solid waste (MSW) components. Water Sci. Technol. 1993, 27, 1–14. [Google Scholar] [CrossRef]
  50. Tyagi, V.K.; Fdez-Güelfo, L.A.; Zhou, Y.; Álvarez-Gallego, C.J.; Garcia, L.I.R.; Ng, W.J. Anaerobic co-digestion of organic fraction of municipal solid waste (OFMSW): Progress and challenges. Renew. Sustain. Energy Rev. 2018, 93, 380–399. [Google Scholar] [CrossRef]
  51. Migliore, G.; Alisi, C.; Sprocati, A.R.; Massi, E.; Ciccoli, R.; Lenzi, M.; Wang, A.; Cremisini, C. Anaerobic digestion of macroalgal biomass and sediments sourced from the Orbetello lagoon, Italy. Biomass Bioenergy 2012, 42, 69–77. [Google Scholar] [CrossRef]
  52. Caporgno, M.P.; Trobajo, R.; Caiola, N.; Ibáñez, C.; Fabregat, A.; Bengoa, C. Biogas production from sewage sludge and microalgae co-digestion under mesophilic and thermophilic conditions. Renew. Energy 2015, 75, 374–380. [Google Scholar] [CrossRef]
  53. Hallaji, S.M.; Kuroshkarim, M.; Moussavi, S.P. Enhancing methane production using anaerobic co-digestion of waste activated sludge with combined fruit waste and cheese whey. BMC Biotechnol. 2019, 19, 19. [Google Scholar] [CrossRef]
  54. Rocamora, I.; Wagland, S.T.; Villa, R.; Simpson, E.W.; Fernández, O.; Bajón-Fernández, Y. Dry anaerobic digestion of organic waste: A review of operational parameters and their impact on process performance. Bioresour. Technol. 2020, 299, 122681. [Google Scholar] [CrossRef]
  55. Obata, O.; Ditchfield, A.; Hatton, A.; Akunna, J. Investigating the impact of inoculum source on anaerobic digestion of various species of marine macroalgae. Algal Res. 2020, 46, 101803. [Google Scholar] [CrossRef]
  56. Mao, C.; Feng, Y.; Wang, X.; Ren, G. Review on research achievements of biogas from anaerobic digestion. Renew. Sustain. Energy Rev. 2015, 45, 540–555. [Google Scholar] [CrossRef]
  57. Strömberg, S.; Nistor, M.; Liu, J. Towards eliminating systematic errors caused by the experimental conditions in Biochemical Methane Potential (BMP) tests. Waste Manag. 2014, 34, 1939–1948. [Google Scholar] [CrossRef]
  58. Raposo, F.; De Rubia, M.A.; Borja, R. Anaerobic digestion of solid organic substrates in batch mode: An overview relating to methane yields and experimental procedures. Renew. Sustain. Energy Rev. 2011, 16, 861–877. [Google Scholar] [CrossRef]
  59. Angelidaki, I.; Alves, M.; Bolzonella, D.; Borzacconi, L.; Campos, J.L.; Guwy, A.J.; Kalyuzhnyi, S.; Jenicek, P.; Van Lier, J.B. Defining the biomethane potential (BMP) of solid organic wastes and energy crops: A proposed protocol for batch assays. Water Sci. Technol. 2009, 59, 927–934. [Google Scholar] [CrossRef] [PubMed] [Green Version]
  60. Raposo, F.; Fernández-Cegrí, V.; de la Rubia, M.A.; Borja, R.; Béline, F.; Cavinato, C.; Demirer, G.; Fernández, B.; Fernández-Polanco, M.; Frigon, J.C.; et al. Biochemical methane potential (BMP) of solid organic substrates: Evaluation of anaerobic biodegradability using data from an international interlaboratory study. J. Chem. Technol. Biotechnol. 2011, 86, 1088–1098. [Google Scholar] [CrossRef]
  61. Ponsá, S.; Gea, T.; Sánchez, A. Anaerobic co-digestion of the organic fraction of municipal solid waste with several pure organic co-substrates. Biosyst. Eng. 2011, 108, 352–360. [Google Scholar] [CrossRef] [Green Version]
  62. Zahan, Z.; Othman, M.Z.; Muster, T.H. Anaerobic digestion/co-digestion kinetic potentials of different agro-industrial wastes: A comparative batch study for C/N optimisation. Waste Manag. 2018, 71, 663–674. [Google Scholar] [CrossRef] [PubMed]
  63. El-Mashad, H.M. Kinetics of methane production from the codigestion of switchgrass and Spirulina platensis algae. Bioresour. Technol. 2013, 132, 305–312. [Google Scholar] [CrossRef] [PubMed]
Figure 1. Scheme of the experiment related to the BMP assay.
Energies 14 04217 g001
Figure 2. Scheme of experiment related to the physicochemical analysis.
Energies 14 04217 g002
Figure 3. VS. removal: (a) mesophilic temperature; (b) thermophilic temperature.
Energies 14 04217 g003
Figure 4. Cumulative specific biogas yield: (a) mesophilic temperature; (b) thermophilic temperature.
Energies 14 04217 g004
Figure 5. Cumulative specific methane yield: (a) mesophilic temperature; (b) thermophilic temperature.
Energies 14 04217 g005
Figure 6. Variation of methane in biogas during 30-day digestion period: (a) mesophilic temperature; (b) thermophilic temperature.
Energies 14 04217 g006
Table 1. Characteristics appertaining to the organic composition of the selected substrates.
SubstrateTS
(%)
VS
(%)
VS/TS
(–)
C/N
(–)
AB88.7060.080.679.36
OFMSW20.2019.700.9629.3 ± 0.7
GTS58.4057.800.9912.8
Digested sludge (inoculum)2.61 (1)–2.84 (2)1.38 (1)–1.59 (2)0.53 (1)–0.56 (2)8.65 (2)–8.85 (1)
(1) For mesophilic digestion; (2) for thermophilic digestion.
Table 2. Characteristics appertaining to organic composition of the analysed mixtures.
MixturePercentage Composition of Each Mixture Based on VS. of Each SubstrateMesophilic DigestionThermophilic Digestion
ABSSGTSOFMSW
TS
(%)
VS
(%)
VS/TS
(−)
C/N
(−)
TS
(%)
VS
(%)
VS/TS
(−)
C/N
(−)
M-I1003.843.080.80103.222.420.7510.3
M-II1004.763.200.678.34.723.030.648.2
M-III10904.023.150.7811.63.462.560.7410
M-IV1060305.544.510.819.94.993.990.7911.7
M-V1060305.264.250.8010.54.833.820.7910.8
Table 3. Summary of the results of BMP assay plus One-Way ANOVA results with Tukey HSD test (values marked with the same letter in the graph are not significantly different to Tukey test, p > 0.05).
MixtureYB
(N mL/g-VSadd)
Ym
(N mL-CH4/g-VSadd)
MTMT
M-I474.61 ± 11.94 bc497.23 ± 33.31 bcd138.47 ± 4.70 bcd161.13 ± 13.11 de
M-II456.61 ± 13.60 bc397.64 ± 36.06 b97.50 ± 2.85 b108.79 ± 5.73 bc
M-III451.30 ± 9.98 bc452.11 ± 8.97 bc138.04 ± 2.94 bcd138.57 ± 5.38 bcd
M-IV641.34 ± 33.84 e673.36 ± 8.97 e260.83 ± 15.02 f275.66 ± 4.11 f
M-V512.55 ± 30.05 cd592.74 ± 98.36 de147.18 ± 7.88 cd203.07 ± 47.49 e
IN78.74 ± 0.00 a36.84 ± 1.08 a4.22 ± 0.00 a0.49 ± 0.01 a
Table 4. Kinetic parameters that were determined by applying three mathematical kinetic models.
MixtureModelPm
(N mL-CH4/g-VSadd)
Rm
(N mL-CH4 × g-VSadd−1 × d1)
λ
(d)
R2
(−)
MTMTMTMT
M-IMG135.80157.1132.3347.421.0741.0990.99850.9986
LF141.52168.1436.2150.460.4090.3880.98250.9775
TF134.53155.3032.6447.781.2291.2120.99580.9957
M-IIMG96.7070.3329.77−6.181.43393.0360.99950
LF100.70122.9928.4024.770.4640.8660.96850.9374
TF95.93107.5229.6539.491.5442.9750.99830.9997
M-IIIMG136.17138.0836.2351.850.9210.8560.99850.9995
LF141.29144.2941.9356.410.3560.2580.98220.9777
TF134.77137.0536.0851.451.0330.9340.99430.997
M-IVMG260.56275.9337.5474.341.2341.5070.99950.9994
LF277.23298.1743.9175.720.6060.5320.98820.969
TF256.36272.7940.8474.011.6241.6330.99680.999
M-VMG146.71191.6942.7849.690.8080.8530.99950.9952
LF151.12206.2551.2858.030.2890.3490.98110.984
TF145.45188.8342.1950.180.9070.9790.9970.9904
Table 5. Results related to the factorial ANOVA analysis (α = 0.05) with three factors.
ParameterFactor
TimeMixt.Temp.Time/Mixt.Time/Temp.Mixt./Temp.Time/Mixt./Temp.
VS
removal
F218.3957.66602.799.3441.55113.578.37
p0.0000000.0000000.0000000.0000000.0000000.0000000.000000
YBF0.69313.9530.6300.0720.2503.3450.073
p0.5589670.0000000.4296670.9999920.8608420.0138550.999990
YmF57.5371.11810.6500.2933.3910.4750.311
p0.0000000.3467960.0016200.9889210.0129270.7006910.985666
Variation of methane in biogasF25.26219.07359.7913.20914.3737.3603.261
p0.0000000.0000000.0000000.0008660.0000000.0000420.000738
Temp.—temperature; Mixt.—mixture.
Table 6. Results of the Tukey HSD test.
ParameterFactor Mixture
VS
removal
Mixt.M-VM-IVM-IIM-IIM-IM-IIIM-IM-IVM-VM-III
Temp. TTTMMMTMMT
Mean18.3221.2423.9027.2131.9333.5334.1636.2839.9645.93
a************
b ************
c ****************
d ****************
e ****************
f ********
YBMixt. MVMIVMIIMIIMIMIIIMIMIVMVMIII
Temp. TTTMMMTMMT
Mean316.40388.01396.35443.99444.63449.70457.21502.33614.21660.51
a****************************************
YmMixt. MVMIVMIIMIIMIMIIIMIMIVMVMIII
Temp. TTTMMMTMMT
Mean92.3197.50103.72122.06135.04143.24147.51156.68247.83275.66
a********************************
b ********************
c ********
Variation of methane in biogasMixt. MVMIVMIIMIIMIMIIIMIMIVMVMIII
Temp. TTTMMMTMMT
Mean5.0017.0025.7027.0028.4230.0033.4036.5841.0041.40
a****
b ****
c ************
d ************
e ********
f ********
g ********
****—results of Tukey HSD test from Statistica software; variable: VS removal; YB; Ym; Variation of methane in biogas; Temp.—temperature; Mixt.—mixture.
Publisher’s Note: MDPI stays neutral with regard to jurisdictional claims in published maps and institutional affiliations.

