1. Introduction
Buildings have become the largest energy consumers in Europe, accounting for approximately 40% of European Union (EU) energy consumption and 36% of greenhouse gas (GHG) emissions [
1]. In this context, buildings must face the challenge of achieving energy management that enables them to contribute to economic growth, social welfare and sustainability, while preserving non-renewable resources and the natural environment [
2]. In addition, they have the opportunity of adopting measures aimed at saving energy, reducing their demand and/or improving the efficiency of their systems [
3]. Among them, the EU residential building stock offers high potential for energy efficiency gains and reduction of GHG emissions [
4]. This is due to the heavy reliance on fossil fuels in household activities, to cover the demand for heating and domestic hot water (DHW) [
5], as well as to a lesser extent and indirectly for cooling, lighting and appliances. However, occupant behavior lifestyles cannot be underrated [
6], although this issue is outside the scope of this research.
The use of renewable energy systems (specifically those based on solar ones) may be a solution to reduce the GHG emissions from residential buildings, as well as save money on energy bills. Therefore, the objective of this study is to assess the triple energy (in consumption), economic (in savings and/or surplus) and environmental (in GHG emissions) impact that the incorporation of a photovoltaic (PV) and/or a solar thermal (ST) system produces in the use phase of a single-family house. This study will be extended to the entire territory of Spain, analyzing all its municipalities.
Looking for zero energy and emissions future, European legal framework has become more and more strict over the years. In this regard, the Energy Performance of Building Directives (EPBDs) aim to ensure compliance with EU objectives related to energy consumption, GHG emissions and energy efficiency. This includes the energy generation from renewable sources in buildings.
The first version of the EPBD 2002/91/EC [
7] provided energy use requirements for both new and existing buildings under renovation and introduced energy performance certificates. Next, the EPBD 2010/31/EU [
8] specified that by the end of 2020, all new buildings should be nearly Zero-Energy Buildings (nZEBs). Then, the EPBD 2012/27EU [
9] imposed a mandatory requirement for Member States to develop national plans to increase the number of nZEBs, which should include a detailed definition of the concept of a nZEB considering their national, regional and/or local conditions, as well as a numerical indicator of primary energy use. Finally, the EPBD 2018/844/EU [
10] modified the two prior directives, stressing the EU’s engagement in the fight against climate change and energy poverty. To do this, the EU has set as primary objectives to:
Decarbonize the housing stock, renovating it from an energy standpoint.
Ensure equal access to financing for building renovation, rewarding proposals that promote energy efficiency.
Guarantee the quality of buildings, prioritizing the adoption of natural solutions, the encouragement of alternative high-efficiency installations, the promotion of research and the test of new solutions.
According to the EPBDs, Member States have to promote the improvement of the energy performance of buildings within their territories, taking into account outdoor climatic conditions, indoor climate requirements and cost-effectiveness [
10]. The goal is to reduce GHG emissions in the Union by 80–95% compared to 1990, to ensure a highly energy efficient and decarbonized European building stock and to facilitate the cost-effective transformation of existing buildings into nZEBs.
In short, EPBDs set EU building sustainability objectives for mitigating climate change, reducing GHG emissions and energy consumption and promulgating the contribution of renewable energy. By 2020, the EU has set the target to reduce GHG emissions and energy consumption by 20%, as well as to raise the share of renewable energy in their energy consumption by a further 20%, compared to 1990 results. By 2030, the EU has established a 40% reduction in GHG emissions and a 32.5% in energy consumption, as well as a 32% contribution from renewable energy sources.
In Spain, many standards, regulations and laws have been published this century, with the aim of achieving greater energy efficiency and sustainability for buildings. The Spanish Building Act (LOE) 38/1999 [
11] required the adoption of a Technical Building Code (CTE), which came into force in 2008 by the Royal Decree (RD) 384/2006 [
12]. This transposed the EPBD 2002/91/EC, definitively repealing the Basic Building Standard on Thermal Conditions in buildings (NBE CT-79) [
13]. After that, a few RDs (1371/2007, 238/2013) and Ministerial Orders (VIV/984/2009, FOM/1635/2013, FOM/588/2017) transposed the 2010/31/EU and 2012/27EU EPBDs, focusing on the processing of energy certifications, the regulation of thermal installations, the updating of energy demands and the limitation of energy consumption. Finally, the RD 732/2019 [
14] once again modified the CTE, increasing the conditions to control the energy demand and limiting the energy consumption. This last version incorporated the considerations of the 2018/844/EU EPBD, with the purpose of reducing the energy required to satisfy the energy demand associated with the use of buildings, eventually incorporating the definition of nZEB for Spain. Furthermore, in the same year, the RD 244/2019 [
15] regulated the conditions for self-consumption of electricity. This eliminated the so-called “sun tax” and even allowed the sale of surplus from small-scale producers for generation plants of less than 100 kWp.
The EU has assumed the leading role in achieving the goals of substitution of fossil fuels with renewable energy sources, reduction of GHG emissions and other environmental impacts [
16]. The share of renewable energy sources on the gross final energy consumption has grown up from 11% in 2005 to 19.5% in 2017 [
17], although the achievement of these objectives has been quite heterogeneous. In this context, the case of Spain must be highlighted, since the share of electricity production from renewables reached 43.66% in 2020 [
18]. In addition, carbon dioxide equivalent (CO
2eq) emission-free production accounted for 66.9% of total generated, becoming the cleanest year registered.
The PV market for electricity generation has developed strongly in the recent years (102.4 GWp of grid-connected PV panels were installed globally in 2018, which is equivalent to the total PV capacity available in the world in 2012 (100.9 GWp)), leading to a total global solar power capacity of more than 500 GWp at the end of 2018 [
16]. Regarding ST systems, the global ST market size stood at 496.15 GWp in 2018 and is projected to reach 767.73 GWp by 2026, exhibiting a compound annual growth rate of 5.6% during the forecast period [
19].
Although the potential of renewable energy sources in buildings is under study from different points of view (as efficiency [
20], employment [
21], market [
22] or sustainability [
23], for example), the scientific community is paying special attention to the performance assessment of different renewable energy sources (hydrogen, PV, ST, wind, etc.) with a life cycle approach [
16,
24,
25,
26,
27,
28]. Some of them include an energy study of the use of renewable energy sources [
17,
29]. Others include both an economic and an environmental analysis to determine the payback period [
30,
31]. Some others include, instead, the evaluation of the energy profile of different renewable energy technologies [
32,
33].
At present, there are few new buildings in construction in Spain, but a large number are 10–20 years old, with a long useful life remaining (at least 30 years more [
34]). In addition, most of these buildings (both existing and new ones) are residential homes. This leads to the need to focus on solving the renovation of existing buildings rather than promoting the development of new ones [
35,
36,
37,
38]. However, most of the current studies are aimed either at analyzing a case study (in a particular location [
39,
40], of a determined typology [
41,
42], with a specific technology [
43,
44], etc.) or at analyzing future developments that are not yet available on the market for the public [
45,
46].
As stated at the beginning of this section, the objective of this study is to assess the energy, economic and environmental impact that the incorporation of a PV and/or a ST system produces in a new or existing single-family home with at least 30 years of useful life remaining. Present-day conditions (mounting requirements, operation and maintenance instructions, technical performance, product warranty, etc.) from current commercial solutions are assumed. The analysis is carried out with satellite climatic data from the European Photovoltaic Geographical Information System (PVGIS) [
47] from the last typical meteorological year (TMY) available, calculated from the period 2007–2016. This evaluation has been carried out by means of energy simulation for each of the 8131 municipalities of Spain (including mainland Spain, the Canary and Balearic Islands and the autonomous cities of Ceuta and Melilla in Africa). Some of the contributions of the paper can be summarized as follows:
Two scenarios will be studied for each system. In the case of the PV system, all energy generated is consumed at home or sold to the supplier company and, for the ST system, auxiliary energy is supplied by electricity or natural gas.
Forecast scenarios proposed by the EU both for the electricity and natural gas prices and for the energetic mix will be considered.
Usual energy, economy, and emissions indicators of the considered solar systems (PV, ST) will be accomplished.
Initial, operational and maintenance costs and GHG emissions incurred by PV and ST systems will be compared to the costs and GHG emissions from fossil-fuel-based systems to which they replace and/or complement.
The amount of money and CO2eq that can be saved when a household is using either a PV and/or a ST system to support the energy consumption will be quantified.
Energy, money, and CO2eq emissions saving maps will be generated for the different scenarios considered.
This way, the relevance of these measures for an entire country can be checked, the influence of the climatic conditions of each territory on its different energy needs can be considered and various existing technologies can be compared from different points of view. Accordingly, the findings of this study can help construction professionals (such as designers, architects and engineers, developers, builders and even legislators) to quantify the real impact that domestic solar renewable energy systems may have on energy, economic and emissions savings.
The rest of the paper is organized as follows:
Section 2 describes the material and methods used for the calculation of the variables selected (energy, costs and GHG emissions): climate data, characterization of renewable energy facilities, economic and environmental study of the solar renewable energy facilities, energy simulation, energy, economic and emissions assessment and geographic information system (GIS) representation. Then, the results are presented in
Section 3. Next, the energy, economic and environmental performance of the systems analyzed (conventional, PV and ST) are discussed. Finally, in
Section 5, some conclusions and recommendations are highlighted.
2. Materials and Methods
To quantify the impact of incorporating solar renewable energy systems in the transformation of existing and new single-family homes into nZEBs, the energy behavior, energy costs and GHG emissions of a house without renewable energy sources has been compared to a house that incorporates them. This comparison has been made considering four premises:
- S1.
House in which a PV system has been added under the assumption that the entire production will be used for self-consumption (PV consumption saving scenario).
- S2.
House in which a PV system has been added under the assumption that the entire production will be sold (PV surplus sale scenario).
- S3.
House in which a ST system has been added to a previous DHW one with an electric boiler, that remains as an auxiliary energy system (ST auxiliary electricity scenario).
- S4.
House in which a ST system has been added to a previous DHW one supplied by natural gas, that remains as an auxiliary energy system (ST auxiliary natural gas scenario).
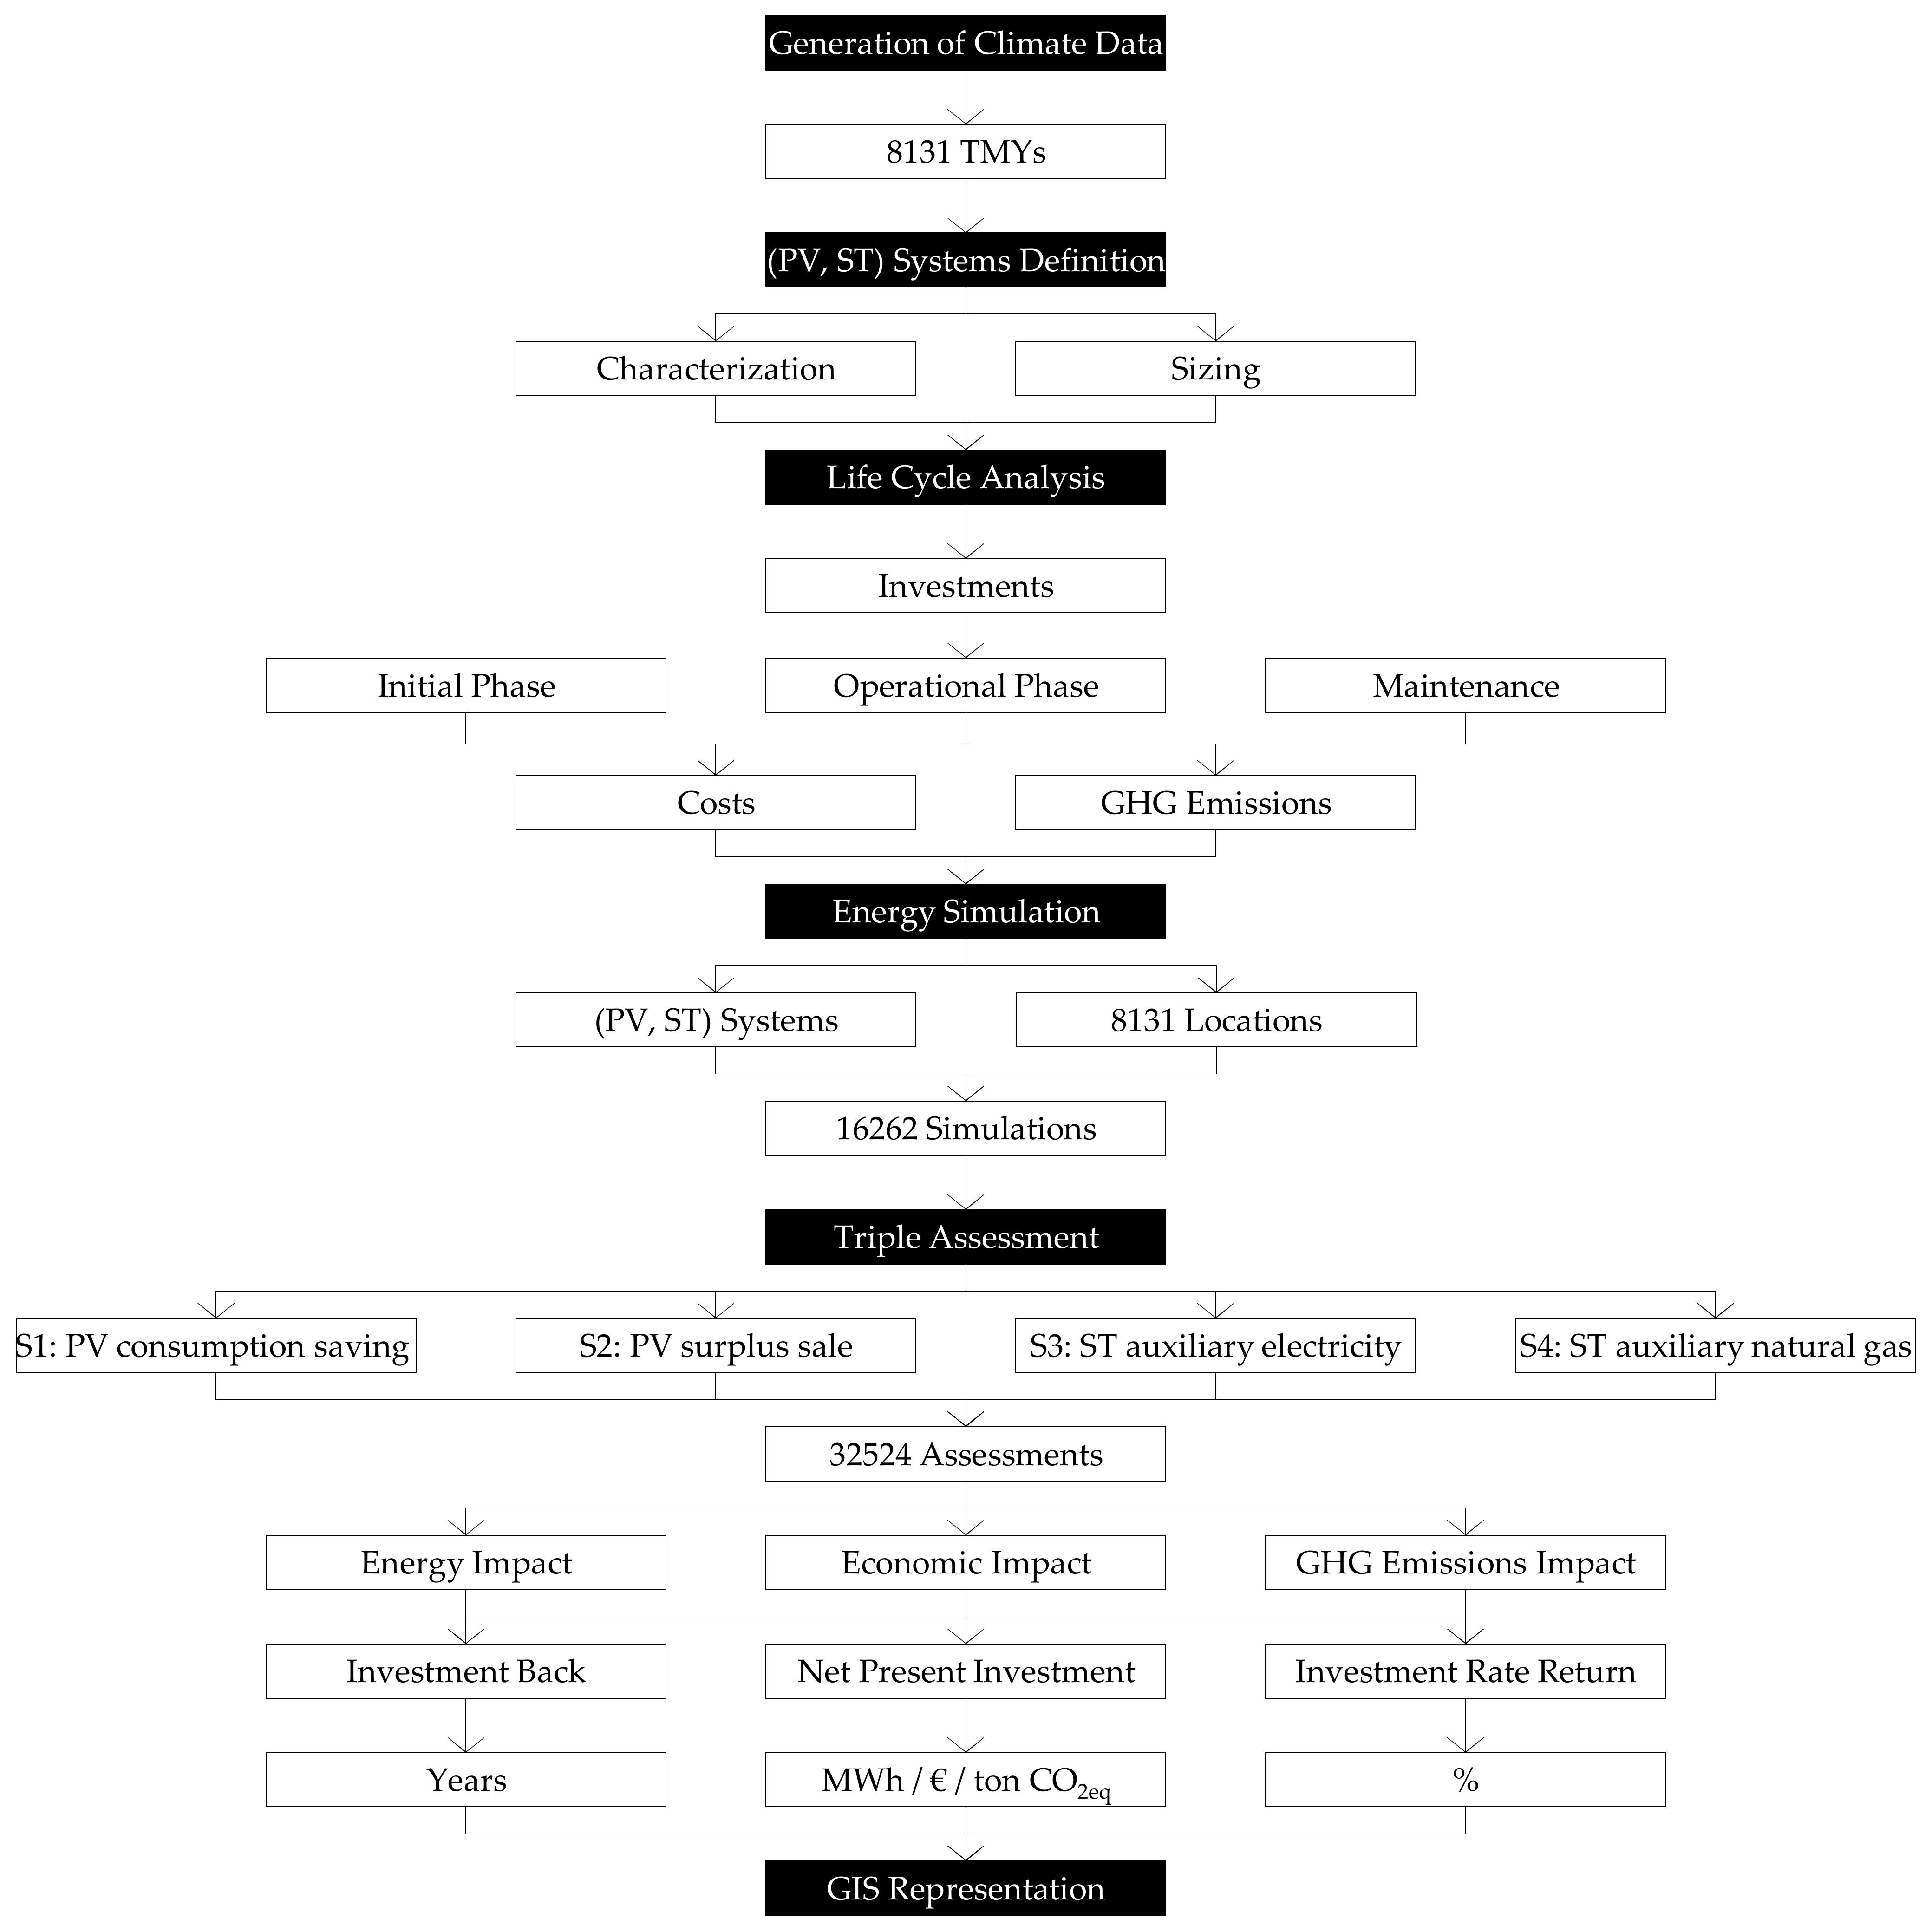
Once the scenarios are defined, a sequential method to approach the problem is established. To culminate this comparative study, the following steps need to be undertaken, as summarized in
Figure 1:
Generation of climate data for each municipality, provided by PVGIS depending on its latitude and longitude.
Characterization and sizing of solar renewable energy facilities incorporated (PV and/or ST). This configuration remains for each location, considering their local climate data.
Economic and environmental study of the solar renewable energy facilities included (PV, ST).
Energy simulation for the 16,262 combinations (2 solar renewable energy installations (PV, ST), 8131 municipalities).
Energy, economic and GHG emissions assessment of the 32,524 case studies (2 scenarios for each of the 2 solar renewable energy systems (PV, ST) in the 8131 municipalities).
Representation of the evaluated data by means of a GIS software. These will show the average energy consumption, carbon dioxide emissions and energy costs over the 30 years of life, considering the initial emissions and investments and the corresponding performance losses, according to each assumption.
Figure 1.
Research methodology scheme.
Figure 1.
Research methodology scheme.
2.1. Climate Data
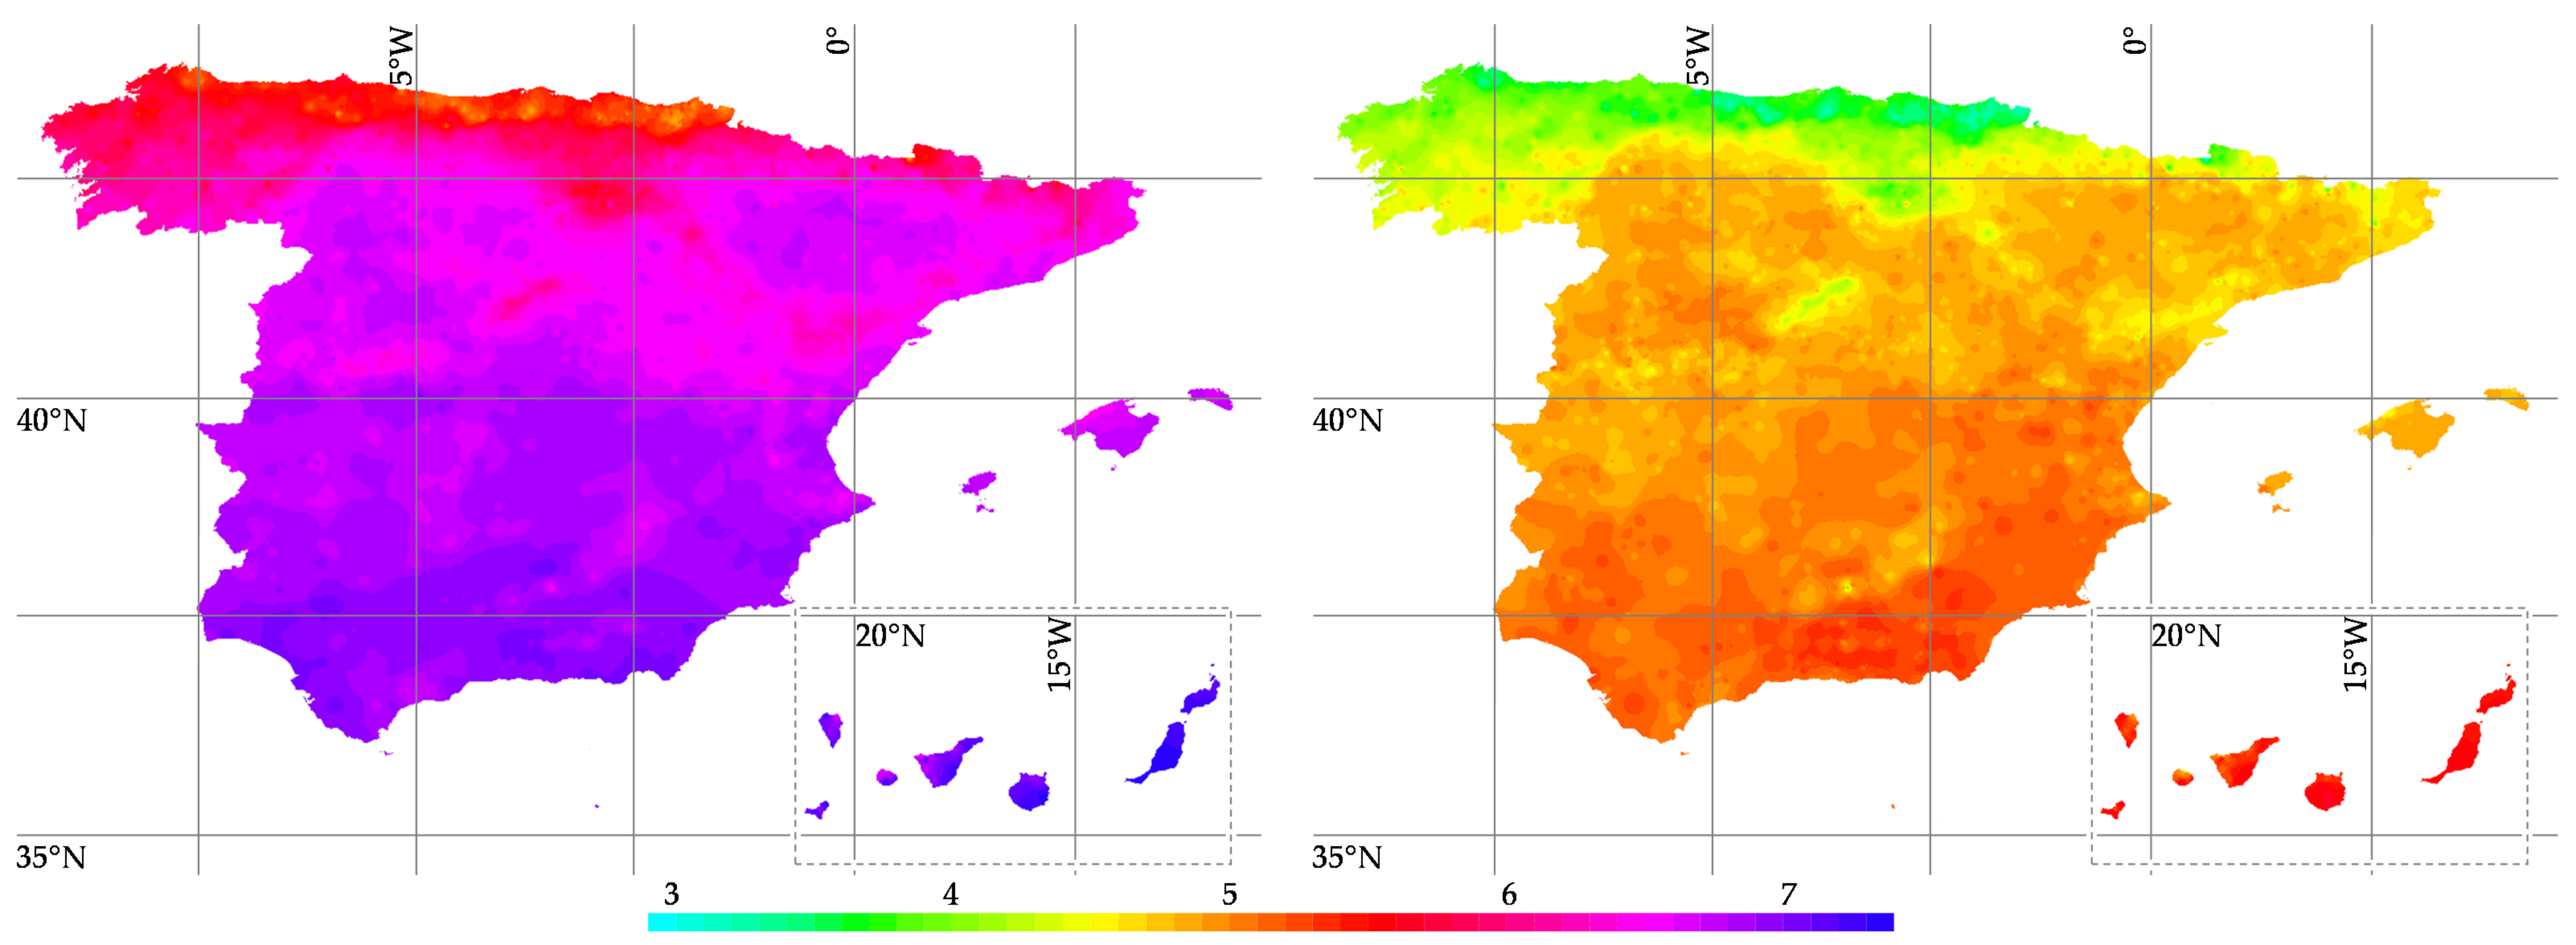
The PVGIS database is a project developed in 2001 by the publicly accessible European Commission Joint Research Centre, designed to allow the users to calculate photovoltaic production anywhere in Europe, among others. From the application, monthly, daily, or hourly weather data can be generated, as well as a TMY for each coordinate (by longitude and latitude) entered.
The PVGIS obtains this data by interpolation [
48], based on solar radiation data obtained by satellite, solar irradiation measured in Europe’s network of weather stations, turbidity and digital elevation, providing all the climate values necessary for the generation of a TMY [
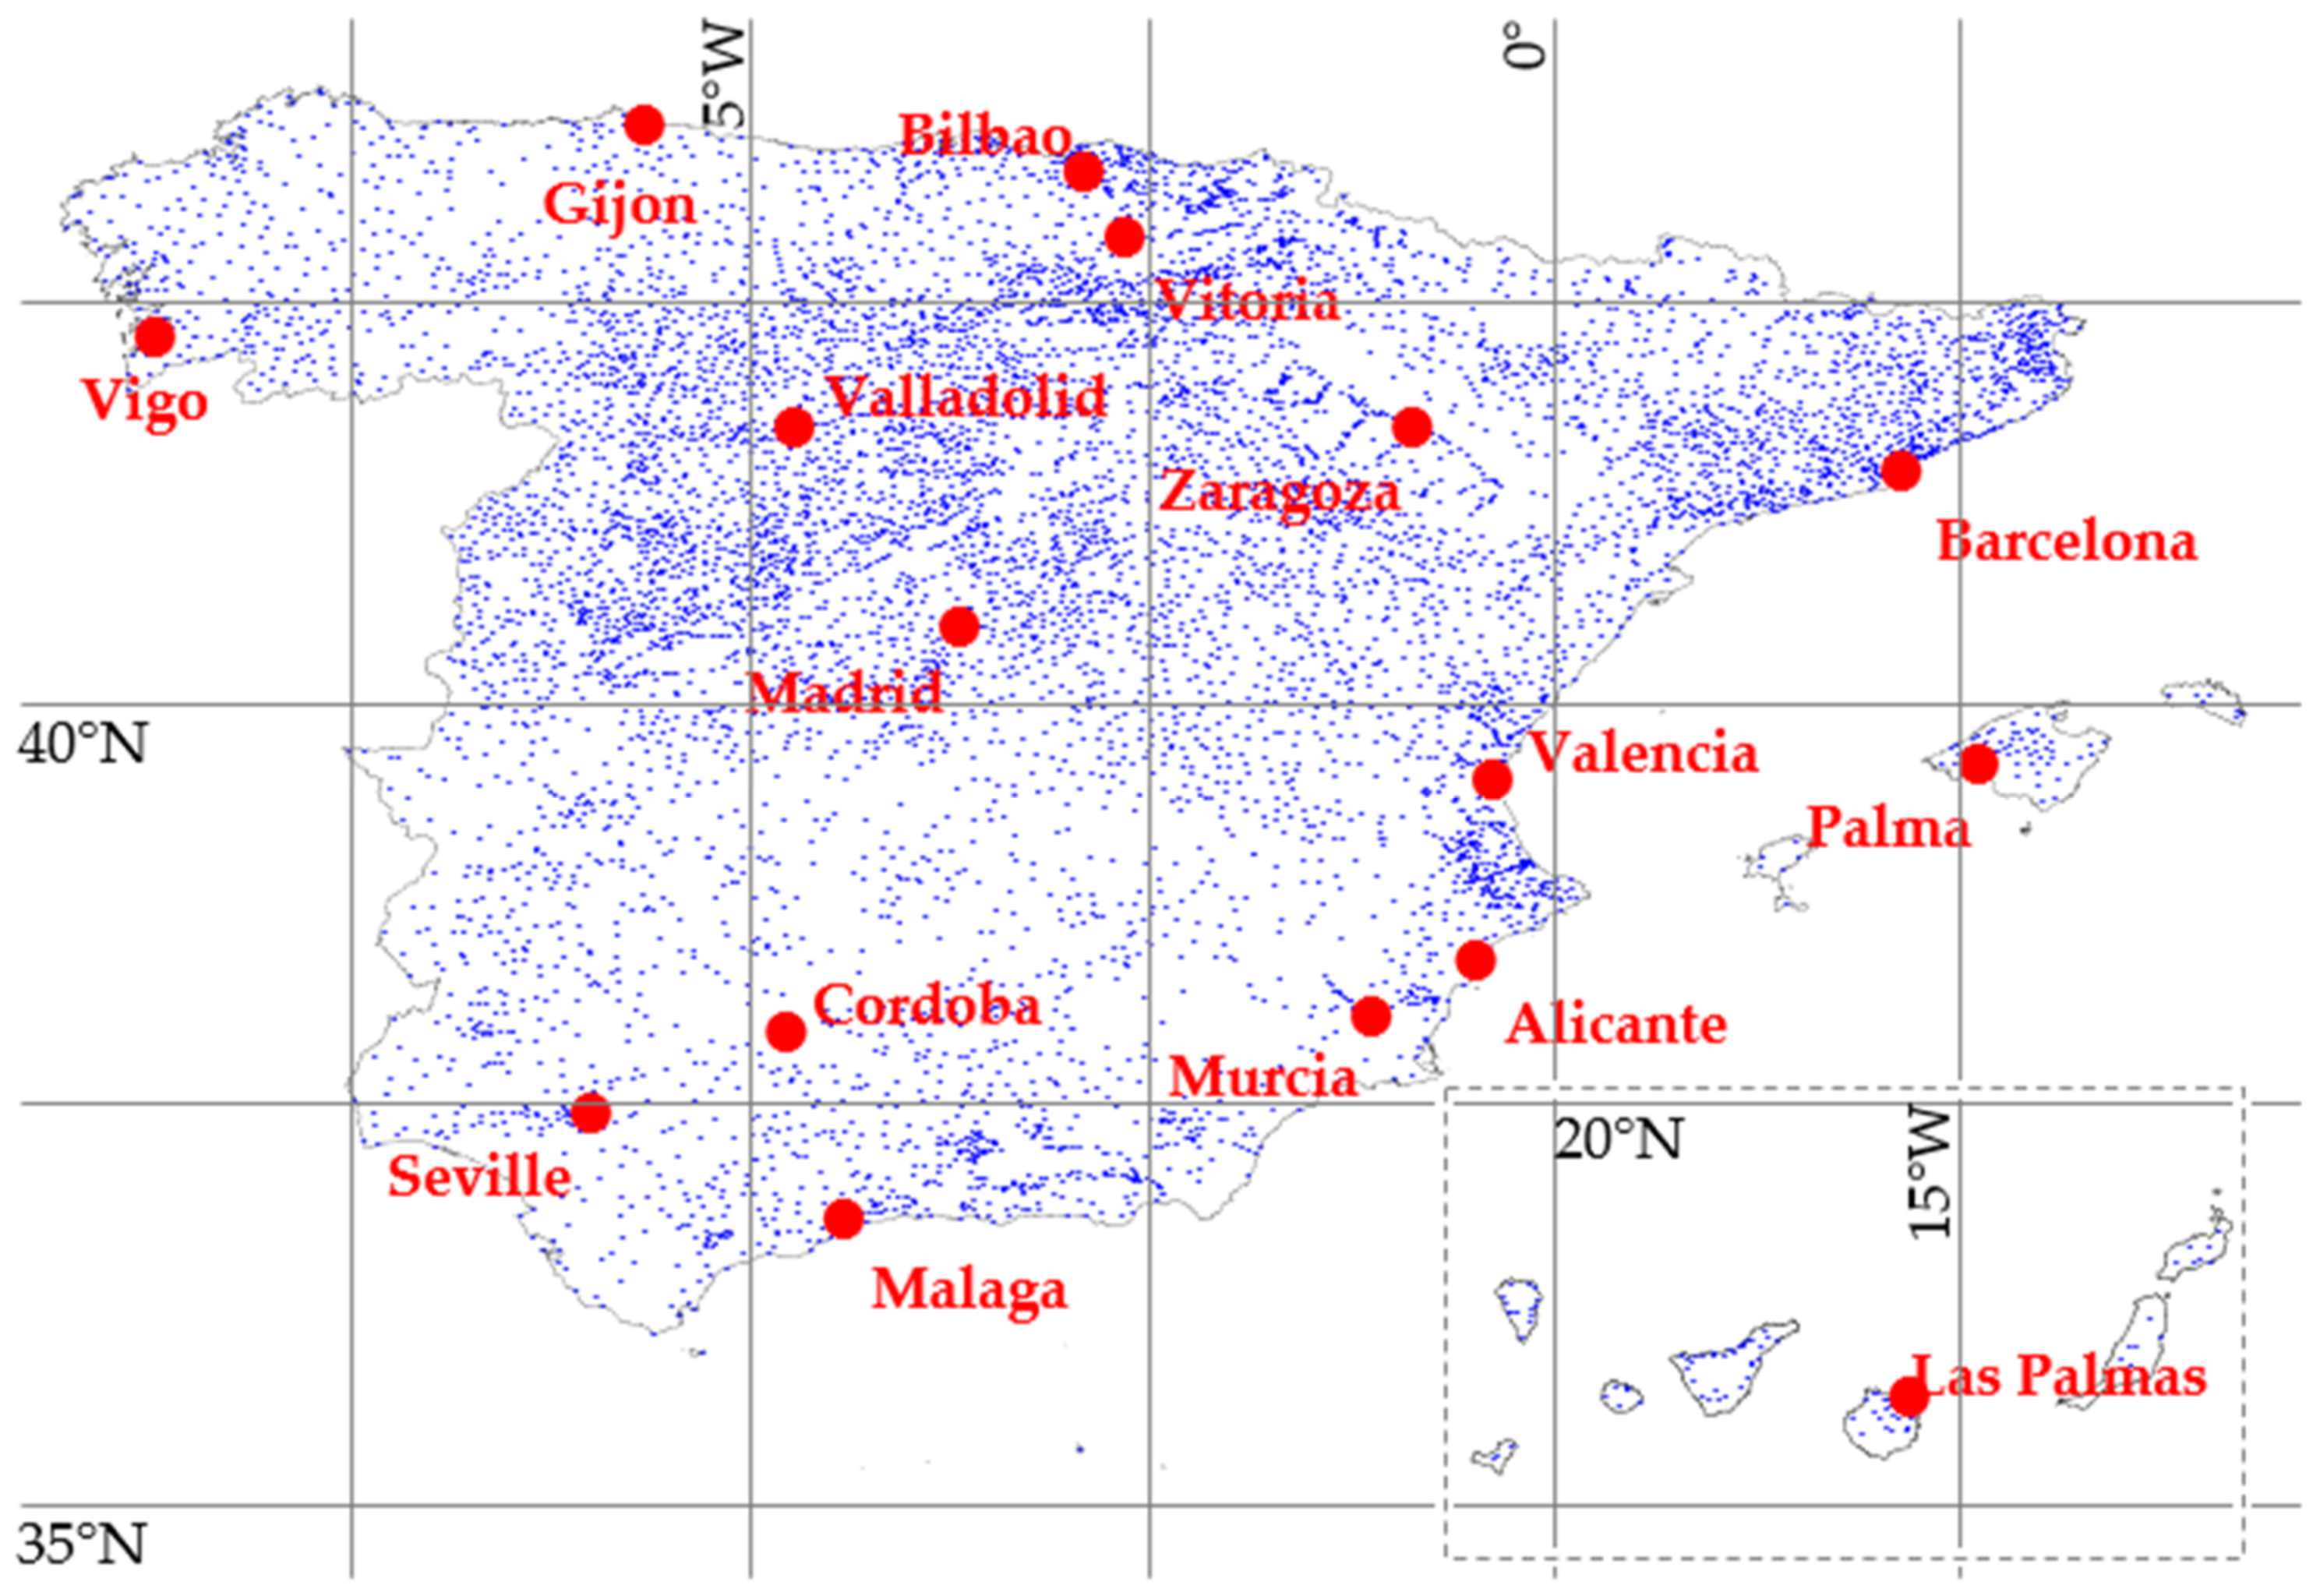
49]. This study has compiled the 8131 TMYs for the period 2007–2016 (the most recent available data) corresponding to the geographical location of each municipality in Spain (in blue), as shown in
Figure 2. For the sake of clarity, the sixteen cities with a population of more than a quarter of a million inhabitants will be also highlighted (in red).
2.2. Characterization of Renewable Energy Facilities
Two solar renewable energy systems have been selected for the study. On the one hand, a PV system of 2.4 kWp using 6 monocrystalline cell modules (with a nominal power rating of 400 Wp per unit) has been installed. The modules have a surface area of 2 square meters, a nominal operating cell temperature (NOCT) of 47 °C, and a temperature degradation coefficient of 0.36%/°C. It can be noted that this type of renewable energy source is not mandatory in Spain for residential buildings, even in the last version of the CTE. However, from the entry into force of the Royal Decree 244/2019, the surplus produced by a household system can be fed into the electric grid (if the facility is lower than 100 kWp), making the entire production available for use.
On the other hand, a ST system is pre-dimensioned so that approximately 80% of the demand for DHW is covered (slightly above the legal minimum of 70%), using a 10-pipe evacuated tube collector. It has a surface area of 2 square meters, an optical efficiency of 93% and an overall loss coefficient of 1.06 W/m2/K. This type of renewable energy source partially covering the demand for DHW is mandatory since the regulatory framework of the first CTE, for all new buildings or renovation of existing ones. A DHW flow rate of 140 L/d (5 occupants at a rate of 28 L/d per person) is considered, so an accumulation volume of 200 L will be used.
2.3. Economic and Environmental Study of the Solar Renewable Energy Facilities
The incorporation of the solar renewable energy facilities (the PV system that is optional for residential buildings of any type according to CTE and the ST one, which is mandatory according to the CTE for both renovation and new buildings) generates an environmental impact and supposes an initial economic investment, the return on which must be calculated. The economic evaluation of the PV system involves comparing its initial, operational and maintenance costs with the energy costs of the electricity consumption that is no longer consumed (S1: PV saving scenario) or of the sale of the surplus produced (S2: PV surplus sale scenario). In the case of the ST system, the economic evaluation consists of comparing its initial, operational and maintenance costs with the savings from the consumption of auxiliary energy, either electricity (S3) or natural gas (S4).
The energy prices considered to be saved (or sold) come from the two major supply companies in Spain (Endesa [
50] and Iberdrola [
51] for electricity and Naturgy [
52] and Repsol [
53] for natural gas). These prices are summarized in
Table 1 and
Table 2. It can be noted that all the prices selected are lower than those from the Statistical Office of the European Union (Eurostat) [
54], as well as lower than the expected future scenarios in the EU up to 2050 forecasted by the Union of the Electricity Industry (Eureletric) [
55]. In this study, E
3Mlab proposes 8 different scenarios (according to the magnitude of change that the delay or failure of specific elements cause): reference, power choices reloaded, lost decade 2020–2030, limited financing, RES target in 2030, limited XB trade, barriers to EE and CO
2 price driven. As the lowest price predicted for any of the eight scenarios from 2020 to 2050 is higher than the average price obtained from the supply companies, it is decided to leave the latter price as constant, so the study is on the reliable side.
For the cost definition of the elements that compose both systems, the price database from CYPE Engineers’ Archimedes software, version 2021.f [
56] is used, facilitating their traceability. For this purpose, a Spanish national manufacturer has been chosen, whose production and distribution facilities are located in the city of Valencia. In economic terms, unit prices include the waste management, health and safety, overheads, industrial profits, technical fees, municipal licenses and indirect taxes. These initial costs, as well as operational and maintenance costs, are also summarized in
Table 3,
Table 4,
Table 5,
Table 6 and
Table 7, for each of the facilities considered. However, no inflation or deflation rates have been considered for those costs to be paid in the operation and maintenance phase, due to the small relative amount (9% of total investment) and the uncertainty after the COVID-19 pandemics [
57].
In terms of environmental impact, a life cycle inventory of all the elements needed to incorporate the PV and ST facilities has been made. For the PV system, the FU is composed by 6 monocrystalline cell modules (described previously) with their structural base, a charge regulator, a bidirectional counter and a protection panel. For the ST system, the FU is composed by a 10-pipe evacuated tube collector (described previously) with its structural base, a hot water cylinder (200 L), an expansion vessel and a circulator pump. For the analysis, the following stages of the life cycle of both systems have been considered: manufacture, transport of systems to the final locations, installation and operation. This includes the transportation of materials to the factory, energy required for production and logistics distribution. The manufacturing site is located in Valencia (Spain). As well, decommissioning of systems has not been included.
The conversion factors to obtain CO
2eq emissions are then determined using EcoInvent 3.3 database [
58] and the Intergovernmental Panel on Climate Change (IPCC) 2013 method with a timeframe of 100 years [
59]. As a result, CO
2eq emissions from these interventions for the FU are shown in
Table 8,
Table 9,
Table 10,
Table 11 and
Table 12. All emissions (and upfront costs) must be offset by a decrease in energy consumption for the rest of the building’s lifespan.
Emissions derived from operational activities depend on the performance of the circulation pump. For this purpose, 48 kWh/year are considered. For this reason, the mix for electricity and natural gas must be taken into account. CF are extracted from the Ministry for the Ecological Transition and the Demographic Challenge (MITECO) [
60].
2.4. Energy Simulation
The simulations for the energy assessment are performed using the TRNSYS tool 17 [
61], which allows the simulation of dynamic thermal systems and can be used to assess the thermal behavior of the systems associated with buildings [
62]. A detailed description of the software can be found at [
63]. To carry out these simulations, the weather data for each municipality is considered, as indicated previously. The simulation time is of one year, at hourly intervals. Simulations require the geometric, construction and operational definition of the systems involved. From these simulations, the energy demand for DHW, as well as PV and ST energy production, can be obtained. This allows determining the demands that are met by these systems and the need for auxiliary systems.
As a base case, a residential single-family home is established. For the electric case, two extreme cases are studied: all the energy is consumed (saving scenario), or all the energy is sold with no consumption (surplus scenario). To estimate the DHW consumption, five occupants are considered. In the initial situation, according to the scenario, a natural gas (with a nominal performance of 85%) or electric boiler (with a nominal performance of 97%) is used to produce DHW. To achieve architectural integration, the panels (collector and modules) are mounted horizontally. In relation to the systems performance, the study considers a linear performance loss for PV from 3% in the first year to 20% after 25 years, etc., up to 30 years. For ST, 5% during the first 25 years to 50% after 30 years.
2.5. Energy, Economic and Emissions Assessment
The triple evaluation results will be shown in the Results section. These results will include, among others, the energy produced by the solar renewable energy systems studied, the economic savings generated by these facilities over their life cycle, and the emissions avoided through their operation.
2.6. GIS Representation
The representations have been obtained using the inverse distance weighted (IDW) technique of ESRI’s ARCGIS 10.6.1 [
64] from the specific information of each of Spain’s 8131 municipalities. For each type of system (PV, ST), evaluation (energy, economic and emissions) and scenario (consumption saving, surplus sale, auxiliary electricity and auxiliary natural gas), a series of three maps (investment back, net present investment and investment rate return) are made.
4. Discussion
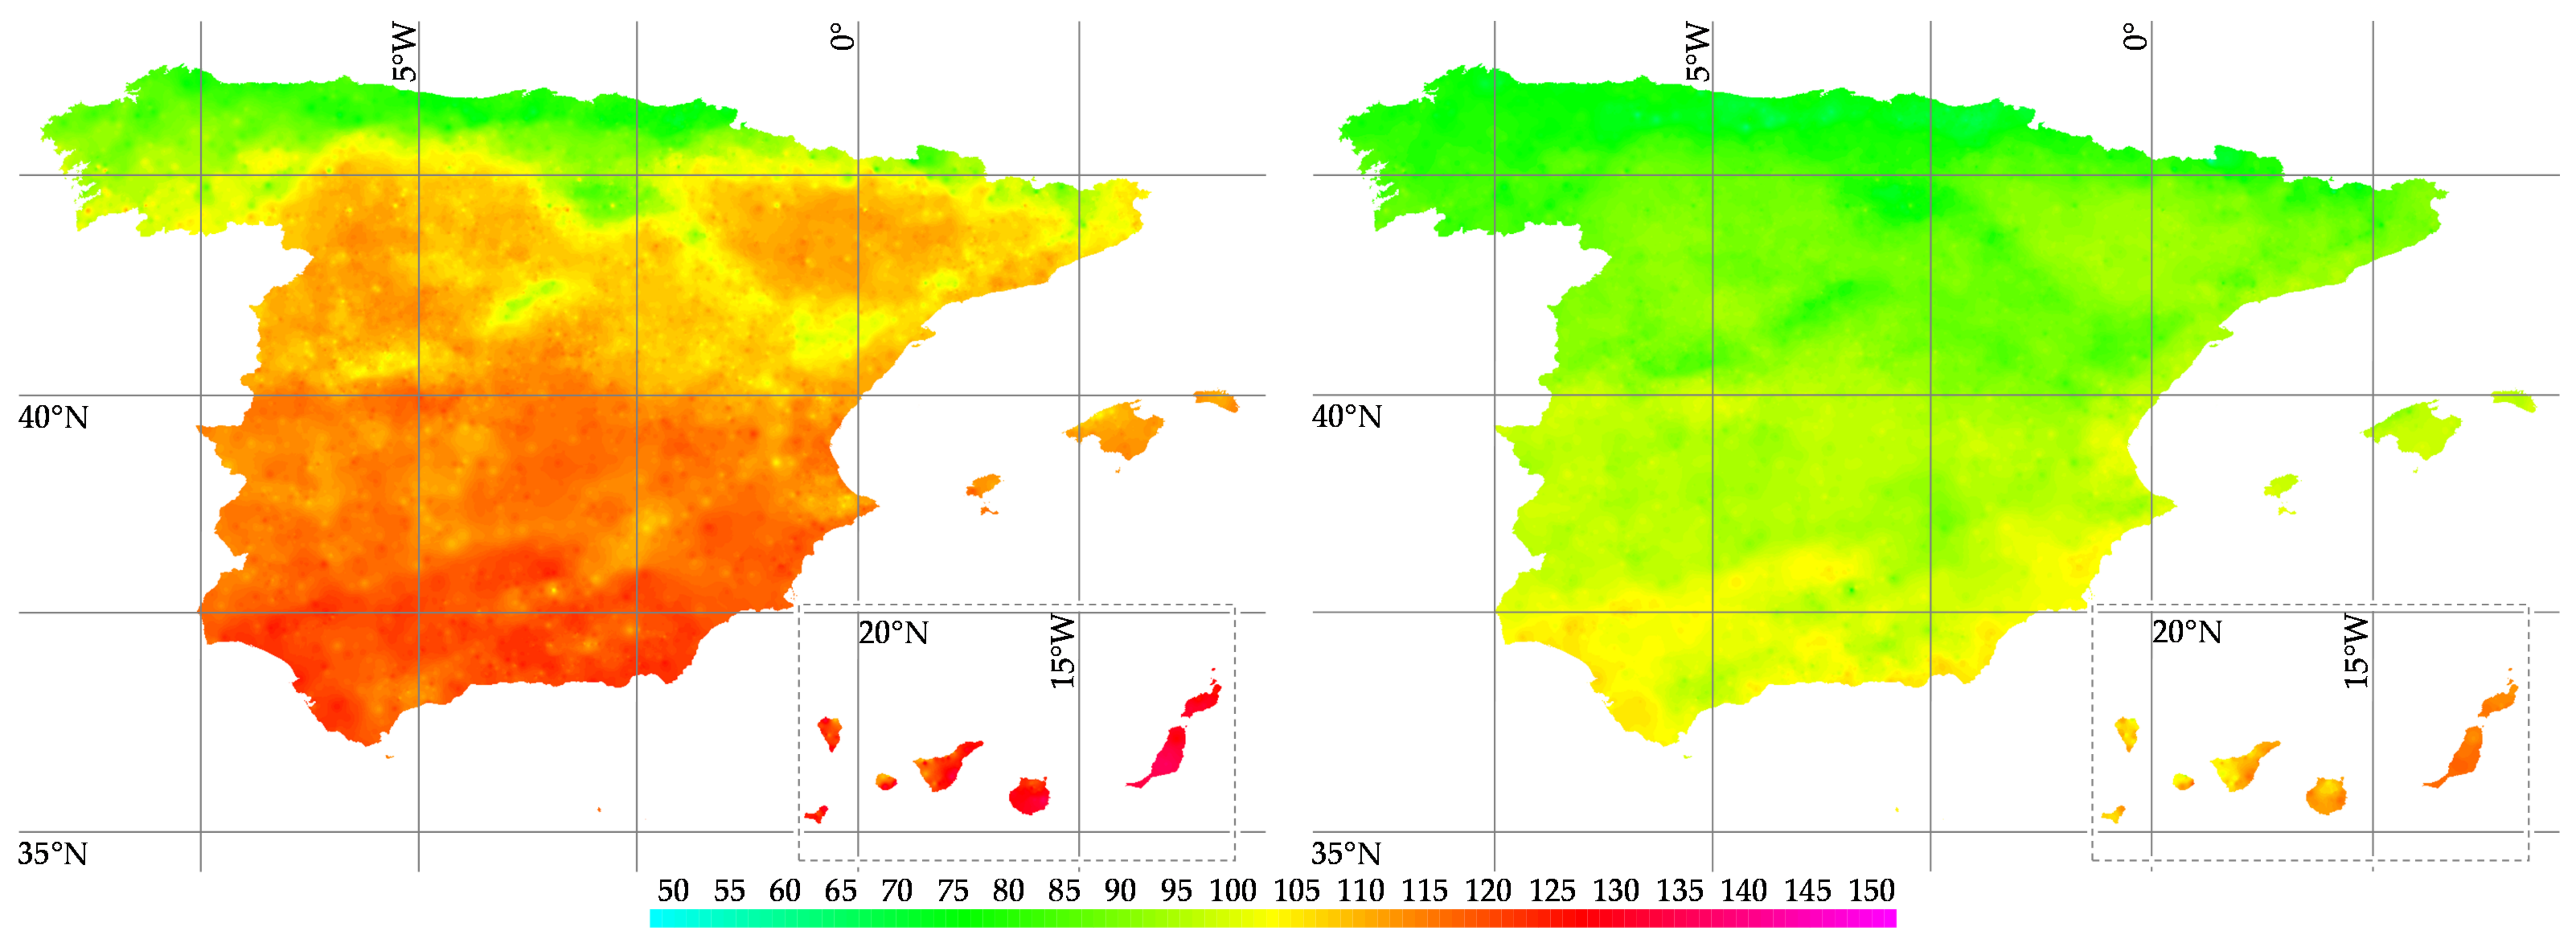
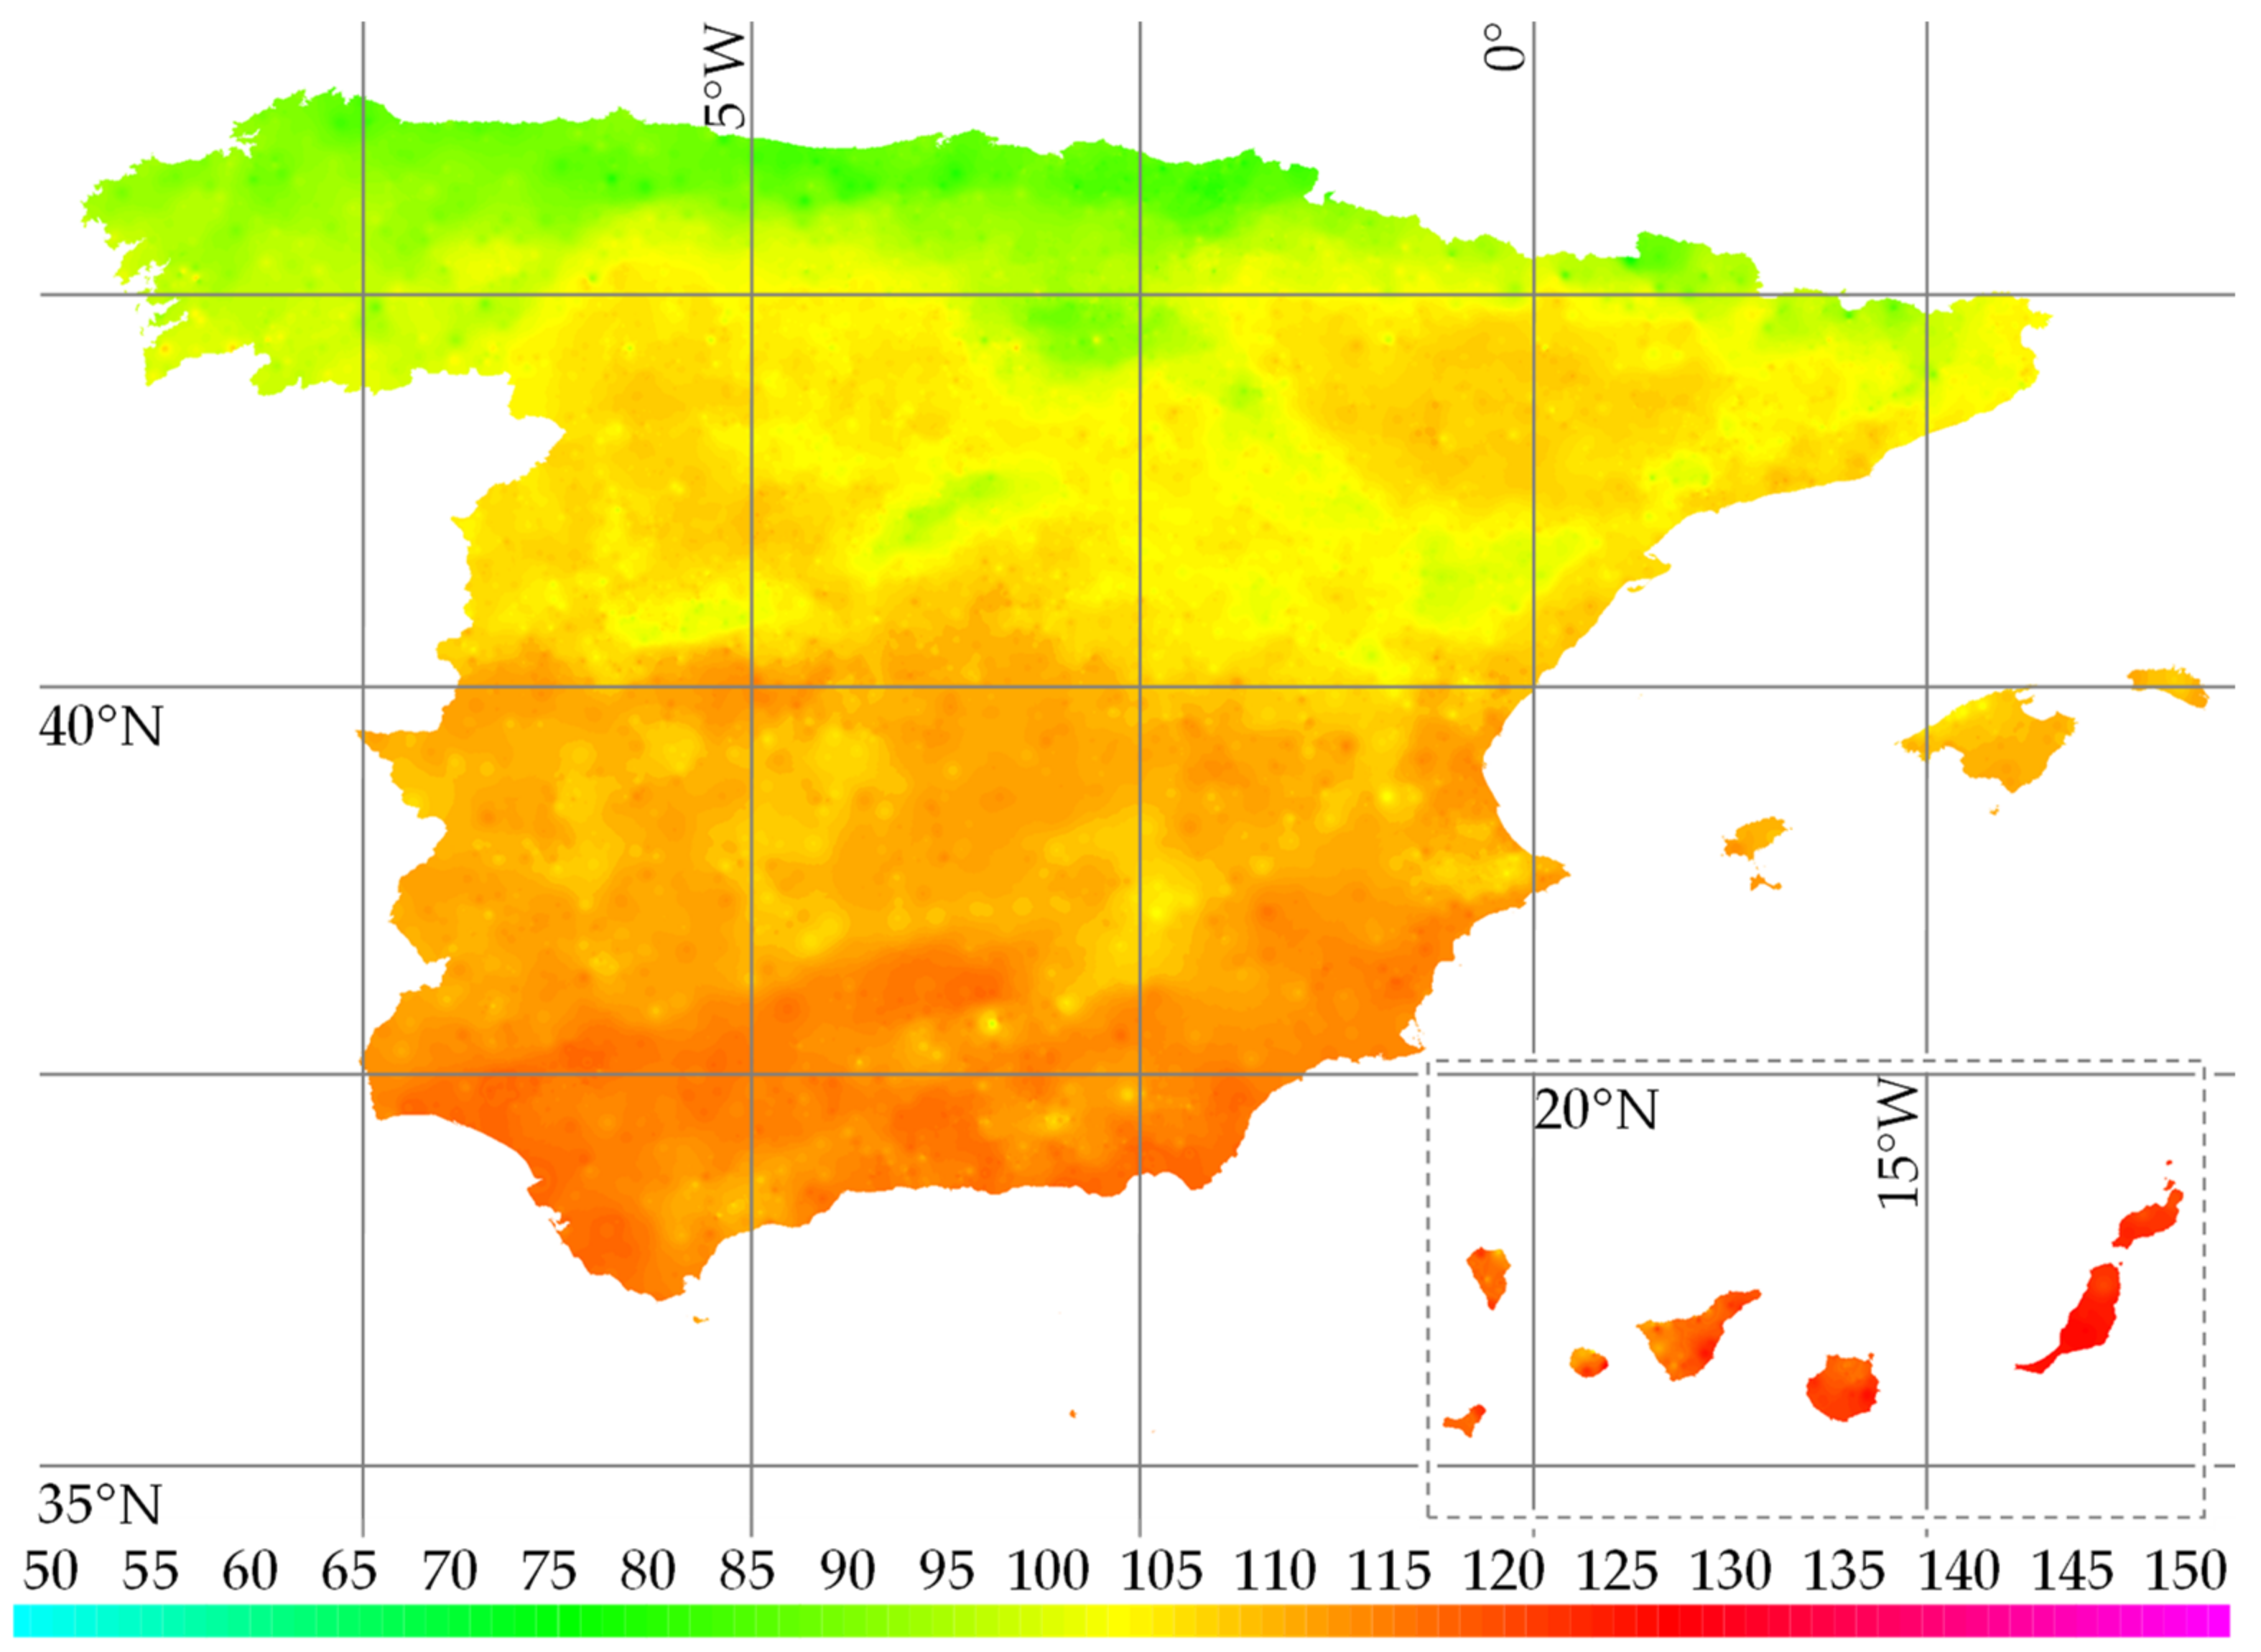
On an energy level, commercial solutions for PV and ST systems have been considered. For the PV application, savings range 71–135%, with an average of 105%. This means the PV system produces more electricity than the average household consumes in 6372 municipalities (78% of the total number). For the ST application, savings range 60–115%, with an average of 89%. This means the DHW demand is saved in 335 municipalities (4% of the total number) and at least 80% partially saved in other 6852 municipalities (88% of the total number). In addition, if both systems are combined, savings range 66–126% of the entire energy needs of a household, with an average of 97%. This means 3152 municipalities produce more energy than they really need (40% of the total number). With these results, the energy savings achieved far exceed the guidelines of EPBD-2002/91/EC (20% by 2020) and EPBD-2010/31/EU (27% by 2030).
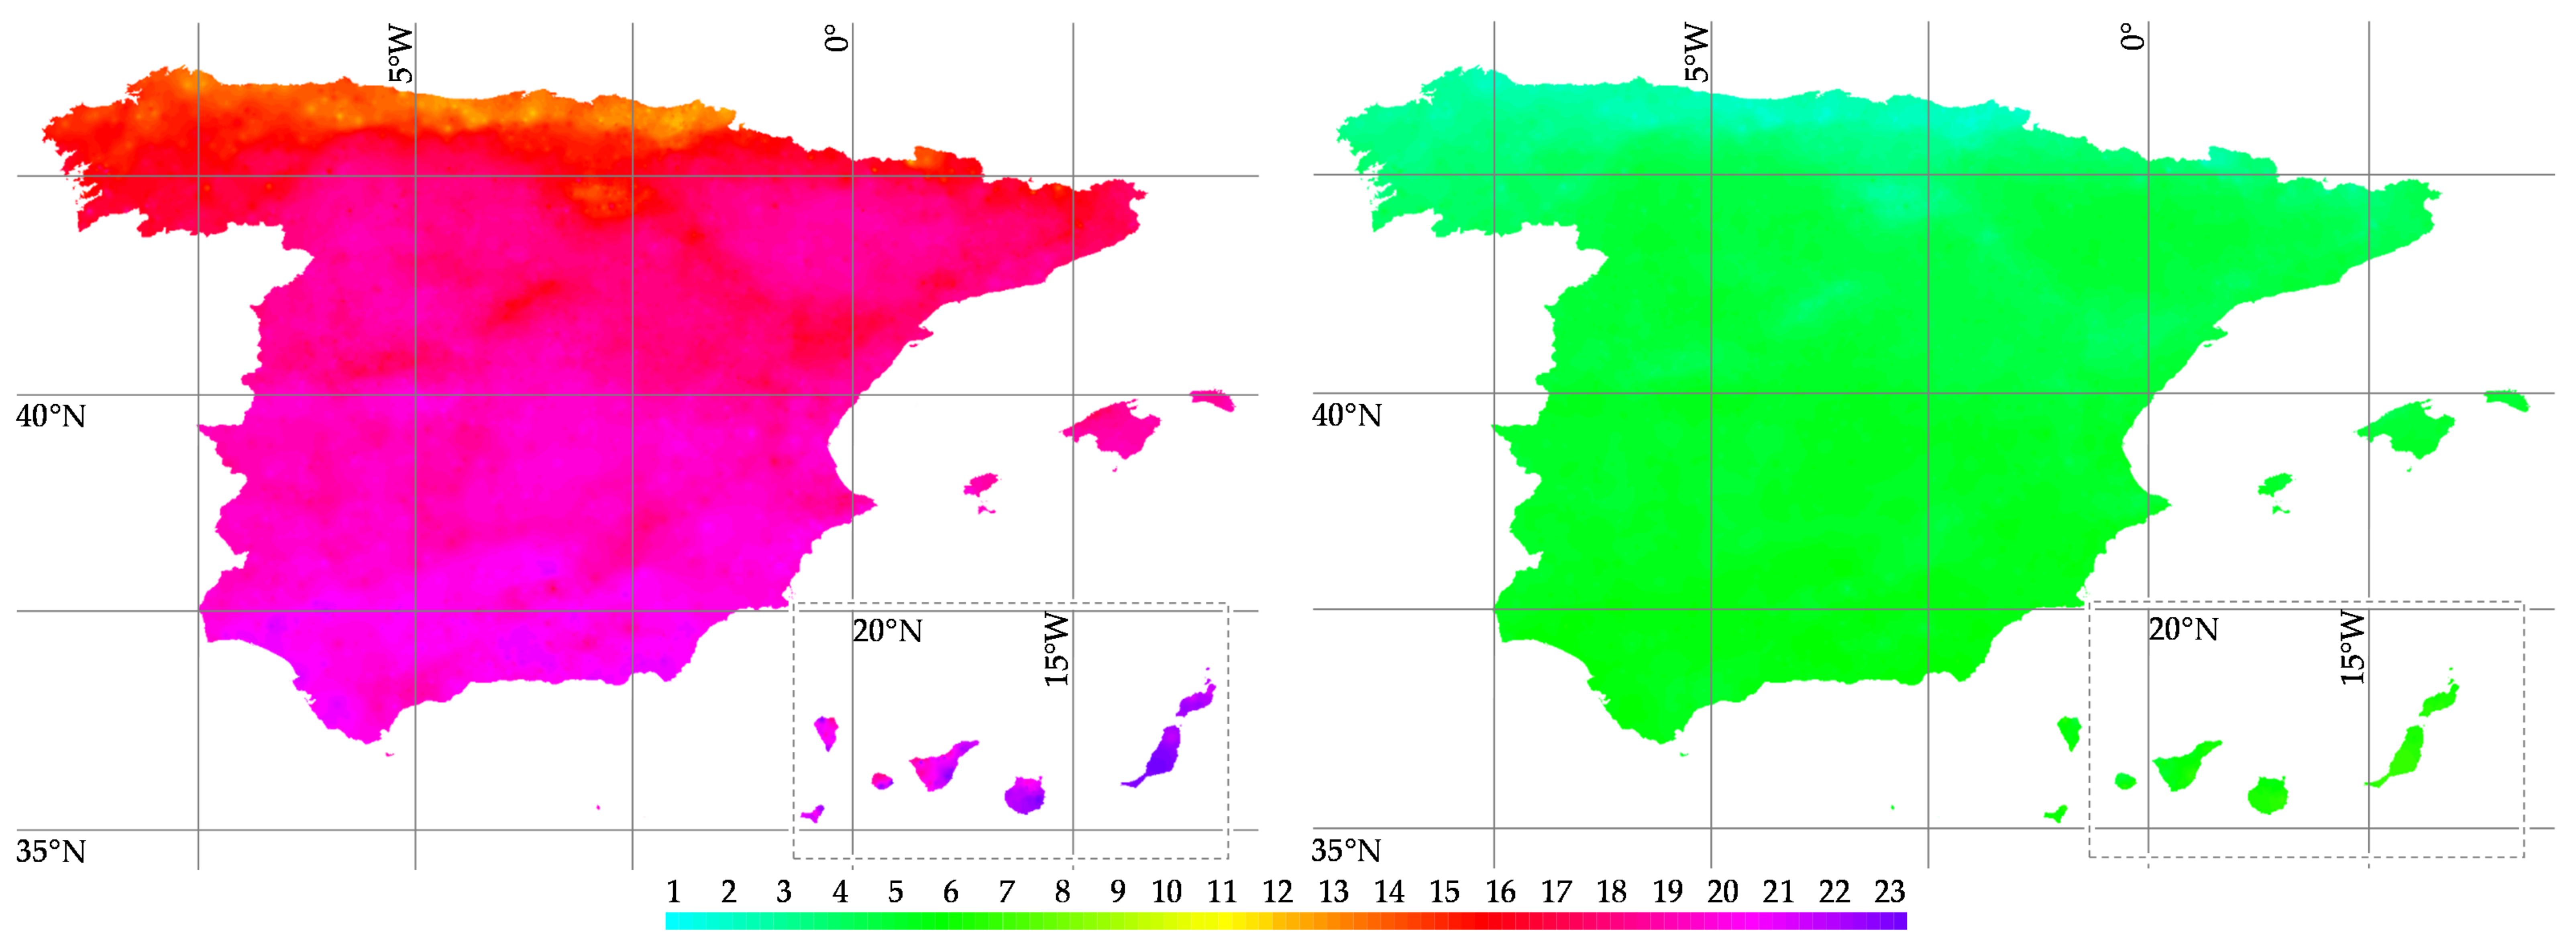
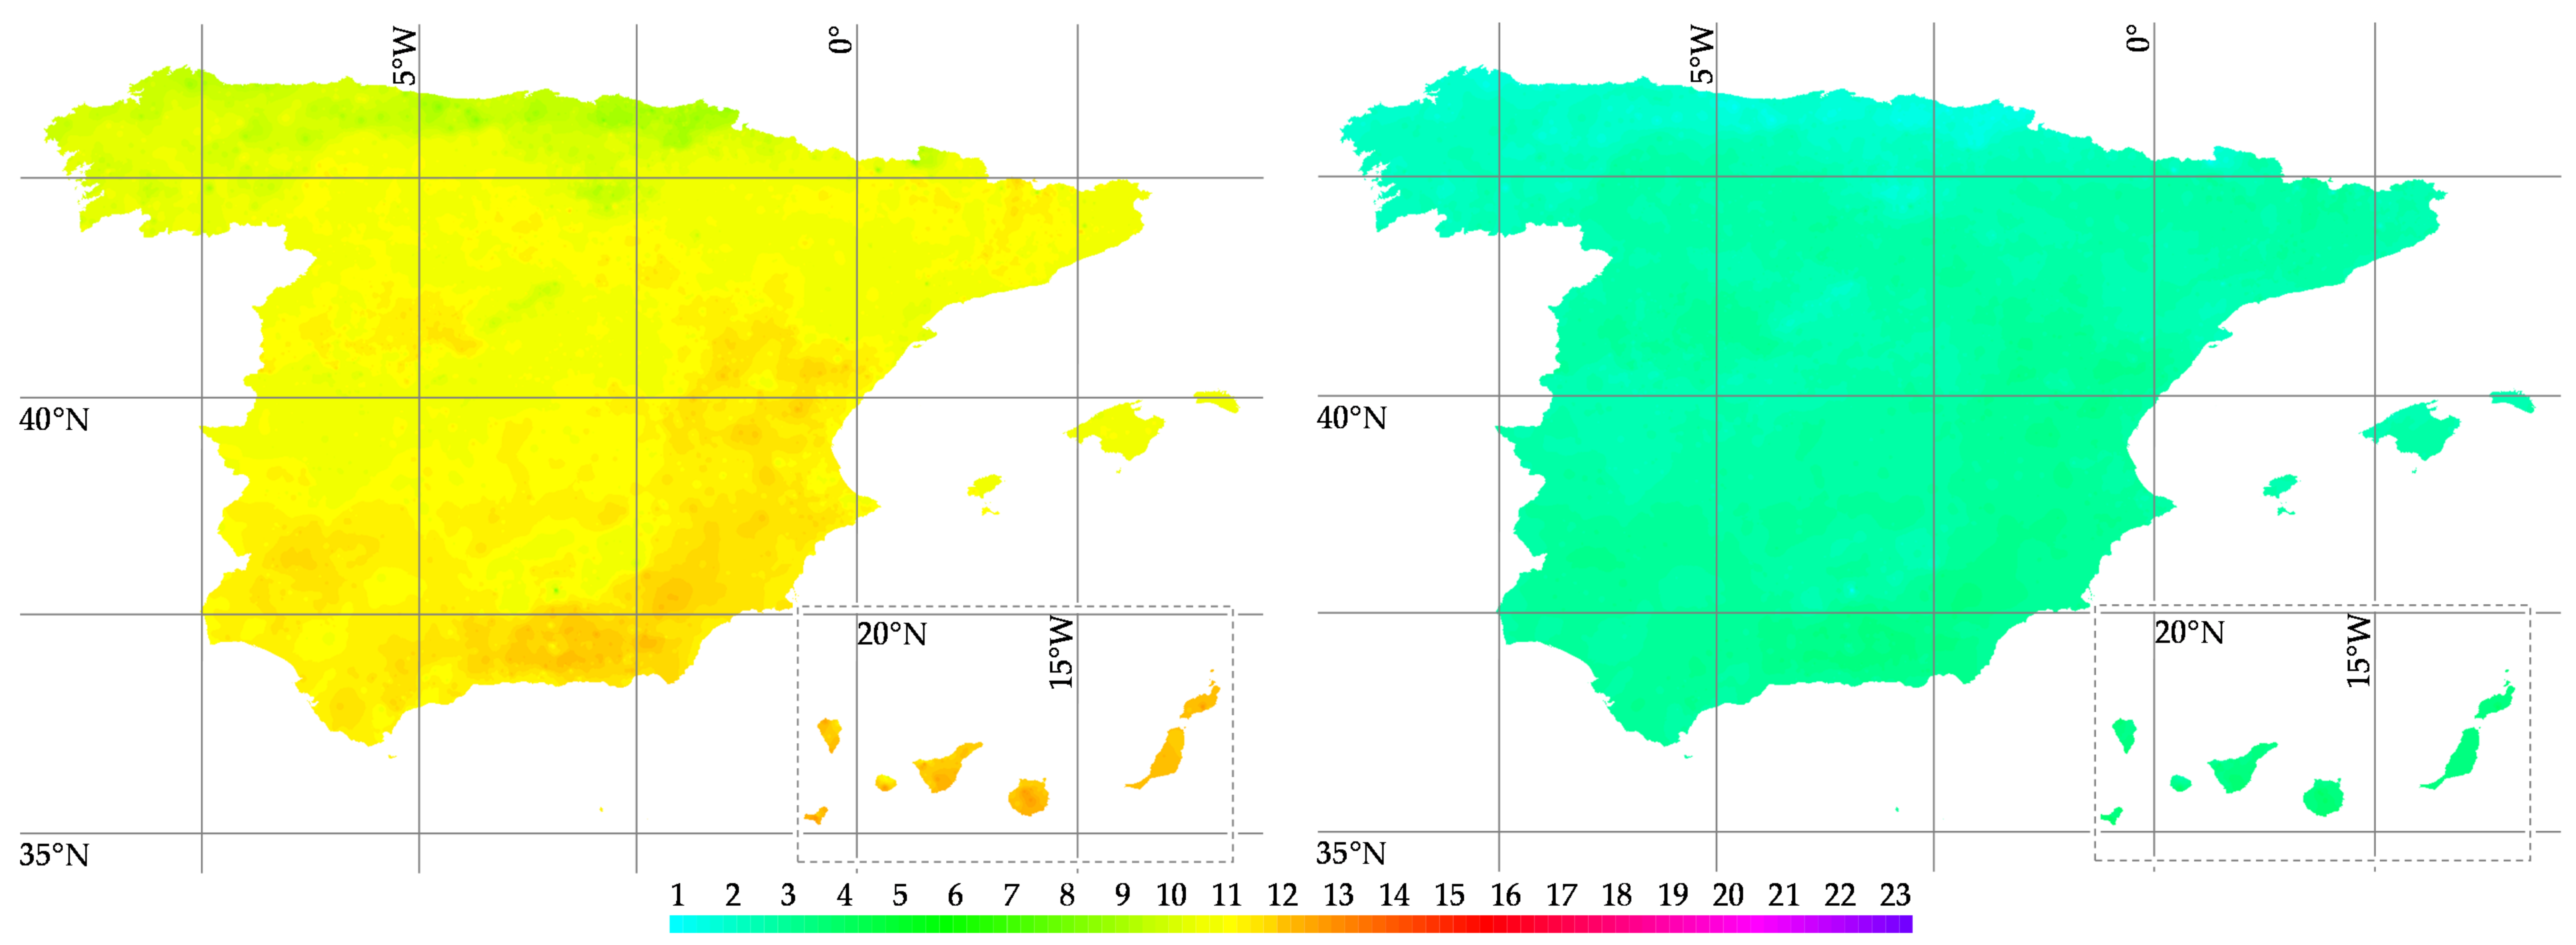
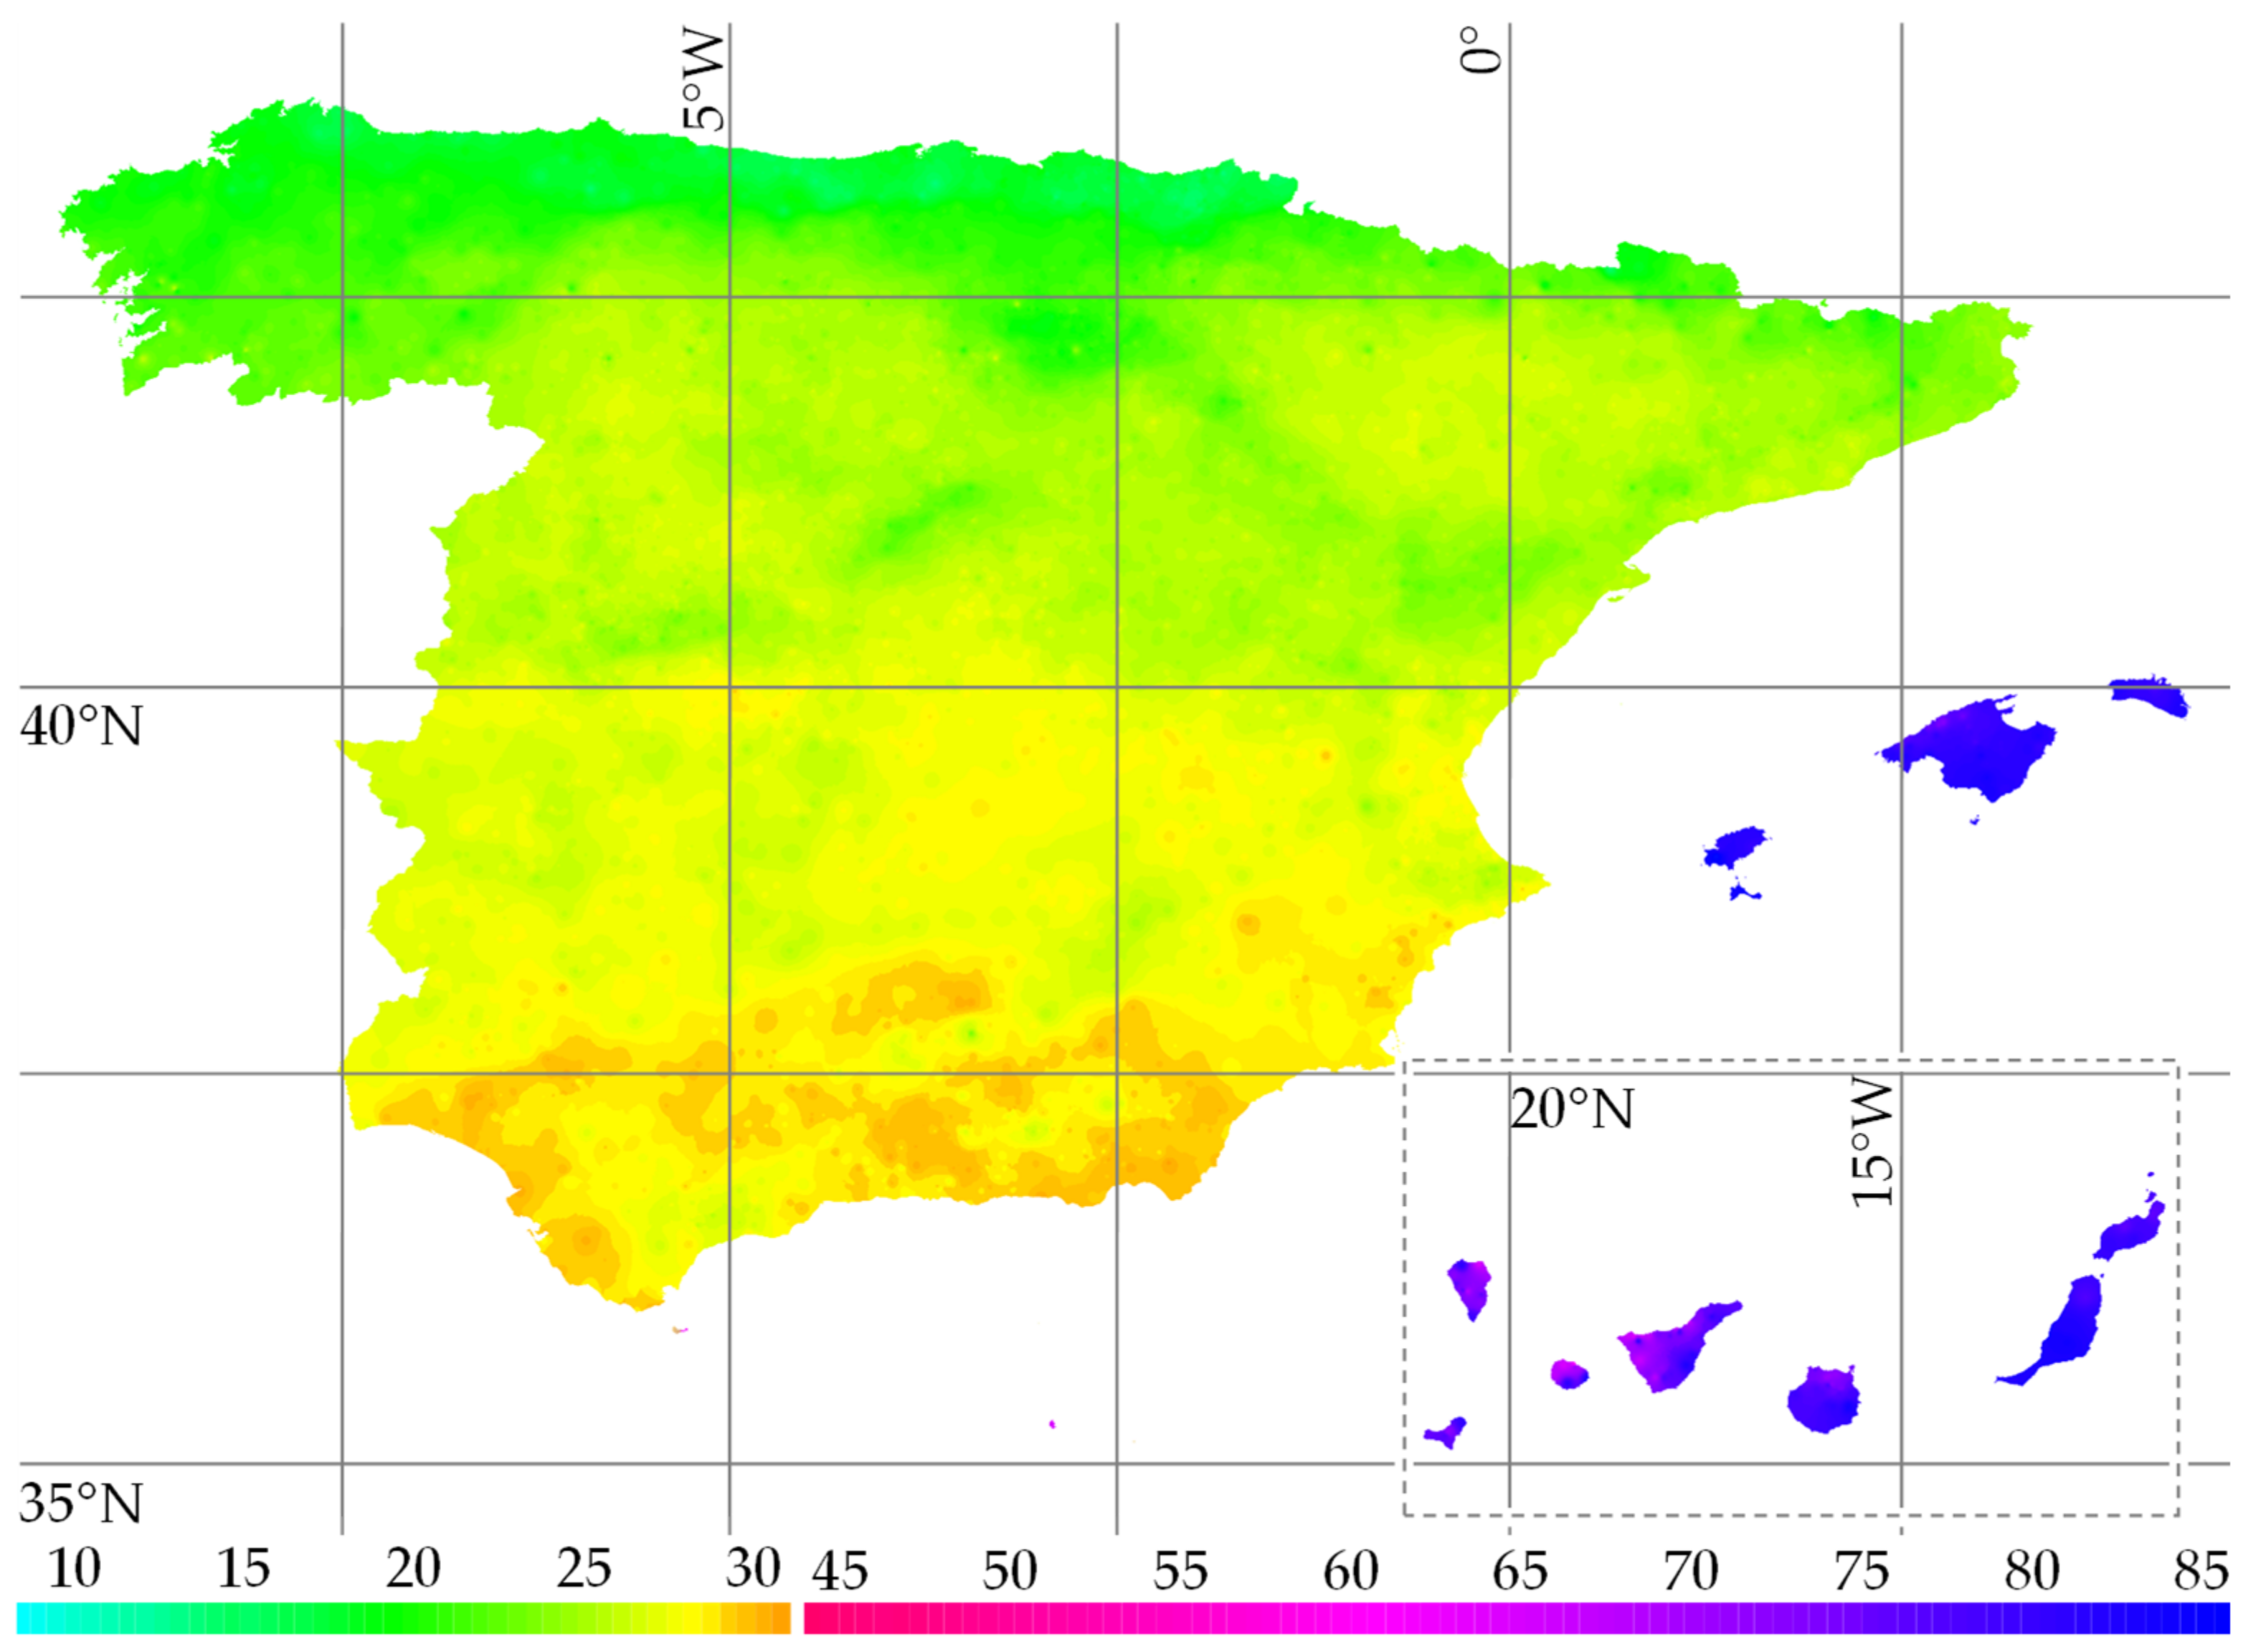
On an economic level, not all cases recover the investment in less than 30 years of lifespan, if an opportunity cost of 1% is considered. For the PV application, two extreme scenarios have been studied regarding the PV production: 100% for savings, 100% for sale. Savings range from 6.5–15.5 k €, with an average of 11 k €. However, if all the production is a surplus, the results range 0 and 3 k €, with an average of 2 k €, without no municipality with a negative balance. For the ST application, savings depend on the auxliary supply energy. If an electric boiler is the initial supplier for DHW, energy bills are reduced by 4-8 k €, with an average of 6 k €. On the contrary, if a natural gas boiler is the initial supplier, costs saved range 0–1.5 k €, with an average of 0.5 k €. In this case, the investment is not recovered in 169 municipalities (2% of the total number).
If the investment is divided by the annual energy production, an economic ratio can be obtained, as shown in
Table 20 and
Figure 10. These check if the cost by production (in € cents/kWh) is higher or lower than the energy (electricity or natural gas) price to be considered. For the PV saving scenario and the ST electricity one, 18.78 € cents/kWh is used for the calculations. These prices are higher than the trend indicated by Eureletric (about 19–21 € cents/kWh). For the PV surplus scenario, 6.42 € cents/kWh is used for the calculations. For the ST natural gas scenario, 7.20 € cents/kWh is used. These are lower than the trend indicated by Eureletric (about 8–9 € cents/kWh). If the ratio effort is lower than the prices considered, the initiative will be economically profitable.
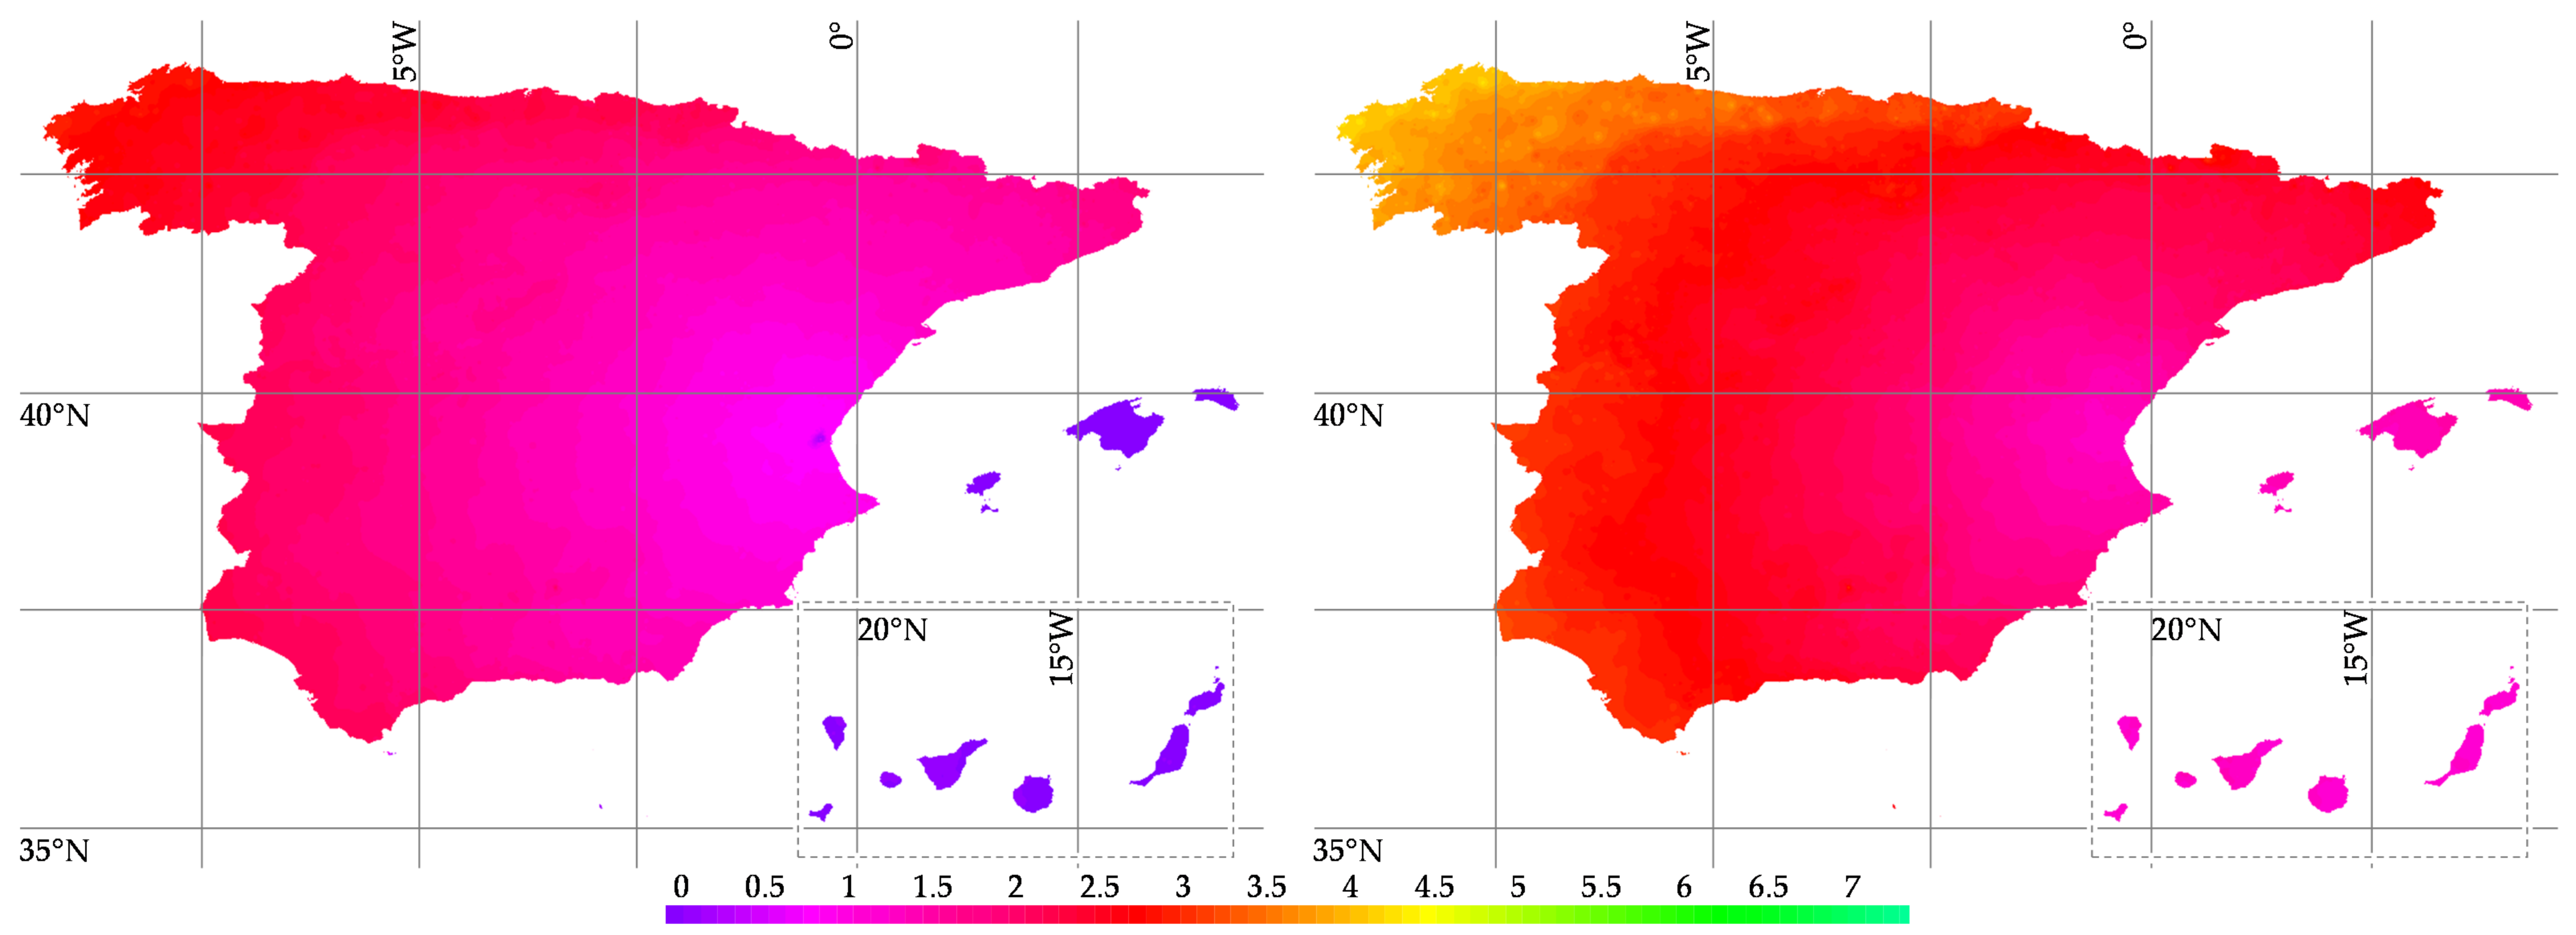
Regarding emissions, the CO
2eq emission transfer factors approved by the Permanent Commission for Energy Certification (EPC Advisory Committee) have been considered, both for electricity and natural gas, as shown in
Table 11. In addition, initial, operational and maintenance emissions as a result of including a PV system and/or a ST one have also been tested. For the PV application, emmisions saved range between 15–87 tons of CO
2eq with an average of 26 tons (24 in Mainland and 78 in the islands and autonomous cities). For the ST application results depend on the auxliary supply energy. If an electric boiler is the initial supplier, the emissions saved range between 14–56 tons of CO
2eq with an average of 19 tons (18 in Mainland and 52 in the islands and autonomous cities). On the contrary, if a natural gas boiler is the initial supplier, the emissions saved range between 9–16 tons of CO
2eq (without significant differences between the Mainland and the rest of the country). Analysing the annual emissions balance, the guidelines laid out in directives EPBD-2002/91/CE (20% by 2020) and EPBD-2010/31/UE (40% by 2030) are far exceeded once more.
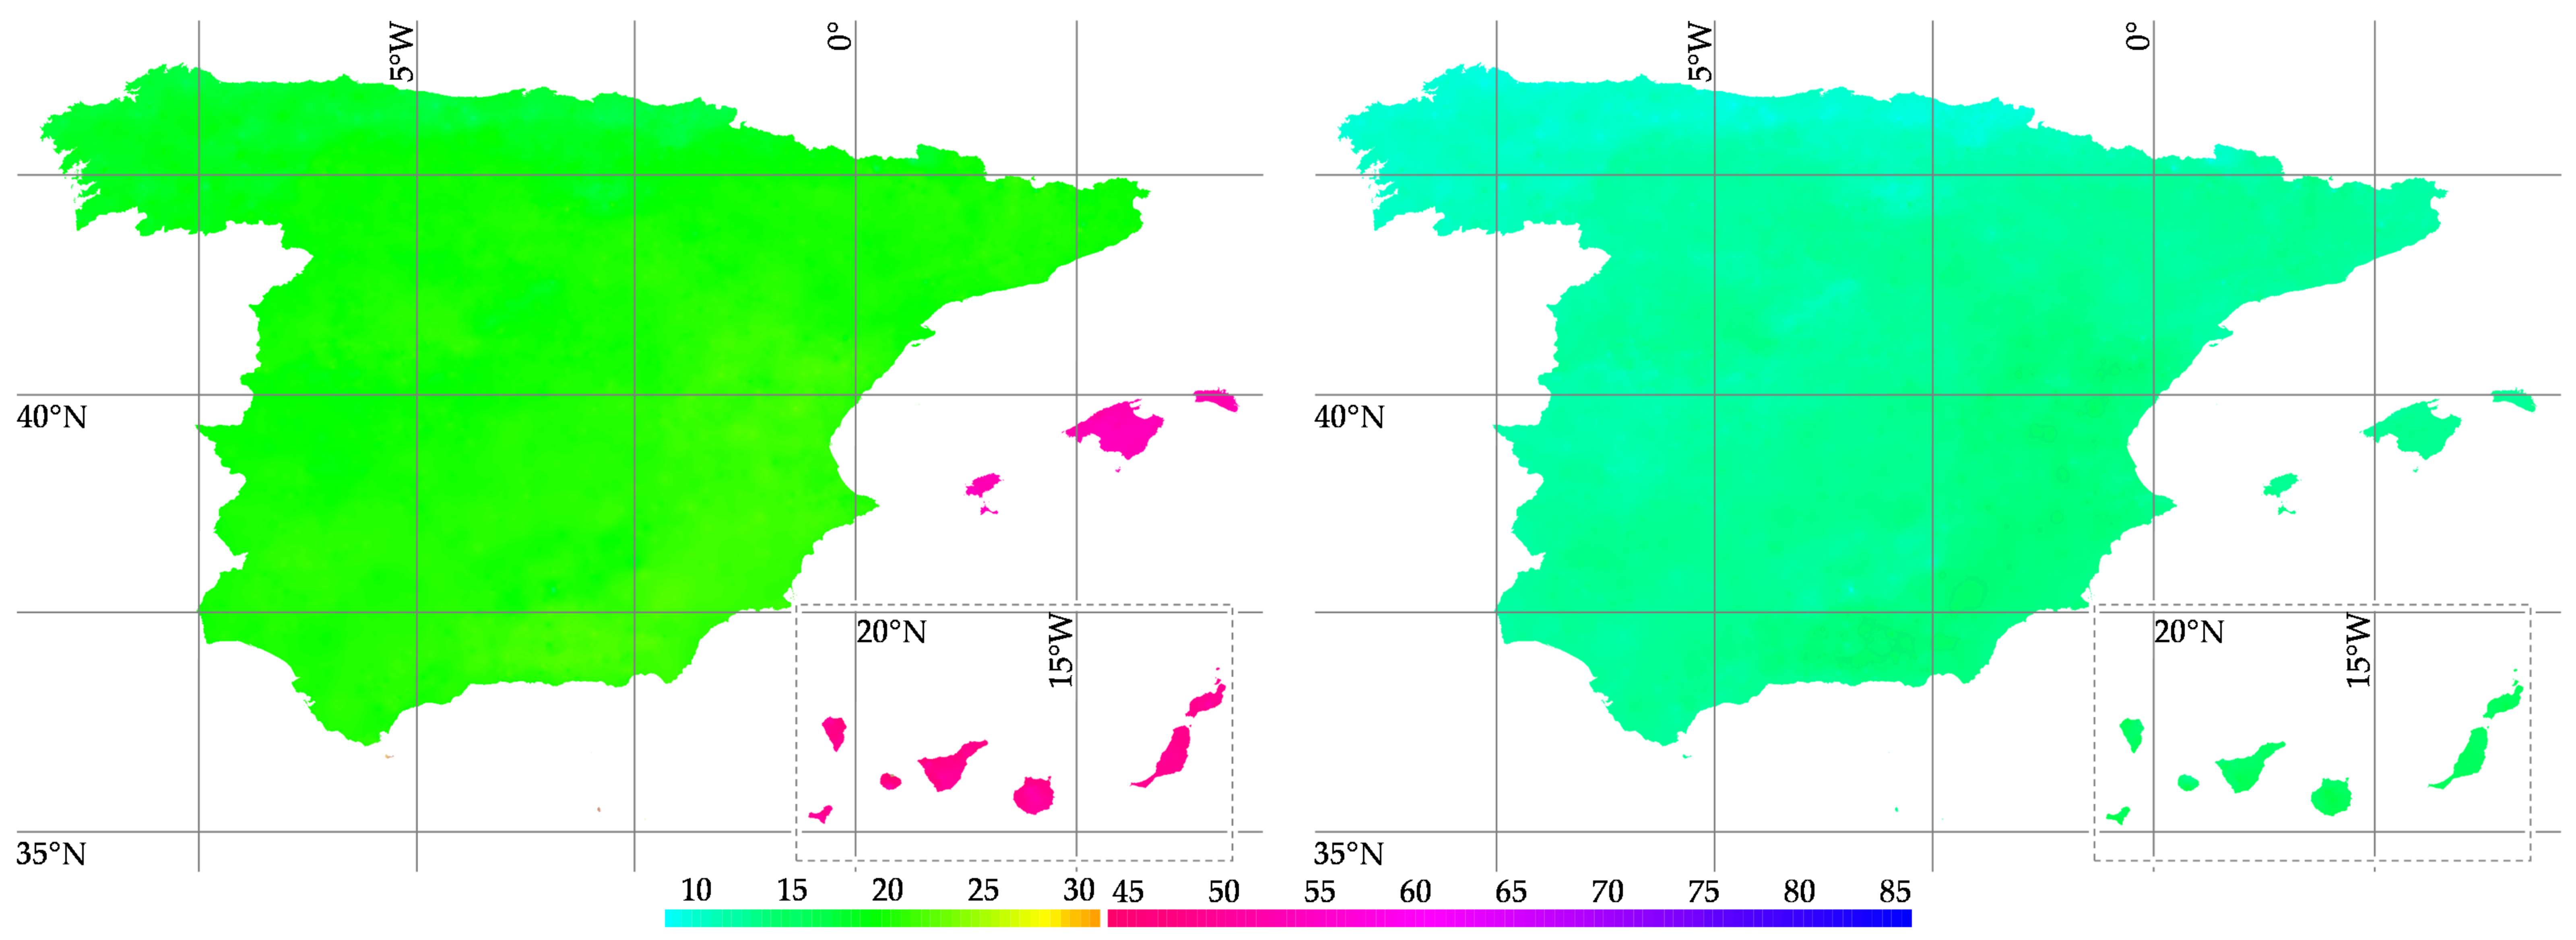
If PV and ST emissions are divided by the annual energy production, an environmental ratio is obtained, as shown in
Table 21 and
Figure 11. These check if the emissions by production (in g CO
2eq/kWh) are higher or lower than the energy emissions to be considered. For S1, S2 and S3, 331 g CO
2eq/kWh in the mainland, 721 in the Autonomous Cities of Ceuta and Melilla, 932 in Balearic Island or 776 in the Canary Islands are used for the calculations. For S4, 252 g CO
2eq/kWh is used in the entire country. If the ratio effort is lower than the emissions considered, the initiative will be environmentally profitable. It can be noted that all the scenarios studied are, from this point of view, extremely promising.
If the PV and ST emissions are studied according to the lifecycle phase, weighting strongly varies from one system to another. For the PV application, the manufacturing phase ranges 78–89% of the total emissions, logistics ranges 0–12% and maintenance ranges 10–11%. On the contrary, for the ST application, the manufacturing phase ranges 27–52% of the total, logistics ranges 0–48%, operation ranges 19–64% and maintenance ranges 1–3%.
The energy efficiency of buildings has been analyzed in most Southern European countries, such as Greece [
67], Italy [
68], Portugal [
69] and Turkey [
70], as well as Spain [
32,
71,
72]. However, these studies use cases of multifamily buildings by climatic zones or located in a specific geographic area. They are focused on comparing the primary energy consumption before and after transposition of the EPBDs, for which they usually define the envelope and calculate the heating, cooling and DHW demands. However, they usually avoid including economic or environmental issues, as well as the use of renewable energies as alternative methods of generation. In addition, most studies related to improve the energy efficiency and thus the environmental performance are focused on new buildings instead of renovation of existing ones. However, there are additional measures that can lead to further energy efficiency improvements. In this context, the inclusion of renewable energy sources arises for reducing the energy consumption, GHG emissions and energy bills. It can be noted that, although the selection of renewable sources depends largely on climate, the countries with the lowest solar potential (Northern and Central European countries) have the highest electricity and natural gas prices [
73] and even some of them a higher emissions factor due to the use of carbon-based sources (for example, Germany is currently at 411 g CO
2eq/kWh according to Eurostat, about 25% higher than Spain).
Regarding the solar systems included in this research, Ref. [
74] studied a domestic PV system in one municipality of France (Marseille) and two municipalities of Spain (Madrid and Seville). Their objective was to optimize the PV system by location, based on two assumptions: not returning surplus to the grid and not storing surplus energy. Despite its higher potential, the Spanish ones were dimensioned at 1.5 kWp and the French one at 2.5 kWp. This was due to four reasons: different cost of photovoltaic facilities, variable electricity prices, Spanish tax to be paid (before the entry into force of RD 244/2019) and France’s higher energy needs. In the case of Spain, the consumption was taken from the standard Spanish hourly profile provided by the Ministry of Industry. For the sake of simplicity, the PV production was obtained thanks to an online tool based on the local irradiance for each month and geographic position. Other variables influencing the PV production were also avoided.
Ref. [
75] analyzed the economic and environmental impacts of substituting coal-fired electricity with PV power. The economic assessment was done through an input-output analysis, including considerations about employment, household incomes, net government tax revenue and gross domestic product that results from power generation. On the other side, the environmental analysis was based on a life cycle approach, and not only considered GHG emissions, but also SO
2, NOx and TSP emissions, and even water consumption. Geographical nuances were also excluded.
Ref. [
76] reviewed 153 lifecycle studies covering a broad range of wind and solar PV electricity generation technologies to finally identify 41 of the most relevant, recent, rigorous, and original ones. Their results showed that PV energy generated a range of GHG emissions of 1 g CO
2eq/kWh to 218 g CO
2eq/kWh, where the mean value was 49.91 g CO
2eq/kWh, which are compatible with the results achieved in this research. Accordingly, although solar technologies are not “carbon-free”, they can be considered as “low-carbon”. Finally, Ref. [
24] assessed a domestic ST system in the United Kingdom (UK) to measure its sustainability for partially attending the DHW demand. For the sake of simplicity, the ST production was obtained considering a national average solar irradiation and a constant efficiency was assumed.
Regarding the literature discussed, the energy simulation allows us to determine with higher precision and reliability the economic and environmental results, which is important in those locations in which results are not extremely clear and the decision must be made with more and better information. In addition, the use of a GIS technology allows a GIS-based approach to energy performance assessments of buildings at urban level. The findings of this work can be used by policymakers as guidelines for the development of national strategic plans and financial incentives for the promotion of small-scale residential solar thermal and photovoltaic applications, as well as by designers, supervisors, managers, and developers to include them in their new construction or renovation projects.


