1. Introduction
Wind turbine system technologies are under continuous development. To obtain higher efficiency, the diameter of the blades of wind turbines is continuously increasing, and their installation environment has moved from onshore to offshore bottom-fixed and further to floating offshore. Floating offshore wind turbines (FOWTs) are gaining attention in recent years because of their high wind energy distribution environment and the reduction in problems associated with their locations and complaints from local communities. FOWTs are installed sufficiently away from the coast and at locations with high water depth. Therefore, an understanding of FOWTs requires engineering knowledge in various fields such as aerodynamic, hydrodynamic, and mooring forces, flexible multibody dynamics, and control techniques [
1].
Research on the improvement in the performance of the FOWT in terms of mechanical load, power, and floater platforms was conducted. Christiansen et al. used a control strategy based on a model that included the estimator of the wind speed and wave frequency to reduce the pitch motion of the platform while improving the power and fore–aft tower motion [
2]. Olondriz et al. used a floater platform motion feedback control (PMFC) strategy to improve the pitch motion of the platform of the floater, generator speed, and blade and tower loads using a model based on the National Renewable Energy Laboratory (NREL) 5-MW ITI energy barge [
3]. In addition, PMFC was applied to a linear model of a DTU 10-MW FOWT model to improve the power quality and reduce the pitch motion of the platform [
4]. In addition, for automatic improvement in the conventional feedback control loop, a new optimization method was proposed based on the Monte Carlo method, which retained the overall performance level of the wind turbine while reducing the mechanical fatigue load of the components [
5]. He et al. proposed a combined pitch and trailing edge flap control method that combines individual pitch control (IPC) and trailing edge flap control to reduce the mechanical load of a wind turbine, thereby improving its power efficiency and significantly reducing the loads of the tower and blade [
6]. Ward et al. applied the active pitching-to-stall method to a semi-submersible FOWT to reduce the oscillations in the power output and the mechanical load of the tower [
7]. Oh et al. improved the power performance and reduced tower fore–aft oscillations by adjusting the bandwidth through two-mode switches based on a high wind speed of 18 m/s [
8].
Most of the previous studies investigated the control in conditions that were above that of the rated wind speed, but in this study, a control algorithm was designed to address the resonance problem in the torque control region for conditions below that of the rated wind speed. In general, FOWTs are developed using adequate tests for floater platform design, such as numerical analysis of the floater design and water tank model experiments, and a commercial offshore wind turbine is combined after completing the tests and verification. Since it is not common to develop floaters and wind turbines at the same time from the initial stage of the design, significant problems may arise in terms of structural oscillations. The resonance problem of the tower amplifies tower oscillations in a specific operating region and acts as a serious stressor, which may lead to an increase in fatigue load and negatively affect the design lifetime of the wind tower [
9]. These problems can be addressed by redesigning the tower such that the excitation frequency based on the rotational frequency of the operating area and the oscillation mode of the tower can be separated by installing a tuned mass damper (TMD). However, lowering the tower oscillation mode requires several considerations, such as satisfying the design load case, balancing of the floater and cost reduction, and the method of TMD installation, consequently increasing the costs involved [
1].
In a previous study, a resonance avoidance control algorithm was designed, and the simulation results showed a 40% reduction in the mechanical load of the wind turbine tower base, although there was a small decrease in the mean power [
1]. The simulation was performed for only 600 s to verify the performance of the control algorithm, and the wave conditions were not considered; thus, the impact on the floater platform and mooring lines could not be analyzed. In the resonance avoidance control algorithm, two vertical sections were designed before and after the resonance revolution per minute (rpm) through proportional–integral (PI) control to pass through the resonance point quickly. Because the zone between these two vertical sections, that is, the exclusion zone, causes power loss, optimization of the exclusion zone is required. This is because an overly wide exclusion zone can interfere with maximum power point tracking (MPPT) control.
Therefore, in this study, a resonance avoidance control algorithm was designed for a FOWT generating tower resonance, and the performance differences based on the range of exclusion zones were evaluated. The simulation was performed for 3600 s using Bladed by Det Norske Veritas, a commercial analysis software for wind turbine systems, to obtain the statistical results of the control algorithm on the floater [
10]. In the simulation, wind conditions were selected so that the rotor could be operated with speed in the resonance region where possible, and the wave conditions were assumed to be somewhat rough for extreme comparison with the results of the preliminary study.
The remainder of this paper is organized as follows:
Section 2 presents a brief description of the target FOWT and model validation for this study.
Section 3 describes the control algorithm.
Section 4 describes the simulation environment. In
Section 5, the baseline control algorithm and the proposed control algorithm are compared through simulation, and the discussion of the simulation results is presented. Finally,
Section 6 presents the conclusions of this study.
2. Target Wind Turbine System
The target wind turbine system considered in this study is a semi-submersible FOWT that combines a foundation proposed by the DeepCwind Consortium with an National Renewable Energy Laboratory (NREL) 5-MW offshore wind turbine. The model was used in various studies. Kim et al. performed a model test in an ocean engineering-wide tank at the University of Ulsan (UOU) with a 1:80 scaled model of Offshore Code Comparison. Collaboration Continuation (OC4) FOWT and compared it with numerical simulation results by FAST + OrcaFlex, and UOU In-house code [
11]. Hu et al. analyzed dynamic responses of OC4 FOWT under various conditions, including emergency shutdown [
12]. Liu et al. improved the dynamic performance in the surge, heave, and pitch motion of OC4 FOWT by increasing the number of offset columns under the same conditions for total weight [
13]. Benitz et al. compared the simulation results of hydrodynamic load between FAST HydroDyn module and computational fluid dynamics (CFD) software package OpenFOAM [
14]. Si et al. proposed a new hybrid floating wind and wave power generation platform integrating OC4 FOWT and wave energy converters (WEC) [
15]. Li et al. analyzed the dynamic properties variation of OC4 FOWT by yaw error and wind–wave misalignment [
16]. Emami et al. proposed applying poro-elastic layers (PELs) at the bottom of the pontoon to reduce the heave motion response of the OC4 FOWT [
17].
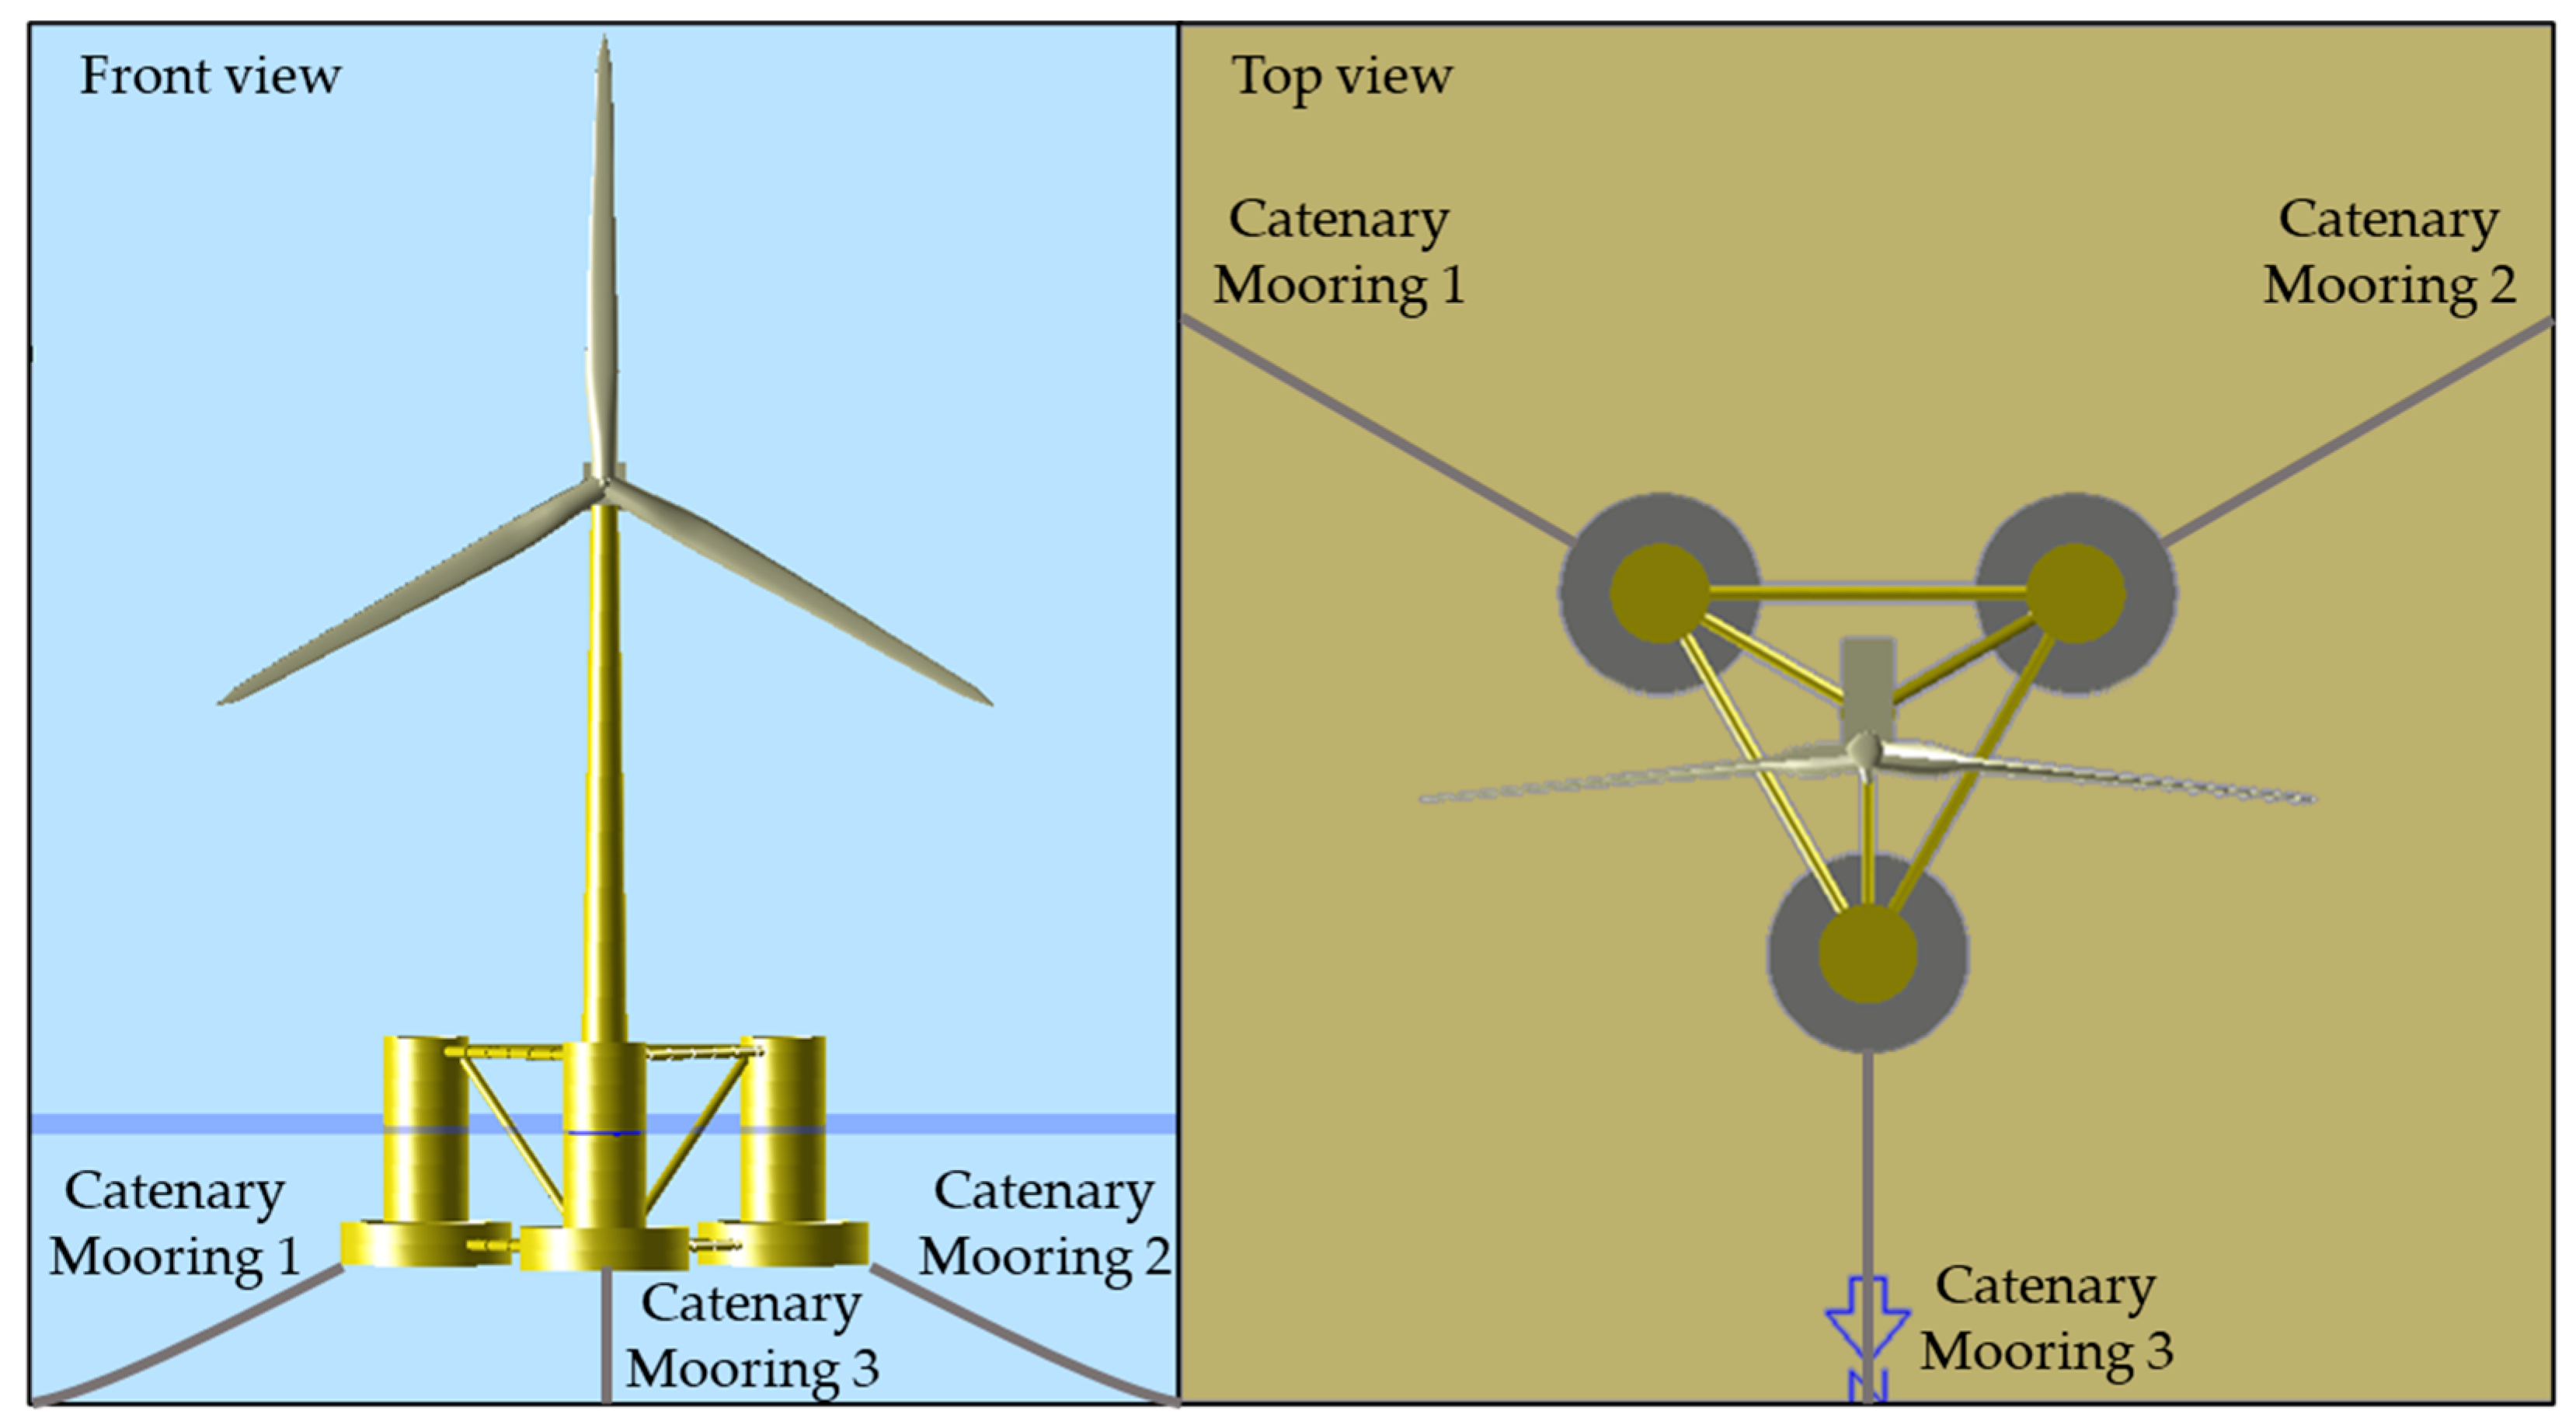
Figure 1 shows the front and top views of the target wind turbine system. Pontoon and brace members connect the main column that is joined to the tower and the three offset columns, and the mooring lines are connected to the top of the three offset columns [
18].
Table 1 shows the gross properties of the wind turbine, floater, and mooring lines of the OC4 FOWT system [
18,
19]. The height of the wind turbine tower was reduced by 10 m compared to the conventional bottom-fixed wind turbine system, and the diameter of the tower base increased from 6 m to 6.5 m, and the tower mass was reduced by approximately 28.1%.
Figure 2 shows the Campbell diagram of the OC4 FOWT system calculated using the Bladed software. The Campbell diagram was used for the resonance analysis of a rotating structure composed of a number of mechanical components. The x-axis is the excitation frequency and the rotor speed. The y-axis is the natural frequency of each mechanical component. The notations from 1P to 9P indicate one to nine times the rotational frequency, respectively, and the resonance occurs at the excitation frequency in which this component overlaps with the natural frequency of a specific mechanical component, which is within the operating range. In general, resonance occurs at the rotor speed overlapping with the 1P harmonic component (1P, 2P, and 3P) in the case of the blade-first mode and at the rotor speed overlapping with the 3P harmonic component (3P, 6P, and 9P) in the case of the tower-first mode. In
Figure 2, the blue line at approximately 0.4 Hz indicates the first natural frequency of the tower. The natural frequency overlaps with the 3P harmonic component at approximately 8.8 rpm. Therefore, if the rotor is operated steadily at 8.8 rpm, it will have an adverse effect in terms of fatigue load owing to the resonance of the tower.
In this study, a resonance avoidance control algorithm, including the exclusion zone, was designed to prevent this phenomenon. The exclusion zone is described in detail in
Section 3.
Figure 3 shows the steady-state response of the wind turbine. The power is kept constant owing to the pitch angle control at the rated wind speed of 11.3 m/s, and the thrust force is decreased in proportion to the pitch angle. In
Figure 3, the red line marked on the rotor speed represents the rpm overlapping the 3P harmonic component in the Campbell diagram, and the gray shaded area represents the exclusion zone. If the wind speed is constant at approximately 7.5 m/s, it can be expected that the tower of the target wind turbine will experience resonance. In this study, to examine the effect of resonance avoidance control, the wind speed applied to the simulation was set as the mean wind speed of 7.5 m/s.
In this study, the bladed floater model was verified by comparing its surge, heave, and pitch motion with that of the NREL’s OC4 FOWT free-decay response simulation published in International Energy Agency (IEA) wind task 30 [
20].
Figure 4 shows the comparison of NREL’s FAST and DNV’s Bladed results about surge, heave, and pitch free decay time series of the OC4 floater. As a result, it can be verified that the surge, heave, and pitch motion all have the same natural period and free decay motion as that of NREL. Through this, it was confirmed that the mass, inertia, and stiffness coefficient of the floater and mooring system were properly modeled. However, it is estimated that the slight difference in the attenuation magnitude is caused by the difference in the viscous damping coefficient.
The mooring system is modeled identically to the data specified in the NREL OC4 Definition Report [
18]. In this study, the mooring load according to the displacement is reflected in the look-up table format, and it was applied as a quasi-static analysis method in the time domain analysis.
3. Control Algorithms
Two types of control algorithms are proposed in this study: the baseline control algorithm and the resonance avoidance control algorithm. The control algorithm in which resonance avoidance control is applied is also classified into two categories based on the range of the exclusion zone and is detailed below.
3.1. Baseline Control Algorithm
Figure 5 shows the structure of the baseline controller. The pitch control is implemented by the PI control, and it is performed with reference to the rated generator speed. The 3P component in the generator speed, drivetrain mode, and oscillation components in the blade rotation direction are offset by the notch filters. In this study, because the simulation is performed in the below-rated region where resonance occurs, the load reduction techniques related to pitch control such as tower damper, IPC, and peak shaving were not considered [
21,
22,
23,
24,
25,
26,
27,
28].
For torque control, PI control is also performed at the starting generator speed and rated generator speed, and MPPT control is performed in the region between them. For load reduction of torque control, a drivetrain damper that reduces the oscillation component of the low-speed rotating shaft was applied [
21]. The mode switch is a component that determines before and after the rated value by receiving feedback from the current generator rotation speed, pitch angle, and electrical power.
3.2. Resonance Avoidance Control Algorithm
For the resonance avoidance controller, the pitch control and mode switch are identical to the baseline controller. Torque control consists of PI control, MPPT control, relay, and logic operators to set the exclusion zone. The relay and logic operators determine the location of the vertical section using the current generator speed. The relay was set around the resonance rpm.
The torque control strategy is shown in
Figure 5 and
Figure 6.
Figure 7a shows the torque control strategy of the baseline control. In
Figure 7a, the region between 6.9 rpm and 12.1 rpm is the region where the wind turbine is operated to extract the wind energy to the maximum. In this region, the pitch angle must remain at a fine pitch angle, and the tip speed ratio must remain as defined by Equation (1).
The aerodynamic torque is defined by Equation (2).
is the optimal mode gain for each wind turbine, and this is defined by Equation (3).
In order to operate the wind turbine in the steady state of max-Cp condition for a specific wind speed, Equation (2) must be balanced with the generator reactive torque of Equation (4).
In addition, the vertical sections of 6.9 rpm and 12.1 rpm can be implemented through torque PI control. Equation (5) shows the equation of PI control.
where,
means the error between the rpm corresponding to the vertical section and the measured rpm.
In
Figure 7b,c, with reference to the resonant rotor speed of 8.8 rpm, the exclusion zone is set in the ranges of
rpm and
rpm, respectively, and is composed of four vertical sections in total. In the vertical section, torque PI control is performed to maintain the generator speed in each vertical section, and MPPT control is performed in other sections. For example, in the control algorithm set in
Figure 7b, if the wind speed gradually increases with a constant slope from the starting wind speed to the end wind speed, only the generator reactive torque command increases to maintain 6.9 rpm. Then, when the generator speed increases with the increase in wind speed, MPPT control is performed; when the generator rotor speed reaches the second vertical section (8.3 rpm), only the generator reactive torque is increased so that it does not reach the resonance region. Nevertheless, when the generator rotor speed exceeds the threshold, the reactive torque of the generator is rapidly reduced, and the generator rotates at high speed. Thus, it is possible to reduce the resonance by passing through the resonance region at high speed. The same principle applies to the opposite case. In addition, the MPPT control section is reduced owing to the resonance avoidance control, and a loss in the mean power is expected.
4. Environmental Conditions of the Simulation
Table 2 lists the environmental conditions for the simulation of the designed control algorithm. The simulation length was set to 3600 s for statistical analysis of floater behavior, and data accumulated after 50 s were passed to exclude the transient section. The mean wind speed was set to 7.5 m/s, which induces the resonance of the tower. The sea state was based on the Joint North Sea Wave Atmosphere Program (JONSWAP) spectrum. A peak period of 11.3 s and a significant wave height of 5.49 m were applied by referring to the Sea State 6 conditions of the OC4 definition [
20]. The simulation cases were composed of three types under the same environmental conditions with one baseline controller and resonance avoidance controllers with two ranges of exclusion zones.
5. Results
The simulation was performed under the conditions listed in
Table 2 in
Section 4. The simulation results are presented in the order of time domain, frequency domain, and quantitative comparison with statistical analysis. The results of the time domain were obtained by using a cut-off of only 300 s, which highlights the greatest difference between cases of resonance avoidance control out of the total 3600 s. Power, rotor speed, generator torque, tower base bending moment, and floater six degrees of freedom (DoF) motion were selected as performance indicators. The frequency domain results were obtained in terms of tower base bending moment, floater six-DoF motion, and mooring line tension. Wind-turbine performance data, floater behavior, and mooring line tension during a simulation length of 3600 s were used for quantitative comparison.
5.1. Results of Time Domain
Figure 8a presents the performance data of the wind turbine. Rotor-averaged wind speed and wave-surface elevation were the same in all cases. The rotor was operated such that the rotor speed avoided the exclusion zone shown in
Figure 7b,c as much as possible owing to resonance avoidance control. The generator torque rapidly increased or decreased to maintain the respective vertical sections. Increased oscillations can be observed owing to the effect of the generator rotor speed and generator torque in terms of electrical power. Tower Mx (tower base side–side bending moment) shows the smallest oscillations in Case B, and Tower My (tower base fore–aft bending moment) shows motion at a frequency similar to the wave-surface elevation in all cases.
Figure 8b shows the six-DoF motion of the floater and the mooring line tension located in front of the wind turbine. The time series analysis shows that the resonance avoidance control algorithm affects the sway, roll, and yaw motions of the floater. Because low-frequency responses are shown, autospectral density (ASD) or quantitative comparison is required for analysis.
5.2. Results of Frequency Domain
The ASD was used to examine the energy distribution in the frequency domain. The bending moment of the tower base is presented for wind-turbine performance data.
Figure 9a shows the tower base side–side bending moment and
Figure 9b shows the tower base fore–aft bending moment. In both cases, the peak can be seen at 0.03 Hz for the floater-pitch mode, 0.1 Hz for wave frequency, and 0.44 Hz for the tower-first mode. In both
Figure 9a,b, Case B shows the lowest tower-first mode. This indicates that the oscillation is reduced at the frequency. For a more detailed analysis, a quantitative comparison using the damage equivalent load (DEL) is required.
Figure 10 shows the ASD of the six-DoF motion of the floater. The results were confirmed to be similar to those presented in reference [
29]. In the sway position and roll motion shown in
Figure 10b,d, and the yaw motion shown in
Figure 10f, differences according to cases are seen, but the ASD results show that there was no impact on the surge, heave, and pitch, which are the main areas of interest in FOWT.
Figure 11 shows the ASD of the mooring line tension. Platform pitch mode 0.03 Hz, and a wave frequency of 0.08 Hz are shown, and similar results are shown in all cases.
5.3. Results of Statistical Analysis
Table 3 presents the results of the statistical analysis of the performance of the wind turbine. The standard deviation of the rotor speed increased by 3.09% and 14.43% in Case A and Case B, respectively, compared to the baseline control, which was caused by a rapid increase or decrease in the reactive torque of the generator due to resonance avoidance control. Contrary to expectations, the mean power decreased by 0.30% and 0.04% for Cases A and B, respectively, and the standard deviation increased to 1.19% and 4.70%, respectively, compared to the baseline control. These results indicate that the power loss due to resonance avoidance control is small, but the variability in the power increases. For the tower base bending moment, in addition to the statistical comparisons, DEL conversion was used for additional comparison to examine fatigue load. In Case A, the DEL of the side–side bending moment and fore–aft bending moment increased by 5.00% and 0.22%, respectively, but in Case B, DEL decreased by 14.02% and 0.43%, respectively, as shown in
Figure 9a.
Table 4 shows the statistical analysis results for the six-DoF floater motion. In Case A, there was no significant difference in the rate of change compared to the baseline control, except for the yaw mean value. In Case B, the rates of change in sway, roll, and yaw were significantly higher than those of the baseline control. With respect to sway, the minimum, mean, maximum, and standard deviation in Case B show differences of 8.11%, −450.00%, 231.43%, and 100.00%, respectively, compared to the baseline; with respect to the roll, the differences are 14.29%, −9.09%, 3.23%, and 0.00%, respectively; with respect to yaw, the differences are −4.38%, 0.00%, 13.01%, and 2.33%, respectively.
Table 5 shows the results of the statistical analysis of the mooring line tension for the different cases. Case A showed a difference of less than 1% in all but the standard deviation of Mooring line 3 compared to the baseline, whereas Case B showed a difference of 2.43% and 9.38% in the minimum and standard deviation of the mooring line 1 tension, respectively.
6. Discussion
In this study, wave conditions that were not considered in the preliminary study were added, and the range of the exclusion zone of the resonance avoidance control algorithm was divided into two cases and compared with the baseline control algorithm. The resonance avoidance control algorithm of the two cases performed control to avoid the exclusion zone. As the wave frequency component was added to the rotor speed owing to the effect of the waves, cases in which the generator was operated within the exclusion zone frequently occurred. In Case A, which has a narrow range of exclusion zones, this phenomenon occurred, and the oscillations generated by the moving between the two vertical sections based on the resonance point overlapped, and the control was worse in all aspects than when the resonance avoidance control was not performed. In Case B, because the exclusion zone has a wide range and there were fewer cases of operation at the resonance rotor speed, the oscillation component was reduced, and the DEL of the tower base side–side bending moment was reduced. For the DEL of the tower base fore–aft bending moment, the effect of resonance avoidance was insignificant because the wave conditions had a greater impact.
With regard to the floater, the control algorithm had some impact on the sway, roll, and yaw motions with a decrease in the tower base side–side bending moment. In the case of surge, pitch, and heave motion, the main areas of interest in FOWT had a more dominant impact, and thus, the control algorithm had little impact.
As for the mooring line tension, the change in the control algorithm influenced the rotor rotation, thereby increasing the standard deviation in the tension of mooring line 1 located on the side, and this effect was insignificant.
In the preliminary study, the wave conditions were not considered, and resonance avoidance control was performed in an ideal environment, and the DEL of the tower base side–side/fore–aft bending moment was reduced by more than 40% [
1]. As the wave conditions were considered in this study, the performance of the resonance avoidance control was considerably reduced. In both studies, it was confirmed that the control algorithm had a relatively small impact on the floater and mooring line tension.
The resonance avoidance control algorithm applied to the FOWT in this study and the preliminary study shows that the stronger the wave conditions, the poorer the performance of the control algorithm, and the algorithm should be designed with wider ranges of exclusion to effectively reduce the tower base side–side bending moment. The tower-based fore–aft bending moment was greatly affected by the wind conditions when weak wave conditions were applied, and it was greatly affected by the wave conditions when strong wave conditions were applied. That is, under weak wave conditions or under a calmer sea state, the consideration of a resonance avoidance control algorithm is imperative for floating wind turbines where tower resonance occurs.
In a future study, we aim to design a resonance avoidance control algorithm with variable ranges of the exclusion zone in response to significant wave height and peak period such that the optimized operation can be performed under various wind and wave conditions.
7. Conclusions
In this study, we analyzed the dynamic response of wind turbines, floaters, and mooring lines at different ranges of the exclusion zone of resonance avoidance control and the effects of wave conditions by simulation. For the simulation, the baseline control algorithm and the resonance avoidance control algorithm were performed under the same conditions for 3600 s using the Bladed software. The wind speed condition was assumed to be 7.5 m/s to drive the rotor speed at which resonance occurs, and the wave condition was assumed to be a rough sea state for comparison with the preliminary study.
According to the simulation results, when the exclusion zone range was narrow, the generator was frequently operated in the resonance rpm region, and as a result, all performance indicators showed worse performances or no significant differences when compared to the baseline control algorithm. When the exclusion zone range was wide, the DEL of the tower base side–side bending moment was reduced without a significant reduction in the mean power. The performance of the algorithm was poor compared to that of a preliminary study that did not consider the wave conditions. In particular, the DEL of the tower base fore–aft bending moment did not show a significant improvement in performance compared to the baseline control algorithm because it was more dominantly affected by the wave conditions.
In addition, no significant difference in performance was confirmed in terms of the effect of the torque control algorithm on the floater motion and mooring line tension in the results of the simulation performed for 3600 s. That is, it was confirmed that although the floater motion affects the wind turbine, the torque control algorithm of the wind turbine does not affect the floater.
From the results of this study and the preliminary study, we can conclude that the tower resonance problem of FOWT caused by practical limitations in design and cost issues can be resolved by changing the torque control algorithm. Therefore, in the process of redesigning the tower of the FOWT, an approach in terms of control can be considered. In addition, the resonance avoidance control is effective in reducing the fatigue load of the tower root, which generates the largest mechanical load in the FOWT, which means the extension of the design life. In future work, the exclusion zone will be designed to vary depending on wave and wind conditions to achieve optimized performance. The findings here can contribute to the development of FOWT system technology.
Author Contributions
Conceptualization, K.K. and J.S.; Formal analysis, H.K. (Hyunjong Kim); Methodology, K.K.; Project administration, J.P.; Resources, J.S.; Software, H.K. (Hyunjong Kim) and J.K.; Supervision, K.K.; Validation, J.K.; Visualization, H.K. (Hyungyu Kim); Writing—original draft, K.K.; Writing—review and editing, H.K. (Hyungyu Kim) and J.P. All authors have read and agreed to the published version of the manuscript.
Funding
This work was supported by the Korea Institute of Energy Technology Evaluation and Planning (KETEP) and the Ministry of Trade, Industry and Energy (MOTIE) of the Republic of Korea. (No. 20193010025810, 20203040020020).
Institutional Review Board Statement
Not applicable.
Informed Consent Statement
Not applicable.
Data Availability Statement
Not applicable.
Acknowledgments
This study is based on a previously published study. And we would like to thank Editage (
www.editage.co.kr) (accessed on 30 May 2021) for English language editing.
Conflicts of Interest
The authors declare no conflict of interest.
Nomenclature
| Symbols | |
| Reference generator speed |
| Resonance frequency |
| Generator speed |
| Aerodynamic torque |
| Pitch angle |
| Maximum power coefficient |
| Pitch command |
| Design tip speed ratio |
| Electrical power |
| Rotor radius |
| Generator torque command |
| Air density |
| Optimal mode gain |
| Generator torque |
References
- Kim, K.; Kim, J.; Kim, H.; Park, J. Design of resonance avoidance control algorithm for semi-submersible wind turbine. J. Wind Energy 2020, 11, 65–72. [Google Scholar]
- Christiansen, S.; Bak, T.; Knudsen, T. Damping wind and wave loads on a floating wind turbine. Energies 2013, 6, 4097–4116. [Google Scholar] [CrossRef]
- Olondriz, J.; Elorza, I.; Jugo, J.; Alonso-Quesada, S.; Pujana-Arrese, A. An advanced control technique for floating offshore wind turbines based on more compact barge platforms. Energies 2018, 11, 1187. [Google Scholar] [CrossRef] [Green Version]
- Olondriz, J.; Yu, W.; Jugo, J.; Lemmer, F.; Elorza, I.; Alonso-Quesada, S.; Pujana-Arrese, A. Using multiple fidelity numerical models for floating offshore wind turbine advanced control design. Energies 2018, 11, 2484. [Google Scholar] [CrossRef] [Green Version]
- Olondriz, J.; Jugo, J.; Elorza, I.; Alonso-Quesada, S.; Pujana-Arrese, A. A feedback control loop optimisation methodology for floating offshore wind turbines. Energies 2019, 12, 3490. [Google Scholar] [CrossRef] [Green Version]
- He, K.; Qi, L.; Zheng, L.; Chen, Y. Combined pitch and trailing edge flap control for load mitigation of wind turbines. Energies 2018, 11, 2519. [Google Scholar] [CrossRef] [Green Version]
- Ward, D.; Collu, M.; Summer, J. Reducing tower fatigue through blade back twist and active pitch-to-stall control strategy for a semi-submersible floating offshore wind turbine. Energies 2019, 12, 1897. [Google Scholar] [CrossRef] [Green Version]
- Oh, Y.; Kim, K.; Kim, H.; Paek, I. Control algorithm of a floating wind turbine for reduction of tower loads and power fluctuation. Int. J. Precis. Eng. Manuf. 2015, 16, 2041–2048. [Google Scholar] [CrossRef]
- Nam, Y. Wind Turbine System Control; GS Intervision: Seoul, Korea, 2013; p. 247. [Google Scholar]
- DNV. Bladed Theory Manual: Version 4.9; Gerrad Hassan & Partners Ltd.: Bristol, UK, 2018. [Google Scholar]
- Kim, J.; Shin, H. Model test & Numerical Simulation of OC4 Semi-Submersible Type Floating Offshore Wind Turbine. In Proceedings of the Twenty-sixth International Ocean and Polar Engineering Conference, Kona, HI, USA, 21–26 June 2016; pp. 282–287. [Google Scholar]
- Hu, Z.; Li, L.; Wang, J.; Hu, Q.; Shen, M. Dynamic responses of a semi-type offshore floating wind turbine during normal state and emergency shutdown. J. China Ocean Eng. 2016, 30, 97–112. [Google Scholar] [CrossRef]
- Liu, Z.; Fan, Y.; Wang, W.; Qian, G. Numerical Study of a Proposed Semi-Submersible Floating Platform with Different Numbers of Offset Columns Based on the DeepCwind Prototype for Improving the Wave-Resistance Ability. J. Appl. Sci. 2019, 9, 1255. [Google Scholar] [CrossRef] [Green Version]
- Benitz, M.A.; Schmidt, D.P.; Lackner, M.A.; Stewart, G.M.; Jonkman, J.; Robertson, A. Comparison of Hydrodynamic Load Predictions between Engineering Models and Computational Fluid Dynamics for the OC4-DeepCwind Semi-Submersible; NREL/CP-5000-61157; National Renewable Energy Lab. (NREL): Golden, CO, USA, 2014.
- Si, Y.; Chen, Z.; Zeng, W.; Sun, J.; Zhang, D.; Ma, X.; Qian, P. The influence of power-take-off control on the dynamic response and power output of combined semi-submersible floating wind turbine and point-absorber wave energy converters. J. Ocean Eng. 2021, 227, 1–23. [Google Scholar] [CrossRef]
- Li, X.; Zhu, C.; Fan, Z.; Chen, X.; Tan, J. Effects of the yaw error and the wind-wave misalignment on the dynamic characteristics of the floating offshore wind turbine. J. Ocean Eng. 2020, 199, 1–15. [Google Scholar] [CrossRef]
- Emami, A.; Mostafa, G.A.R. Application of poroelastic layers in a semi-submersible platform: Devising an efficient heave motion response reduction method. J. Ocean Eng. 2020, 201, 1–19. [Google Scholar] [CrossRef]
- Robertson, A.; Jonkman, J.; Masciola, M.; Song, H.; Goupee, A.; Coulling, A.; Luan, C. Definition of the Semisubmersible Floating System for Phase II of OC4; NREL/TP-5000-60601; National Renewable Energy Lab. (NREL): Golden, CO, USA, 2014.
- Jonkman, J.; Butterfield, S.; Musial, W.; Scott, G. Definition of a 5-MW Reference Wind Turbine for Offshore System Development; NREL/TP-500-38060; National Renewable Energy Lab. (NREL): Golden, CO, USA, 2009.
- Robertson, A.; Jonkman, J.; Vorpahl, F.; Popko, W.; Qvist, J.; Frøyd, L.; Chen, X.; Azcona, J.; Uzunoglu, E.; Guedes Soares, C.; et al. Offshore Code Comparison Collaboration Continuation Within IEA Wind Task 30: Phase II Results Regarding a Floating Semisubmersible Wind System; NREL/CP-5000-61154; National Renewable Energy Lab. (NREL): Golden, CO, USA, 2014.
- Bossanyi, E. The design of closed loop controllers for wind turbines. Wind Energy 2000, 3, 149–163. [Google Scholar] [CrossRef]
- Bossanyi, E. Individual blade pitch control for load reduction. Wind Energy 2003, 6, 119–128. [Google Scholar] [CrossRef]
- Engelen, T.G. Design model and load reduction assessment for multi-rotational mode individual pitch control (higher harmonics control). In Proceedings of the European Wind Energy Conference, Athens, Greece, 27 March 2006. [Google Scholar]
- Bossanyi, E.; Wright, A.; Fleming, P. Further progress with field testing of individual pitch control. In Proceedings of the European Wind Energy Conference, Golden, CO, USA, 1 January 2010. [Google Scholar]
- Savenije, F.J.; Peeringa, J.M. Aero-Elastic Simulation of Offshore Wind Turbines in the Frequency Domain; Energy Research Center of the Netherlands (ECN): Petten, The Netherlands, 2009. [Google Scholar]
- Tong, W. Wind Power Generation and Wind Turbine Design; WIT Press: San Francisco, CA, USA, 2010; pp. 240–244. [Google Scholar]
- Peerigna, J.; Brood, R.; Ceyhan, O.; Engels, W.; De Winkel, G. Upwind 20 MW Wind Turbine Pre-Design: Blade Design and Control; ECN-E-11-017; Energy Research Center of the Netherlands (ECN): Petten, The Netherlands, 2011. [Google Scholar]
- Kim, K.; Kim, H.; Paek, I. Application and validation of peak shaving to improve performance of a 100 kW wind turbine. Int. J. Precis. Eng. Manuf. Green Technol. 2020, 7, 411–421. [Google Scholar] [CrossRef]
- Cheng, Z.; Wang, K.; Gao, Z.; Moan, T. Dynamic response analysis of three floating wind turbine concepts with a two-bladed Darrieus rotor. J. Ocean Wind Energy 2015, 2, 213–222. [Google Scholar] [CrossRef] [Green Version]
| Publisher’s Note: MDPI stays neutral with regard to jurisdictional claims in published maps and institutional affiliations. |
© 2021 by the authors. Licensee MDPI, Basel, Switzerland. This article is an open access article distributed under the terms and conditions of the Creative Commons Attribution (CC BY) license (https://creativecommons.org/licenses/by/4.0/).


