Article

The Impact of High-Energy Mining-Induced Tremor in a Fault Zone on Damage to Buildings

1
Faculty of Civil Engineering, Cracow University of Technology, Warszawska 24, 31-155 Kraków, Poland
2
Central Mining Institute, pl. Gwarków 1, 40-166 Katowice, Poland
3
Mineral and Economy Research Institute of the Polish Academy of Sciences, Wybickiego 7A, 31-261 Kraków, Poland
*
Author to whom correspondence should be addressed.
graduated.
Energies 2021, 14(14), 4112; https://doi.org/10.3390/en14144112
Submission received: 1 June 2021 / Revised: 2 July 2021 / Accepted: 5 July 2021 / Published: 7 July 2021
(This article belongs to the Topic Interdisciplinary Studies for Sustainable Mining)

Abstract

:
Seismic energy propagation from the hypocentre of mining-induced tremors usually causes an uneven distribution of the peak ground velocity PGVHmax in tectonically complicated structures, and consequently, an uneven distribution of damage to buildings located on the ground surface. This study aimed to estimate the impact of high-energy mining-induced tremors in fault zones on damage to buildings. In the study, we describe a case of one of the highest-energy mining-induced tremors E = 4.0 · 108 J (local magnitude ML = 3.6) that occurred in the Upper Silesian Coal Basin (USCB), Poland. The hypocentre of the tremor was most probably located in the Barbara fault zone, one of the larger faults in that western part of the USCB. Numerous damaged buildings on the terrain surface were registered, both in the epicentral zone and at a greater distance from the epicentre, mostly from the southern side of the Barbara fault zone. We calculated that the tremor was characterised by a normal slip mechanism associated with the same kind of fault as the Barbara fault. The azimuth of the nodal planes was similar to the west-east direction, which is consistent with the azimuth of the Barbara fault. From the focal mechanism, the greatest propagation of seismic energy occurred in south and west-east directions from the tremor hypocentre towards the surface. It was found that from the northern side of the hanging wall of the Barbara fault, there were 14 instances of damage (19%), and in the southern part of a hanging wall, there were 58 (81%). Therefore, the directionality of seismic energy propagation is aligned with the focal mechanism acting in the Barbara fault. It has also been concluded that a width of the zone of up to about 1200 m along the Barbara fault is the most threatening on the basis of registered building damage in the geological conditions of USCB. The study has shown that in assessing the impact of mining-induced tremors on buildings and the environment, the disturbance of seismic energy propagation by larger faults should be considered.

1. Introduction

In seismically active mining areas, the problem of accurately forecasting the zones of intensity of ground vibrations after the occurrence of high-energy tremors is not completely resolved—e.g., [1,2,3]. The issue is important in the context of the impact of ground vibrations on the environment, the construction of new facilities, and the strengthening of existing buildings [4,5,6].
The impact of mining-induced tremors on the environment is very diverse, from weak—imperceptible by people—to very strong [7,8,9,10], which often causes specific damage to the existing infrastructure on the ground surface [4,6] and sometimes in underground mining workings [4,11,12].
Many years of observations and analysis in the Upper Silesian Coal Basin (USCB), Poland, have shown the bimodality of mining-induced tremors [13]. There is a group of tremors that are directly associated with mining advancement of the longwall face, so-called “exploitation tremors” of seismic energy E < 107 J, and a group of so-called “regional tremors”, strong tremors of E ≥ 106 J. Regional tremors are associated with mining operations over a large area, covering many longwall panels, and their occurrence is related to greater faults, folds, or overlaps in the area of mining operations. Dubiński et al. [10] underlined that unfavourable changes of the stress field caused by mining are only a trigger in reducing energy stored in geological structures disturbed by mining. Regional tremors are particularly hazardous for buildings on the terrain surface.
The most accurate method to estimate changes of ground vibrations with the epicentral distance is direct measurement. However, most often, there are either insufficient or no detectors at all in the research area. This makes it impossible to precisely determine the impact of the tremor on ground surfaces and buildings. To estimate the changes of ground vibrations with the epicentral distance, various kinds of universal seismic scales are used [14], as well as local scales developed for specific geological and mining conditions, e.g., Mining Seismic Instrumental Intensity Scale (MSIIS-15) [5]. Various kinds of analytical relationships are also used to estimate the size of ground vibrations [3,15]. Unfortunately, analytical solutions usually provide approximate results due to the complex nature of the wavefield, which is often distorted by the geological structure.
This study aims to estimate the impact of high-energy mining-induced tremor in the fault zone on damage to buildings on the ground surface. In particular, we highlighted the role of the fault in mining-induced regional tremors and its impact on the propagation of seismic energy. This issue is not widely discussed in published studies. In practice, when planning buildings or reinforcing existing ones in mining areas, the impact of larger faults on the expected occurrence of damage to facilities is not taken into account.
In the article, we describe a case of one of the highest-energy tremors E = 4.0 · 108 J (local magnitude ML = 3.6), which occurred on 8 November 2018 in the USCB (Figure 1). Numerous damaged buildings on the ground surface were registered, both in the epicentral zone and at a great distance from the epicentre.
We present the methodology of observation and calculations to estimate the impact of high-energy tremors on damage to buildings on the ground surface. We also present information on geological and mining conditions in the research area, emphasising the parameters of the Barbara fault. In the following sections of the article, we discuss the estimation of ground vibration distribution due to the occurrence of tremor. We emphasise seismic energy propagation initiated by the focal mechanism of the tremor occurring in the existing Barbara fault. We present the location of damaged buildings depending on the distance to the Barbara fault. The measurement and theoretical calculations of horizontal peak ground vibration are also compared with the location of damaged buildings.

2. Methods and Data

In general, the impact of high-energy mining-induced tremors on the environment depends on many factors [7,16,17,18,19,20,21]:
  • Seismic source parameters—physical quantities describing the focal mechanism;
  • Structure and properties of rock mass in the way of propagation of the seismic waves;
  • Seismological properties of the loosened overburden at the vibration reception station (site effect), determined by the vibration amplification factor;
  • The types and properties of buildings threatened by seismic energy.
In the USCB, seismological observations have been conducted for several decades by the mine networks and the Upper Silesian Regional Seismological Network (USRSN) (Figure 1) [22]. Using both networks enables the observation of induced tremors occurring in the USCB from energy levels of 105 J (ML ≥ 1.7). We can locate their foci and determine their seismic energy levels.

2.1. Focal Mechanism

The parameters of the focal mechanism tremor are determined based on seismo-grams recorded by the USRSN (Figure 1) using the seismic moment tensor method (SMTM) [23,24]. It describes the system of forces occurring in a seismic source as a linear combination of force paired with a tensor moment. The total displacement in the far wave field uk is the sum of the displacements caused by individual pairs of forces:
u k = M ij G ki x j = M ij G ki , j
where:
  • uk are the displacement amplitude measurements of the first maximum of the P-wave;
  • Mij is a jth component of the vector of moment tensor terms (Mxx, Myy, Mzz, Mxy, Mxz, Myx);
  • Gij is a matrix of appropriate Green’s function in a whole homogeneous space.
In the study, we calculated tremor models from amplitudes and the polarity of P-waves using FOCI software [25]. As a result, three models of tremor focus can be identified, described by three types of seismic tensor: full, deviatoric, and pure shear tensor. The full moment tensor can be broken down into an isotropic component (ISO), describing the volume change: explosion (+) or implosion (−), and into a compensated linear vector dipole (CLVD) corresponding to the uniaxial compression (−) or tension (+), and into the double-couple component (DC) corresponding to the shear motion. The deviatoric tensor has a CLVD component and the shear component DC. The pure shear tensor only has the double-couple (DC) component. The full, deviatoric, and pure shear moment tensor was calculated using the L2 norm. To estimate the errors of each moment tensor solution, the maximum error is calculated as the square root of the maximum element of the covariance matrix:
cov ( m ) = σ ( G T G ) 1
The variance σ represents the measurement error and is assumed to be around 25% of the measured displacement amplitude.

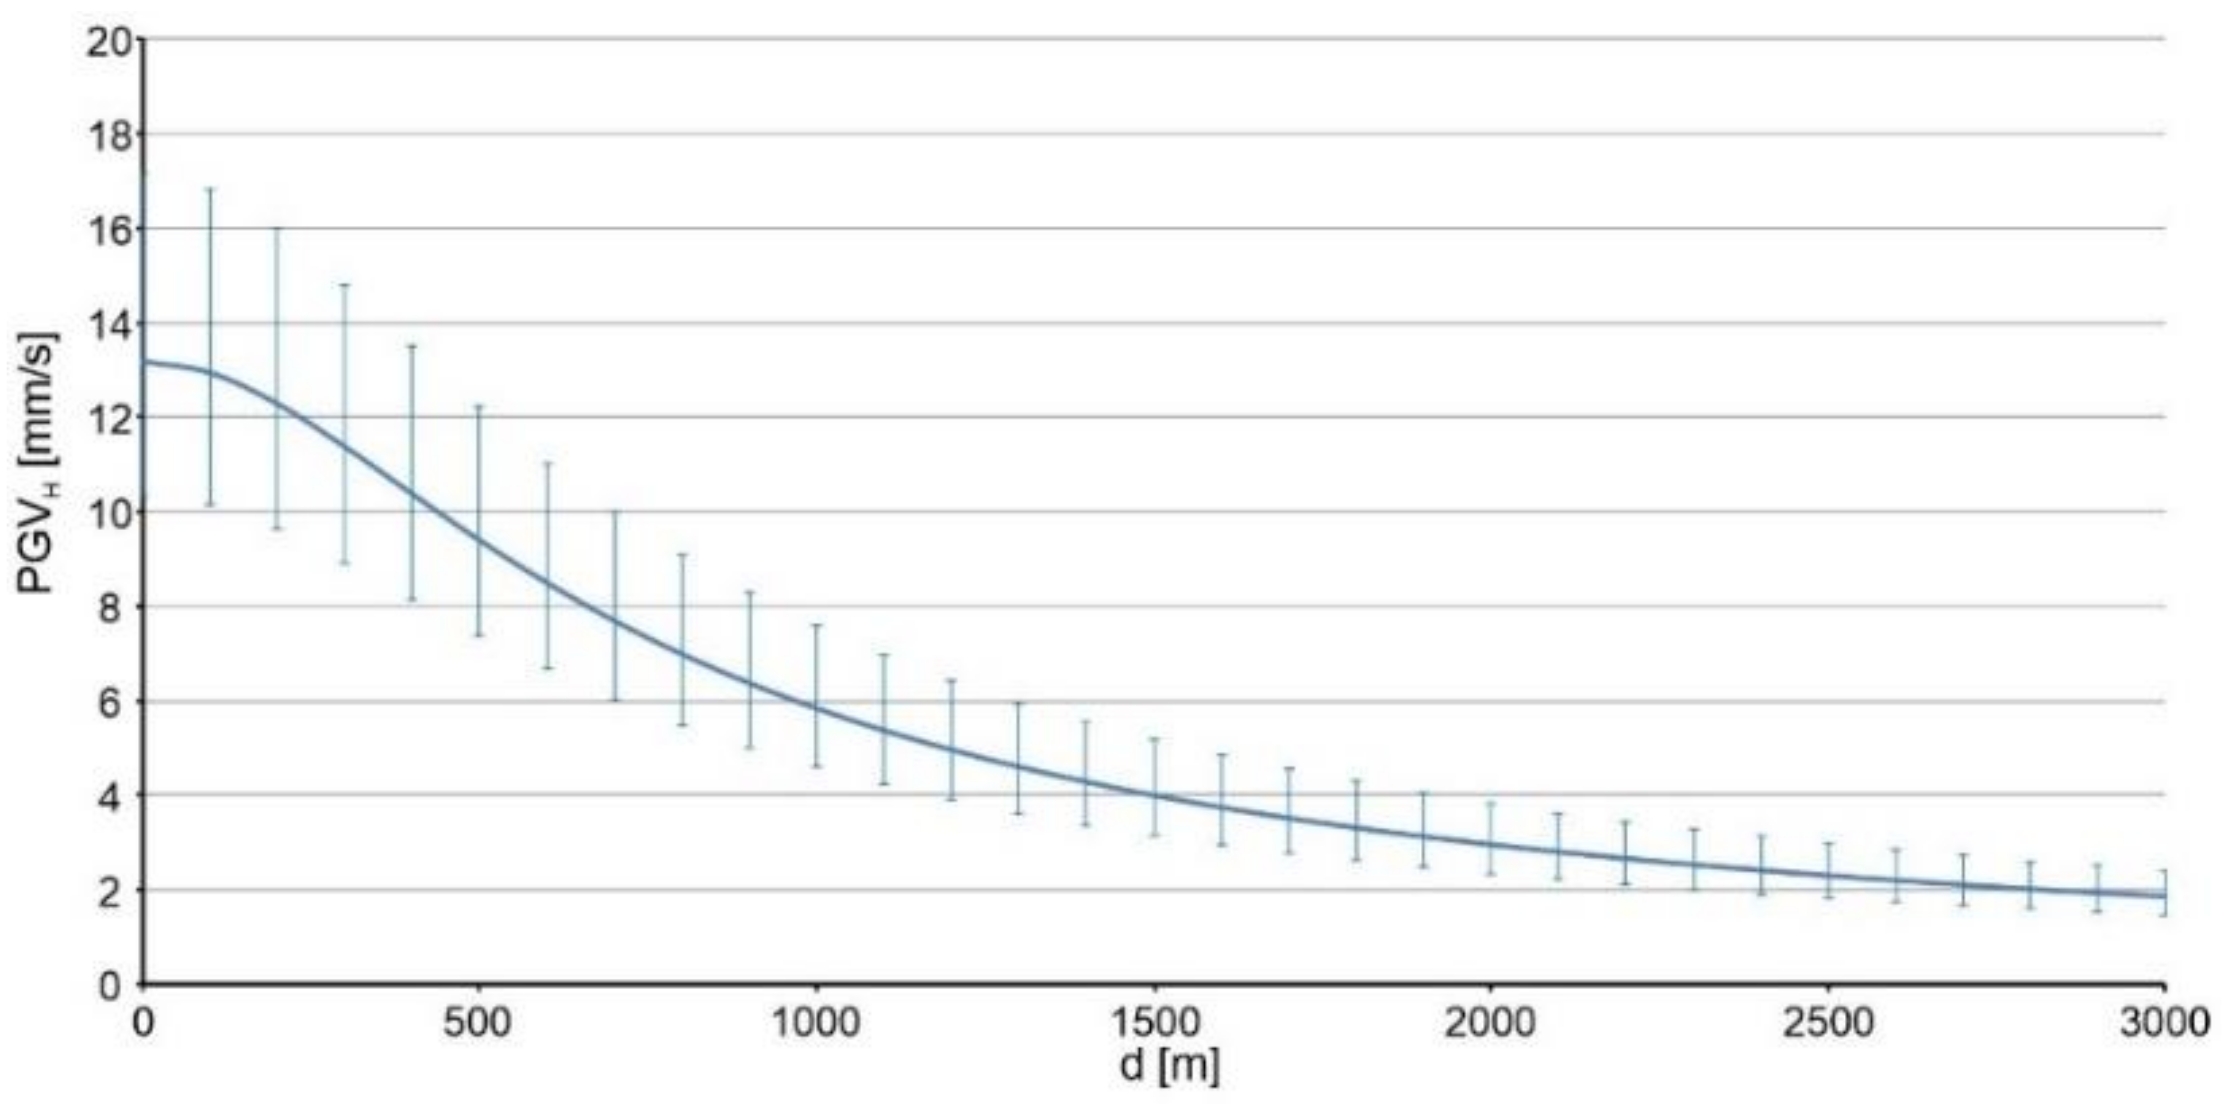
2.2. Ground Vibrations

The seismic intensity of ground vibrations in the USCB is assessed based on the MSIIS-15 scale [5]. This scale combines instrumental measurement parameters of ground vibrations with observed macroseismic effects. This is a two-parameter scale based on the maximum amplitude of horizontal vibration velocity, PGVHmax, and the duration of the horizontal ground motion velocity, tHV (Table 1). The maximum amplitude of horizontal vibrations velocity PGVHmax, designated as the resultant of the horizontal maximum of vector length:
PGV Hmax = max   V x 2 + V y 2
where:
Vx is the horizontal ground motion velocity in the x-direction, m/s;
Vy is the horizontal ground motion velocity in the y-direction, m/s.
The vibration intensity degrees IMSIIS are assigned for the harmfulness levels correlated with specific types of building structures. During the development as well as the verification of the MSIIS-15 scale, various buildings characteristic for the research area were observed, including the buildings with the unreinforced weakest structures and in poor technical condition (for example, the buildings located in the area of the previous mining activities and subjected to a process of subsidence).
For traditional brick buildings, the most common in the USCB, the first new damage to non-structural elements may occur at IMSIIS intensity levels of III and above. Structural damage may occur at IMSIIS intensity levels of IV and above. The enlargement of scratches, cracks, or fissures existing in buildings may already occur at the II degree of IMSIIS, i.e., in the area or even several kilometres from the epicentre of the tremor. For buildings in poor technical condition, the harmfulness limit is reduced by one degree.
To calculate the predicted value of horizontal velocity vibrations PGVH, the empirical formula was developed for type “A” subsoil according to the Eurocode 8 standard [14]. Ground-type “A” represents “rock or other rock-like geological formations, including at most 5 m of weaker material at the surface” characterised by average S-wave velocity > 800 m/s.
The statistically developed equation describes the normalised decrease in the PGVH as a function of seismic energy E, epicentral distance d, and ground-type “A”, in the form [2]:
log ( PGV H ) = 0.209 · log ( E ) log ( d ) 0.035 · d 0.814
The standard estimation error S for the PGVH equals to 0.314, and the standard estimation errors for the given regression coefficients (which are estimates of the regression coefficients for the whole population) are as follows: Slog(E) = 0.0298, Sd = 0.0086, Sintercept = 0.2283. The coefficient of determination R2 = 0.86 indicates that the model explains variation of PGVH in 86%.
The predicted PGVH is also the resultant of the horizontal maximum of vector length (3). It depends on the amplification of ground vibrations caused by the properties and geological structure of loosened overburden. Therefore, the maximum value PGVHmod modified with amplification factor can be determined from the formula:
PGV Hmod = PGV H · W f
where Wf is the amplification factor.
The Formula (5) is used to analyse the ground vibration intensity degree IMSIIS.

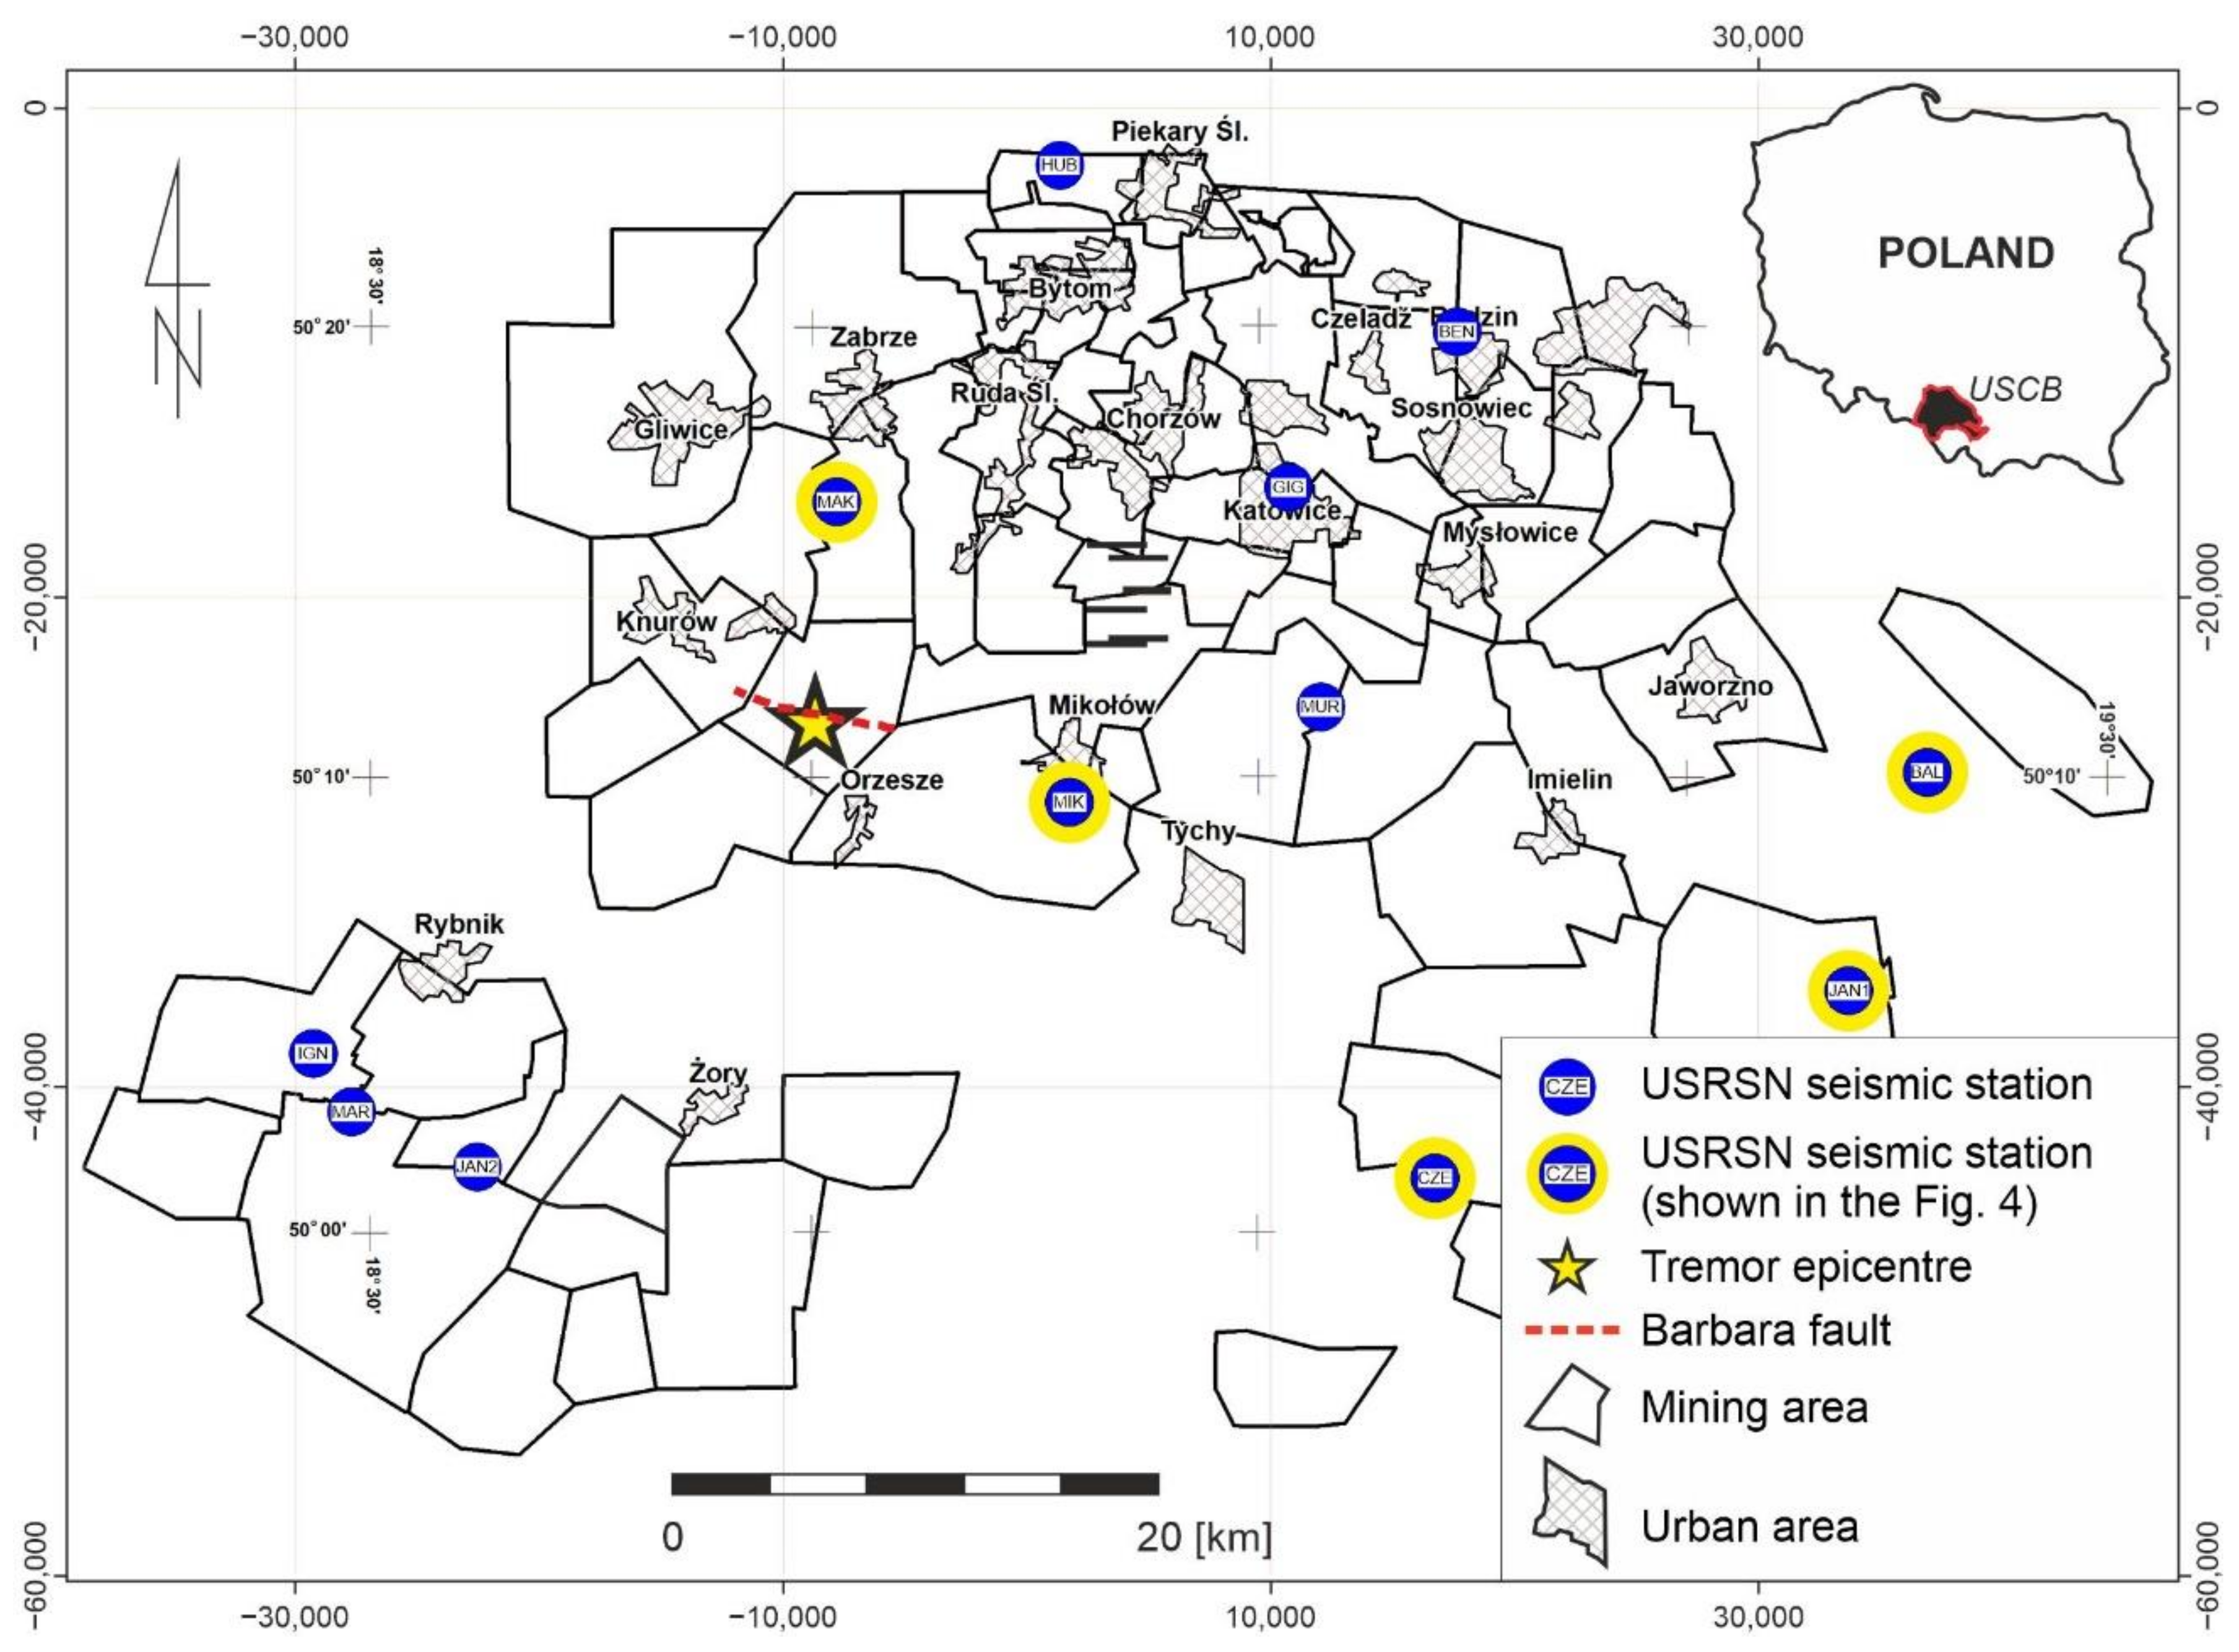
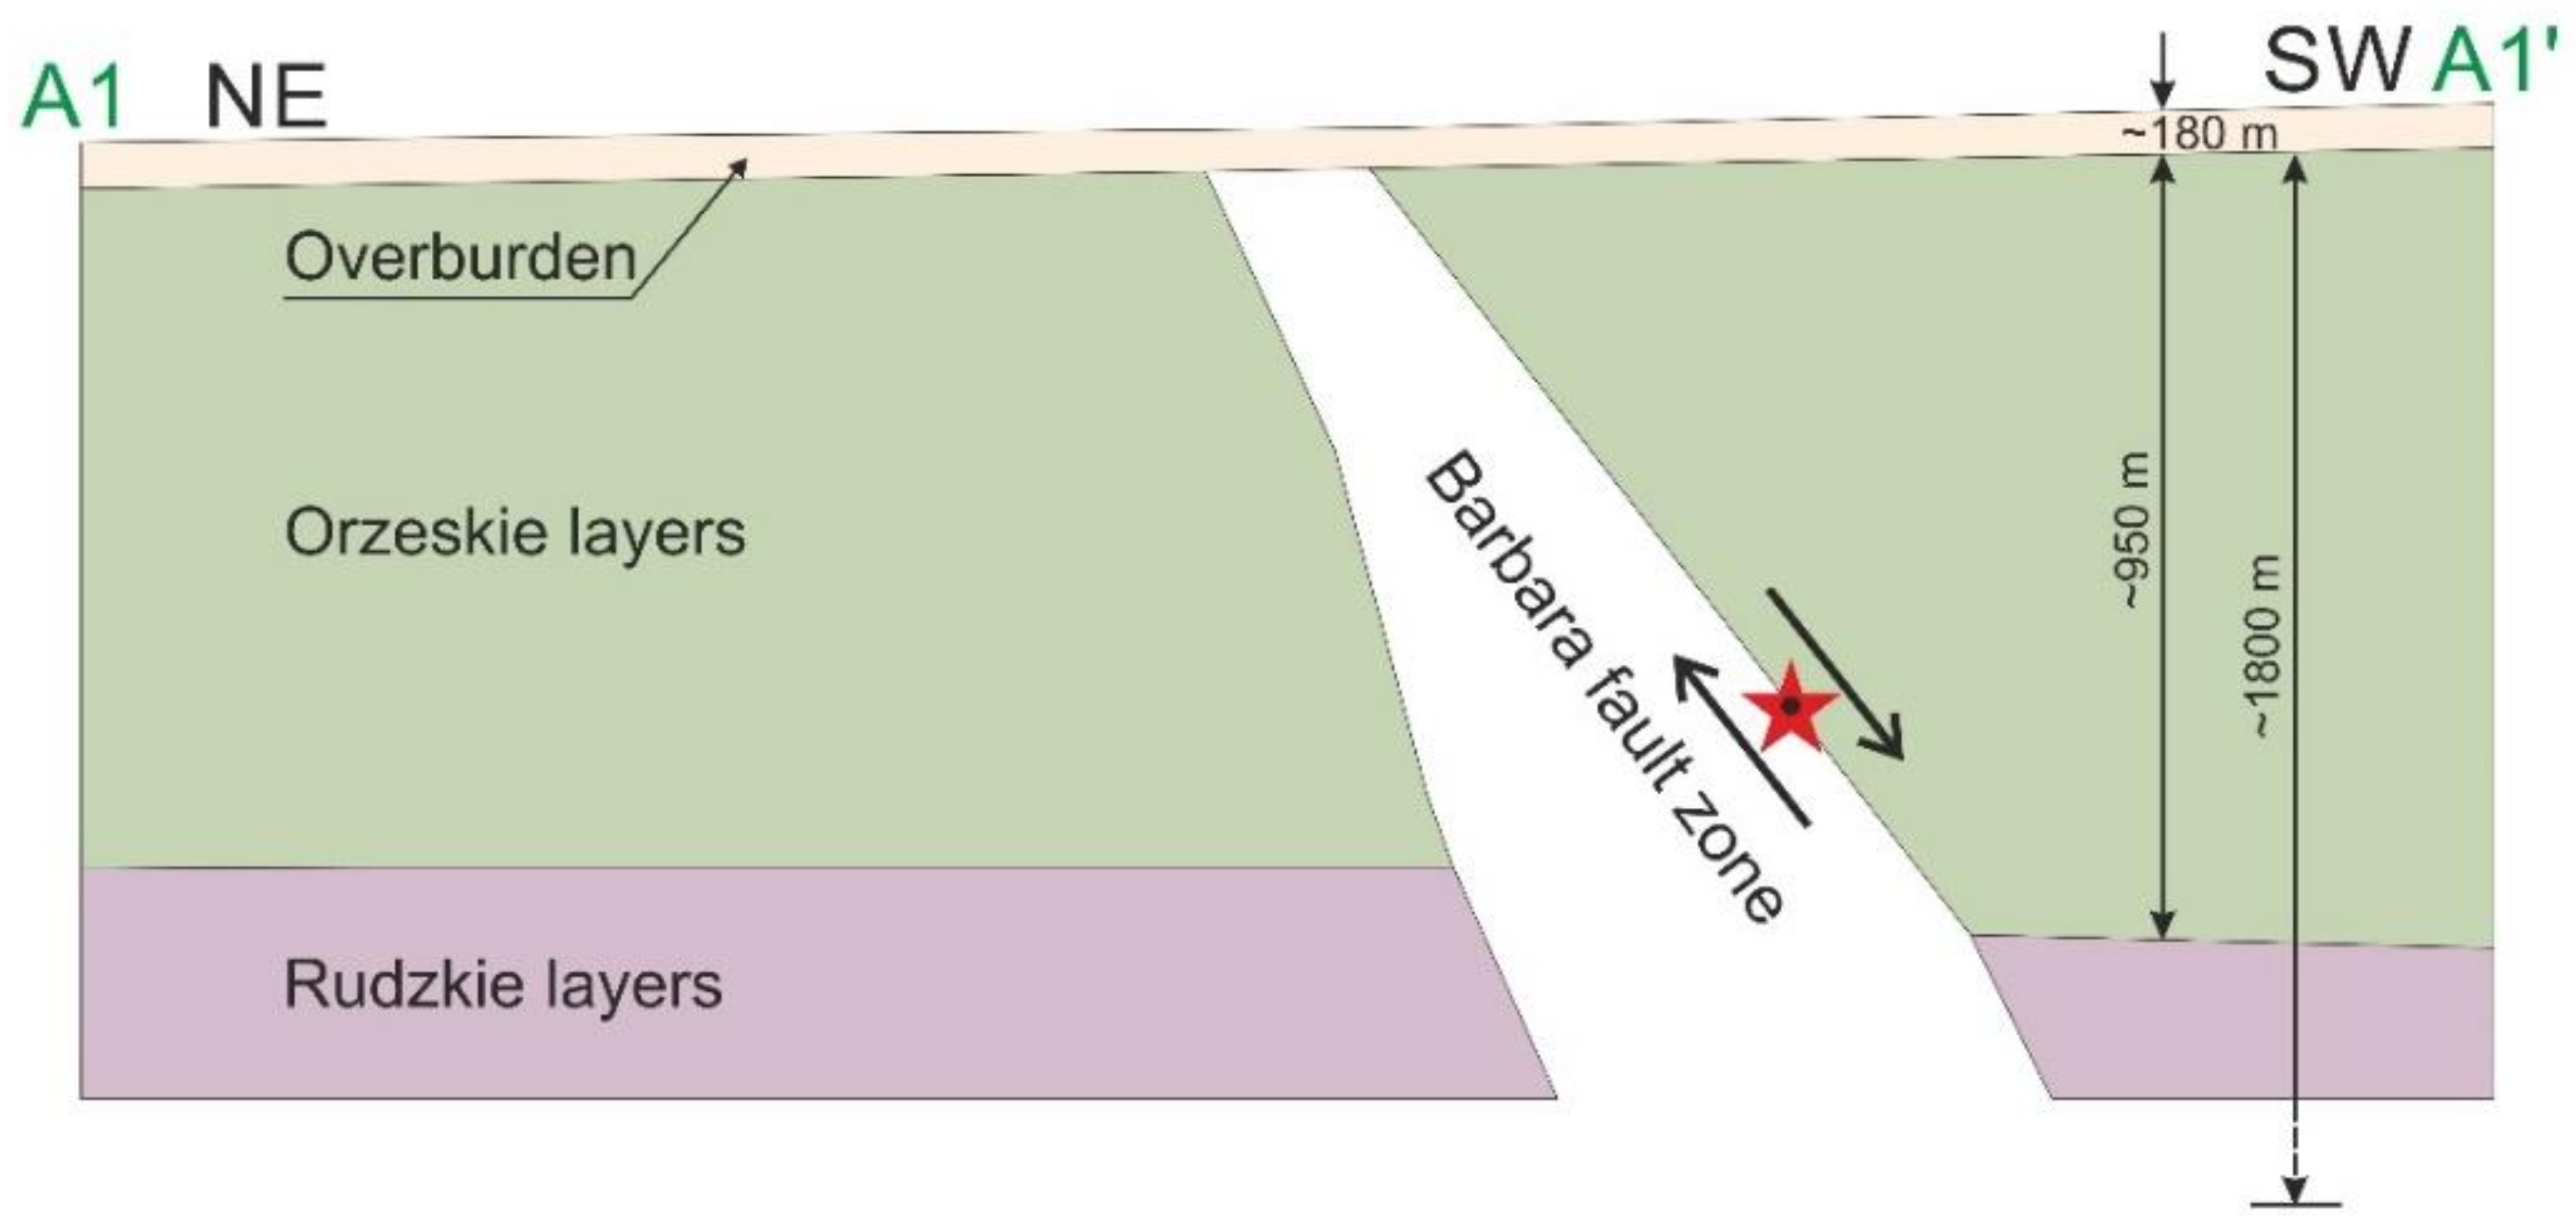
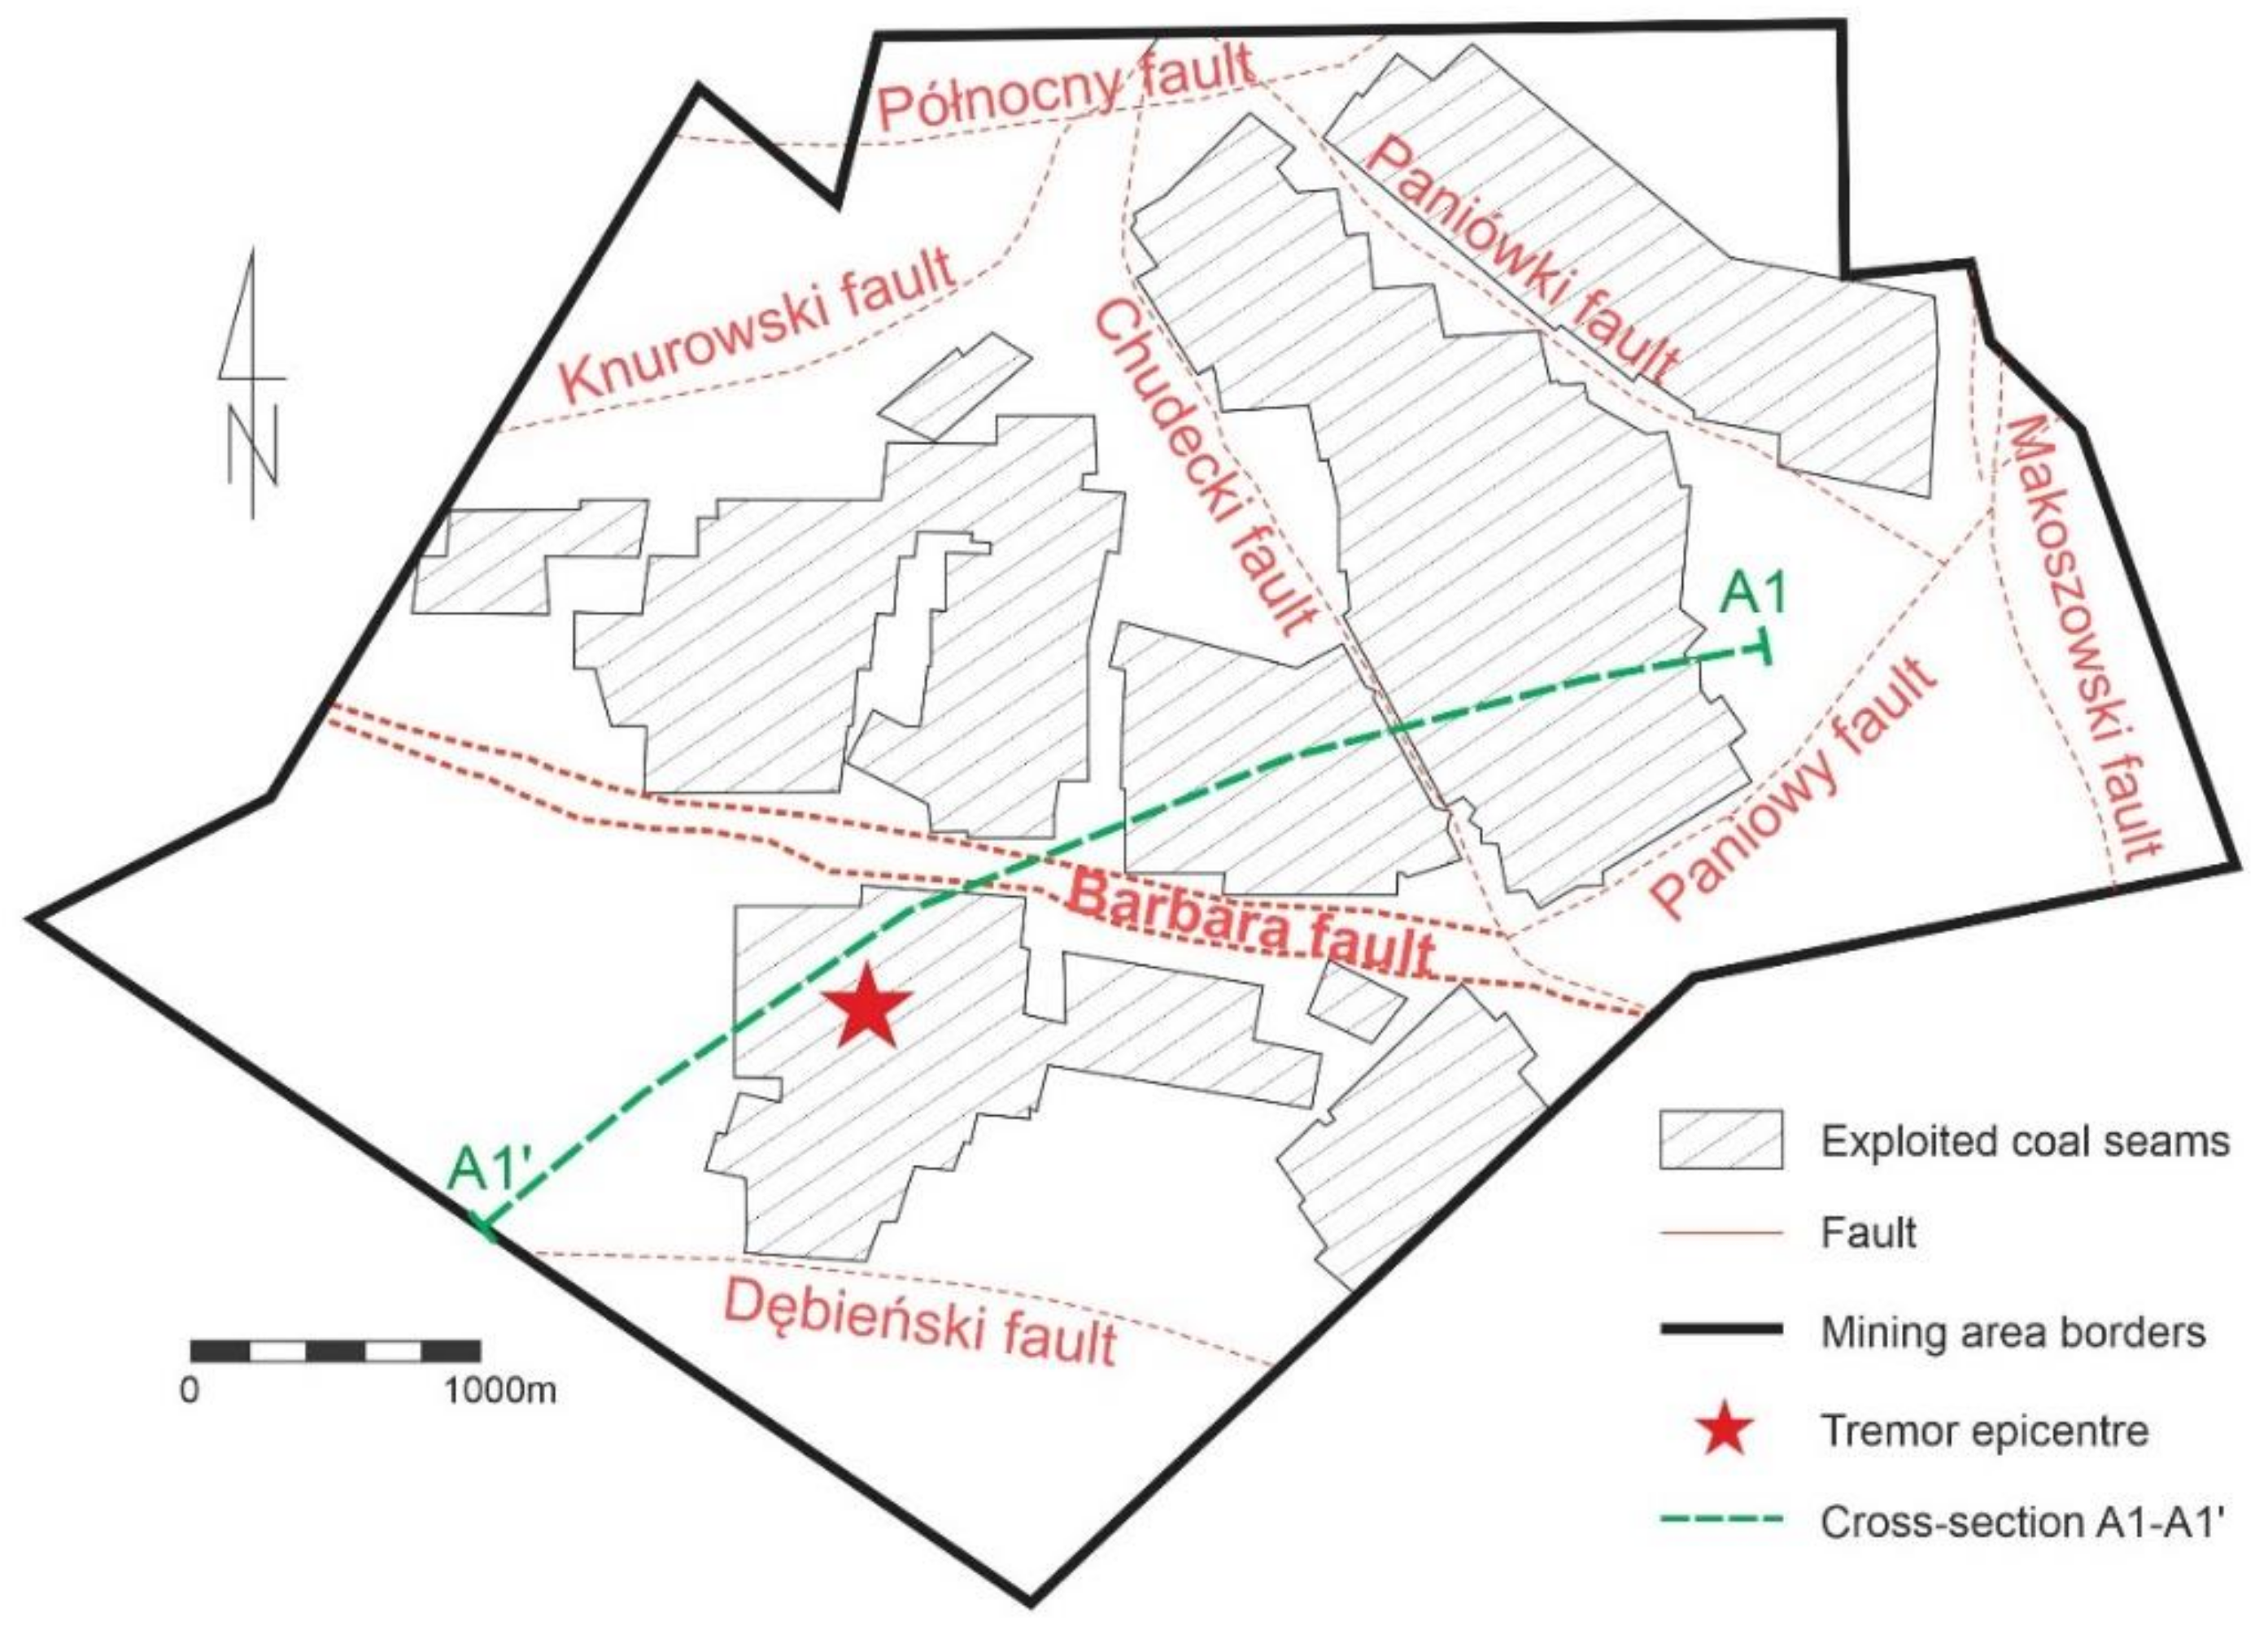
3. Geological and Mining Conditions

Figure 2 shows a simplified geological section, named A1-A1′, referring to the area under examination. The location of section A1-A1′ is sketched in Figure 3. In the research area, the rock mass of Carboniferous formations is covered with a loosened overburden of Quaternary formations. The thickness of the overburden is about 180 m. The Carboniferous formations are formed by the Orzeskie and Rudzkie layers with a total thickness of around 1800 m. The Orzeskie layers are made of claystones, mudstones, sandstones, and coal seams with a thickness of around 800 to around 1250 m in the southern part. The thickness of the coal seams is variable and ranges between 0.6 and 3.5 m. Below the Orzeskie layers, there are Rudzkie layers at a depth of approximately 880 to approximately 1300 m. These are composed of a complex of claystones and mudstones with a small amount of sandstone and numerous coal seams with a thickness of 0.6 to 3.9 m.
In the research area, the Carboniferous formations are quite heavily faulted (Figure 3). The largest faults include the Barbara fault zone with a latitudinal course with a throw of around 30–55 m in the S direction at an angle of around 50° (Figure 2). There are other faults in the neighbourhood with smaller drops: the Dębieński fault with a throw of 22 m to 45 m and a latitudinal course, and the Północny, Paniówki, Knurowski, and smaller faults.
Mining works identified the Barbara fault zone to be at a level of 1050 m and in several coal seams (Figure 3). To the north of the Barbara fault hanging wall, many coal seams have been mined with a total maximum thickness of about 13.4 m. From south of the hanging wall of the Barbara fault, the coal seams have been exploited to a total maximum thickness of about 6.5 m. The unevenness of the coal seam exploitation on both sides of the Barbara fault can cause high-stress values in the fault zone. The dynamic reduction of these stresses can be a direct cause of tremors of higher energies.

4. Results

A mining-induced tremor of high-energy E = 4.0 · 108 J and magnitude ML = 3.6 occurred on 8 November 2018 in the western part of the USCB. The tremor was recorded at many USRSN stations at distances of up to several dozen kilometres (Figure 4). The focus of the tremor was calculated at a depth of around 800 m. The epicentre location of the tremor is shown in Figure 1 and Figure 5. Moreover, Figure 5 shows the location of the AMAX seismometric stations belonging to the coal mine (i.e., ST1, ST2, ST3).

4.1. Focal Mechanism

The calculation results of the focal mechanism are presented in Table 2. In the calculations, we assumed 3200 m/s for the P-wave velocity and 2500 kg/m3 for ground density. The graphic image of the focal mechanism presented in Table 2 is a projection of the lower hemisphere.
The analysed tremor is characterised by a normal slip mechanism with 62% of the shear component. The remaining isotropic component and compensated linear vector dipole component (compression or tension) were 18% and 20%, respectively. The main compressive stresses C and the tensile stresses T have a plunge of 75° and 14°, respectively. Nodal planes have an azimuth WE: fracture plane A (φ° = 269°, φ = 60°) and plane B (φ° = 86°, φ = 31°).

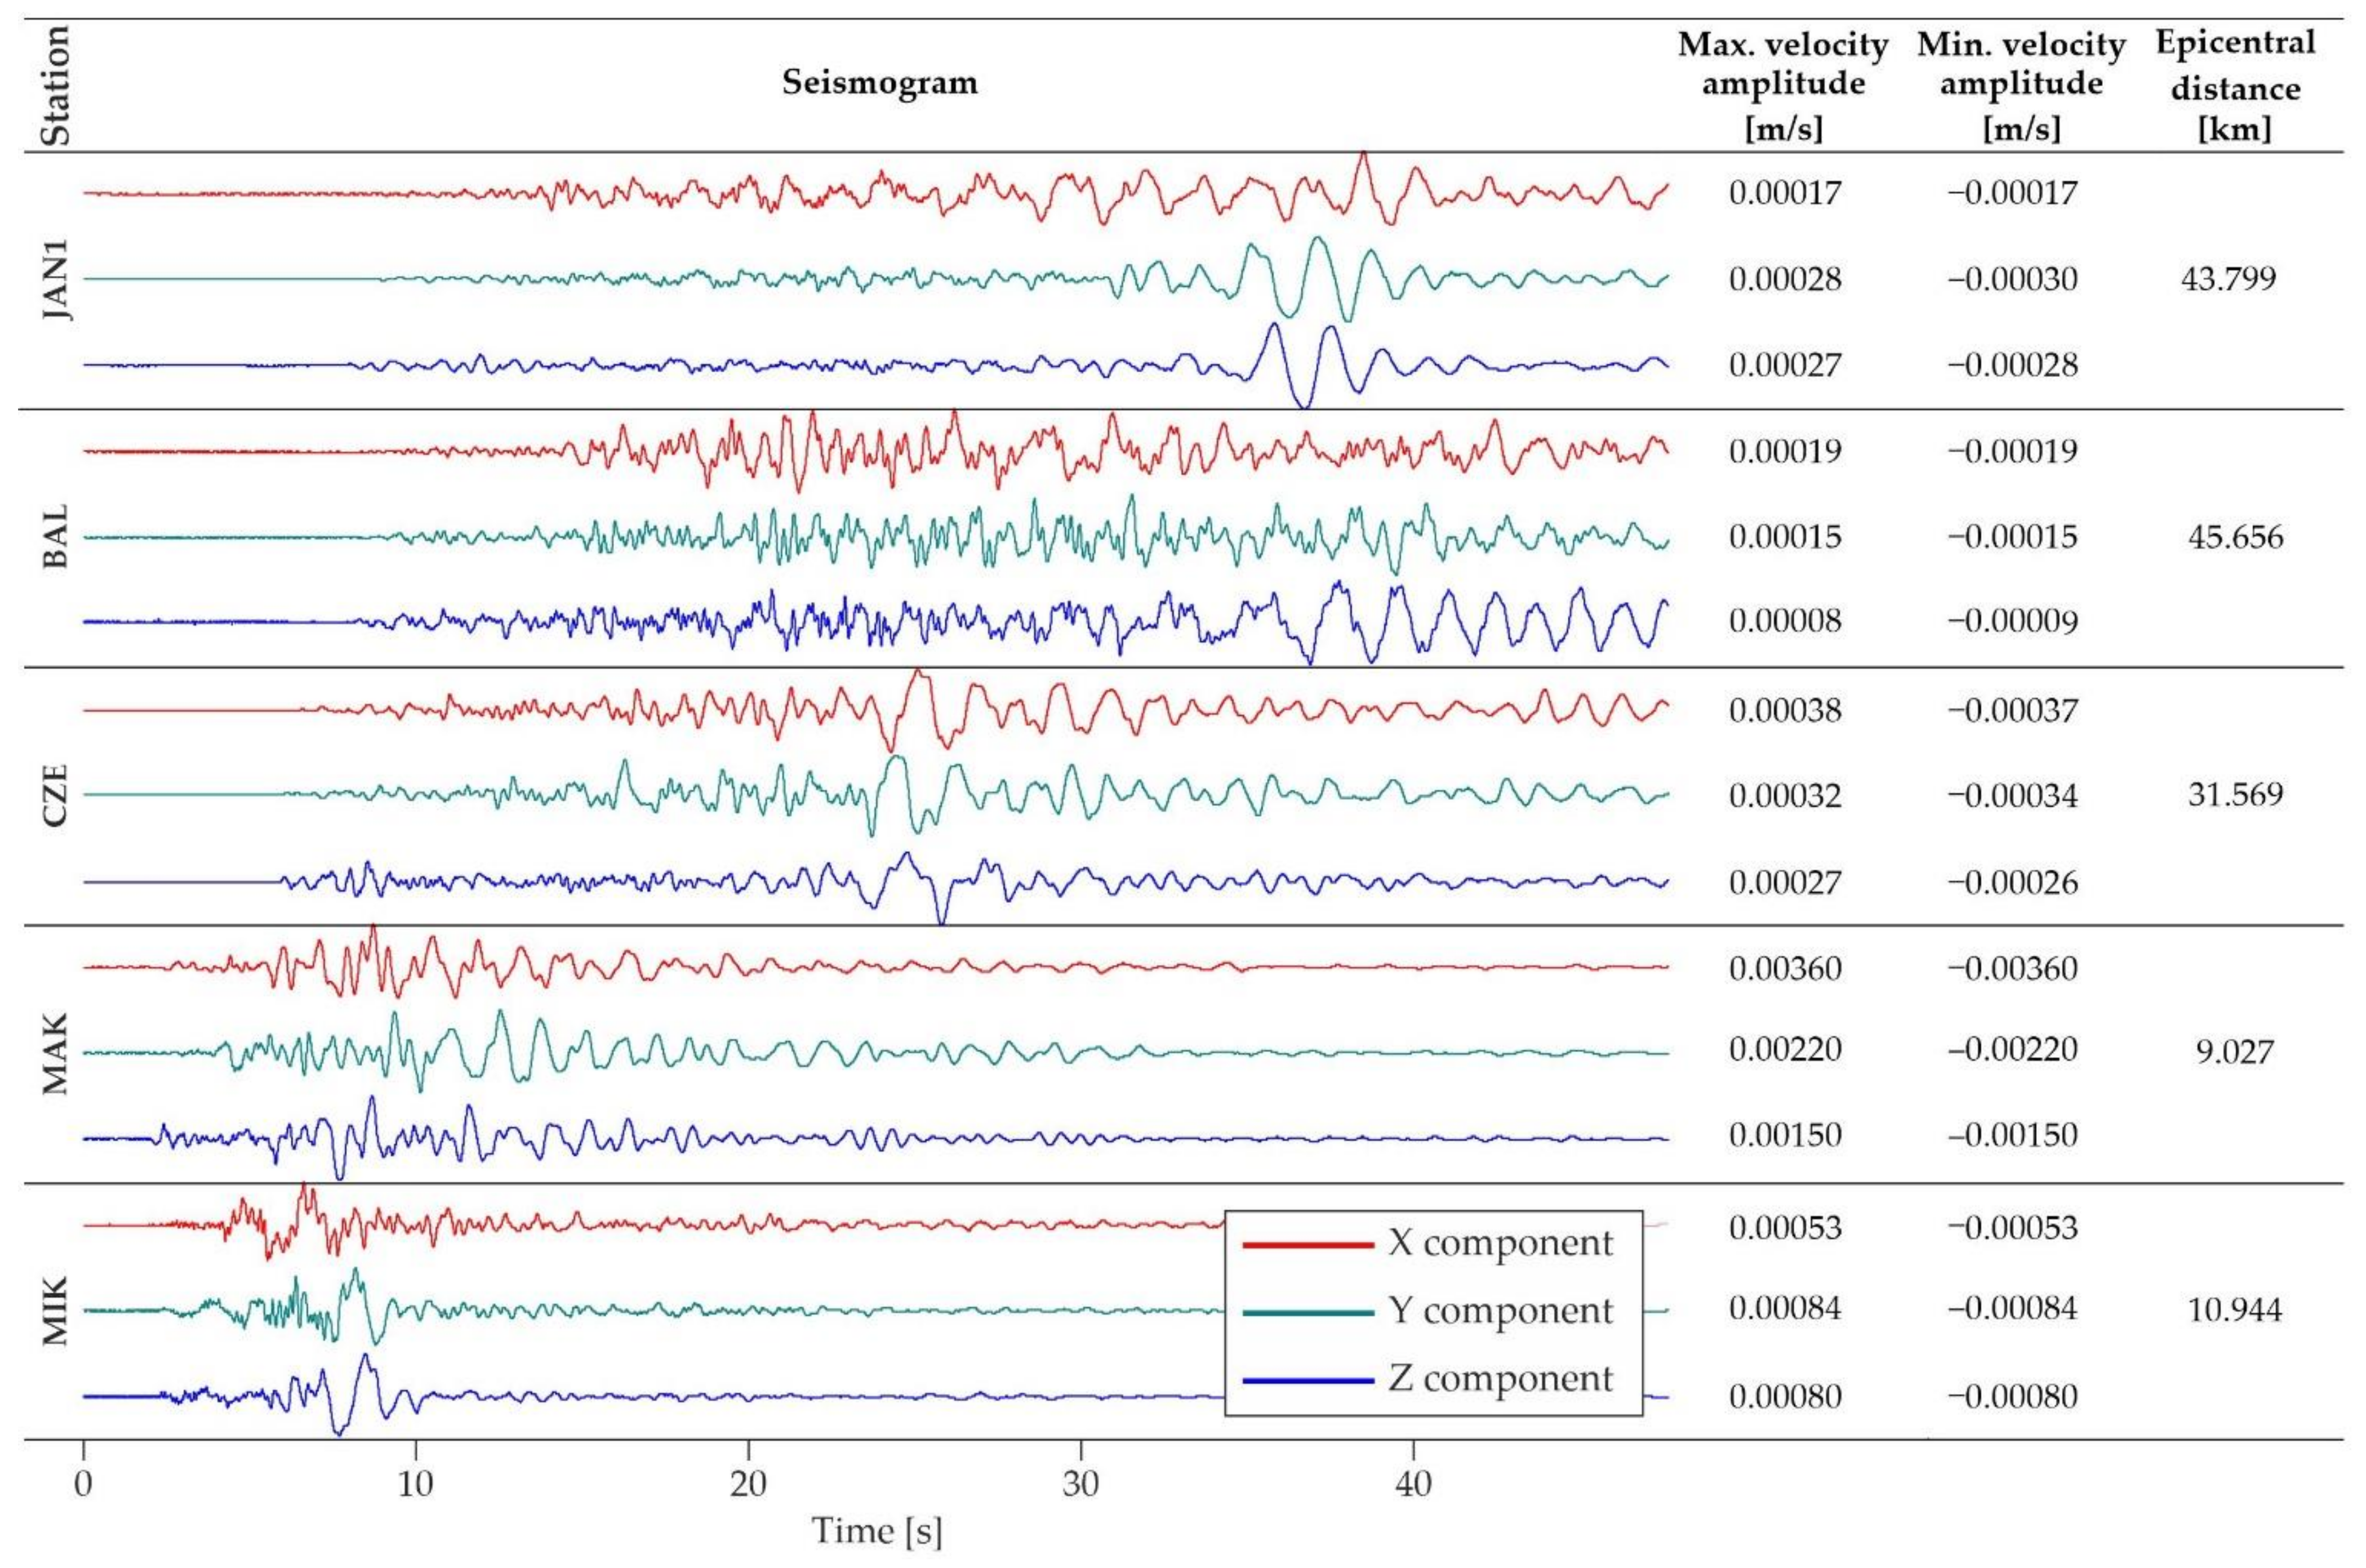
4.2. Ground Vibrations

The tremor of 8 November 2018 was also recorded at the AMAX seismometric stations (i.e., ST1, ST2, ST3), located closest to the tremor epicentre. Table 3 presents the values of PGV as a measured resultant of the horizontal maximum of vector length (3) and basic parameters of ground vibrations at the point of registration by AMAX stations. The large difference in horizontal ground vibration PGVHmod values at the individual station is not explained by the values of vibration amplification coefficient Wf at the point of registration. Bearing in mind that seismic waves propagation is affected by lithostratigraphic and topographic local conditions—e.g., [26,27,28,29,30,31,32,33,34], the distribution of the amplification factor Wf is shown in Figure 5.
The error in determining the value PGVH indicates that the standard deviation S = 0.314. For example, for tremors with the seismic energy 1.0·108 J with a confidence interval of 90%, the theoretical PGVH values may differ from the average value by up to 50% in the epicentre (Figure 6). Therefore, the error to measured values of PGV at AMAX stations may exceed the predicted values of PGVHmod (Table 3).
Figure 7 shows the PGVHmod field and the measured vibration values PGV at the AMAX stations. For the analysed tremor, the intensity degree IMSIIS was determined from the distribution of the PGVH, calculated according to Formula (4).
In the majority of the impact area of the tremor, the vibration intensity IMSIIS ranges from the degree I to II. Only in a small area around the tremor epicentre, the intensity IMSIS, falls within the III–IV degree range. People in the neighbouring towns felt the analysed tremor several dozen kilometres away from the seismic epicentre (Mikołów, Knurów, Zabrze, Żory, Katowice—Figure 1). In these localities, the ground vibration level was low as 0.0001–0.0008 m/s.

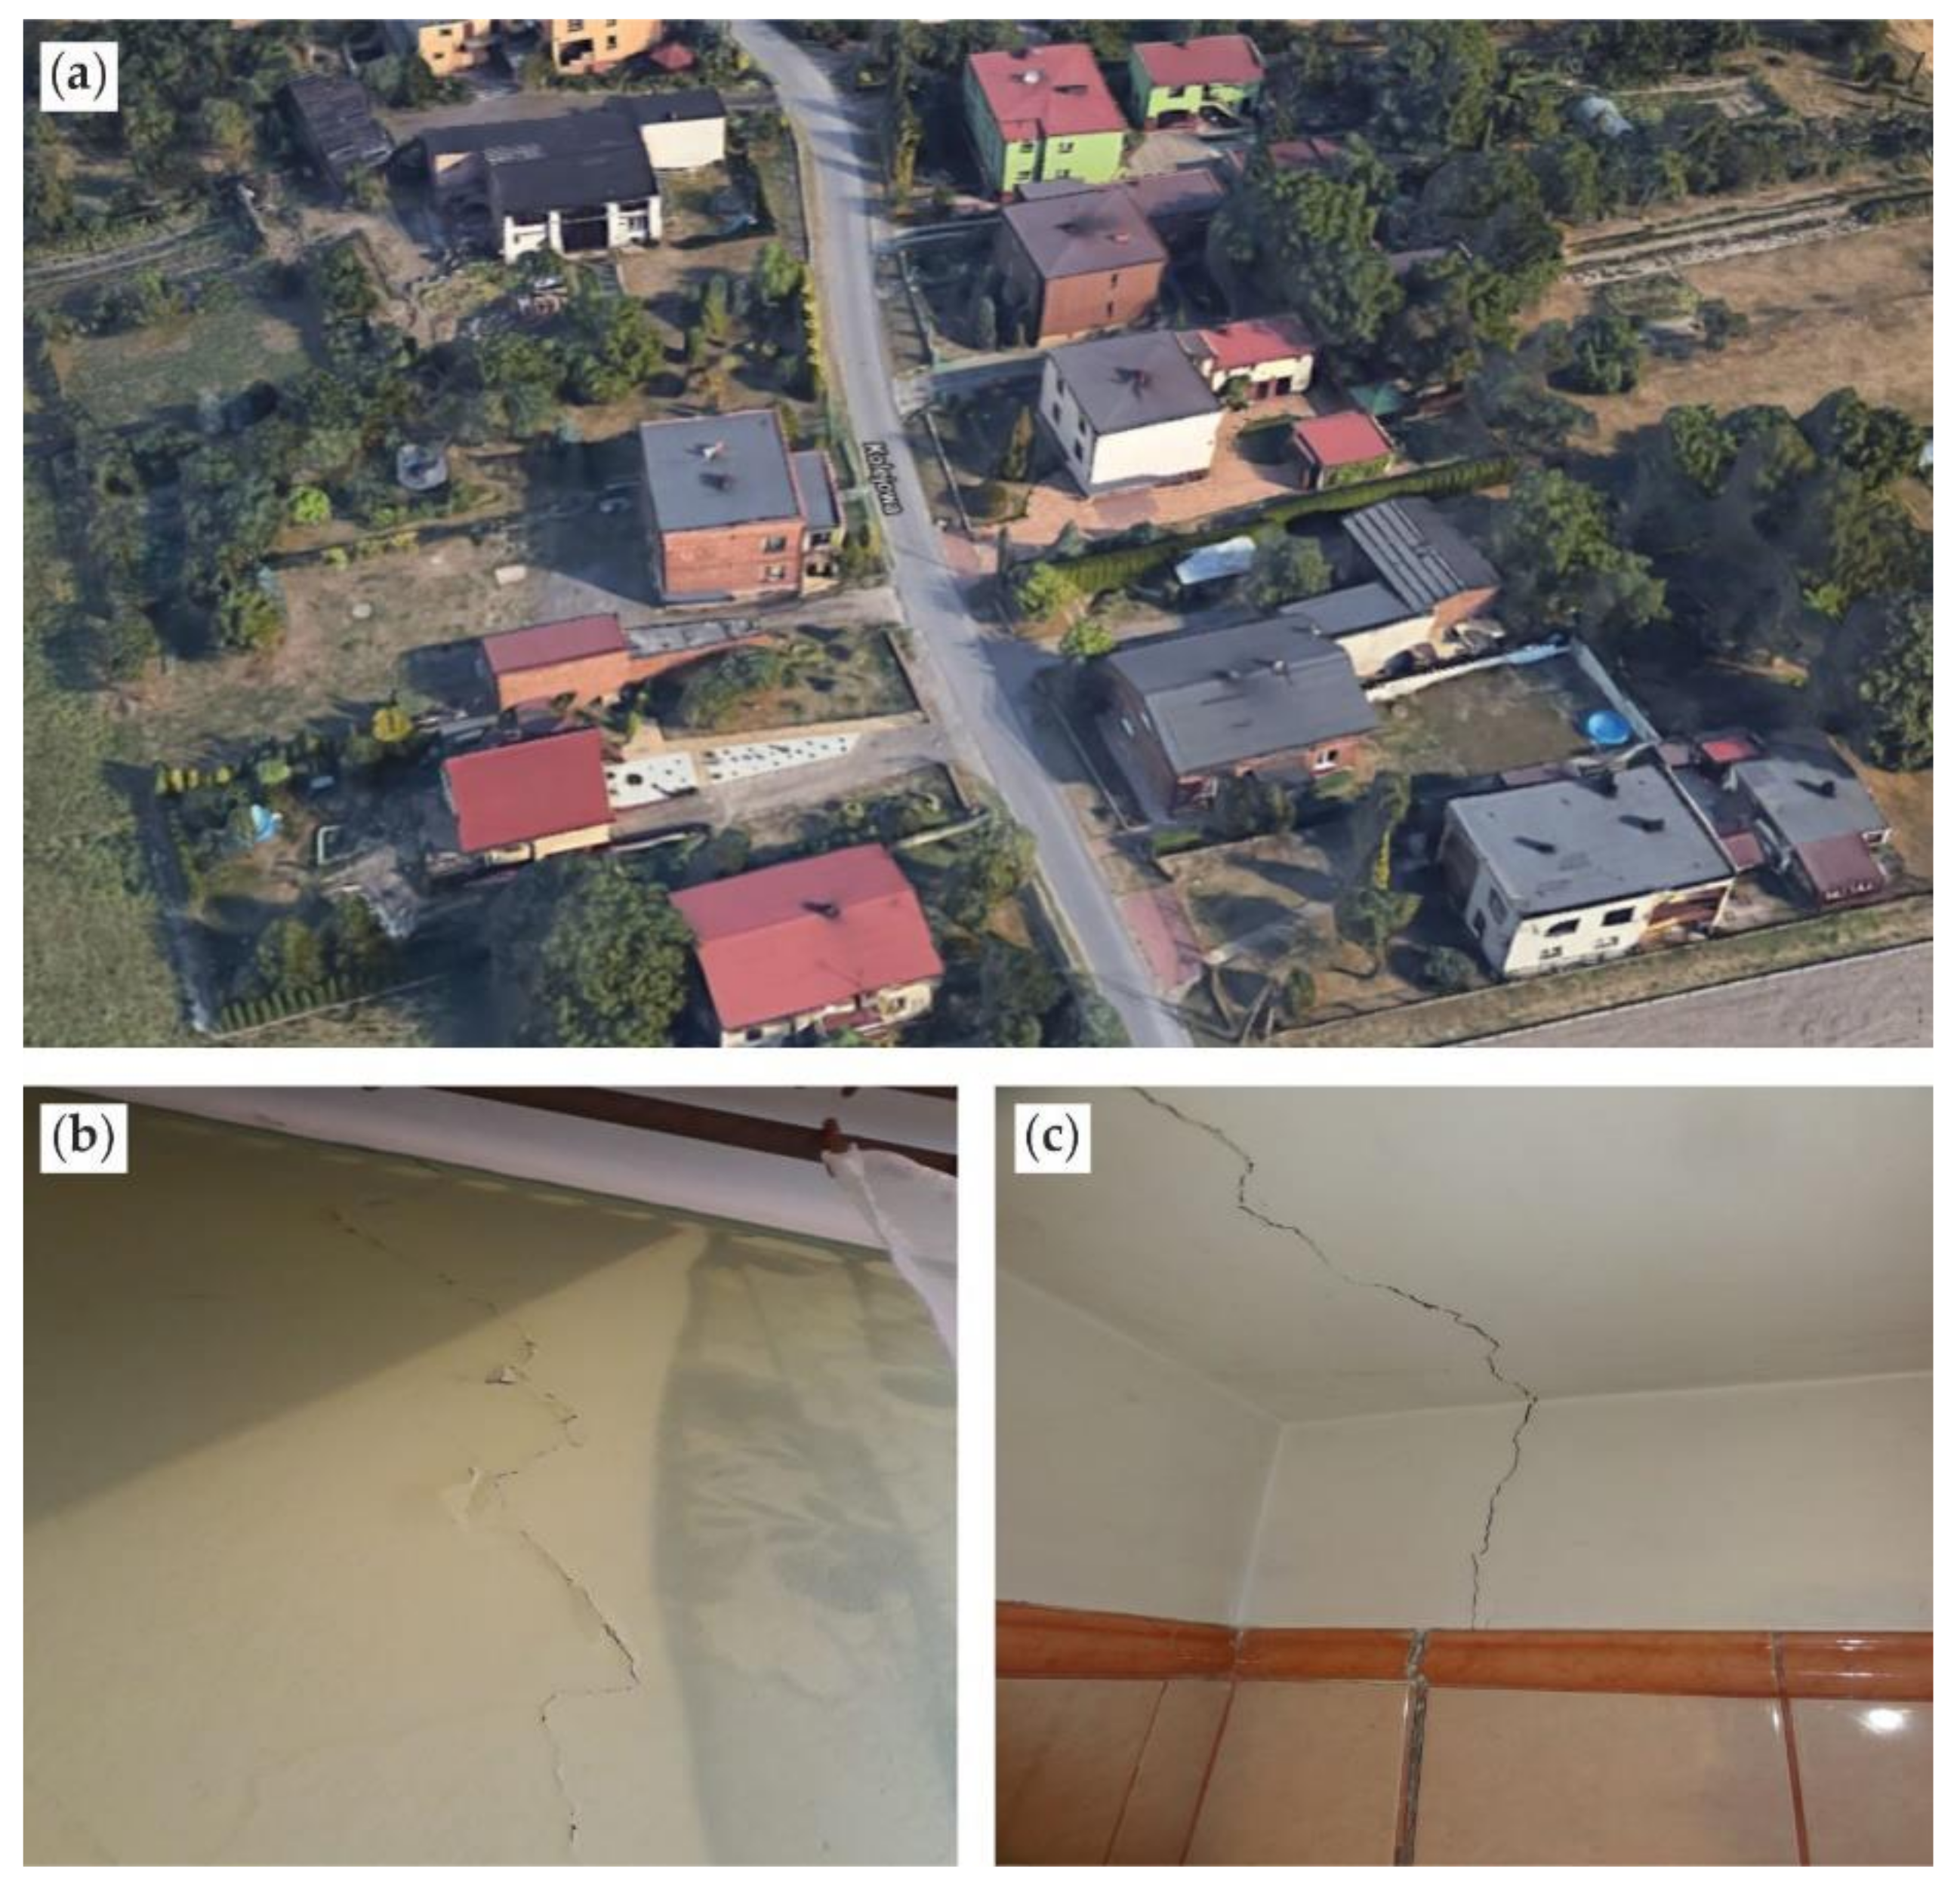
4.3. Damage to the Buildings on the Ground Surface

The tremor of 8 November 2018 caused many instances of damage to the buildings on the terrain surface, but it did not cause any damage to the underground mine workings. In the research area, there are mainly low-rise single-family residential buildings, up to two storeys above the ground, concentrated along the roads (Figure 8a). The buildings are typical of smaller towns and villages in Upper Silesia. The buildings have a historical, traditional structure or a traditional improved one, used from the second half of the 20th century. Traditional buildings have a structure in the form of load-bearing walls made of stone or brick, with wooden ceilings or brick-vault ceilings, set on stone or brick foundations. Buildings with a traditional, improved structure have load-bearing walls made of bricks and hollow bricks and reinforced concrete ceilings set on reinforced concrete foundations. The technical condition of buildings is directly related to the age of the structure and the impact of coal seams exploitation.
The damage occurred in 72 single-family residential buildings, inspected by the professional mining staff. Scratches and cracks in structural elements and elevation, the unsealing of chimney pipes, and the enlargement of existing damage were registered. Most of the damage to buildings occurred in the form of scratches or the enlargement of existing damage (Figure 8b,c).
Table 4 presents parameters of building damage: PGVHmax-D refers to the location of each building, DF is the horizontal distance between the building and the hanging wall of the Barbara fault, and DE, or the distance between the building and the tremor epicentre. The epicentral distance DE was calculated based on the epicentre coordinates and the damaged building coordinates in the local datum used by the mine. For the sake of clarity of graphical presentation, the damage to buildings at short distances has been grouped under one damage number, Nd. Distance DF to the Barbara fault has been measured directly from geodetic maps and given an accuracy of 50 m. The assumed accuracy results from the dimensions of the building itself and the accuracy of the graphical representation of the fault line on the maps.

5. Results

The model of the focal mechanism of the tremor of 8 November 2018 characterised a relatively high value of 62 % of the shear component. In this context, the direct cause of the tremor could probably be the reduction of mining-induced tectonic stresses in the Barbara fault zone existing in the area where the tremor occurred. This also means that the hypocentre of the tremor was located in the Barbara fault zone. The tectonic stresses were concentrated, due to past mining, on both sides of the Barbara fault. The current mining operation was only a trigger for the tectonic stress reduction and, as a consequence, the occurrence of the tremor in this region [35].
From the model of the focal mechanism of the tremor, one can observe that the nodal plane in the west-east direction is consistent with the extent of the Barbara fault. The orientation of fracture plane A (Table 2) means that the greatest radiation of seismic energy occurred in the south and west-east directions because this radiation is perpendicular and parallel to the fault plane in focus. Therefore, the intensity of ground vibrations on the terrain surface should be much greater towards the south of the focus and along the Barbara fault. This is confirmed by the location of damage to the buildings (Table 4, Figure 7, and Figure 9). The theoretical field of the PGVHmod (Figure 7) is aligned with the observed damage, which was greatest for intensity degrees III and IV; additionally, the extent of observed damage was greater south of the Barbara fault than north of the fault. It shows an agreement with values measured at the ST1–AMAX and ST3–AMAX stations (Table 3). The exception is the recording at ST2–AMAX.
Figure 9 shows the distribution of PGVHmax-DF at the site of the damaged building in terms of the distance DF from the hanging wall of the Barbara fault and number of damaged buildings. Distances DF with a minus sign from the Barbara fault indicate the building’s location south of the fault, while distances DF with a plus sign indicates distances north from the Barbara fault. One can observe that the number of instances of damage to buildings from the side of the hanging wall of the fault in the southern part of the research area is much greater than from the side of the footwall of the Barbara fault in the northern part of the research area. In the northern part, the number of instances of damage was 14, which means 19% of all cases of damage. In the southern part, it was 58 cases and 81% of all instances of damages, which was much greater (Table 4).
The greatest PGVHmax-DF occurred in the southern area of the Barbara fault. At most, they reached the value of about 0.05 m/s. North of the fault, the PGVHmod-DF were much smaller than on the south side. Such occurrences of damage to buildings indicate the probable impact of the fault and the seismic site effects on the size and number of cases of damage to buildings [36,37,38].
Table 4 and Figure 9 also show most instances of damage in buildings located at a distance of up to around 1200 m from the Barbara fault. This is consistent with other studies [6] conducted in the geological conditions of the Upper Silesian Coal Basin.

6. Conclusions

The study aims to estimate the impact of high-energy mining-induced tremor E = 4.0·108 J (local magnitude ML = 3.6) in a fault zone on damage to buildings on the ground surface. The study was performed in the seismically active mining area in the vicinity of the Barbara fault zone in the Upper Silesian Coal Basin, Poland.
Based on the results of the study, the following conclusions can be drawn:
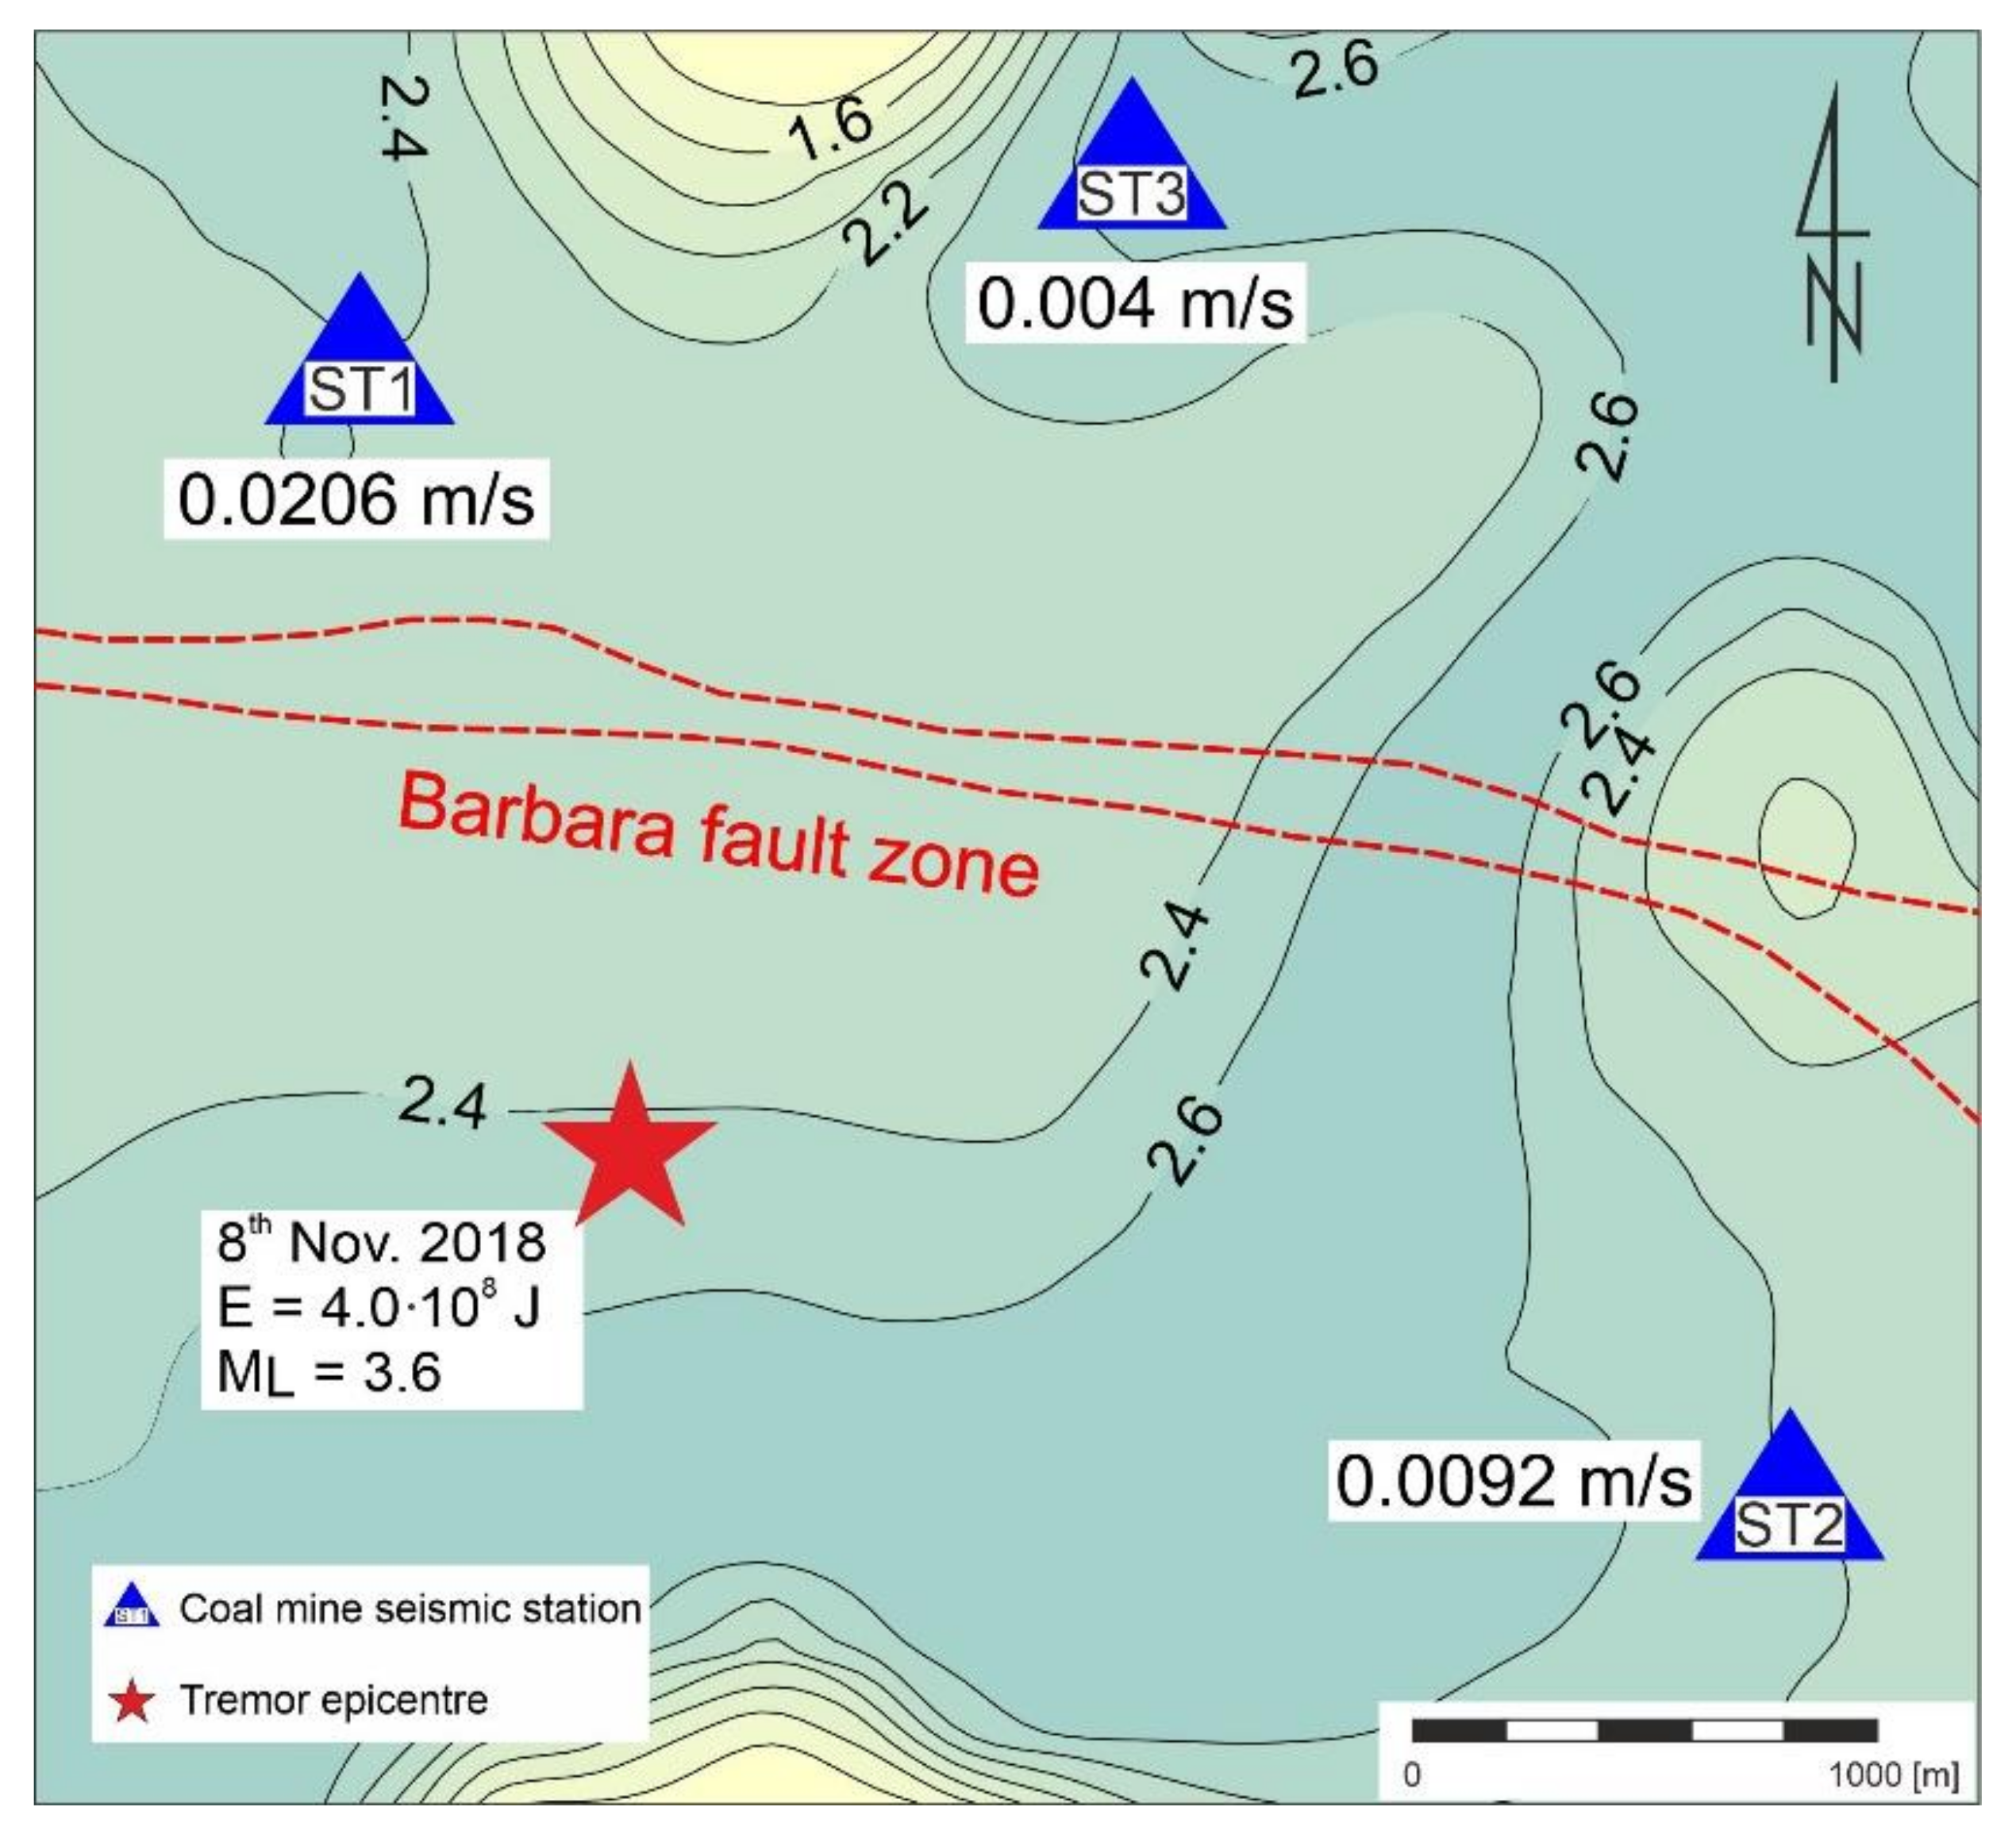
  • The high-energy tremor, which occurred on 8 November 2018, had a regional and tectonic character. The stress generated by the current mining was only a trigger reducing the elastic energy accumulated in the Barbara fault zone. This elastic energy accumulation resulted from historic exploitation in a large area from both sides of the fault zone;
  • The tremor was characterised by a normal slip mechanism with 62% of the shear component. The location and orientation of the focal fracture plane correlate with the orientation of the hanging wall of the Barbara fault zone. The orientation of the fracture plane means that the greatest radiation of seismic energy occurred in the south and west-east directions because this radiation is perpendicular and parallel to the plane in focus;
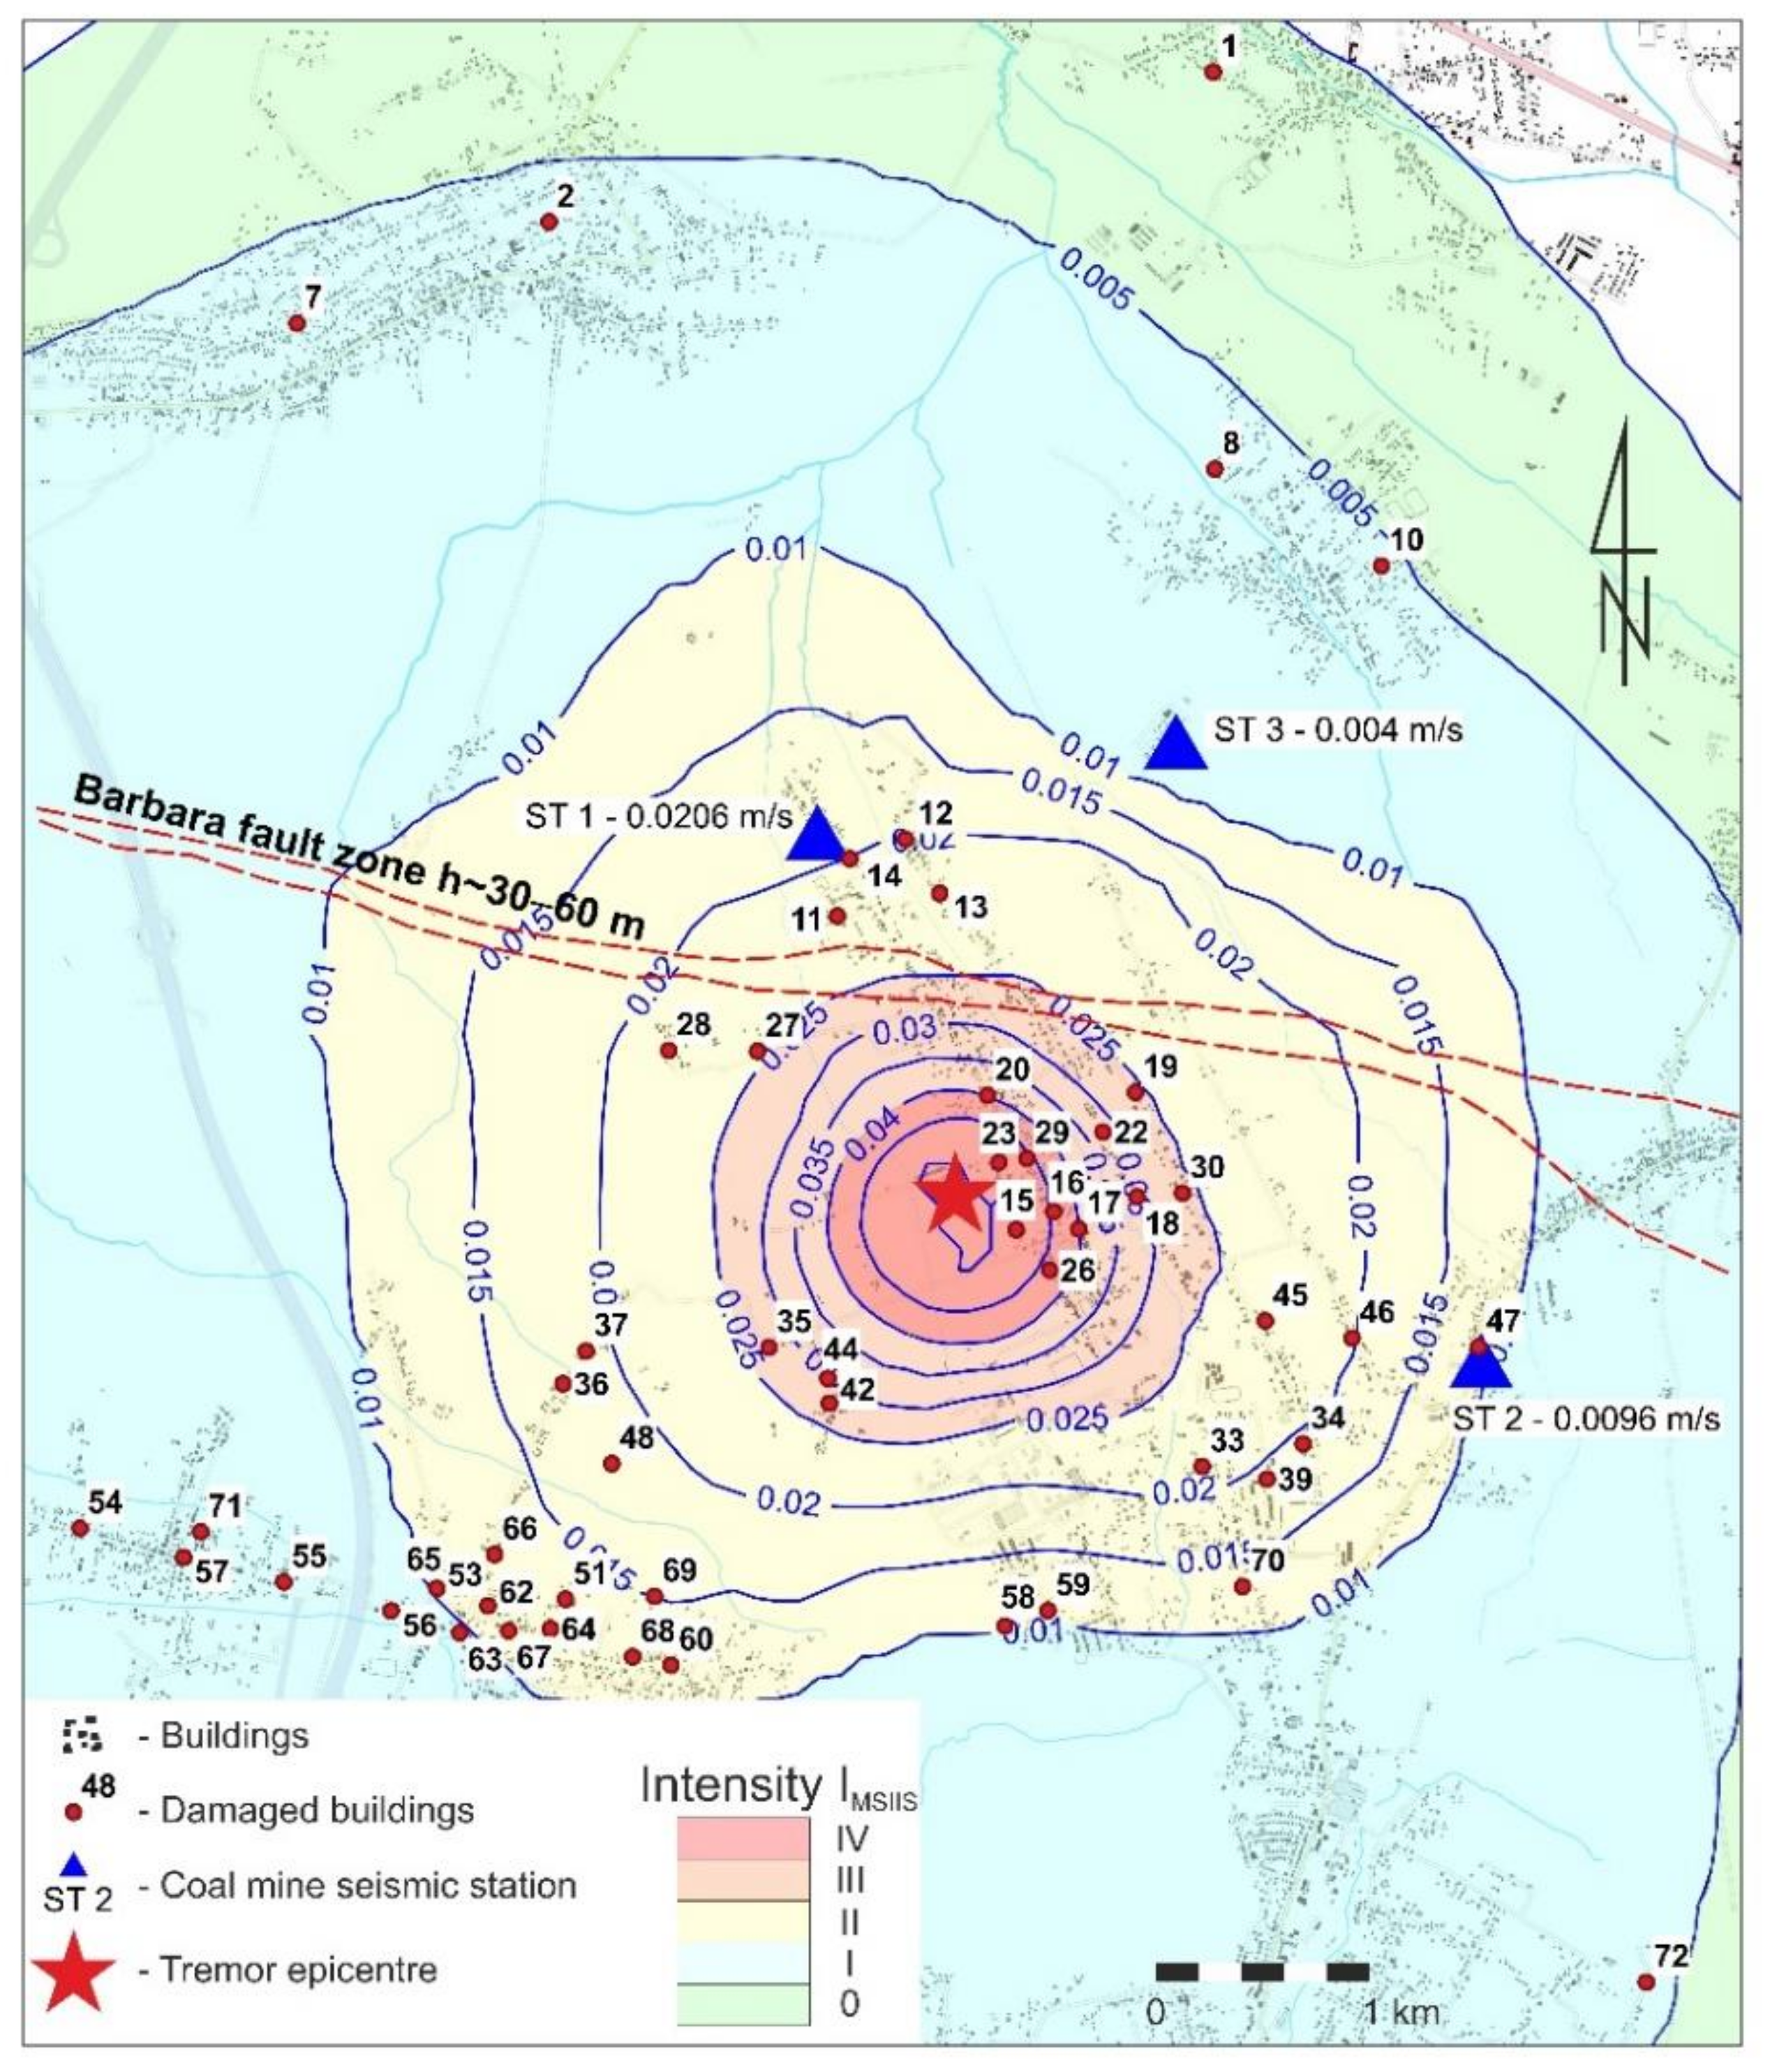
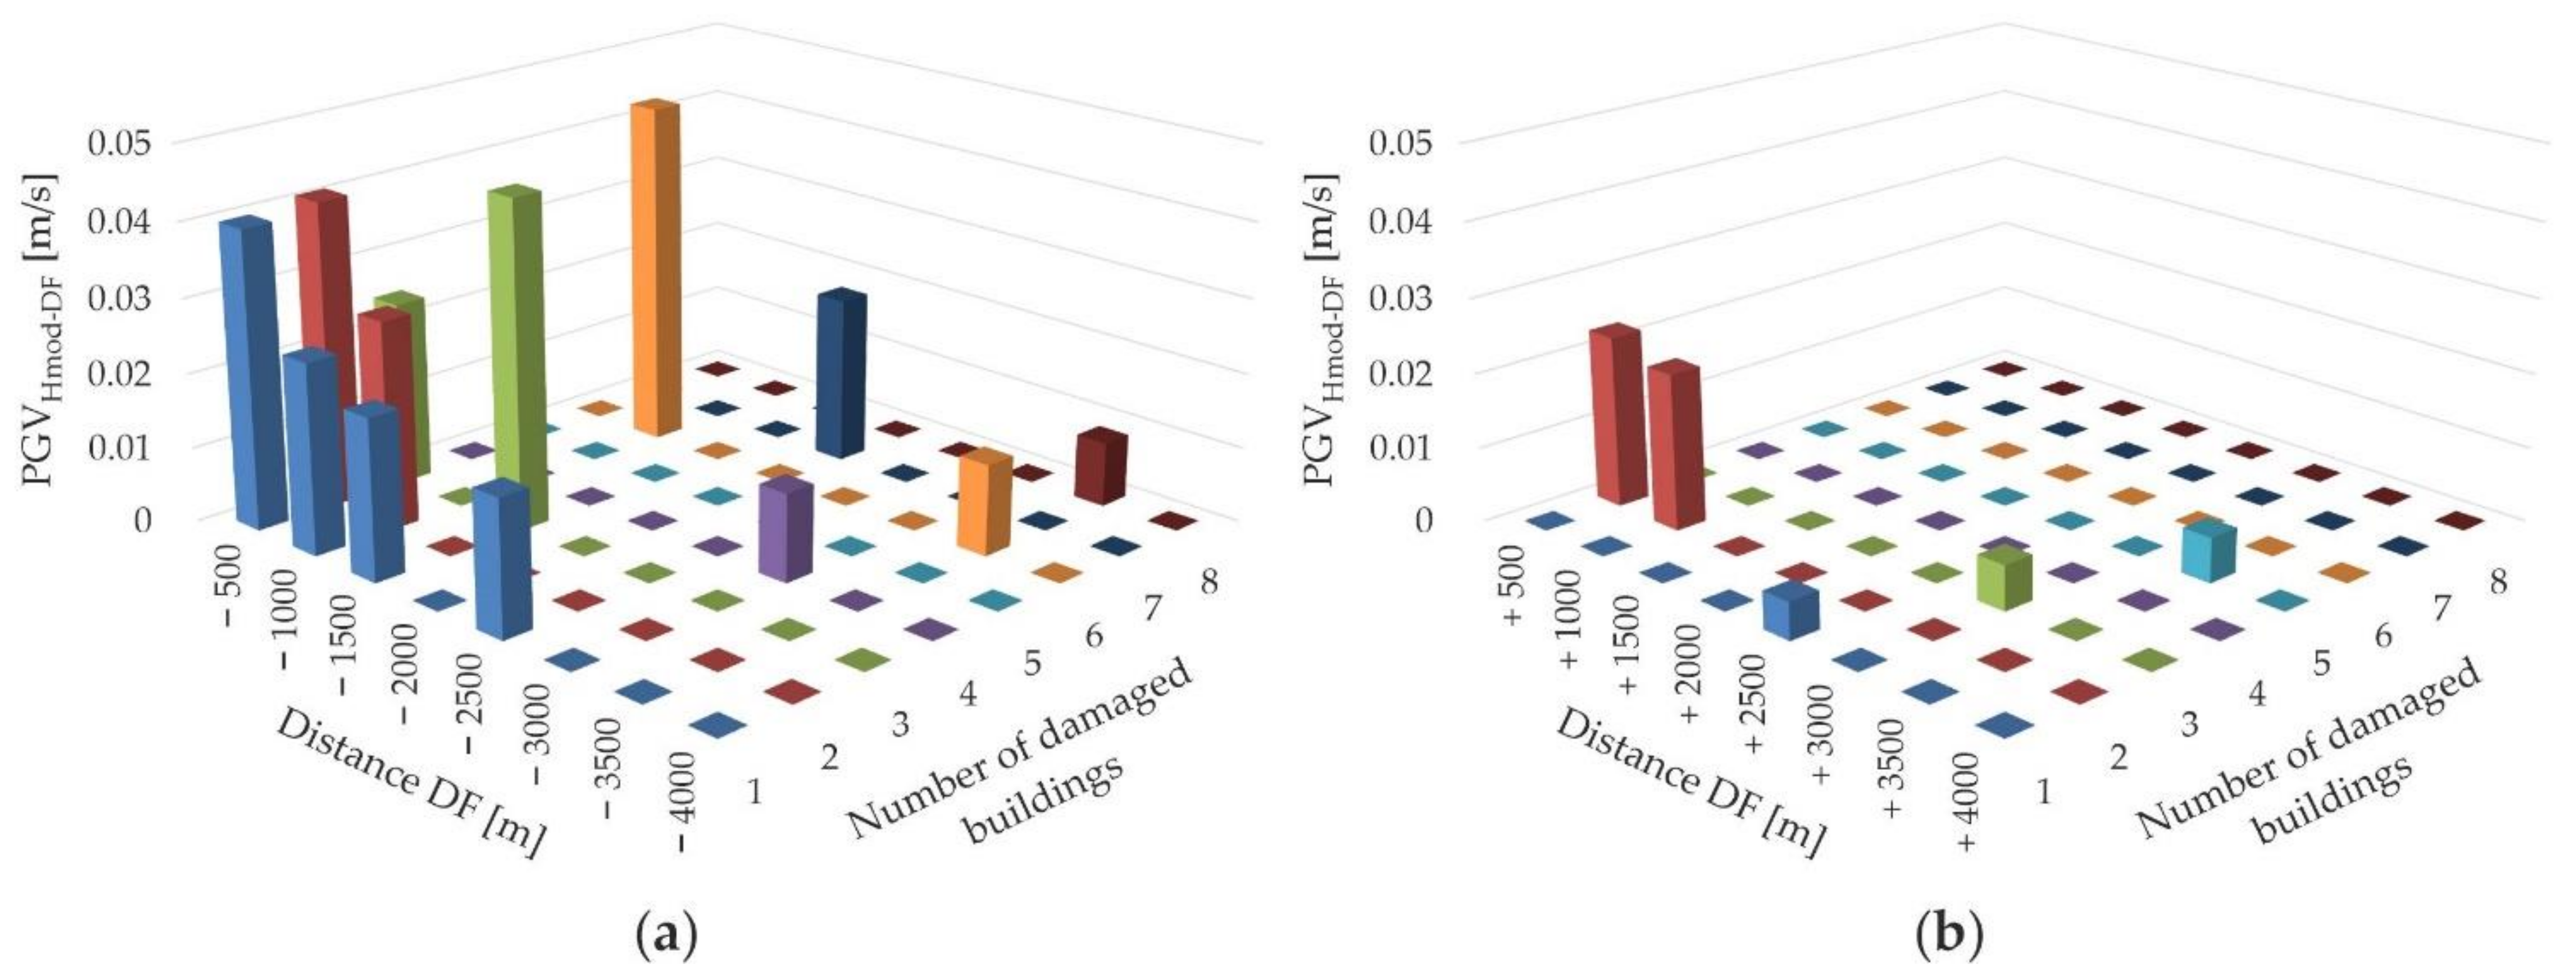
  • The seismic energy propagated in most in the south and west-east directions from the tremor focus has been confirmed with the location of damage to buildings on the ground surface. To the south of the Barbara normal fault, the number of cases of damage was greater than to the north of the fault. In the northern part, the number of instances of damage was 14 (19%), and in the southern part, it was 58 (81%). Another reason for the different cases of damages from both sides of the fault was the seismic energy attenuation by the rather wide Barbara fault zone of several dozen meters;
  • The most serious cases of damage to buildings were located at a distance of up to about 1200 m from the Barbara fault. This is in line with previous studies [6] on the geological conditions of the Upper Silesian Coal Basin.
The results confirm that the assessment of the impact of ground vibrations on buildings caused by mining-induced tremors should consider: (1) the directionality of seismic energy propagation resulting from the focal mechanism acting along a fault; (2) possible seismic energy attenuation by a wider fault zone. The study will be developed for other cases of high-energy mining-induced tremors in the geological conditions of the Upper Silesian Coal Basin.

Author Contributions

Conceptualisation, E.P., K.S., and Z.P.; methodology, E.P., K.S.; calculations, J.C., R.S.-Z., and K.K.; validation, Z.P.; formal analysis, K.S. and E.P.; writing—original draft preparation, E.P., K.S., J.C., K.K., R.S.-Z. and Z.P.; writing—review and editing, Z.P.; visualisation, J.C., K.K., R.S.-Z., and K.S.; supervision, E.P. All authors have read and agreed to the published version of the manuscript.

Funding

The project EPOS-PL—European Plate Observing System is funded within the Operational Programme Smart Growth 2014–2020 and co-financed by the European Union from the funds of the European Regional Development Fund (ERDF). Project number: POIR.04.02.00-14-A003/16-00. The research was prepared as a result of the LOFRES project no. PBS1/A2/13/2013 performed within the first call of the Applied Research Programme co-financed by the Polish National Centre for Research and Development. This article was funded by the Mineral and Energy Economy Research Institute of the Polish Academy of Sciences within statutory research.

Data Availability Statement

The data are not publicly available due to planned use in future research.

Acknowledgments

(1) The authors would like to thank the anonymous reviewers for their efforts towards improving the manuscript; (2) this study was developed on the basis of the Catalogue of Strong Mining Tremors of USCB at the Central Mining Institute and the Cracow University of Technology.

Conflicts of Interest

The authors declare no conflict of interest.

References

  1. Li, T.; Cai, M.F.; Cai, M. A Review of Mining-Induced Seismicity in China. Int. J. Rock Mech. Min. 2007, 44, 1149–1171. [Google Scholar] [CrossRef]
  2. Chodacki, J. New Ground Motion Prediction Equation for Peak Ground Velocity and Duration of Ground Motion for Mining Tremors in Upper Silesia. Acta Geophys. 2016, 64, 2449–2470. [Google Scholar] [CrossRef]
  3. Bańka, P.; Lier, E.; Fernández, M.M.; Chmiela, A.; Muñiz, Z.F.; Sanchez, A.B. Directional Attenuation Relationship for Ground Vibrations Induced by Mine Tremors. J. Min. Sci. 2020, 56, 236–245. [Google Scholar] [CrossRef]
  4. Dubiński, J.; Pilecki, Z.; Zuberek, W.M. (Eds.) Badania Geofizyczne W Kopalniach [Geophysical Surveying in Mines]; IGSMiE PAN: Cracow, Poland, 2001. (In Polish) [Google Scholar]
  5. Mutke, G.; Chodacki, J.; Muszyński, L.; Kremers, S.; Fritschen, R. Mining Seismic Instrumental Intensity Scale MSIIS-15 Verification in Coal Basins. In Proceedings of the 5th International Symposium: Mineral Resources and Mine Development, Aachen, Germany, 27–28 May 2015; RWTH Aachen University: Aachen, Germany; pp. 551–560. [Google Scholar]
  6. Pilecka, E.; Stec, K.; Szermer-Zaucha, R. The influence of the Kłodnica fault tectonic zone on the degree of damage to buildings resulting from high magnitude tremors. Tech. Trans. 2017, 7, 53–64. [Google Scholar] [CrossRef] [Green Version]
  7. Gibowicz, S.; Kijko, A. An Introduction to Mining Seismology; Academic Press Inc.: London, UK, 1994. [Google Scholar]
  8. Gibowicz, S.J. Seismicity induced by mining: Recent research. Adv. Geophys. 2009, 51, 1–563. [Google Scholar] [CrossRef]
  9. Marcak, H.; Pilecki, Z. Assessment of the subsidence ratio be based on seismic noise measurements in mining terrain. Arch. Min. Sci. 2019, 64, 197–212. [Google Scholar] [CrossRef]
  10. Dubiński, J.; Stec, K.; Mutke, G. Relationship between the focal mechanism of magnitude ML 3.3 seismic event induced by mining and distribution of peak ground velocity. In Proceedings of the 3rd International Conference on Applied Geophysics, Gniew, Poland, 21–23 June 2017; Volume 24. [Google Scholar] [CrossRef] [Green Version]
  11. Pilecki, Z. Dynamic Analysis of Mining Tremor Impact an Excavation in a Coal Mine. In FLAC Numerical Modeling in Geomechanics; Hart, D., Ed.; August Aimé Balkema: Rotterdam, The Netherlands, 1999; pp. 397–400. [Google Scholar]
  12. Wang, G.; Gong, S.; Li, Z.; Dou, L.; Cai, W.; Mao, Y. Evolution of stress concentration and energy release before rock bursts: Two case studies from Xingan Coal mine Hegang, China. Rock Mech. Rock Eng. 2016, 49, 3393–3401. [Google Scholar] [CrossRef]
  13. Kijko, A.; Drzęźla, B.; Stankiewicz, T. Bimodal character of extremal seismic events in Polish mines. Acta Geophys. 1987, 35, 1157–1168. [Google Scholar]
  14. European Committee for Standardization. Norm PN EN 1998-1:2005: Eurocode 8: Design Provisions for Earthquake Resistance of Structures–Part 1: General Rules, Seismic Actions and General Requirements for Structures; European Committee for Standardization: Brussels, Belgium, 2004. [Google Scholar]
  15. Cianciara, B.; Marcak, H. Models of the Spatial Distribution of Seismic Acceleration Caused by Mining Tremors. In Proceedings of the IXth Symposium on Seismic Impacts on Constructions, Cracow University of Technology, Kraków, Poland, 23–24 November 2000; pp. 183–193. (In Polish). [Google Scholar]
  16. Głowacka, E. Application of the extracted deposit volume as a measure of deformation for the seismic hazard evaluation in mines. Tectonophysics 1992, 202, 285–290. [Google Scholar] [CrossRef]
  17. Szreder, Z.; Pilecki, Z.; Kłosiński, J. Effectiveness of recognition of exploitation edge influence with the help of profiling of attenuation and velocity of seismic wave. Gospod. Surowcami Min. 2008, 24, 215–226. [Google Scholar]
  18. Czarny, R.; Marcak, H.; Nakata, N.; Pilecki, Z.; Isakow, Z. Monitoring velocity changes caused by underground coal mining using seismic noise. Pure. Appl. Geophys. 2016, 173, 1907–1916. [Google Scholar] [CrossRef]
  19. Czarny, R.; Pilecki, Z.; Nakata, N.; Pilecka, E.; Krawiec, K.; Harba, P.; Barnaś, M. 3D S-wave velocity imaging of a subsurface disturbed by mining using ambient seismic noise. Eng. Geol. 2019, 251, 115–127. [Google Scholar] [CrossRef]
  20. Dubiński, J.; Bukowska, M.; Stec, K. Geomechanical and Tectonophysical Conditions of Mining-Induced Seismicity in the Upper Silesian Coal Basin in Poland: A Case Study. Arch. Min. Sci. 2019, 64, 163–180. [Google Scholar] [CrossRef]
  21. Chlebowski, D.; Burtan, Z. Geophysical and analytical determination of overstressed zones in exploited coal seam: A case study. Acta Geophys. 2021, 69, 701–710. [Google Scholar] [CrossRef]
  22. Stec, K. Characteristics of seismic activity of the Upper Silesian coal basin in Poland. Geophys. J. Int. 2007, 168, 757–768. [Google Scholar] [CrossRef] [Green Version]
  23. Aki, K.; Richards, P.G. Quantitative Seismology: Theory and Methods; Freeman and Co.: San Francisco, CA, USA, 1980; Volume 1–2. [Google Scholar]
  24. Boore, D.M.; Joyner, W.B. The Empirical Prediction of Ground Motion. Bull. Seismol. Soc. Am. 1982, 72, 43–60. [Google Scholar] [CrossRef]
  25. Kwiatek, G.; Martínez-Garzón, P.; Bohnhoff, M. HybridMT: A MATLAB/shell environment package for seismic moment tensor inversion and refinement. Seismol. Res. Lett. 2016, 87, 964–976. [Google Scholar] [CrossRef] [Green Version]
  26. Bard, P.Y.; Bouchon, M. The seismic response of sediment-filled valleys. Part 2. The case of incident P and SV waves. Bull. Seismol. Soc. Am. 1980, 70, 1921–1941. [Google Scholar] [CrossRef]
  27. Pitilakis, K. Site Effects, in Recent Advances in Earthquake Geological Engineering and Microzonation; Ansal, A., Ed.; Kluwer Academic Publishers: Dordrecht, The Netherlands, 2004. [Google Scholar]
  28. Gatmiri, B.; Arson, C. Seismic site effects by an optimised 2D BE/FE method II. Quantification of site effects in two-dimensional sedimentary valleys. Soil Dyn. Earthq. Eng. 2008, 28, 646–661. [Google Scholar] [CrossRef]
  29. Moczo, P.; Kristek, J.; Bard, P.Y.; Stripajová, S.; Hollender, F.; Chovanová, Z.; Kristeková, M.; Sicilia, D. Key structural parameters affecting earthquake ground motion in 2D and 3D sedimentary structures. Bull. Earthq. Eng. 2018, 16, 2421–2450. [Google Scholar] [CrossRef] [Green Version]
  30. Falcone, G.; Boldini, D.; Amorosi, A. Site response analysis of an urban area: A multi-dimensional and non-linear approach. Soil Dyn. Earthq. Eng. 2018, 109, 33–45. [Google Scholar] [CrossRef]
  31. Falcone, G.; Acunzo, G.; Mendicelli, A.; Mori, F.; Naso, G.; Peronace, E.; Porchia, A.; Romagnoli, G.; Tarquini, E.; Moscatelli, M. Seismic amplification maps of Italy based on site-specific microzonation dataset and one-dimensional numerical approach. Eng. Geol. 2021, 289, 106170. [Google Scholar] [CrossRef]
  32. Dolce, M.; Prota, A.; Borzi, B.; da Porto, F.; Lagomarsino, S.; Magenes, G.; Moroni, C.; Penna, A.; Polese, M.; Speranza, E.; et al. Seismic risk assessment of residential buildings in Italy. Bull. Earthq. Eng. 2020, 19, 2999–3032. [Google Scholar] [CrossRef]
  33. Luo, Y.; Fan, X.; Huang, R.; Wang, Y.; Yunus, A.P.; Havenith, H.B. Topographic and near-surface stratigraphic amplification of the seismic response of a mountain slope revealed by field monitoring and numerical simulations. Eng. Geol. 2020, 271, 105607. [Google Scholar] [CrossRef]
  34. Fayjaloun, R.; Negulescu, C.; Roullé, A.; Auclair, S.; Gehl, P.; Faravelli, M.; Abrahamczyk, L.; Petrovčič, S.; Martinez-Frias, J. Sensitivity of Earthquake Damage Estimation to the Input Data (Soil Characterization Maps and Building Exposure): Case Study in the Luchon Valley, France. Geosciences 2021, 11, 249. [Google Scholar] [CrossRef]
  35. Chodacki, J. Simulation of ground motion in a Polish coal mine using the spectral-element method. J. Seismol. 2020, 24, 363–373. [Google Scholar] [CrossRef] [Green Version]
  36. Del Gaudio, V.; Coccia, S.; Wasowski, J.; Gallipoli, M.R.; Mucciarelli, M. Detection of directivity in seismic site response from microtremor spectral analysis. Nat. Hazard. Earth Syst. 2008, 8, 751–762. [Google Scholar] [CrossRef] [Green Version]
  37. Panzera, F.; Lombardo, G.; Imposa, S.; Grassi, S.; Gresta, S.; Catalano, S.; Romagnoli, G.; Tortorici, G.; Patti, F.; Di Maio, E. Correlation between earthquake damage and seismic site effects: The study case of Lentini and Carlentini, Italy. Eng. Geol. 2018, 240, 149–162. [Google Scholar] [CrossRef]
  38. Mori, F.; Gena, A.; Mendicelli, A.; Naso, G.; Spina, D. Seismic emergency system evaluation: The role of seismic hazard and local effects. Eng. Geol. 2020, 270, 105587. [Google Scholar] [CrossRef]
Figure 1. Map of mining areas in the Upper Silesian Coal Basin with the location of the tremor source of 8 November 2018, with seismic energy E = 4.0·108 J and seismic stations of the Upper Silesian Regional Seismological Network.
Energies 14 04112 g001
Figure 2. Cross-section through the research area with the Barbara fault zone and the tremor hypocentre that occurred on 8 November 2018. Description in the text.
Energies 14 04112 g002
Figure 3. Sketch of the exploitation of coal seams on both sides of the Barbara fault zone.
Energies 14 04112 g003
Figure 4. An example of a seismogram of the tremor of 8 November 2018 with seismic energy E = 4.0 · 108 J registered by seismic stations of the Upper Silesian Regional Seismological Network.
Energies 14 04112 g004
Figure 5. Map of the vibration amplification factor Wf isolines of the tremor of 8 November 2018 with AMAX seismometric stations.
Energies 14 04112 g005
Figure 6. Theoretical values of PGVH with 90% confidence intervals for the tremor of 8 November 2018 against epicentral distance d.
Energies 14 04112 g006
Figure 7. The predicted isoline map of PGVHmod with degrees of ground vibration intensity IMSIIS and location of damaged buildings for the tremor of 8 November 2018.
Energies 14 04112 g007
Figure 8. (a) The characteristic buildings of smaller towns and villages in Upper Silesia in the research area (google.pl/maps); (b,c) the characteristic damages that occurred in single-family residential buildings (own materials).
Energies 14 04112 g008
Figure 9. Distribution of PGVHmod-DF at the site of the damaged building in terms of the distance DF from the hanging wall of the Barbara fault and number of damaged buildings from (a) south of the fault and (b) north of the fault.
Energies 14 04112 g009
Table 1. Short form of the Mining Seismic Instrumental Intensity Scale [5].
IMSIISPGVHmax for short duration (tHV ≤ 1.5 s)
[m/s]
PGVHmax for long duration (tHV > 1.5 s)
[m/s]
Perceived
Shaking
Potential
Damage
I<0.005<0.005Not felt or weakly felt.None
II0.005–0.0200.005–0.010Felt indoors by many people, outdoors by few. Dishes rattle, hanging objects begin to sway.None
III0.020–0.0350.010–0.025Felt strongly indoors by many people, weak rocking of the whole building. Open windows and doors may close.Intensification of existing damage
IV0.035–0.0500.025–0.040Felt strongly by most people. Many people are frightened and run outdoors. The furniture may shift, the whole building rocks.Damage to decorative elements
V0.050–0.0700.040–0.060Felt very strongly by most people. Most people are frightened and try to run outdoors. A few people lose their balance. A large number of objects fall from shelves.Slight single structural damage
Table 2. Parameters of the focal mechanism of the tremor of 8 November 2018.
Nodal
Plane A, B
Stress
Axes C, T
Tensor
Component, %
Normal Slip
Mechanism
A
Φ°/δ°
λ°
B
Φ°/δ°
λ°
C
Φ°/δ°
T
Φ°/δ°
ISOCLVDDC Energies 14 04112 i001
269/60–8986/31–93184/75358/14182062
Symbols: Φ°, nodal plane azimuth A, B; δ°, dip of plane A, B; λ°: slip angle of A, B; Φ: axis azimuth of C, T; δ: plunge of the axis of C, T; ISO: percentage of an isotropic component; CLVD: percentage of compensated linear vector dipole component, compression (−), or tension (+); DC: percentage of shear component (double-couple).
Table 3. Ground motion parameters at the point of registration by AMAX coal mine stations for the tremor of 8 November 2018.
Seismic
Station
Epicentral Distance,
[m]
Amplification Factor Wf
[-]
PGV,
[m/s]
PGVHmod,
[m/s]
Duration Time tHT,
[s]
ST 1- AMAX18162.40.02060.0119.20
ST 2- AMAX25742.40.00920.00718.46
ST 3- AMAX23602.60.00400.00793.88
Table 4. Damage to buildings after the tremor of 8 November 2018 relative to the hanging wall of the Barbara fault.
No.Nd 1LocalityDescription of the damageDistance from the Barbara fault
+/−DF 2,3, [m]
PGVHmod-D [m/s]Epicentral distance
[m]
IMSIIS 4
1.1Gierałtowicescratches+45000.00353320
2.2Gierałtowicecracks+34500.0064870I
3.Gierałtowicefacade cracks+34500.0064870I
4.Gierałtowiceunsealing of the smoke duct, scratches+34500.0064870I
5.Gierałtowicedamage to the chimney, cracks and scratches+34500.0064870I
6.Gierałtowicescratches+34500.0064870I
7.7Gierałtowicescratches on the garage wall+26000.0065050I
8.8Gierałtowicescratches+26500.0063557I
9.Gierałtowicescratches+26000.0063517I
10.10Gierałtowicescratches+23000.0053514I
11.11Ornontowicebroken lintels above the window and scratches+3500.0231367II
12.12Ornontowicefarm building crack+7000.0211629II
13.13Ornontowicephoto frame broken+5000.0231364II
14.14Ornontowicescratches and cracks+6500.0211597II
15.15Ornontowiceslight widening of damage that occurred previously−10000.047362IV
16.Ornontowicescratches−10000.047359IV
17.Ornontowicescratches and cracks−11500.048391IV
18.16Ornontowiceslight widening of damage that occurred previously−9000.044489IV
19.17Ornontowicecracks−10000.040623IV
20.18Ornontowicescratches and cracks−8000.030863III
21.19Ornontowicedamage repaired during the last renovation (scratches and cracks) reappeared−2500.027958III
22.20Ornontowicecracks, overturning of a fragment of the firewall−3500.041452IV
23.Ornontowicecracks in the walls, broken glassware−3500.041452IV
24.22.Ornontowicedamage to the water system and water leakage−5000.033745III
25.23.Ornontowicescratches−7500.047242IV
26.Ornontowicescratches−9500.048214IV
27.26.Ornontowicescratches−12000.043601IV
28.Ornontowicescratches, luxfer rupture−12000.041628IV
29.27Ornontowicescratches−3000.0251103II
30.28Ornontowicescratches−3000.0221465II
31.29Ornontowicescratches−7000.046370IV
32.30Ornontowicescratches and detachment of a fragment of the glazing−7000.0261074III
33.33Ornontowiceseparating the vestibule from the rest of the building−20000.0211753II
34.34Ornontowicecracks in the ceiling, along steel beams and walls−18500.0192031II
35.35Ornontowicescratches and cracks−16500.0281140III
36.36Dębieńskocracks−19500.0182037II
37.Dębieńskocracks in the chimney and walls−20000.0172081II
38.Dębieńskoscratches−20000.0182051II
39.37.Dębieńskoscratches and cracks−17500.0181874II
40.Dębieńskoscratches−17000.0191796II
41.39Ornontowicewall scratches, cracks in ceramic tiles−20000.0182006II
42.42Ornontowicescratches−19500.0281165III
43.Ornontowicescratches−19500.0271170III
44.Ornontowicescratches and cracks−19500.0271145III
45.Ornontowicescratches, plaster losses−19500.0271145III
46.44Ornontowicescratches−18000.0291071III
47.45Ornontowicescratches−12500.0231590II
48.46Ornontowicescratches and cracks−12000.0201996II
49.47Mikołówscratches that have formed before−10000.0112567II
50.48Dębieńskoscratches, cracks, chimney damage−23000.0182049II
51.51Dębieńskominor scratches−29500.0132640II
52.54Dębieńskofacade crack−31000.0084370I
53.55Dębieńskofacade crack, separation of the stairs−32500.0093624I
54.Dębieńskoscratches and cracks−32500.0093609I
55.56Dębieńskoscratches and cracks−32500.0103283II
56.57Dębieńskoscratches and cracks−32000.0093983I
57.58Ornontowiceenlargement of existing scratch−29000.0102068II
58.59Ornontowiceenlargement of existing cracks−27500.0102031II
59.60Dębieńskoenlargement of previous cracks−32500.0132592II
60.62Dębieńskoscratches and cracks−30500.0112920II
61.63Dębieńskoscratches and cracks−32500.0103102II
62.64Dębieńskocracks in chimneys and facades−31000.0132790II
63.Dębieńskohorizontal crack, deformation of the door’s woodwork−31000.0132790II
64.65Dębieńskoscratches−29500.0103051II
65.Dębieńskoscratches and cracks−29500.0103051II
66.66Dębieńskoscratches−27500.0132741II
67.67Dębieńskoscratches−31500.0112930II
68.68Dębieńskoscratches−32000.0122655II
69.69Dębieńskoscratches and cracks−29000.0152365II
70.70Ornontowiceroof-tile scratches and cavities−25500.0132308II
71.71Dębieńskoscratches in the farm building−31000.0093859I
72.72Orzeszecavities in chimneys and roof tiles−34500.0054926I
1 (Nd), damage number in the drawing; 2 (+DF), north of the hanging wall of the Barbara fault; 3 (−DF), south of the hanging wall of the Barbara fault; 4 IMSIIS, intensity degree according to the MSIIS-15 scale.
Publisher’s Note: MDPI stays neutral with regard to jurisdictional claims in published maps and institutional affiliations.

