Article

Analysis of the Charging and Discharging Process of LiFePO4 Battery Pack

by
Wiesław Madej
* and
Andrzej Wojciechowski
Military Institute of Engineer Technology, Obornicka 136 Str., 50-961 Wrocław, Poland
*
Author to whom correspondence should be addressed.
Energies 2021, 14(13), 4055; https://doi.org/10.3390/en14134055
Submission received: 9 June 2021 / Revised: 29 June 2021 / Accepted: 1 July 2021 / Published: 5 July 2021
(This article belongs to the Special Issue Energy Security - Sociological and Technical Aspects and Innovations)

Abstract

:
A serious issue relative to the construction of electronic devices is proper power source selection. This problem is of particular importance when we are dealing with portable devices operating in varying environmental conditions, such as military equipment. A serious problem in the construction of electronic devices is the correct selection of the power source. In these types of devices, lithium-ion batteries are commonly used nowadays, and in particular their variety—lithium iron phosphate battery—LiFePO4. Apart from the many advantages of this type of battery offers, such as high power and energy density, a high number of charge and discharge cycles, and low self-discharge. They also have a major drawback—a risk of damage due to excessive discharge or overcharge. This article studies the process of charging and discharging a battery pack composed of cells with different initial charge levels. An attempt was made to determine the risk of damage to the cells relative to the differences in the initial charge level of the battery pack cells. It was verified, whether the successive charging and discharging cycles reduce or increase the differences in the amount of energy stored in individual cells of the pack.

1. Introduction

The widespread development of electronics allows for the production of portable devices characterized by high functionality. In the case of devices intended for the armed forces or other services operating in difficult environmental conditions, it becomes particularly important to attain the smallest possible dimensions and weight of devices, along with the longest possible period of their operation between either the replacement of the power source or the need to recharge it. With the current level of electronic systems integration, the most common element determining the weight and dimensions of the device is the power source itself. What follows is, on the one hand, the need to search for energy-saving solutions, characterized by a minimized electricity demand, and on the other hand, to seek light and more efficient power sources. Currently, lithium-ion (Li-ion) batteries are commonly used as a power source in these types of applications. Li-ion batteries have several advantages, on account of which they enjoy great popularity. The key benefits are high energy density, high durability, and low self-discharge, while the shortcomings of Li-ion batteries include their sensitivity to overcharging and deep discharge [1,2,3,4].
The constant development of lithium-ion technology gradually eliminates the disadvantages of this type of battery, making them safe to use. A number of Li-ion battery types have been developed which differ mainly in as far as the electrode material is concerned. In the research described in this article, LiFePO4 batteries were used in which the risk of uncontrolled temperature increase in the case of overcharging was reduced, as compared to cobalt-based cells [5].
To obtain the required power source parameters, batteries are connected into packs. The parallel connection allows for higher capacity to be obtained [6], while the series connection provides increased output voltage. Only batteries of the same type, from one production lot and characterized by the same state of charge should be combined into packs [7]. Differing states of batteries (state-of-charge (SoC), their capacity, internal impedance) result in an uneven distribution of energy accumulated in the cells of the pack, which may lead to their overcharging or deep (excessive) discharge and, consequently, to battery damage. For these reasons, the state-of-health (SoH) of the cells used in the pack is an important parameter to be taken into account. In practice, however, it is very difficult to determine the current SoH level. Due to irreversible electrochemical reactions, as batteries are being used, their parameters gradually degrade [8,9]. Many external factors influence the rapidity and magnitude of these changes. Therefore, in the pack, the aging processes taking place may vary from battery to battery. The rate of capacity-fade and changes in internal resistance depends, inter alia, on the battery SoC and temperature [10]. If there are differences in the capacities of the cells, the discrepancy deepens in subsequent charge/discharge cycles, leading either to overcharging or over-discharge of the lowest capacity cell. Maintaining an overcharged or over-discharged state leads to cell damage [11]. To guard against such situations, battery management systems (BMS) are used, which protect the cells against overcharging, excessive discharge, and overload [12,13,14]. It is made possible due to the parameters of individual cells being constantly monitored by the BMS systems. SoC is a crucial parameter, the precise determination of which has a substantial impact on the effectiveness of the BMS system. For the precise determination of SoC, many methods have been developed based on complex modeling of Li-ion cells taking into account inter alia: SoH, the internal resistance of the cell, and other parameters [15,16,17]. For a BMS system, precise SoC determination is of particular importance in complex, high-capacity energy storage systems. In simple, small-capacity systems, the most economical and commonly used solutions are based on charge counting (CC) [15].
This article presents the results of research on the charging and discharging processes of a LiFePO4 battery pack, which is practically applied in portable devices with low energy consumption, e.g., mine-laying and mine-clearing equipment. It was examined whether the differences in the capacities of individual batteries from one production batch could lead to their operation in conditions not recommended by the manufacturer, leading to the risk of overcharging or excessive discharge of the cells comprising the pack. The impact of successive charge-discharge cycles on the energy spread stored in individual cells was analyzed. Then, the influence of the BMS on the charging-discharging process, including the energy distribution between the cells, efficiency, and cycle duration, was verified.
The tests were performed in conditions similar to those occurring during the operation of the battery pack with the configuration available in a real dual-use device. The research was aimed at determining the potential causes of failure of a battery pack with no protection offered by the BMS systems and checking the available methods of tackling this issue.
Among the novelty elements of the proposed solutions in this article in respect to literature, the following should be distinguished:
  • Testing the process of charging and discharging a pack, in which one of the batteries is characterized by different initial energy;
  • Testing the process of charging the pack immediately following the discharge cycle, without the relaxation period;
  • Indication of the possibility of protecting the battery pack in the discharge process solely based on information on the voltage of the entire pack.

2. Materials and Methods

2.1. Comparison of the State of Batteries in a Pack

The basic parameter allowing the comparison of the state of batteries is the battery state of charge (SoC). SoC determines the amount of energy stored in the battery relative to its nominal capacity. This parameter cannot be measured directly, however, there are several methods allowing the SoC to be inferred indirectly. In the case of the tested batteries, the methods of assessing physicochemical properties of the battery (electrolyte, electrodes) are not applicable [18]. The methods which use voltage, current, and temperature measurement can be applied in practice [19].
Battery voltage (UB) depends on SoC, and thus theoretically, this dependence can be used to determine SoC. However, in LiFePO4 batteries in a wide range of SoC, the voltage characteristic changes with SoC decreasing very slightly [20]. This makes it difficult to accurately determine the current state of the battery at each point. Clear UB changes occur at a low SoC level [20,21,22]. Moreover, this characteristic largely depends on current and temperature, which makes its application difficult. The elimination of the influence of current is possible by measuring the battery’s open-circuit voltage (OCV, VOC). However, immediately after the load is disconnected, the VOC changes for the time necessary for the battery to reach electrochemical equilibrium [23], which is not clearly defined, and that, in many applications, makes it difficult to use this parameter in practice.
Another method used to estimate SoC is to calculate the charge present in the battery from the measurement of the current and time during the charging or discharging. To determine the absolute value of the SoC, it is necessary to know the initial state of SoC prior to charging/discharging [8,15,16,19,21]. If the SoC is not known, it is possible to calculate the SoC change during the charging/discharging cycle according to the following relationship:
Δ SoC = 1 C n 0 T I t dt  
where Cn denotes nominal battery capacity, I is charge/discharge current, t is time, and T denotes charge/discharge time.
In the case of a battery packs connected in series, this method will not allow the determination of the degree of the SoC variation between individual cells, as the current flowing through all the cells is the same.
The energy spread between individual cells of the pack can be determined by measuring the current and voltage at each cell during charging/discharging and calculating the energy supplied by or drawn by the batteries, according to the following Formula (2):
E B = 0 T U B t I t dt  
where EB represents energy supplied by/drawn by the battery, UB is the voltage measured at the battery terminals, I denotes charging/discharging current of the battery pack, t denotes time, and T—charging/discharging time.
For ideal batteries, the energy drawn during charging would be equal to the energy supplied to the receiver during discharge. Obviously, battery efficiency is less than 100%, and one of the main factors responsible is its internal resistance. According to a commonly used Li-ion battery equivalent model, the series resistance value depends, to a large extent, on the SoC, and it increases with a decrease in the SoC value [5,17,18,24]. This fact leads to an increase in the differences in the energies stored in batteries of varying SoC levels.
Based on the analysis presented above, the measurement of voltage UB and energy EB was used to determine the degree of SoC variation of the batteries comprising the tested pack. Throughout the research, efforts were not aimed at determining the exact SoC value, but rather at investigating the degree to which individual batteries differ after successive charging/discharging cycles. UB of the batteries at the end of charging and discharging cycles was compared.
The EB energy for each cell was calculated by numerical integration using the rectangle method according to the following formula:
E Bn = 0 T U Bn t I t dt   t i = 0 m U Bn i I i
where EBn is the energy supplied by or drawn by the battery Bn, UBn denotes voltage measured at the battery terminals Bn, I is battery pack charging/discharging current, t is time, T denotes charging/discharging time, and Δt is the time between subsequent measurements, m = T/Δt.

2.2. Cell Balancing System

One of the tasks of battery management systems (BMS) is ensuring that the battery condition is balanced [25]. There are numerous techniques for achieving equilibrium, but they are broadly divided into active and passive methods. Active methods are used in high power systems, where the dissipation of large amounts of energy for battery cell balancing would be unacceptable [7,12]. In the case of batteries used in portable devices, the energy stored by them is relatively low, and in this area, practically only passive balancing systems are used. The operation of these systems consists mainly of controlling the voltages of individual batteries during charging/discharging and adding additional loads in parallel to individual cells by controlling the FET keys according to a specific algorithm [12]. This is the principle behind the BMS, constructed on the basis of the ABLIC (Tokyo, Japan) S-8254A system used during the study.

2.3. Measurement System

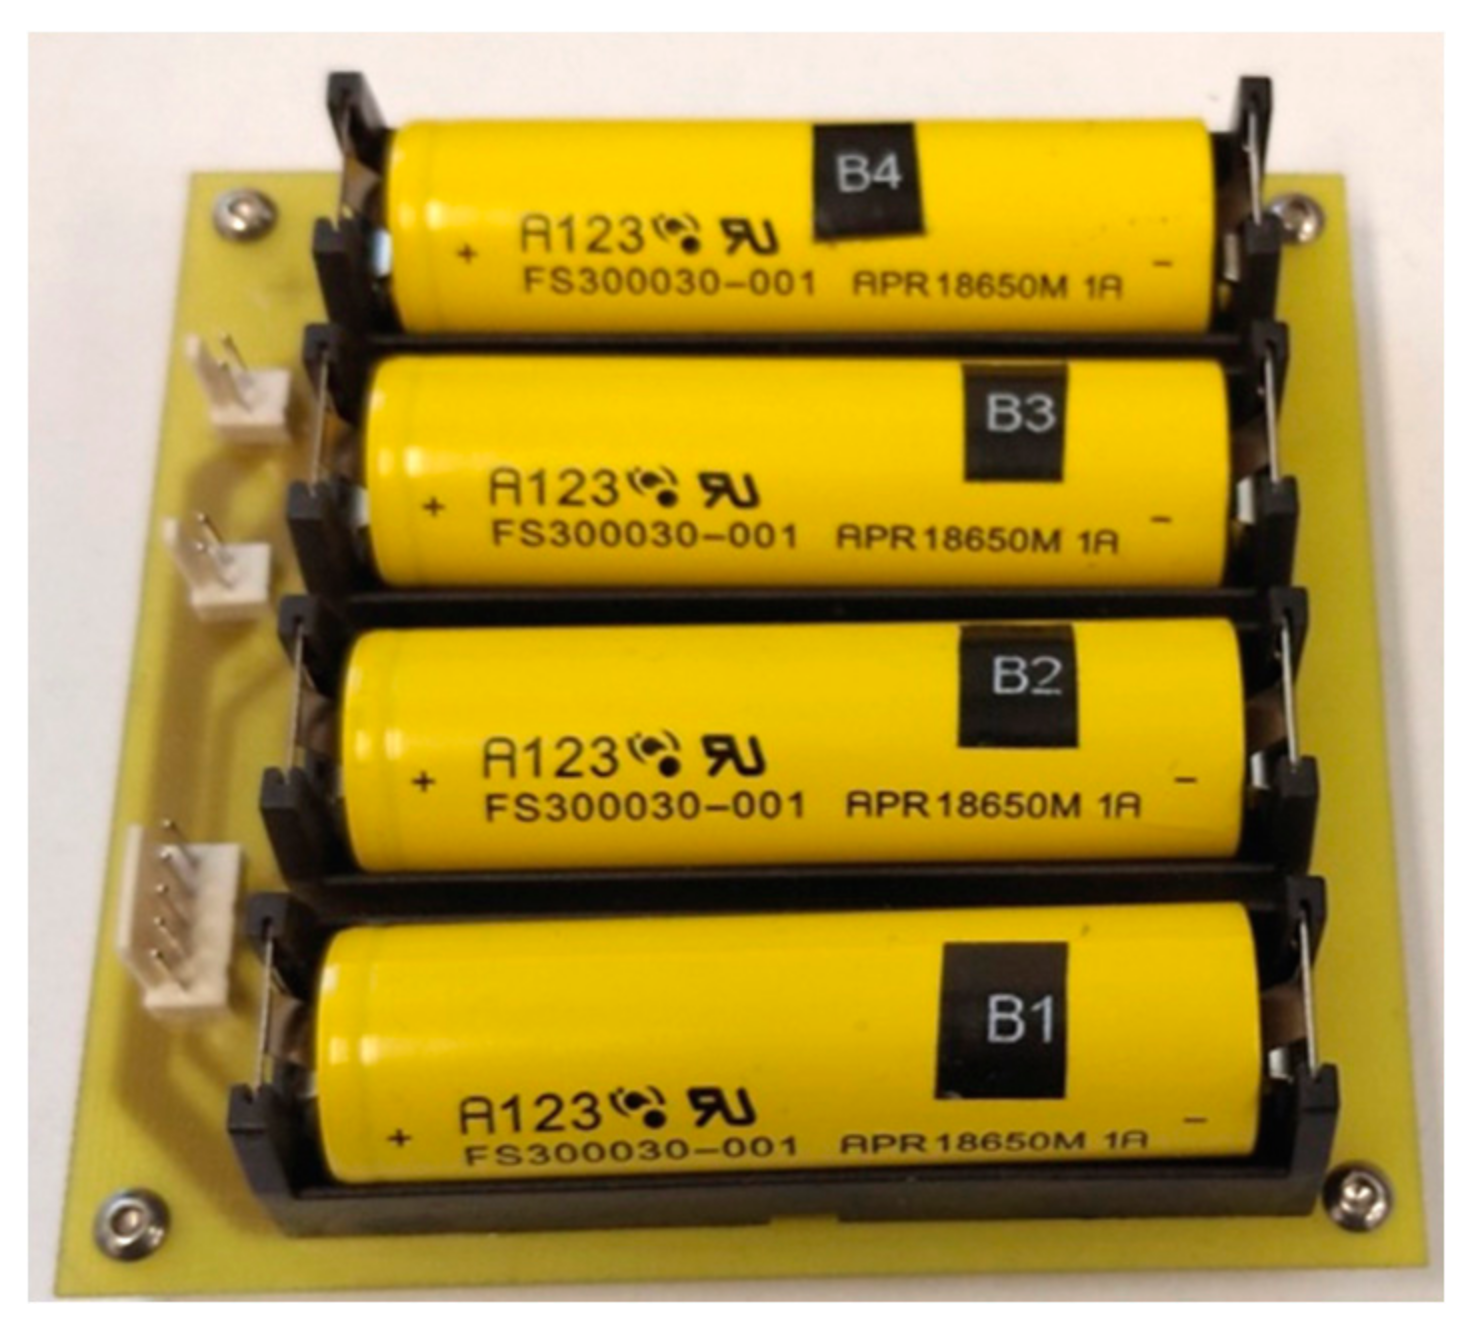
The tests were carried out with the use of commonly available APR 18650M 1A batteries manufactured by A123 Systems company (Novi, MI, USA). Fresh batteries, never used before, were used for the tests. Based on previous measurements of the properties of APR 18650M 1A batteries, carried out by the authors on lots from various deliveries, it appears that the state of charge of the new batteries was approximately 50%. Within one lot, it was found that there were variations between the individual units of up to 50 mAh. For these reasons, the battery marked as B1 was discharged by 50 mAh, which was about 4.5% of the nominal capacity (1100 mAh), for the tests. Then the batteries were connected in series to form a pack (Figure 1).
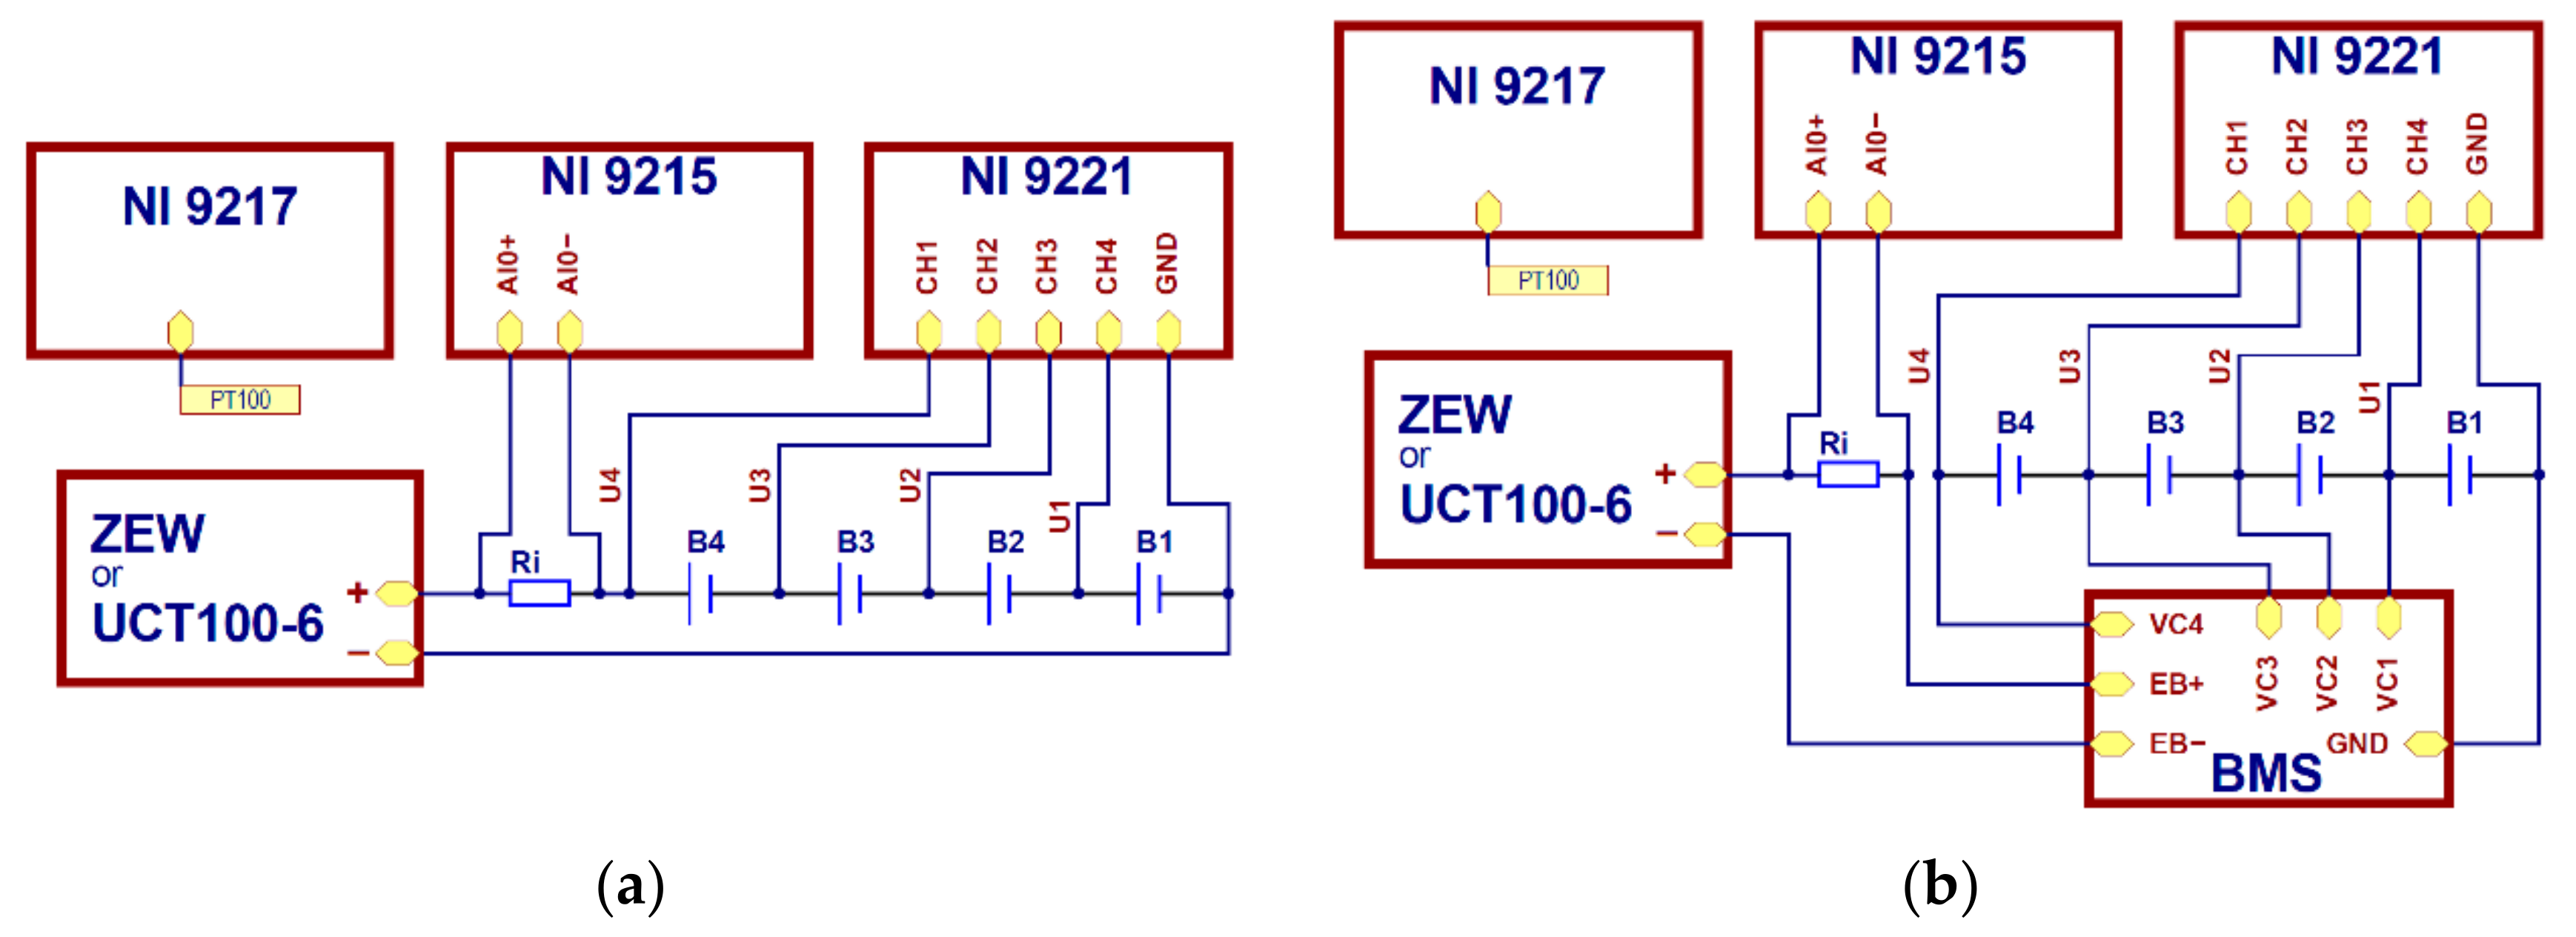
According to Section 2.1, to determine the condition of individual batteries in the pack, voltage measurements for individual batteries had to be conducted and measurements of the current flowing through the cells during the charging and discharging processes. Measurements were carried out in the arrangement shown in Figure 2 using the following measurement modules: NI 9221, NI 9215, and NI 9217 by the National Instruments company (NI). The NI 9221 module enabled voltage measurements with a resolution of 12 bits, whereas the NI 9215 allowed for differential measurements with a 16-bit resolution.
U1 ÷ U4 voltage measurements were conducted using the NI 9221 module, while the NI 9215 module was used to measure Ui on the Ri resistor, whose resistance equals 10 mΩ. All the measurements were recorded every 5 s.
Voltage values for individual batteries were calculated based on the following dependences:
UB1 = U1
UB2 = U2 − U1
UB3 = U3 − U2
UB4 = U4 − U3
where UB1 ÷ UB4 voltage for B1 ÷ B4 batteries, U1 ÷ U4 voltage measures in points indicated in Figure 2. The current intensity was calculated using the following formula:
I = Ui/Ri
The charging and discharging of the battery pack was performed with the use of two types of chargers:
1. ZEW-type battery charger (constructed by the authors, based on the charger used in electric detonation systems);
2. UCT100-6 battery-charging station by the VOLTCRAFT company (Wollerau, Switzerland).
The ZEW-type charger test results allowed the authors to evaluate the operation of the batteries in their actual operating conditions. The use of the UCT100-6 universal charger provided the means of checking whether the change of charging parameters had a significant impact on the behavior of the batteries.
In both devices, the charging process followed the CC-CV method [9]. In the first charging stage, the charging current (CC) was constant, and after the voltage threshold value was reached, a shift was made to the constant voltage (CV) charging method at the charger output until the charging current dropped to the minimum threshold value. Charging parameters cannot be changed in the ZEW charger. The charging current of the CC phase was 0.5 A, while the voltage in the CV phase equaled 14 V.
The discharge process in the ZEW-type charger was carried out by attaching a constant resistance load to the battery pack. Due to the high constant voltage characteristic of LiFePO4 batteries in a wide range of SoC changes; also the current during discharge remained constant and amounted to 0.8 A. The UCT100-6 charger enables the regulation and stabilization of the discharge current.

3. Results and Discussion

The discharge cycle initiated tests of the battery pack prepared as described in Section 2.1. Then the charge/discharge cycles were repeated 20 times using the ZEW-type charger, and afterward, six cycles were performed using the UCT100-6 type charger. During tests with the use of the ZEW-type charger, the transition to the charging process took place automatically, immediately following the end of the discharge. Batteries were not subjected to relaxation. All the measurements were carried out at room temperature and it was assumed that changes in the range of approximately 3 K did not have a noteworthy impact on the obtained results.

3.1. Test Results of the Battery Pack without the BMS System

3.1.1. Charging and Discharging the Battery Pack with the ZEW-Type Charger

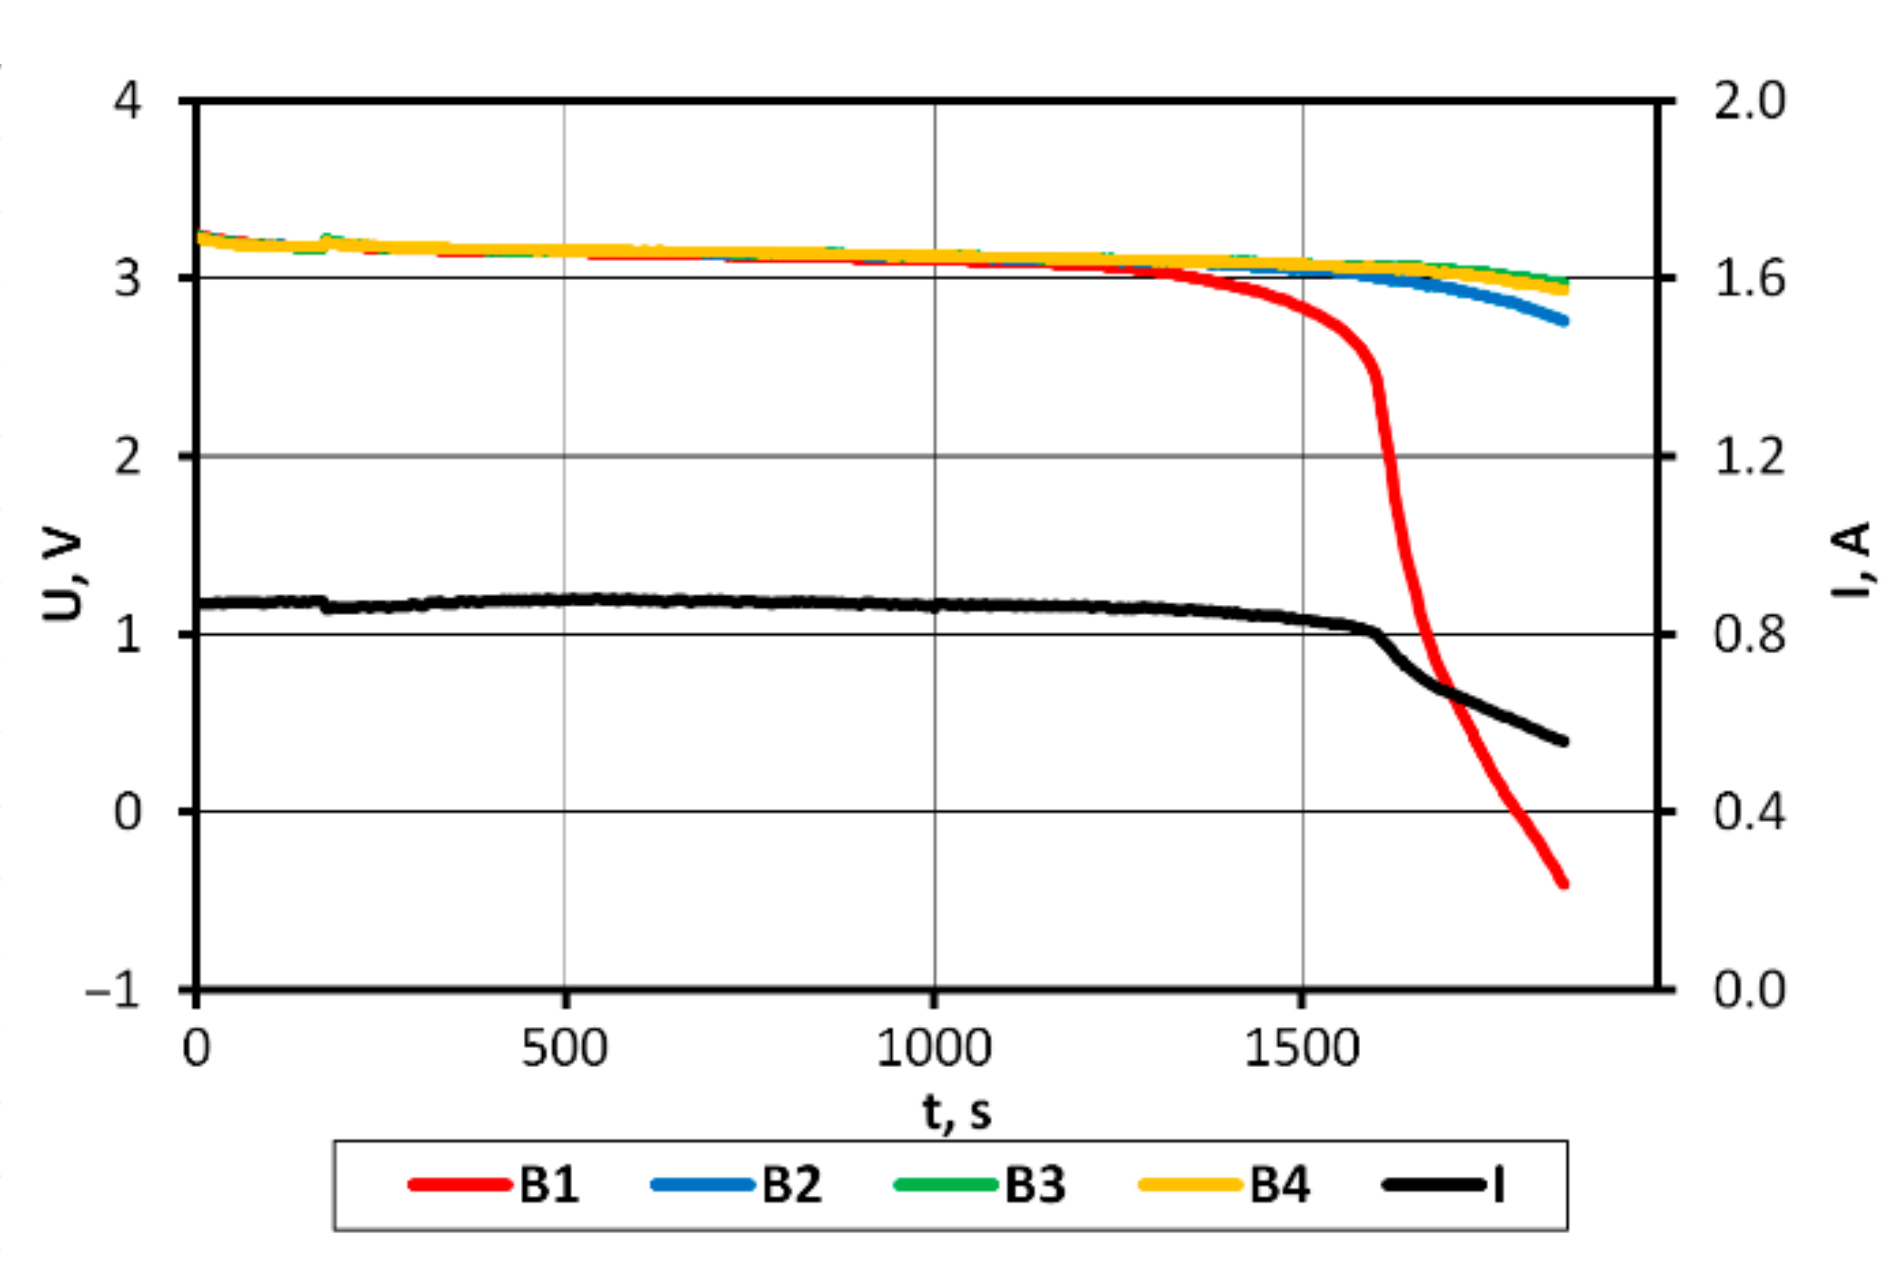
Based on the first discharge cycle (Figure 3), the primary differences between the batteries were determined.
Table 1 presents battery voltages at the end of the discharge cycle and shifting of the charger to the charging mode, and the energy supplied by the batteries, calculated in accordance with the Formula (3). To visualize the unbalance of the batteries, the relative differences (∆EBn) of the energy of the batteries relative to the average energy of the B2 ÷ B4 batteries (Es) were calculated using the following relationships:
E S = i = 2 4 E Bi 3
E Bn = E Bn E S E S 100 %
Referencing the average energy of B2 ÷ B4 batteries allows for a better reflection of the changes in the unbalance of the originally introduced into B1 battery.
The obtained results confirmed that the original battery charge level was approximately 50% and the assumed unbalance level was correct.
The initially introduced imbalance at the 4.5% level lead to an over-discharge state of the weakest battery (B1) already at the first discharge, bringing it to a voltage well below the lower allowable limit of 2 V [20]. There was a negative voltage on this battery in the final phase of the discharge (reverse polarity). The value of this voltage indicated the degree of over-discharge of the cell [10].
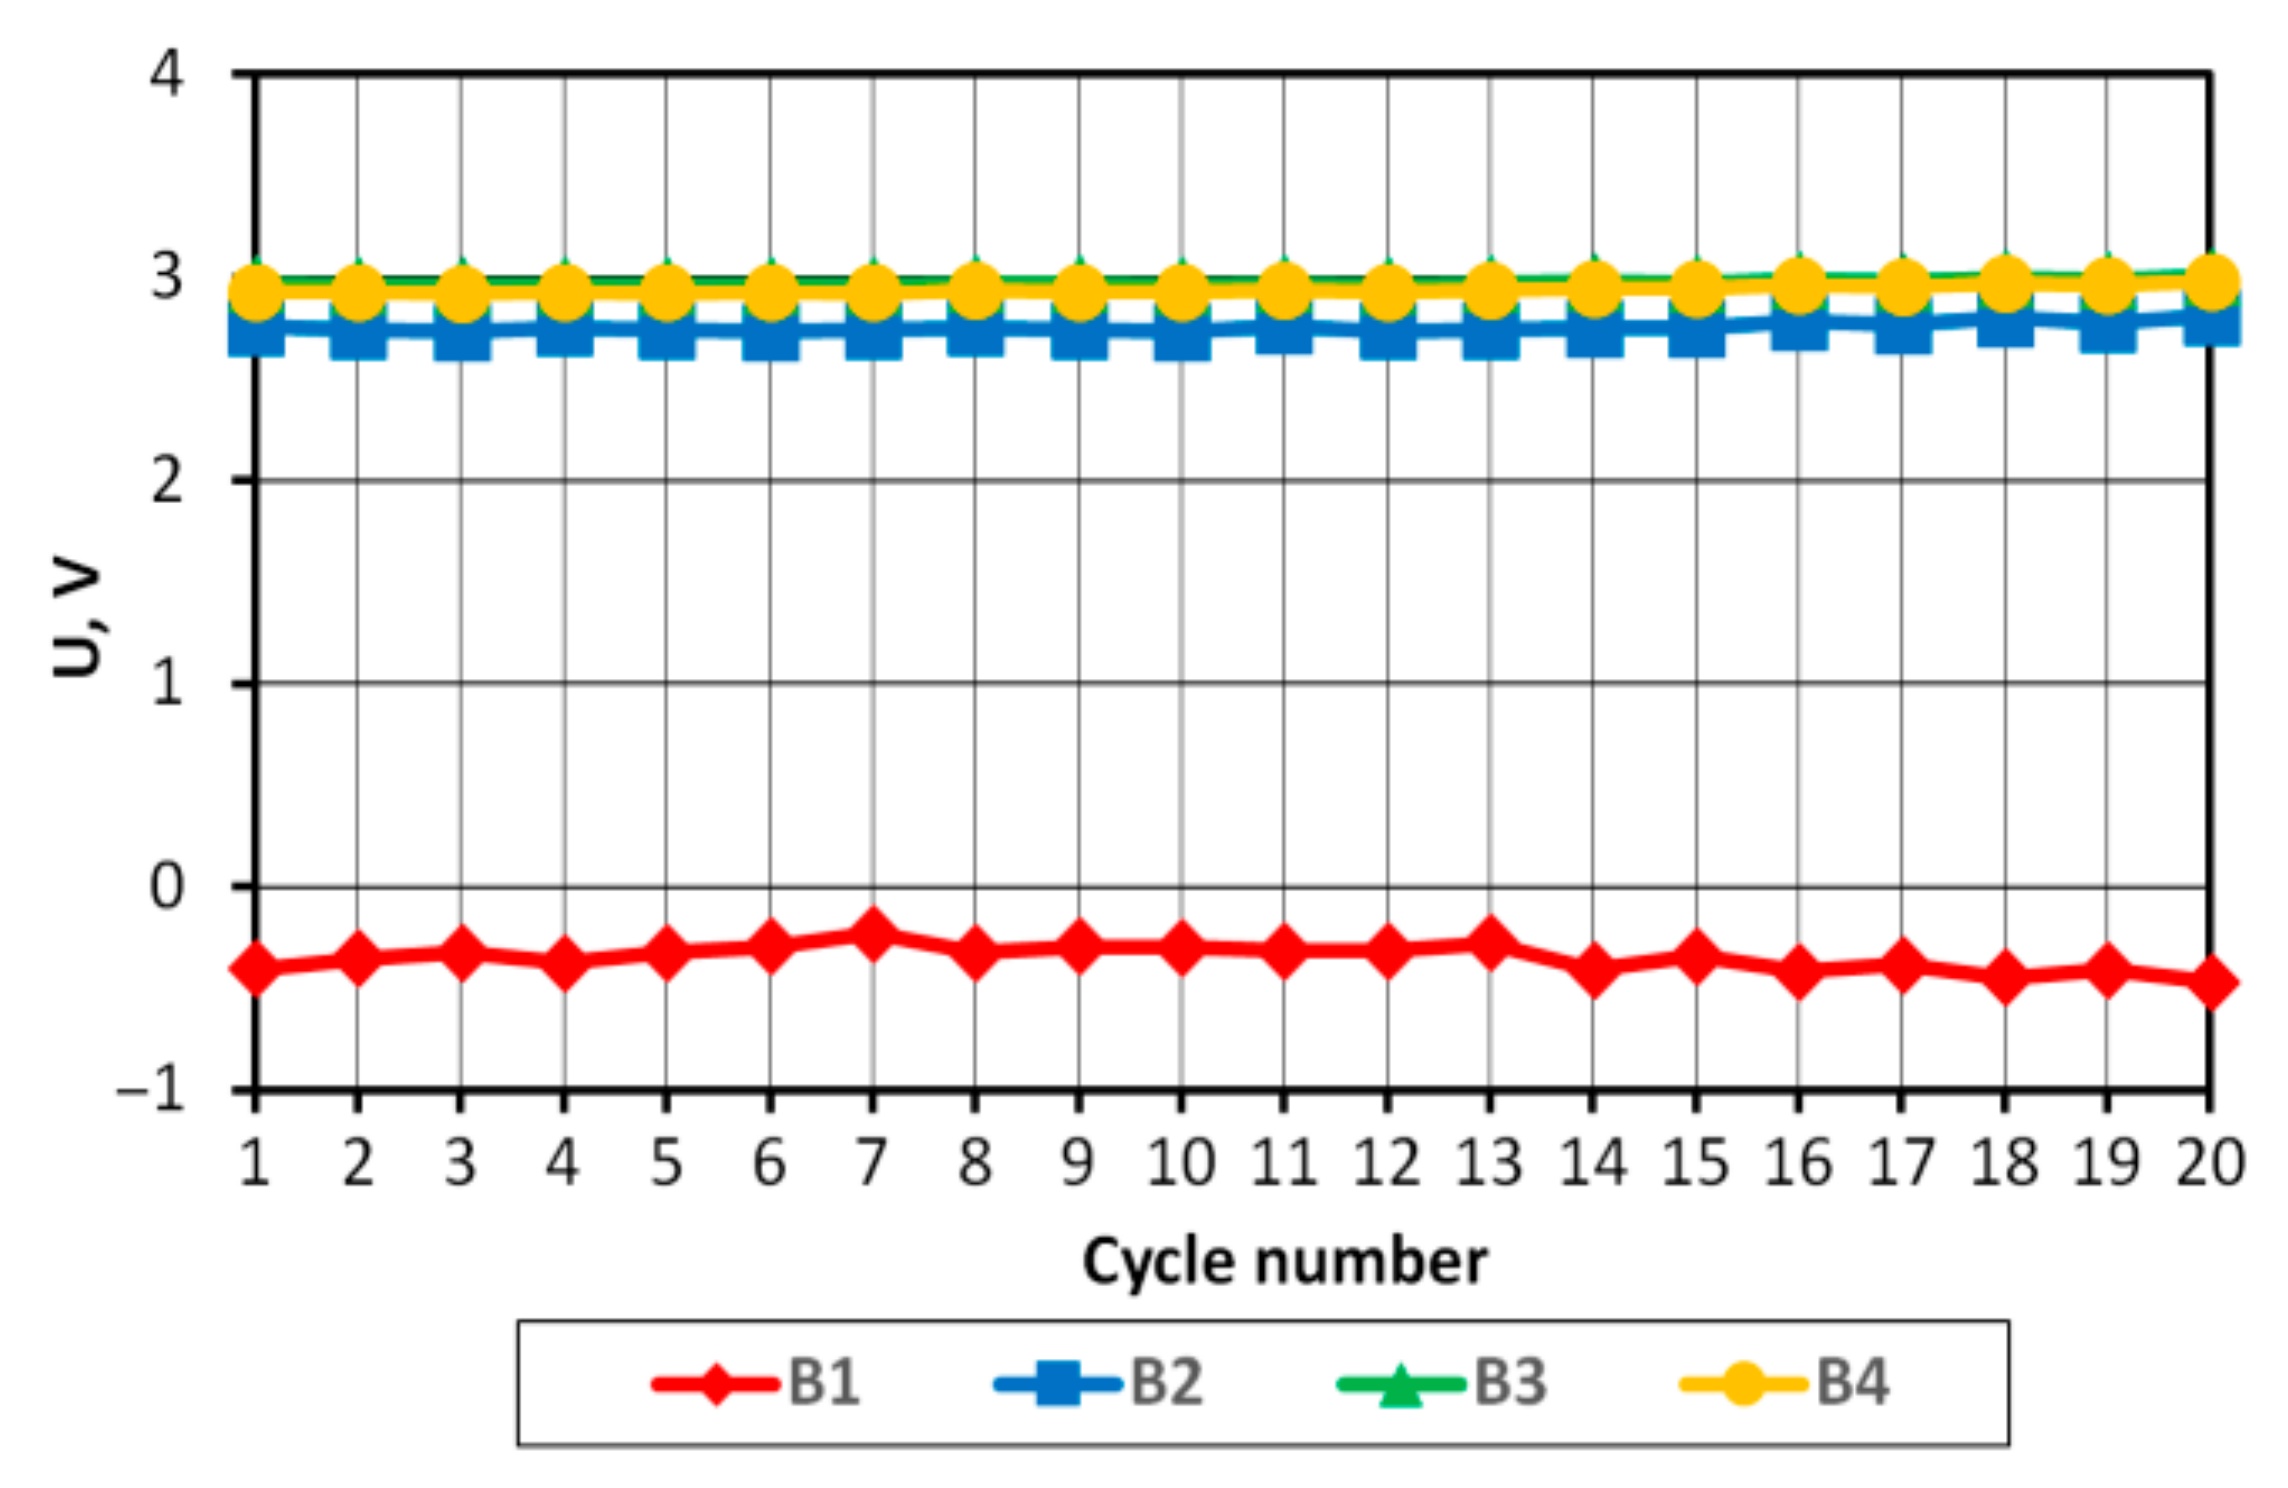
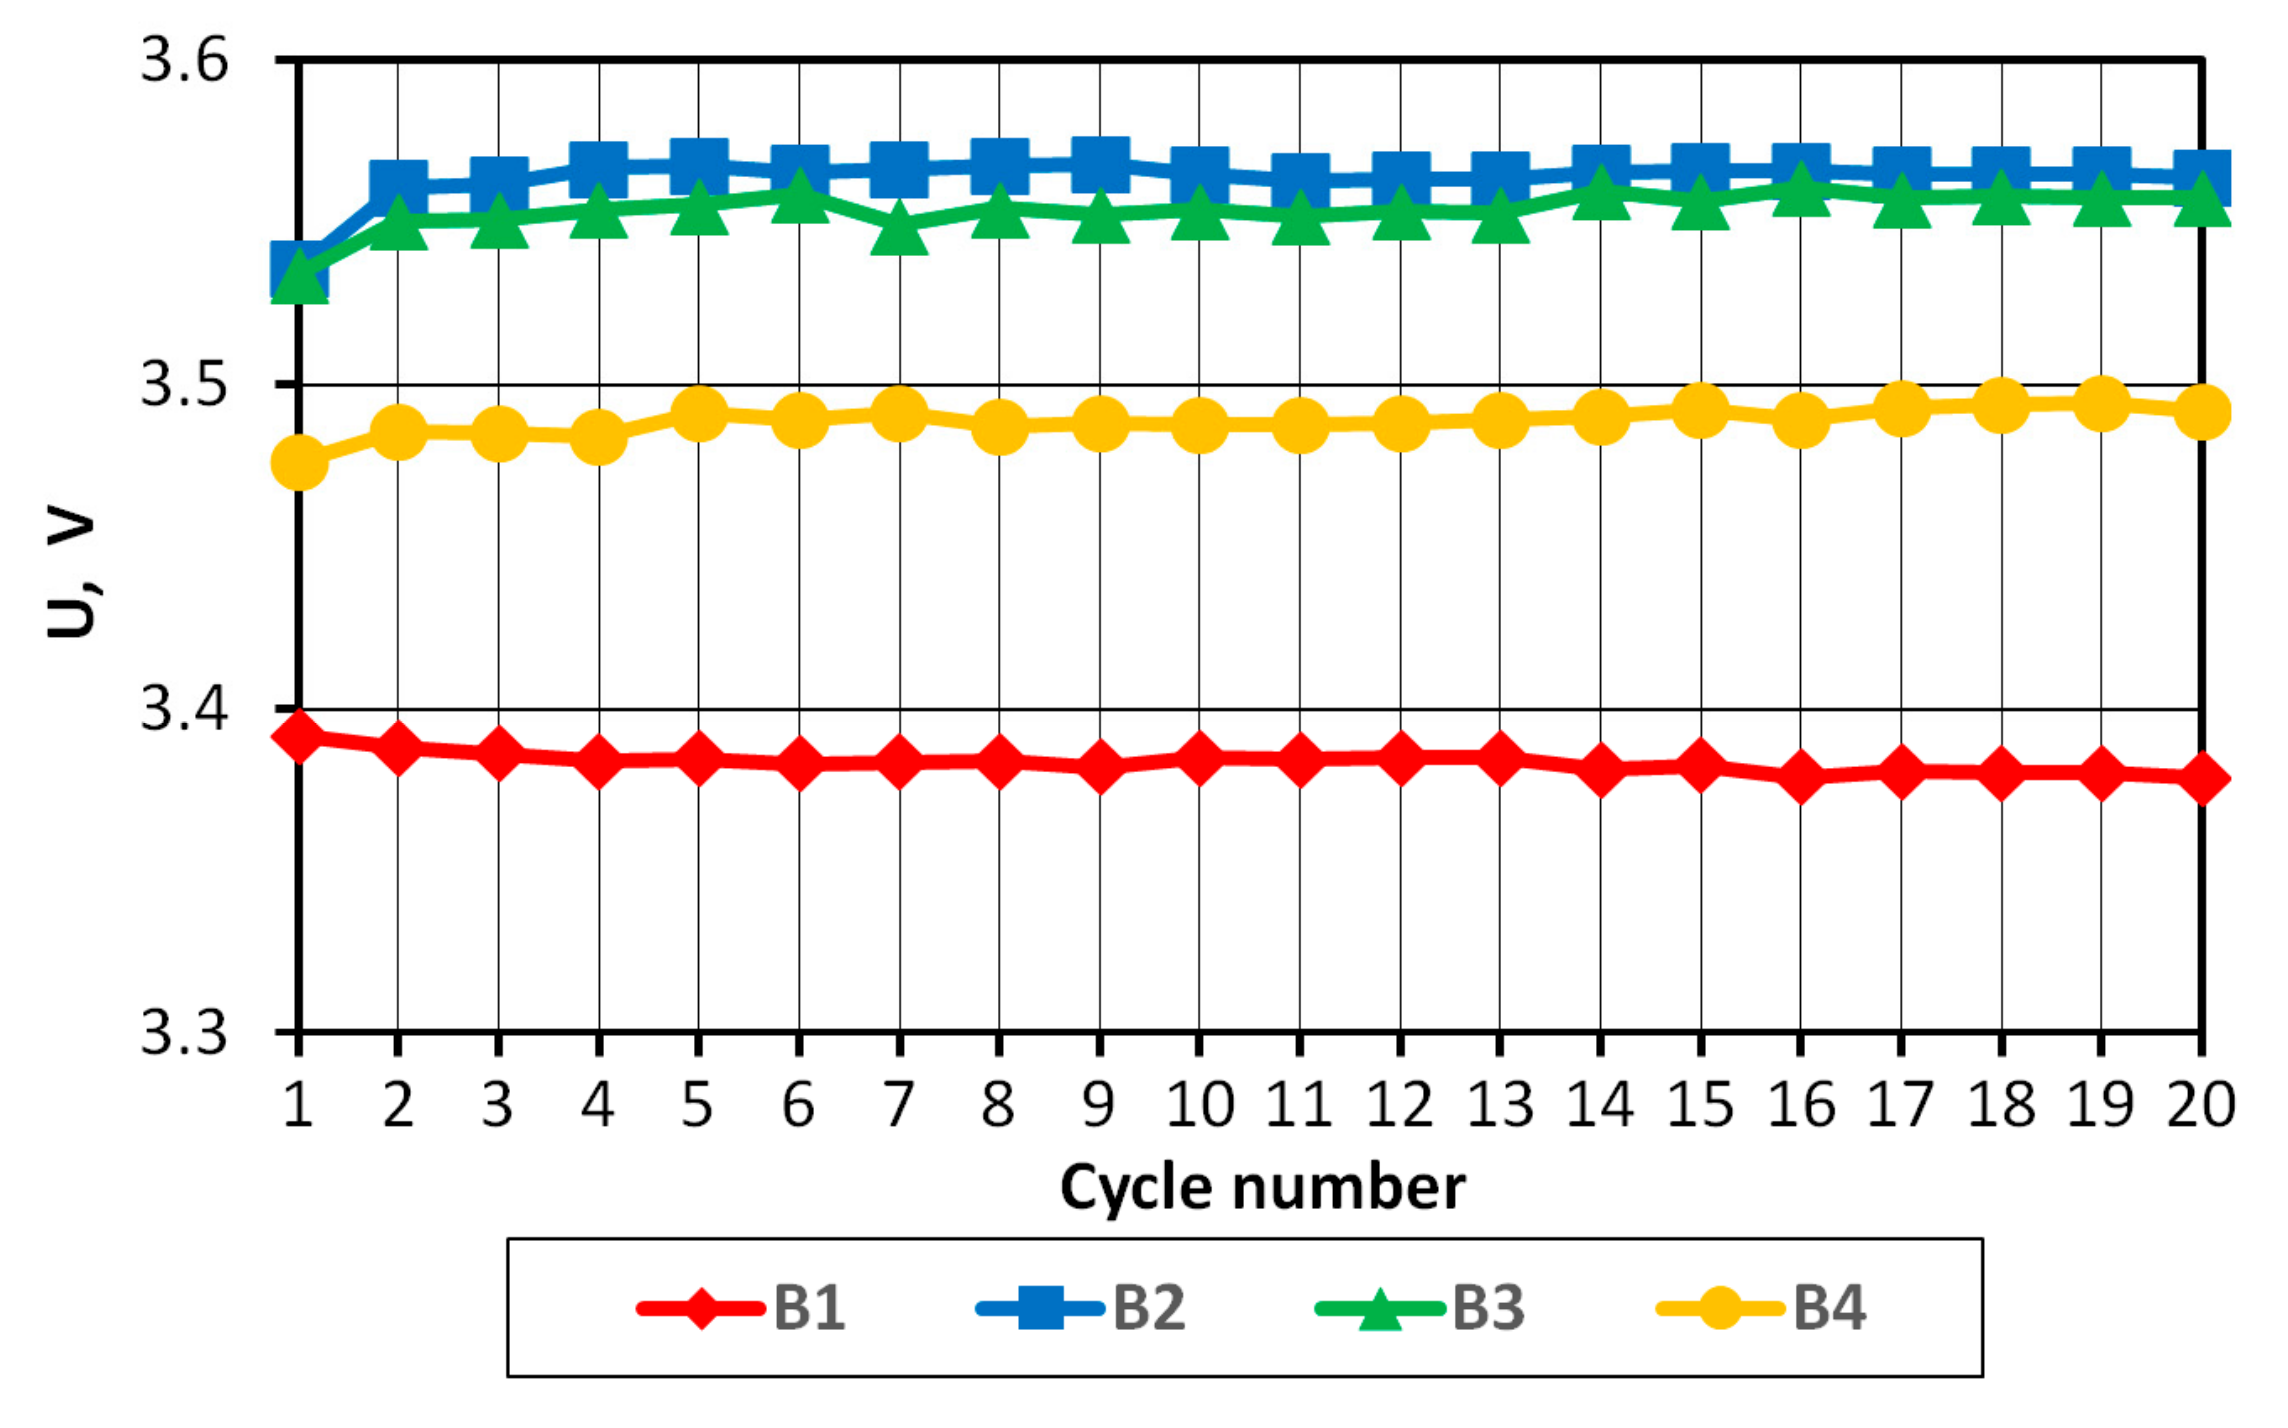
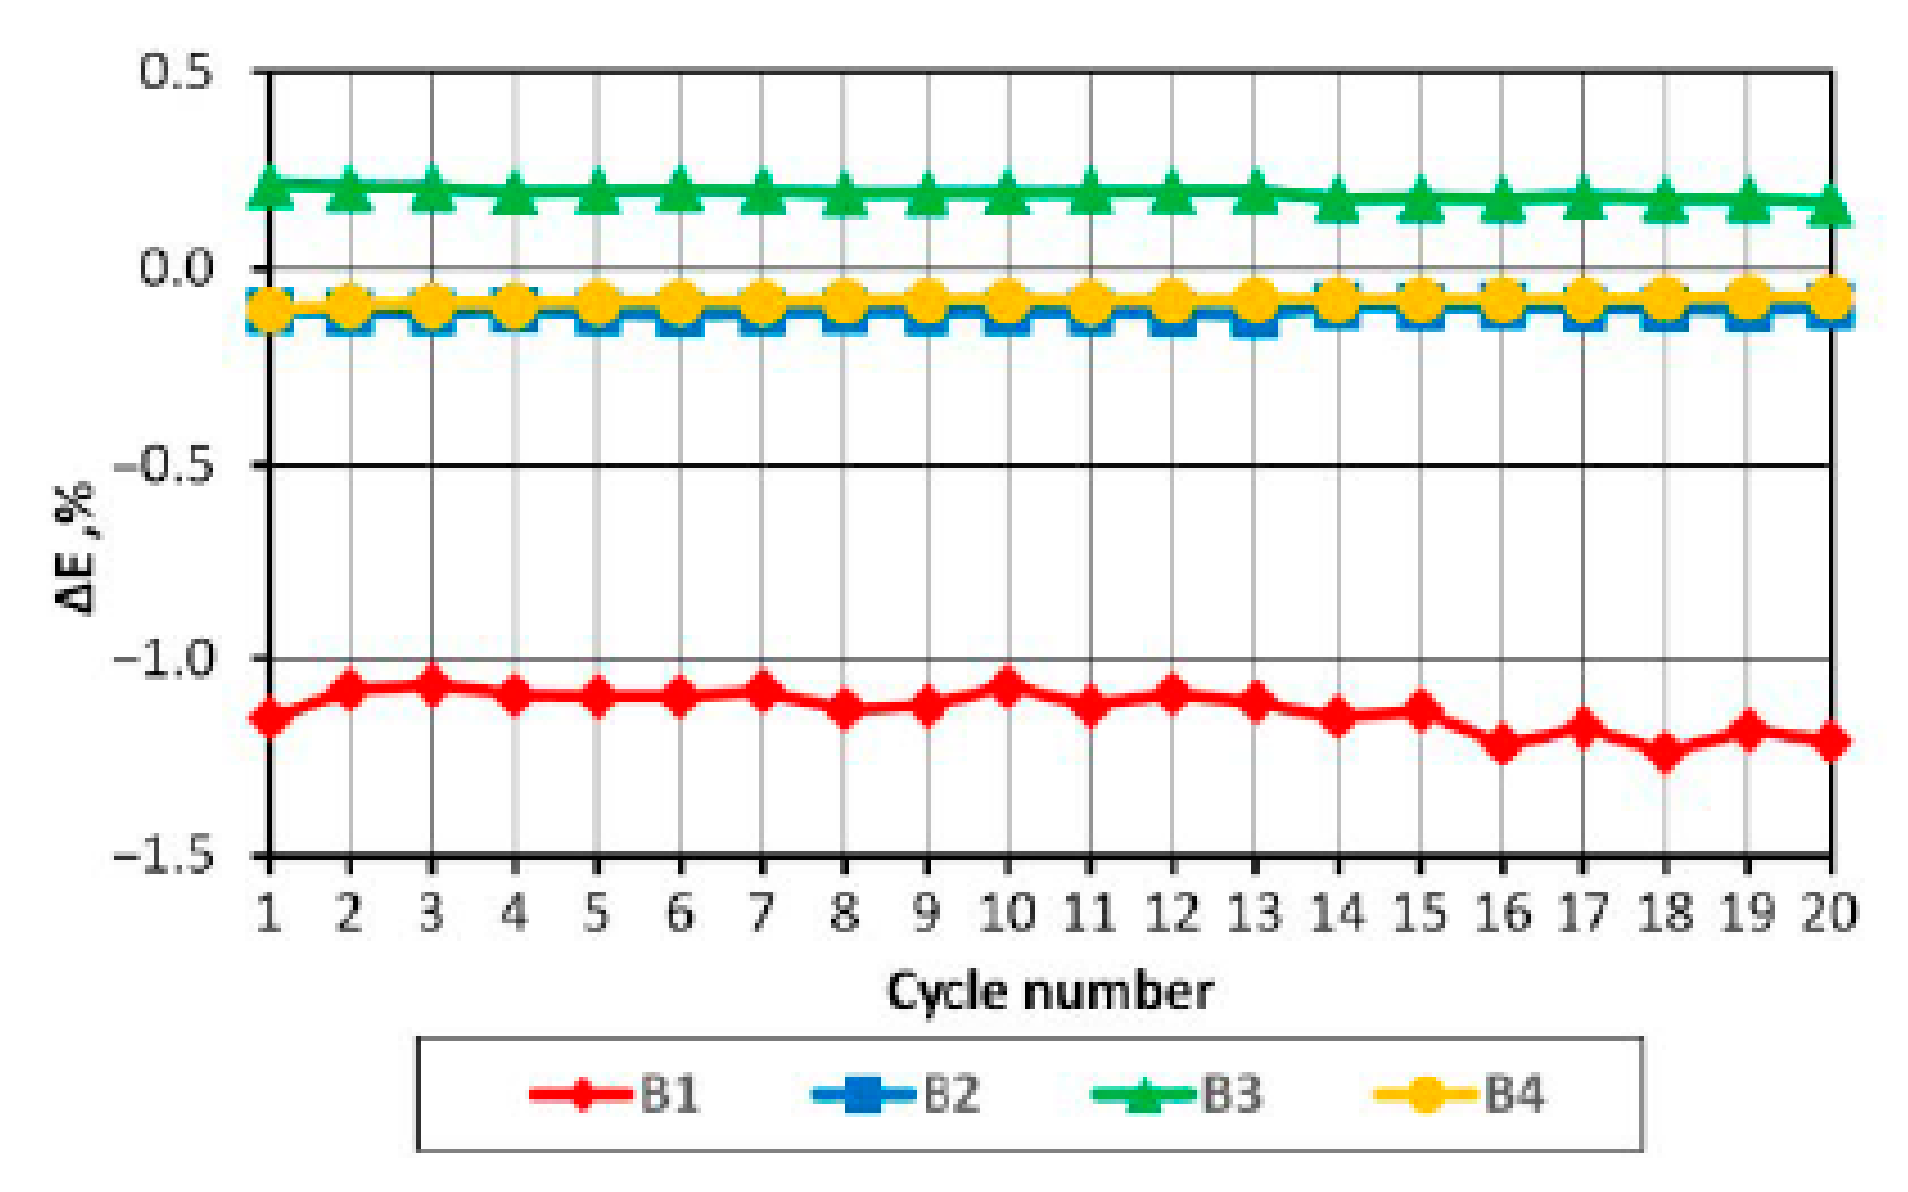
Measurement results for subsequent charging/discharging cycles with the use of the ZEW-type charger are presented in Figure 4, Figure 5, Figure 6 and Figure 7.
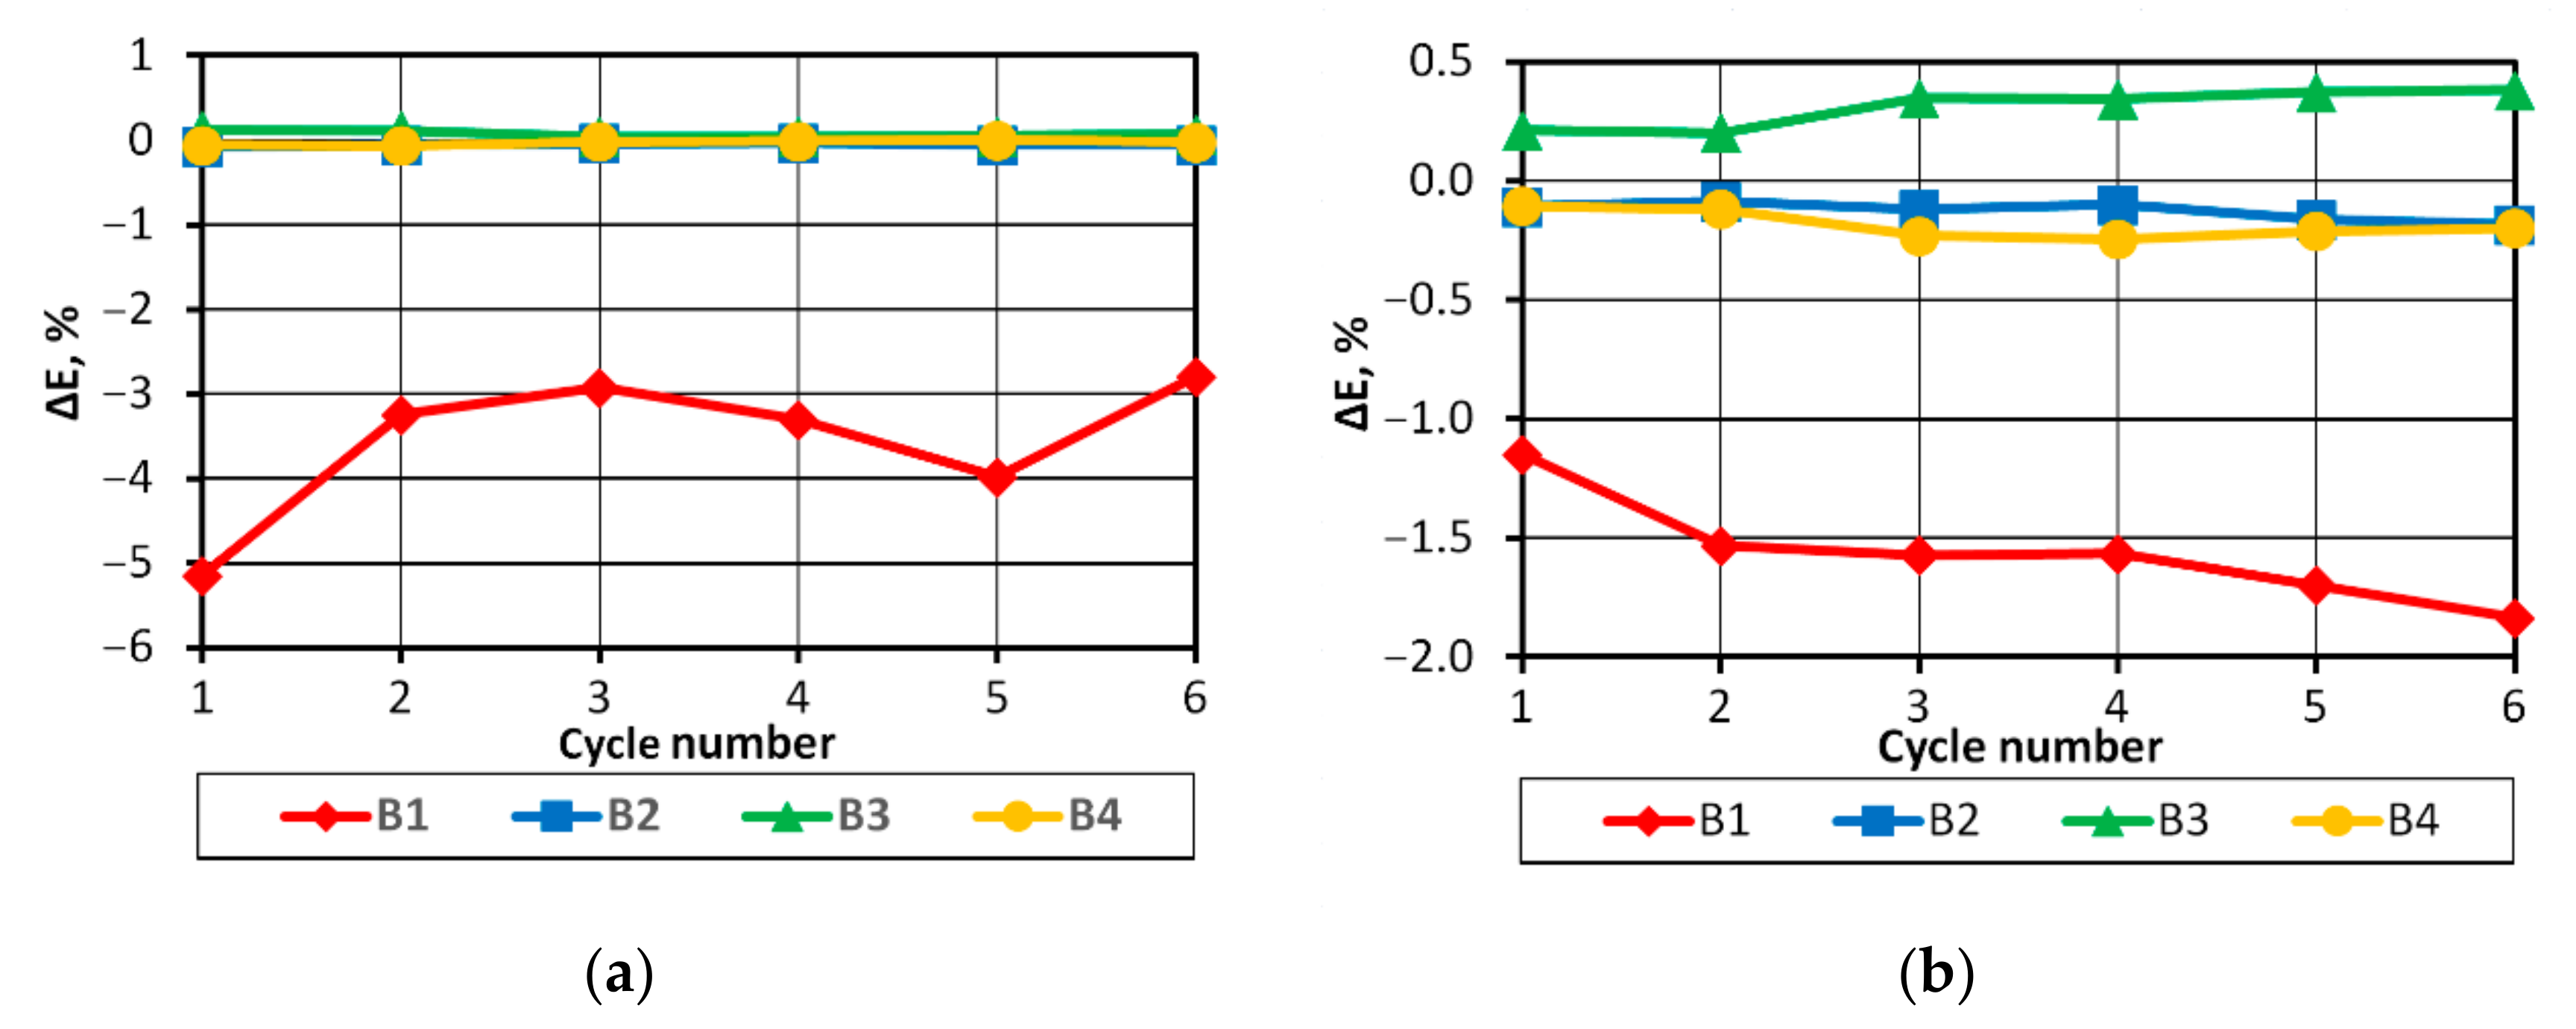
In all the cycles, in the discharge phase, the B1 battery was excessively discharged, while in the charging phase, the batteries B2 and B3 were charged to the highest voltage. In the first seven discharge/charge cycles, a minimal reduction of unbalance could be observed, which may have resulted from the phenomenon of increasing the capacity of LiFePO4 batteries and stabilization of their parameters in the initial period of use [23]. The average level of unbalance of the battery B1 calculated from the energy received during the discharge for all the cycles starting from the second one (the first cycle was omitted due to incomplete initial charging of the batteries) was 3%. Fluctuations of ±0.5%, which occurred, should be attributed to the measurement uncertainty. Starting from the fifteenth cycle, a minimal trend towards an increase in the differences between the B1 battery and the other three batteries included in the pack could be observed. In order to confirm this trend and possibly establish its pace, it is necessary to execute more measurement cycles.

3.1.2. Charging and Discharging the Battery Pack with the UCT100-6 Charger

To verify the pack behavior at different charging/discharging parameters compared to those provided with the ZEW-type charger, tests were carried out using the UCT100-6 charger. Discharging was carried out with a current of 0.8 A, and charging consisted of two cycles with the current of 0.8 A, 1 A, and 1.2 A. The measurement results obtained for the successive cycles are shown in the diagrams in Figure 8 and Figure 9.
Trials carried out with the UCT100-6 charger confirmed that the B1 battery had been excessively discharged. In the final phase of the discharge, the B1 battery got negative voltage. In the charging phase, the batteries B2 and B3 were charged to the highest voltage, until the voltage increased above the permissible value of 3.6 V [20]. During the tests, no negative impact of these factors on the parameters of the batteries was observed, nonetheless, they may be significant for the safe use of the batteries and the shortening of the battery life [3,4,10,11,14].

3.2. Impact of BMS on Balancing of Batteries in the Pack

The obtained results from the tests of the pack with no BMS confirmed that the battery cell unbalance was maintained throughout all the discharge/charge cycles and that battery voltages not recommended by the battery manufacturer were present in the final discharging/charging phases. It was checked whether the BMS would have a positive effect on the operation of the pack.
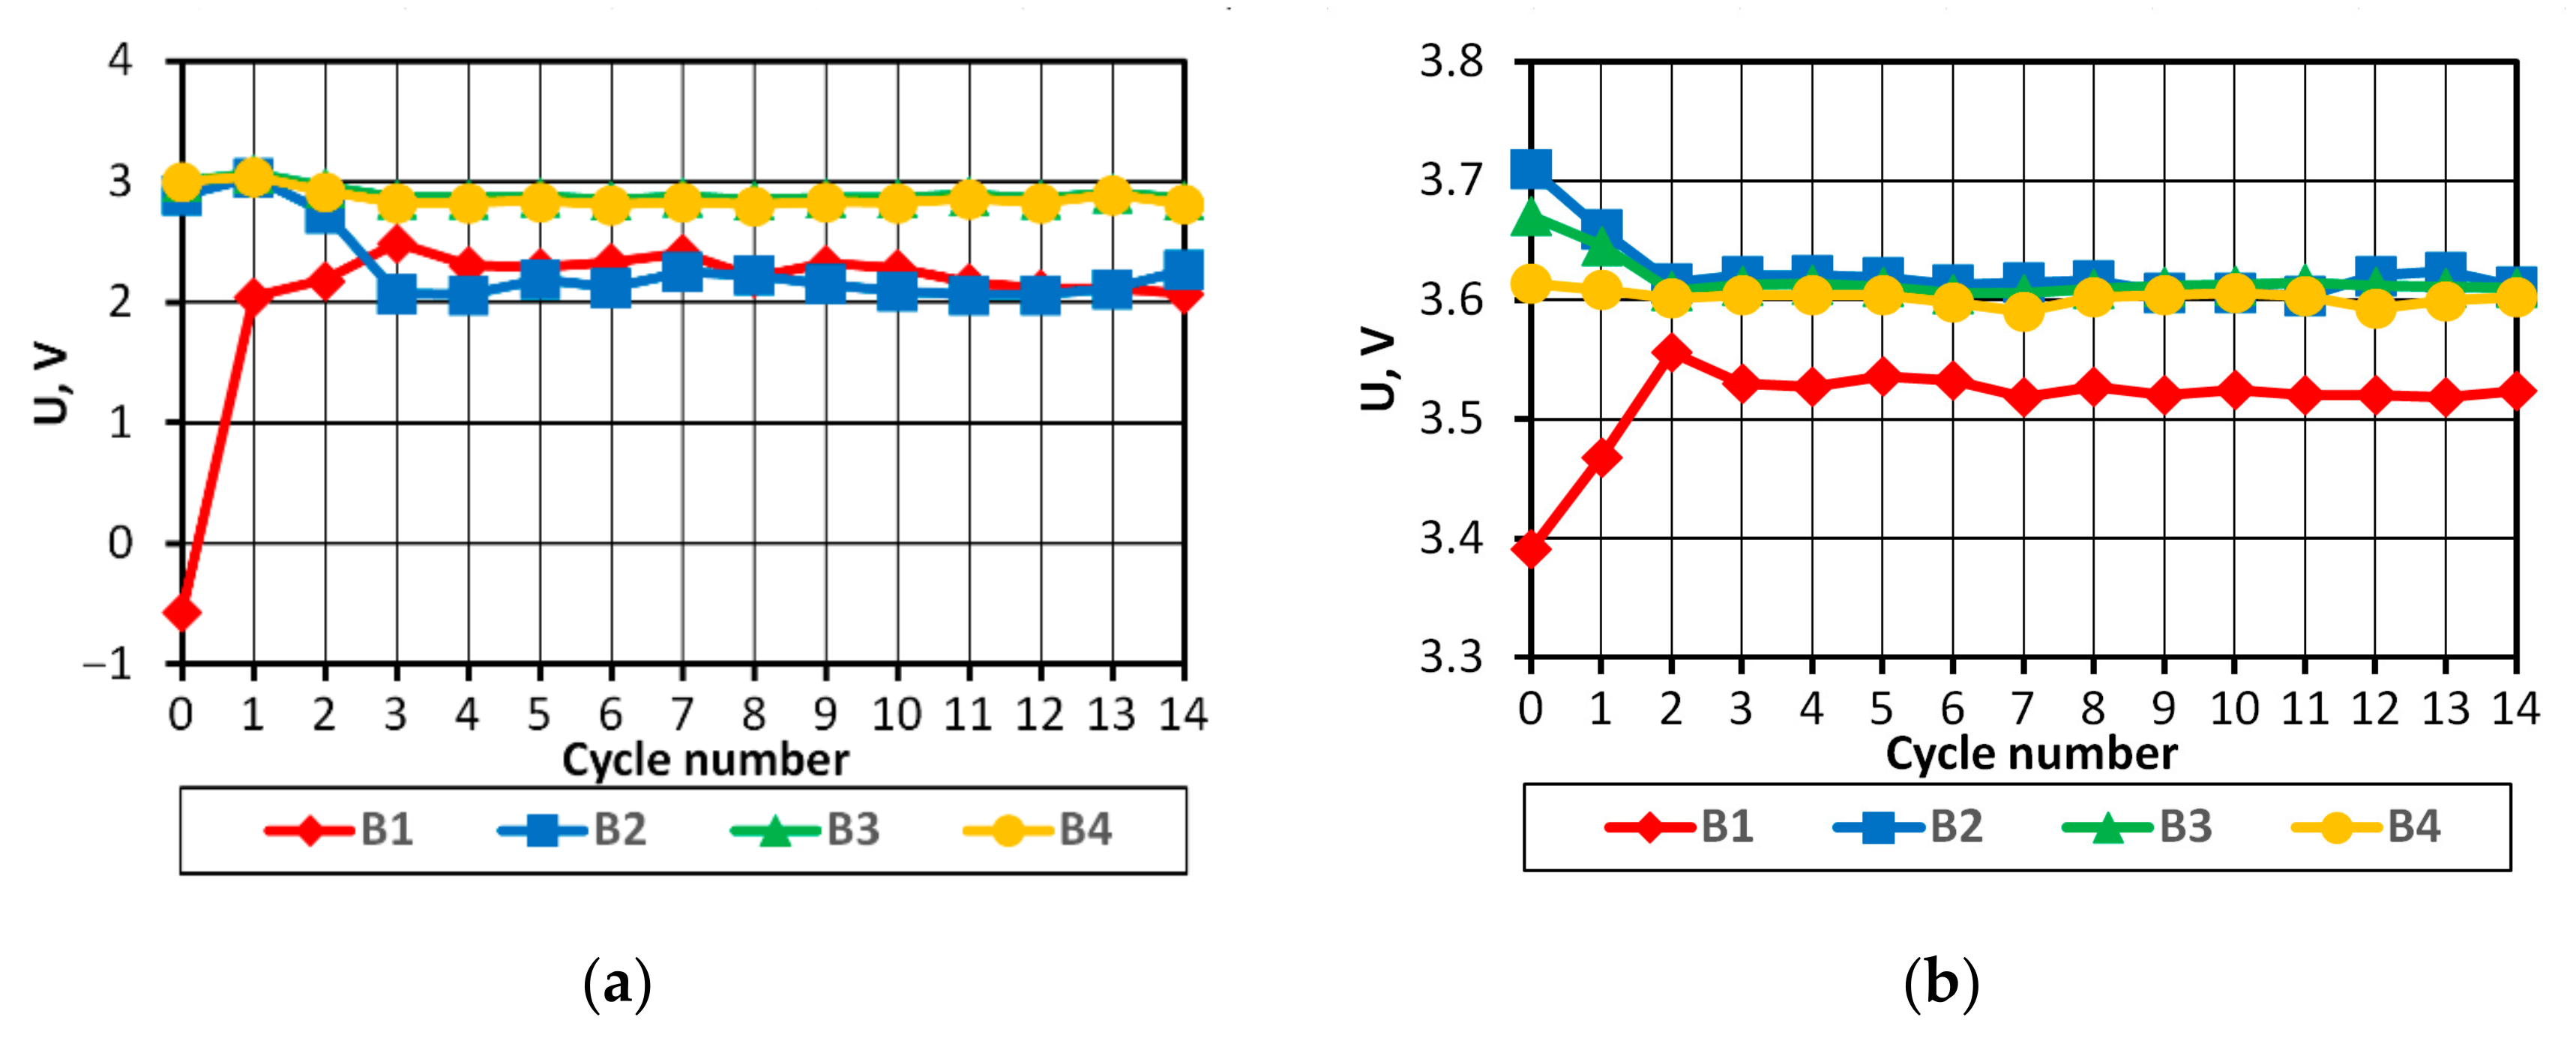
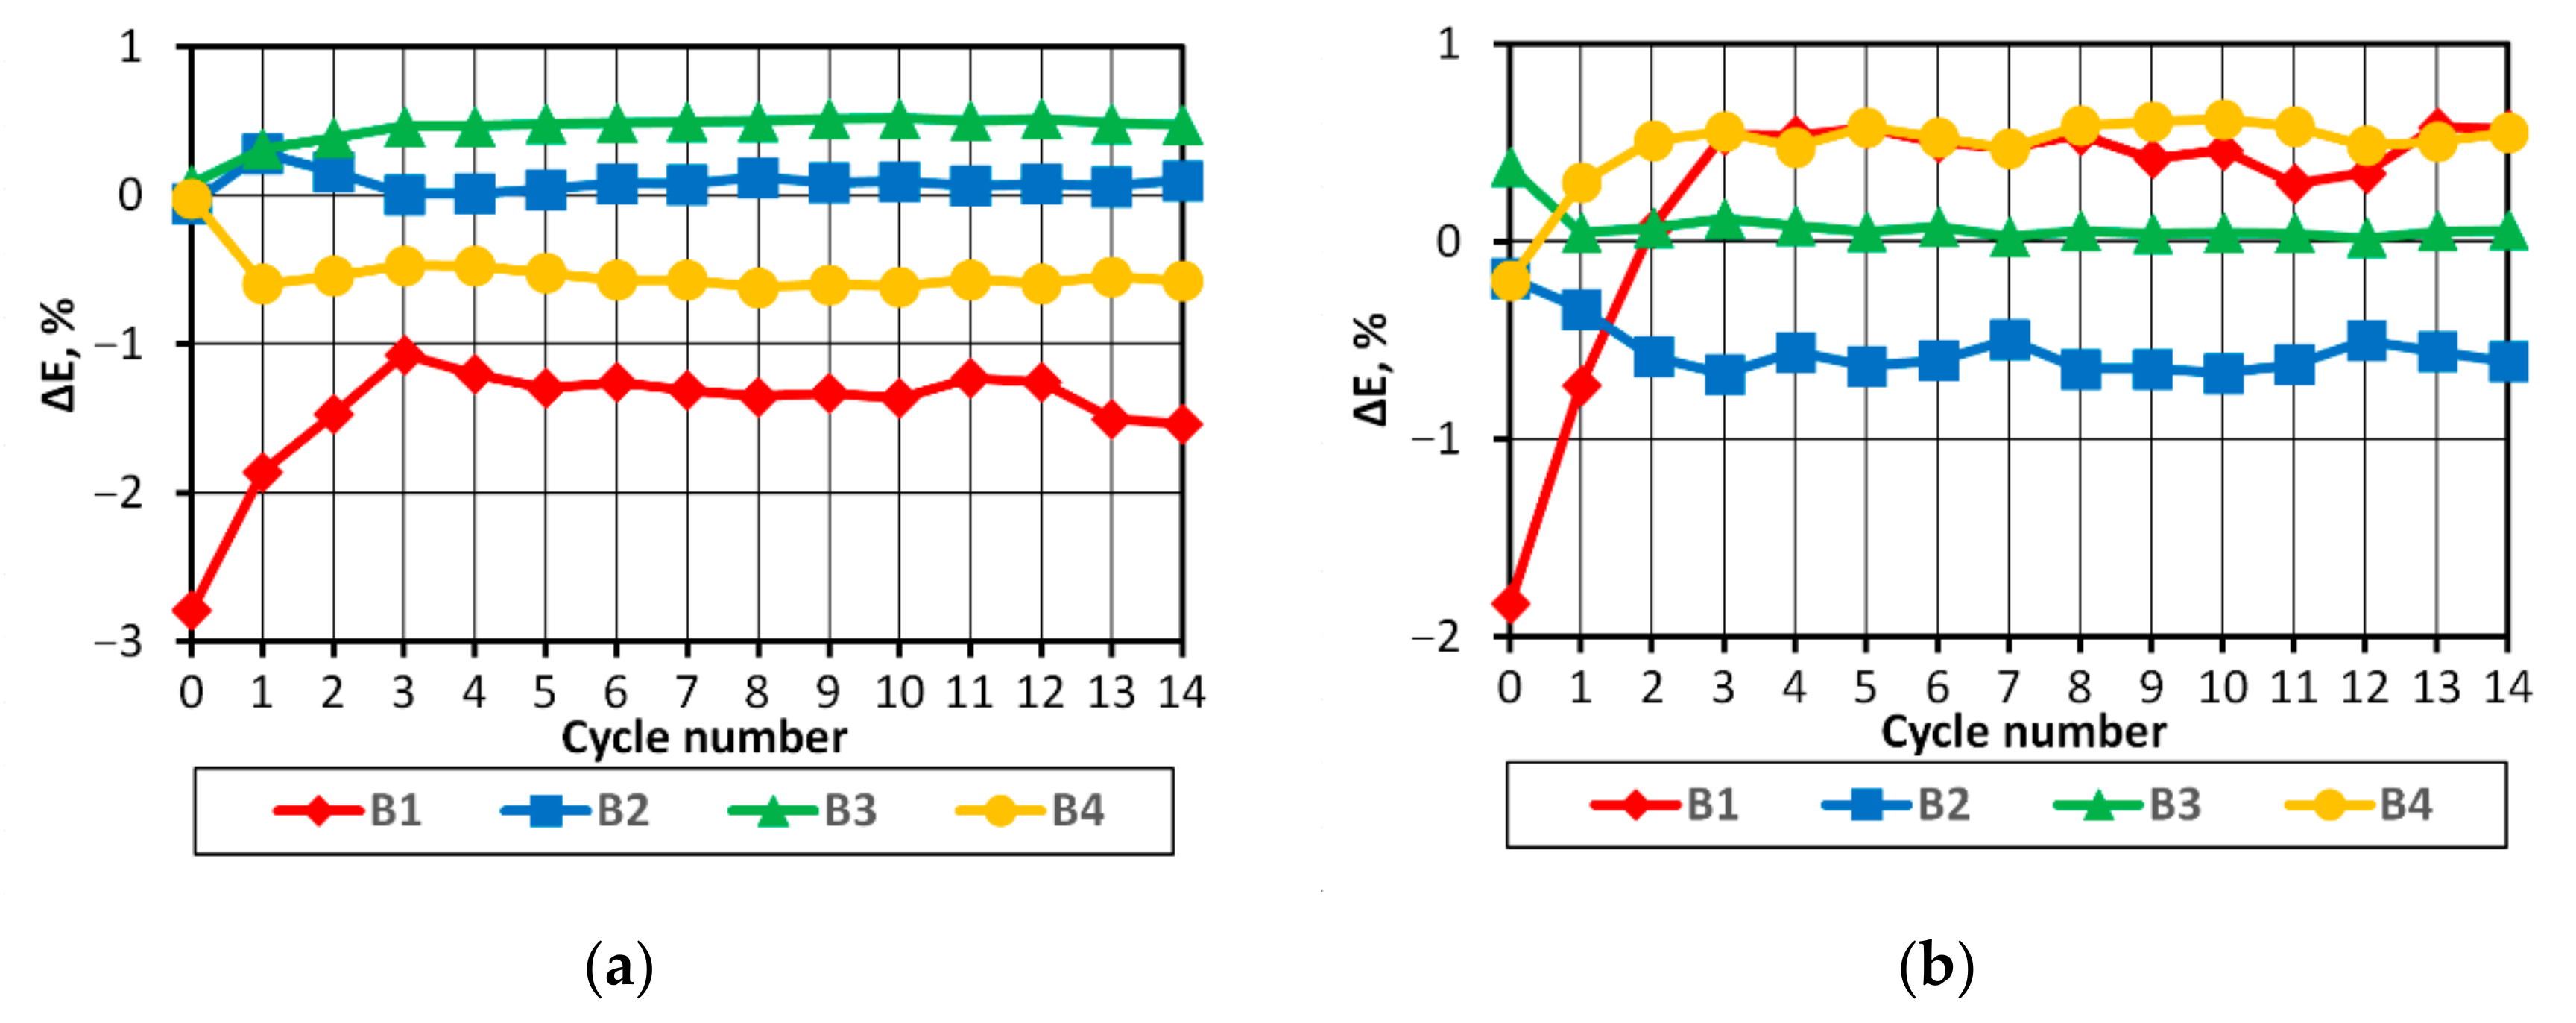
The functioning of the BMS was tested with the use of the UCT100-6-type charger in 14 cycles. The results are presented in Figure 10 and Figure 11, where the values obtained before the BMS was connected were indicated as measurement No. 0.
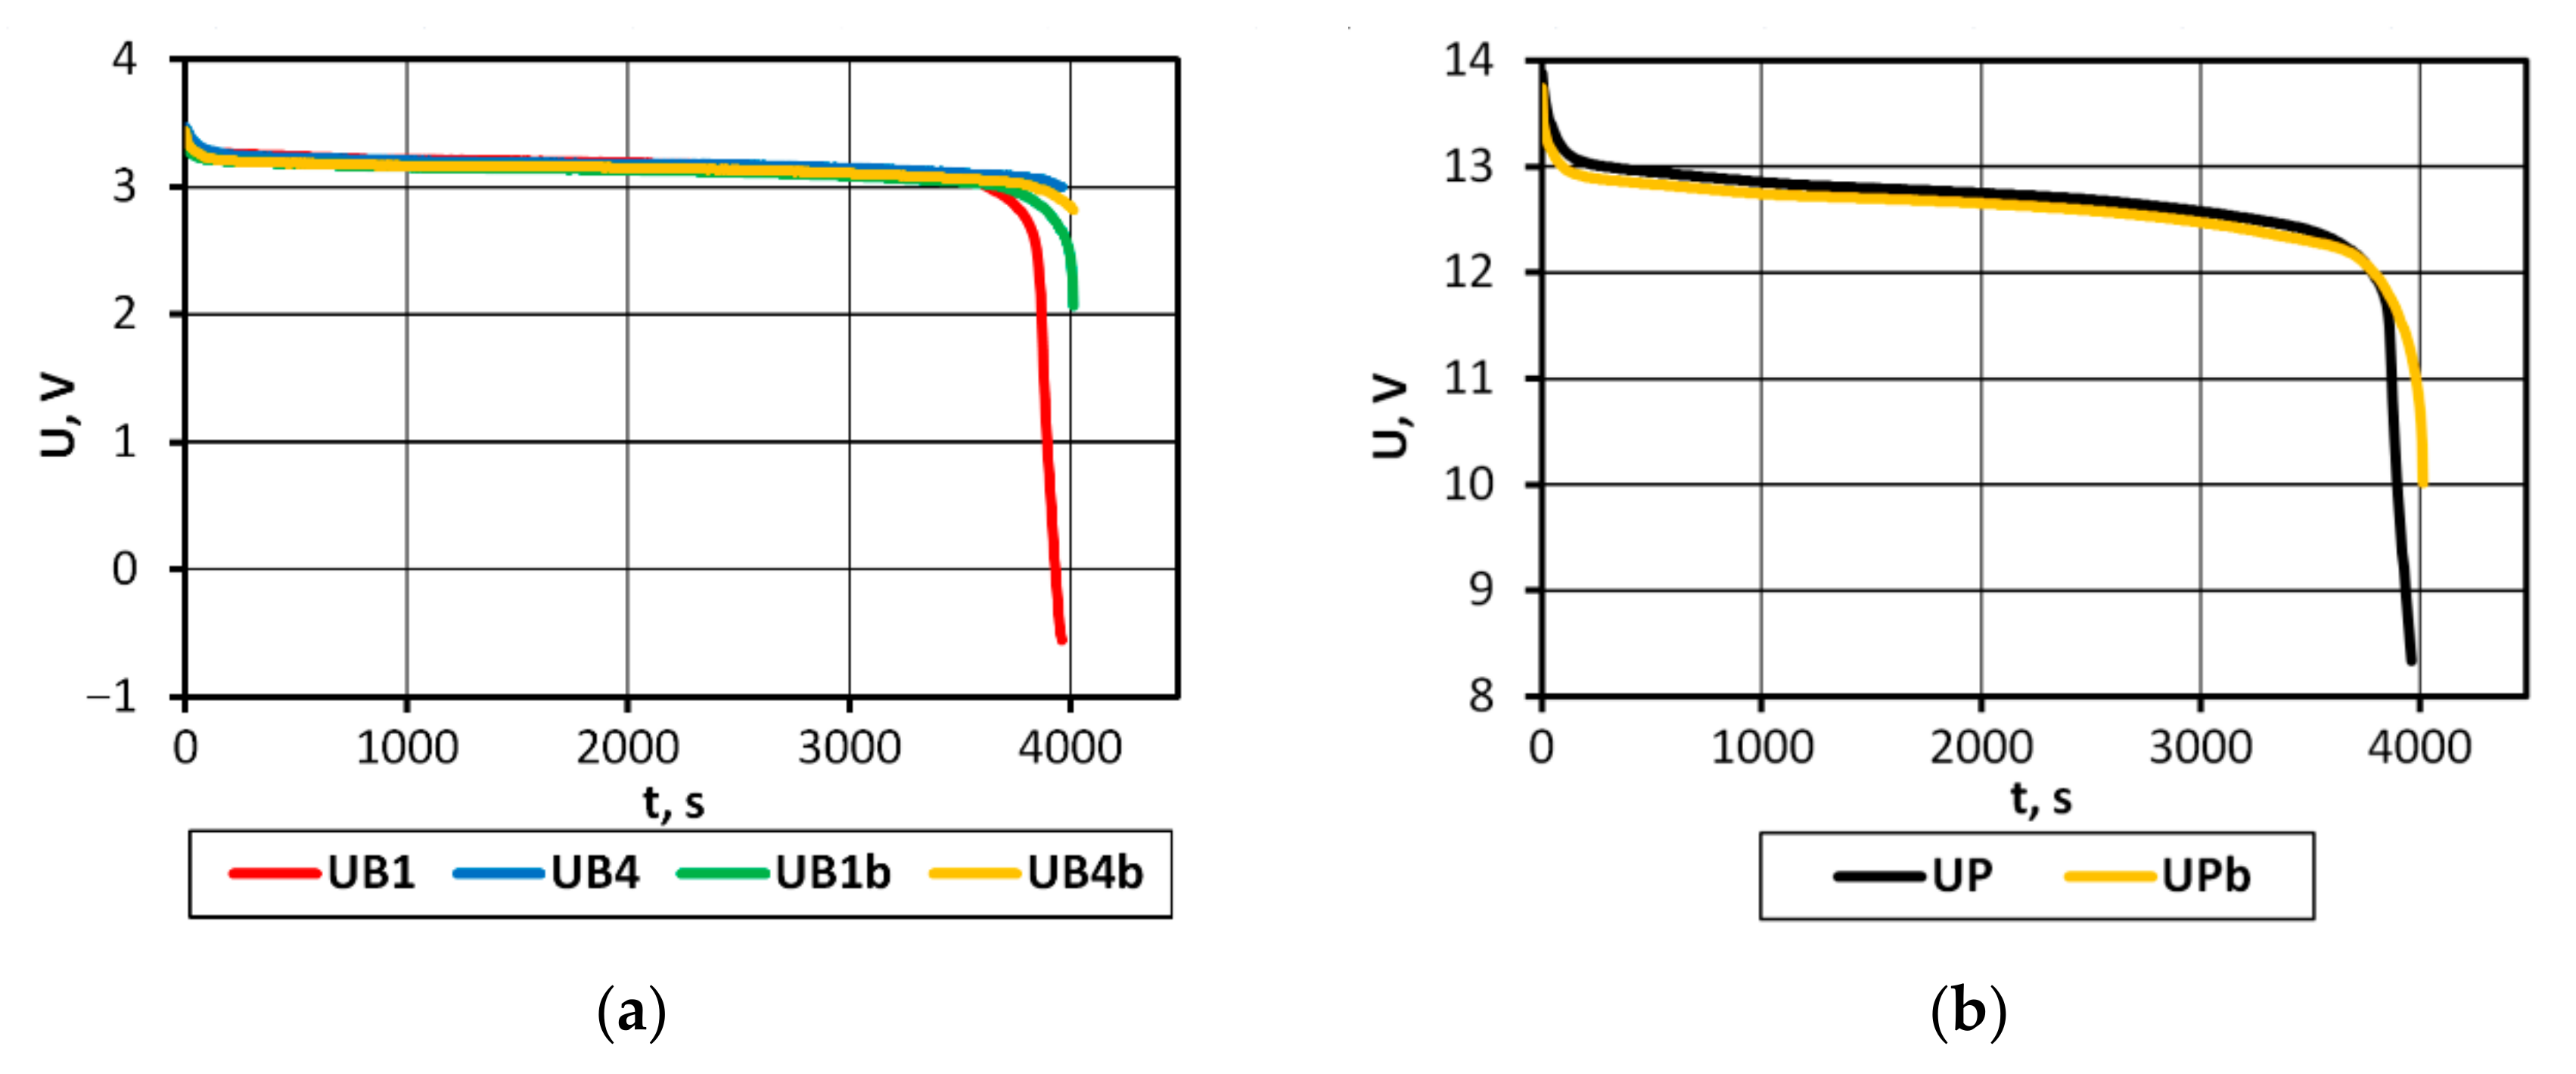
Comparing the operation of the battery pack with the BMS and without such a system, it could be noted that due to the protection against over-discharge of cells, the discharge ended at a higher pack voltage (approx. 10 V). As a result, the weakest cells were protected against unfavorable operating conditions, but the energy in all the other cells remains unused. However, despite the early termination of the discharge, the energy supplied by the pack was greater, as shown in the results summarized in Table 2.
Figure 12 illustrates the voltage waveforms for two battery packs with and without the BMS, which clearly show the differences in the shape of the characteristics in the final discharge phase, which may explain the differences in the energies supplied.
Incorporating the BMS system protected the batteries against excessive discharge in the first cycle and against overcharging in the second one. Starting from the third cycle, the operating parameters of the batteries were stabilized and practically did not change until the end of the tests. In the tested load range, the energy efficiency was also improved. Conversely, in the case of battery operation at very low loads, the energy consumed by the BMS system may be a major factor in reducing the power source energy efficiency.

4. Conclusions

On the basis of the results obtained, it can be concluded that in the case of a pack consisting of four series-connected APR 18650M 1A batteries with a SoC difference of 3%, the batteries in the final discharge/charging phases operate in non-recommended ranges, which may consequently lead to partial or complete cell degradation.
BMS solved the problem of providing batteries with optimal operating conditions, however, when energy drawn from the batteries is very low, they can significantly affect the energy efficiency of the power supply system.
The analysis of the discharge voltage characteristics of the packs characterized by varying levels of cell balance (Figure 12) shows that the comparison of the rate of voltage changes in the final discharge phase will allow SoC imbalance to be detected in the studied battery pack. It seems that these dependencies might be used to develop a protection system against damage to the entire pack. This requires continued research in this area.
From the practical point of view, the findings from this study suggest that with the correct selection of batteries combined in the pack, the initial differences in the energy stored in the batteries are of vital importance. It is possible to develop a system protecting the battery pack in the discharge process, one which could operate solely based on information on the voltage of the entire pack.
Author Contributions

Conceptualization, W.M. and A.W.; methodology, W.M. and A.W.; validation, W.M.; data curation, A.W.; writing—original draft preparation, W.M.; writing—review and editing, W.M. All authors have read and agreed to the published version of the manuscript.

Funding

This research received no external funding.

Conflicts of Interest

The authors declare no conflict of interest.

References

  1. Tseng, Y.-M.; Huang, H.-S.; Chen, L.-S.; Tsai, J.-T. Characteristic research on lithium iron phosphate battery of power type. Matec Web Conf. 2018, 185, 00004. [Google Scholar] [CrossRef] [Green Version]
  2. Deng, D. Li-ion batteries: Basics, progress, and challenges. Energy Sci. Eng. 2015, 3, 385–418. [Google Scholar] [CrossRef]
  3. Juarez-Robles, D.; Vyas, A.A.; Fear, C.; Jeevarajan, J.A.; Mukherjee, P.P. Overcharge and Aging Analytics of Li-Ion Cells. J. Electrochem. Soc. 2020, 167, 090547. [Google Scholar] [CrossRef]
  4. Juarez-Robles, D.; Vyas, A.A.; Fear, C.; Jeevarajan, J.A.; Mukherjee, P.P. Overdischarge and Aging Analytics of Li-Ion Cells. J. Electrochem. Soc. 2020, 167, 090558. [Google Scholar] [CrossRef]
  5. Kurzweil, P.; Scheuerpflug, W. State-of-Charge Monitoring and Battery Diagnosis of Different Lithium Ion Chemistries Using Impedance Spectroscopy. Batteries 2021, 7, 17. [Google Scholar] [CrossRef]
  6. Ko, S.-T.; Lee, J.; Ahn, J.-H.; Lee, B.K. Innovative Modeling Approach for Li-Ion Battery Packs Considering Intrinsic Cell Unbalances and Packaging Elements. Energies 2019, 12, 356. [Google Scholar] [CrossRef] [Green Version]
  7. Valda, L.; Kosturik, K. Comparison of Li-ion active cell balancing methods replacing passive cell balancer. In Proceedings of the 2015 International Conference on Applied Electronics (AE), Pilsen, Czech Republic, 8–9 September 2015; pp. 267–270. [Google Scholar]
  8. Rezvanizaniani, S.M.; Liu, Z.; Chen, Y.; Lee, J. Review and recent advances in battery health monitoring and prognostics technologies for electric vehicle (EV) safety and mobility. J. Power Sources 2014, 256, 110–124. [Google Scholar] [CrossRef]
  9. Cho, I.-H.; Lee, P.-Y.; Kim, J.-H. Analysis of the Effect of the Variable Charging Current Control Method on Cycle Life of Li-ion Batteries. Energies 2019, 12, 3023. [Google Scholar] [CrossRef] [Green Version]
  10. Sui, X.; Świerczyński, M.; Teodorescu, R.; Stroe, D.-I. The Degradation Behavior of LiFePO4/C Batteries during Long-Term Calendar Aging. Energies 2021, 14, 1732. [Google Scholar] [CrossRef]
  11. He, H.; Liu, Y.; Liu, Q.; Li, Z.; Xu, F.; Dun, C.; Ren, Y.; Wang, M.-X.; Xie, J. Failure Investigation of LiFePO4 Cells in Over-Discharge Conditions. J. Electrochem. Soc. 2013, 160, A793–A804. [Google Scholar] [CrossRef]
  12. Hemavathi, S. Overview of cell balancing methods for Li-ion battery technology. Energy Storage 2021, 3, e203. [Google Scholar]
  13. Barsukov, Y. Battery Cell Balancing: What to Balance and How; Texas Instruments: Dallas, TX, USA, 2005; pp. 1–8. [Google Scholar]
  14. Tran, M.-K.; Fowler, M. A Review of Lithium-Ion Battery Fault Diagnostic Algorithms: Current Progress and Future Challenges. Algorithms 2020, 13, 62. [Google Scholar] [CrossRef] [Green Version]
  15. Wei, Z.; Leng, F.; He, Z.; Zhang, W.; Li, K. Online State of Charge and State of Health Estimation for a Lithium-Ion Battery Based on a Data–Model Fusion Method. Energies 2018, 11, 1810. [Google Scholar] [CrossRef] [Green Version]
  16. Chang, M.-H.; Huang, H.-P.; Chang, S.-W. A New State of Charge Estimation Method for LiFePO4 Battery Packs Used in Robots. Energies 2013, 6, 2007–2030. [Google Scholar] [CrossRef] [Green Version]
  17. Wang, D.; Bao, Y.; Shi, J. Online Lithium-Ion Battery Internal Resistance Measurement Application in State-of-Charge Estimation Using the Extended Kalman Filter. Energies 2017, 10, 1284. [Google Scholar] [CrossRef] [Green Version]
  18. Bao, Y.; Dong, W.; Wang, D. Online Internal Resistance Measurement Application in Lithium-Ion Battery Capacity and State of Charge Estimation. Energies 2018, 11, 1073. [Google Scholar] [CrossRef] [Green Version]
  19. Rivera-Barrera, J.P.; Muñoz-Galeano, N.; Sarmiento-Maldonado, H.O. SoC Estimation for Lithium-ion Batteries: Review and Future Challenges. Electronics 2017, 6, 102. [Google Scholar] [CrossRef] [Green Version]
  20. A123systems High Power Lithium Ion apr18650m1a Datasheet. Available online: https://www.batteryspace.com/prod-specs/6612.pdf (accessed on 8 May 2021).
  21. Yu, Z.; Huai, R.; Xiao, L. State-of-Charge Estimation for Lithium-Ion Batteries Using a Kalman Filter Based on Local Linearization. Energies 2015, 8, 7854–7873. [Google Scholar] [CrossRef] [Green Version]
  22. Hemi, H.; M’Sirdi, N.K.; Naamane, A.; Ikken, B. Open Circuit Voltage of a Lithium-ion Battery Model Adjusted by Data Fitting. In Proceedings of the 6th International Renewable and Sustainable Energy Conference (IRSEC), Rabat, Morocco, 5–8 December 2018; pp. 1–5. [Google Scholar]
  23. Stroe, D.-I.; Świerczynski, M.; Stroe, A.-I.; Knudsen Kær, S. Generalized Characterization Methodology for Performance Modelling of Lithium-Ion Batteries. Batteries 2016, 2, 37. [Google Scholar] [CrossRef] [Green Version]
  24. Chen, M.; Rincon-Mora, G.A. Rincon-Mora, Accurate electrical battery model capable of predicting runtime and I-V performance. IEEE Trans. Energy Convers. 2006, 21, 504–511. [Google Scholar] [CrossRef]
  25. Yusof, M.S.; Toha, S.F.; Kamisan, N.; Hashim, N.N.W.N.; Abdullah, M. Battery cell balancing optimisation for battery management system. IOP Conf. Ser. Mater. Sci. Eng. 2017, 184, 012021. [Google Scholar] [CrossRef]
Figure 1. Tested B1-B4 battery pack (proprietary system).
Energies 14 04055 g001
Figure 2. Measurement system: (a) without the BMS; (b) with the BMS.
Energies 14 04055 g002
Figure 3. Voltage (U) and current (I) during the discharging using ZEW-type charger.
Energies 14 04055 g003
Figure 4. Battery voltage at the end of successive discharging cycles.
Energies 14 04055 g004
Figure 5. Battery voltage at the end of successive charging cycles.
Energies 14 04055 g005
Figure 6. Differences in energy supplied by the battery in successive discharging cycles calculated in accordance with the Formula (10).
Energies 14 04055 g006
Figure 7. Differences in energy supplied from the battery in successive charging cycles calculated in accordance with the Formula (10).
Energies 14 04055 g007
Figure 8. Battery voltages at the end of successive discharging/charging cycles with the UCT100-6-type charger: (a) end of discharging; (b) end of charging.
Energies 14 04055 g008
Figure 9. Differences in energy in successive discharging/charging cycles with the UCT100-6-type charger, calculated in accordance with the Formula (10): (a) discharging; (b) charging.
Energies 14 04055 g009
Figure 10. Battery voltages of the packs with the BMS at the end of successive discharge/charge cycles: (a) end of discharge; (b) end of charge.
Energies 14 04055 g010
Figure 11. Differences in energy in successive discharging/charging cycles, as calculated in accordance with the formula (10): (a) discharging; (b) charging.
Energies 14 04055 g011
Figure 12. Voltage characteristics during the discharge of the pack batteries with and without BMS: (a) B1 and B4 (UB1, UB4—without BMS; UB1b, UB4b—with BMS) battery voltage; (b) pack voltage (UP—without BMS; UPb—with BMS).
Energies 14 04055 g012
Table 1. Measurement results of the tested battery pack—first discharge.
Battery No.Voltage at the End of Discharge
(V)
Energy Supplied by
the Battery
(kJ)
Difference in Energy Supplied
by the Battery (∆E)
(%)
B1−0.404.39−9.42
B22.764.83−0.36
B32.974.850.22
B42.934.850.14
Table 2. Comparison of the measurement results of the tested battery pack with- and without the BMS.
ParameterPack TypeB1
Battery
B2
Battery
B3
Battery
B4
Battery
Voltage at the end of discharge
(V)
with no BMS−0.562.893.013.00
with BMS2.072.272.862.82
Energy drawn during charging (EBc)
(kJ)
with no BMS11.111.211.311.2
with BMS11.411.311.411.4
Energy supplied during discharge (EBd)
(kJ)
with no BMS10.110.410.410.4
with BMS10.510.710.710.6
Efficiency (EBd/EBc)
(%)
with no BMS91939293
with BMS92959593
Publisher’s Note: MDPI stays neutral with regard to jurisdictional claims in published maps and institutional affiliations.