
Optimization and Coordination of Electric Vehicle Charging Process for Long-Distance Trips †


Abstract
:1. Introduction
2. Methodology
2.1. Model
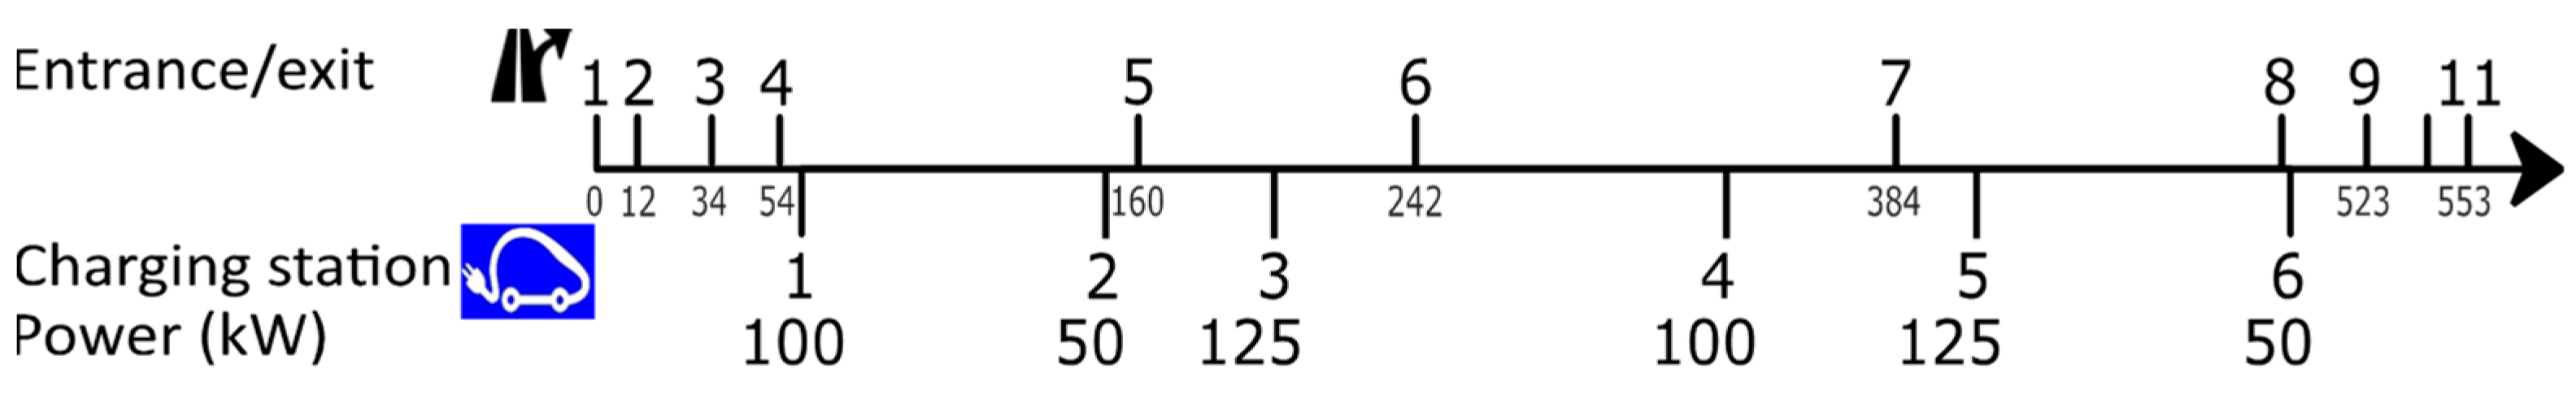
- A highway layout, specified by its entrances, exits, and charging station characteristics (position, number of charging points, available power);
- A fleet of vehicles, defined by their intrinsic attributes (battery capacity, maximum charging power, consumption) and their trip characteristics (start time, state of charge (SoC) at entrance, entrance, and exit points on the highway);
- The vehicle charging schedules, noted as , the energy charged by EV at charging station (null if the vehicle does not stop).
2.2. Assumptions
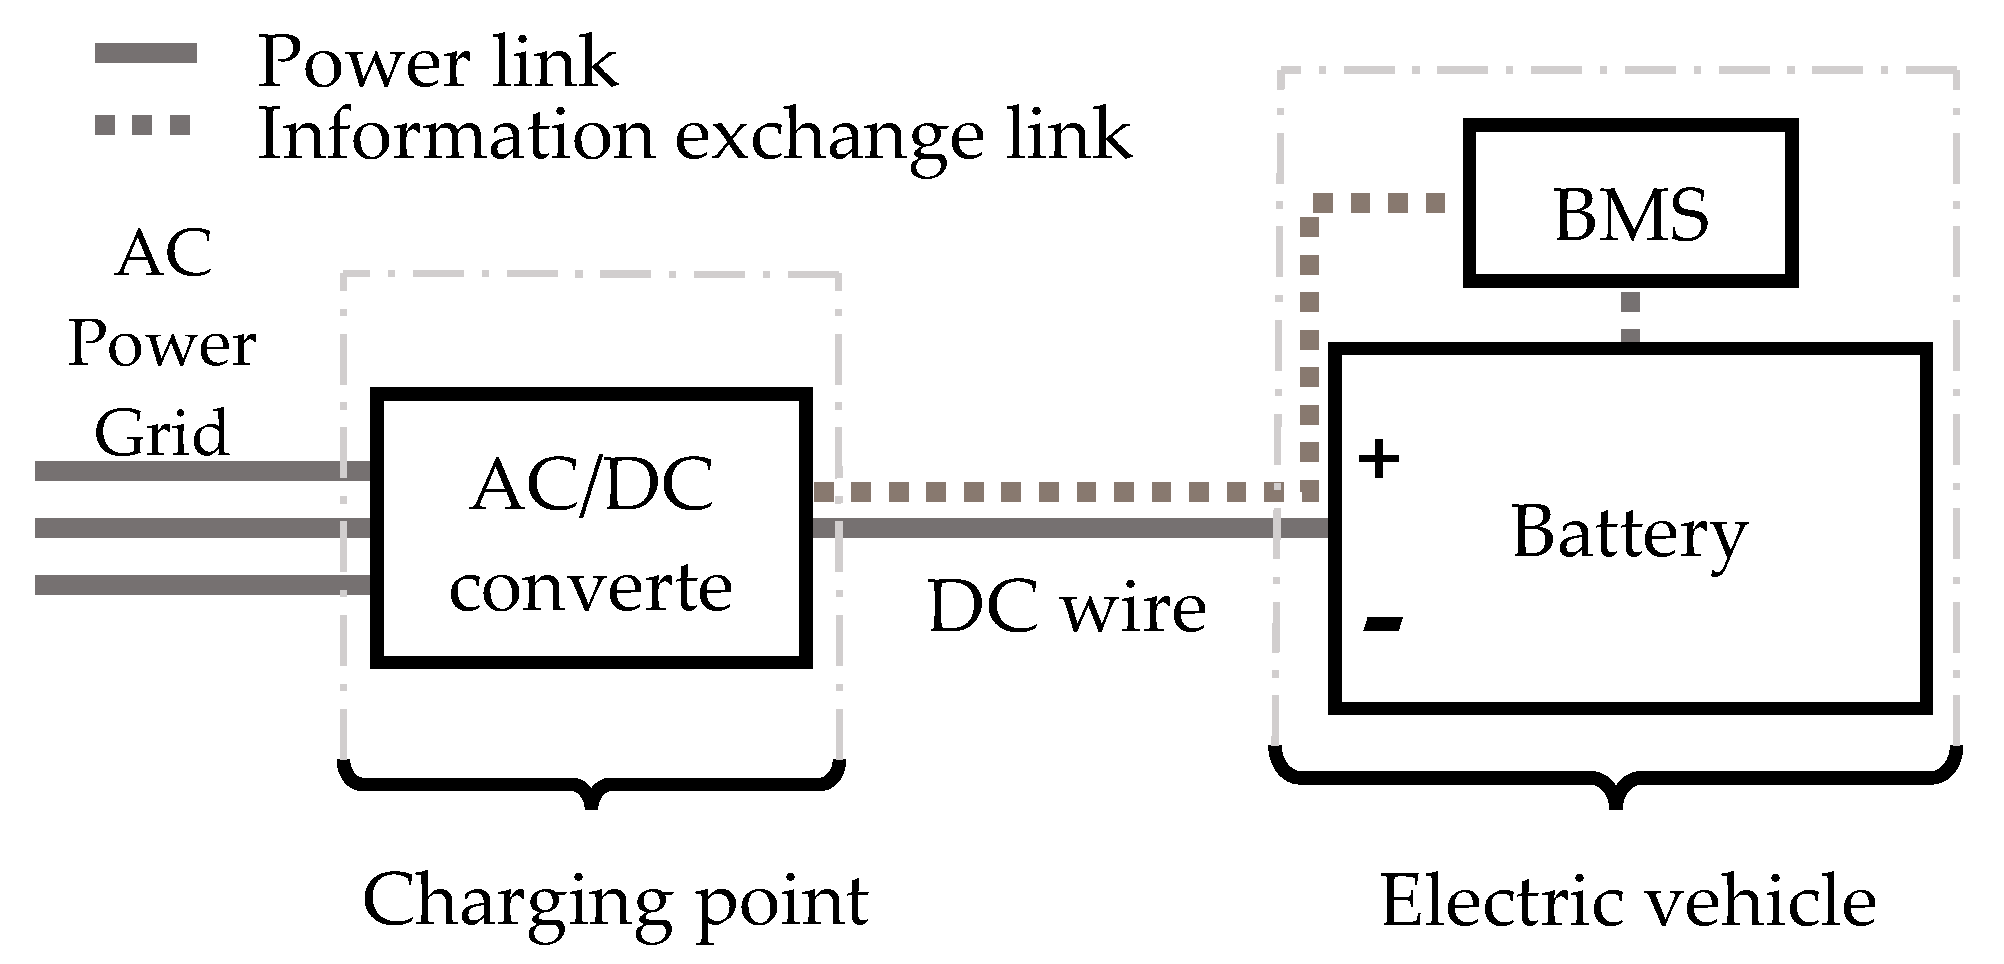
2.3. Charging Power
- The power that can be supplied by the network, which can become limiting when one network connection serves several terminals. Later in the article, we assumed that this portion was not narrowing;
- Maximum power of the charging station, depending on its design;
- Batteries’ maximum charging power, which is detailed afterward.
2.4. Model Application
- (1)
- Without coordination: This was the reference case, for which there was no communication. It was the upper bound of the problem;
- (2)
- Overall optimization: This was an offline search for the optimal solution. The algorithm considered all the journeys over a day. It then looked for the best distribution of vehicles between the different stations. This solution constituted a lower bound to the problem, for development purposes, and was not meant to be deployed;
- (3)
- Coordination: It was a proposal for a communication structure between vehicles and stations. It was an online and deployable algorithm. Trips were known by the drivers but not by the system (charging stations).
3. Optimal Solution
3.1. Problem Characterization
- The number of stops, as it saves ;
- Waiting times, by finding the best distributions of EV between all charging stations;
- Charging times, by charging at the higher charging power and only the required energy.
3.2. Resolution
4. EV-CS Communication Scenario
4.1. Communication Issues
4.2. Proposed Coordination Schema
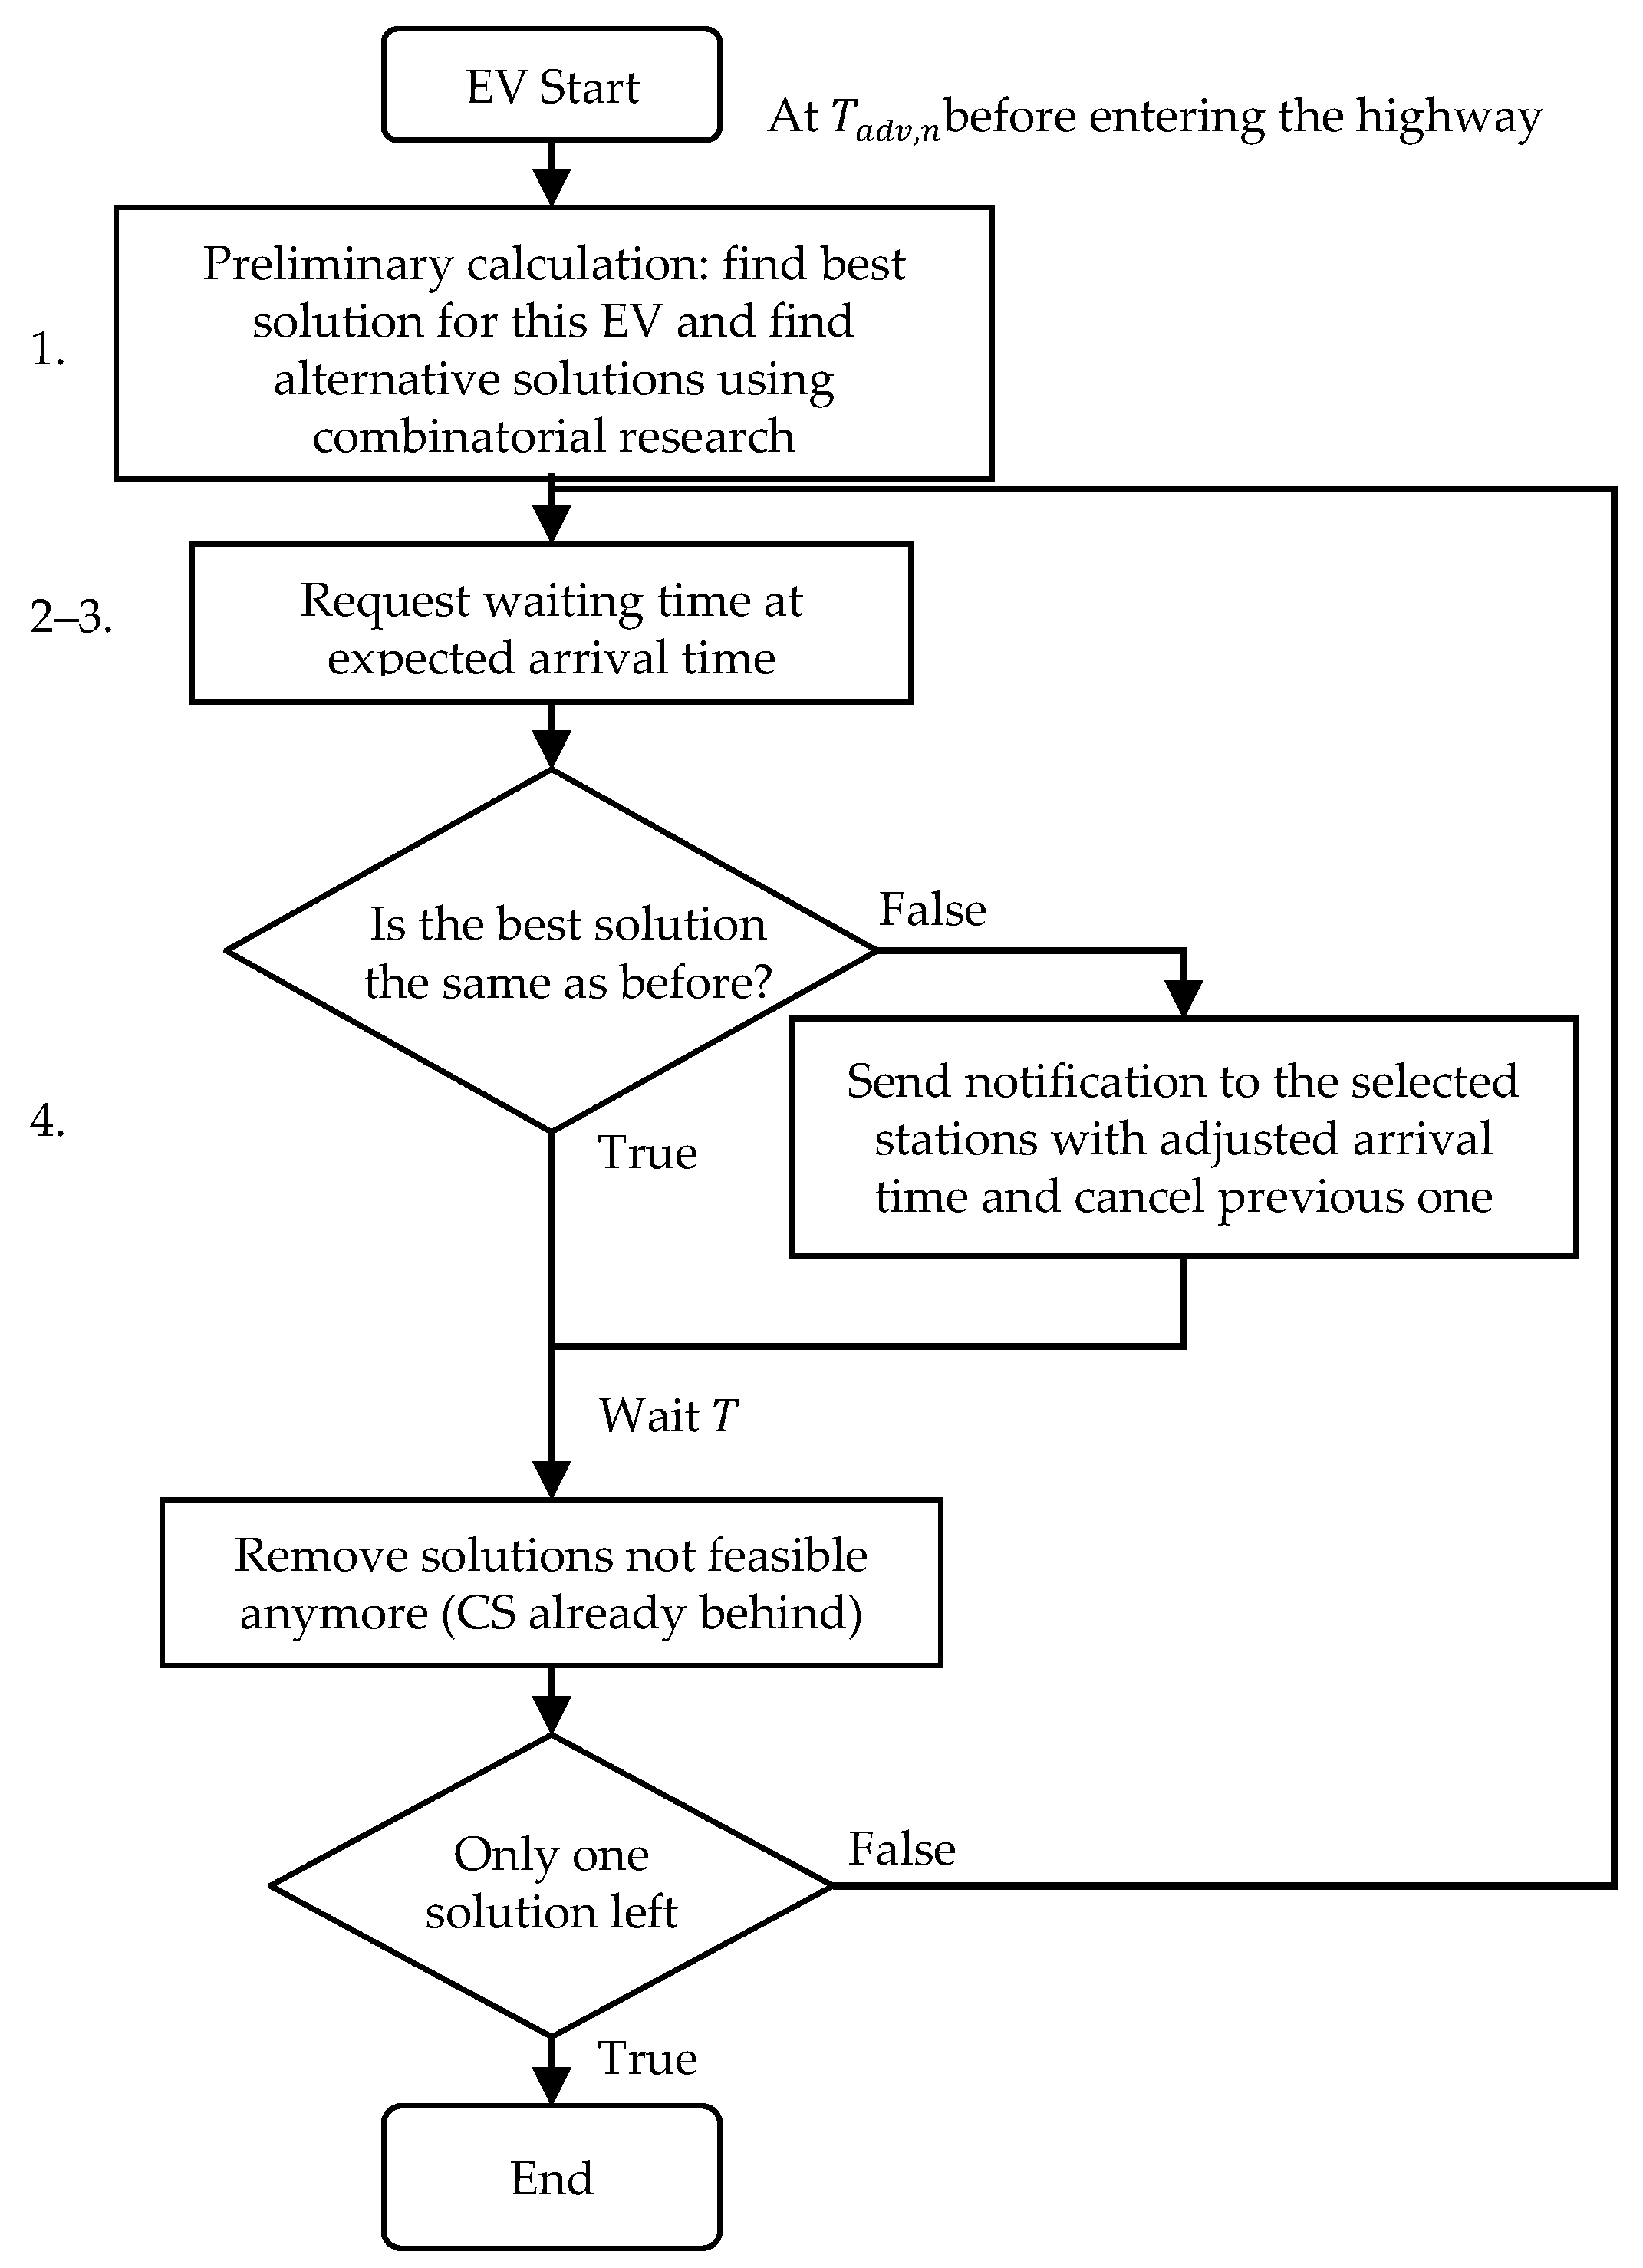
- The EV calculated several possible combinations of stops, with different stations and amounts of energy to be stored to guarantee to reach its destination. This computation was done on the vehicle calculator resources. Details of calculations are given in Section 4.3;
- The EV requested the expected waiting time at charging stations at a specific arrival time, for all combinations;
- CS responded to this request due to an updated arrivals list;
- The EV could now choose the quickest charging plan, and it then sent a notification to the selected stations, including a given arrival time with an estimated charging duration;
- The EV removed solutions that did not correspond to what it already did. For example, if it had already passed by station j without stopping, it could remove solutions where ;
- The vehicle repeated the cycle composed of the steps 2 to 5, every period T.
- Waiting time requests sent at each period T;
- Expected arrival notification sent (from EV to CS) on the first cycle and whenever a faster route was found. It contained arrival time and charging duration;
- In the same way, notification of cancelation to CS that were no longer part of the schedule.
- The station received arrival times and charge times of EVs planning to stop. It therefore calculated charging point usage and potential queuing;
- In the event of a change on the EV side (change of plan in favor of another CS, slow down on the road, longer time spent at another station…), the EV notified the CS at the next T period, allowing it to update its list;
- If this change affects the waiting time for other EVs, they would be notified at the next T-period, allowing them to change their plan if necessary.
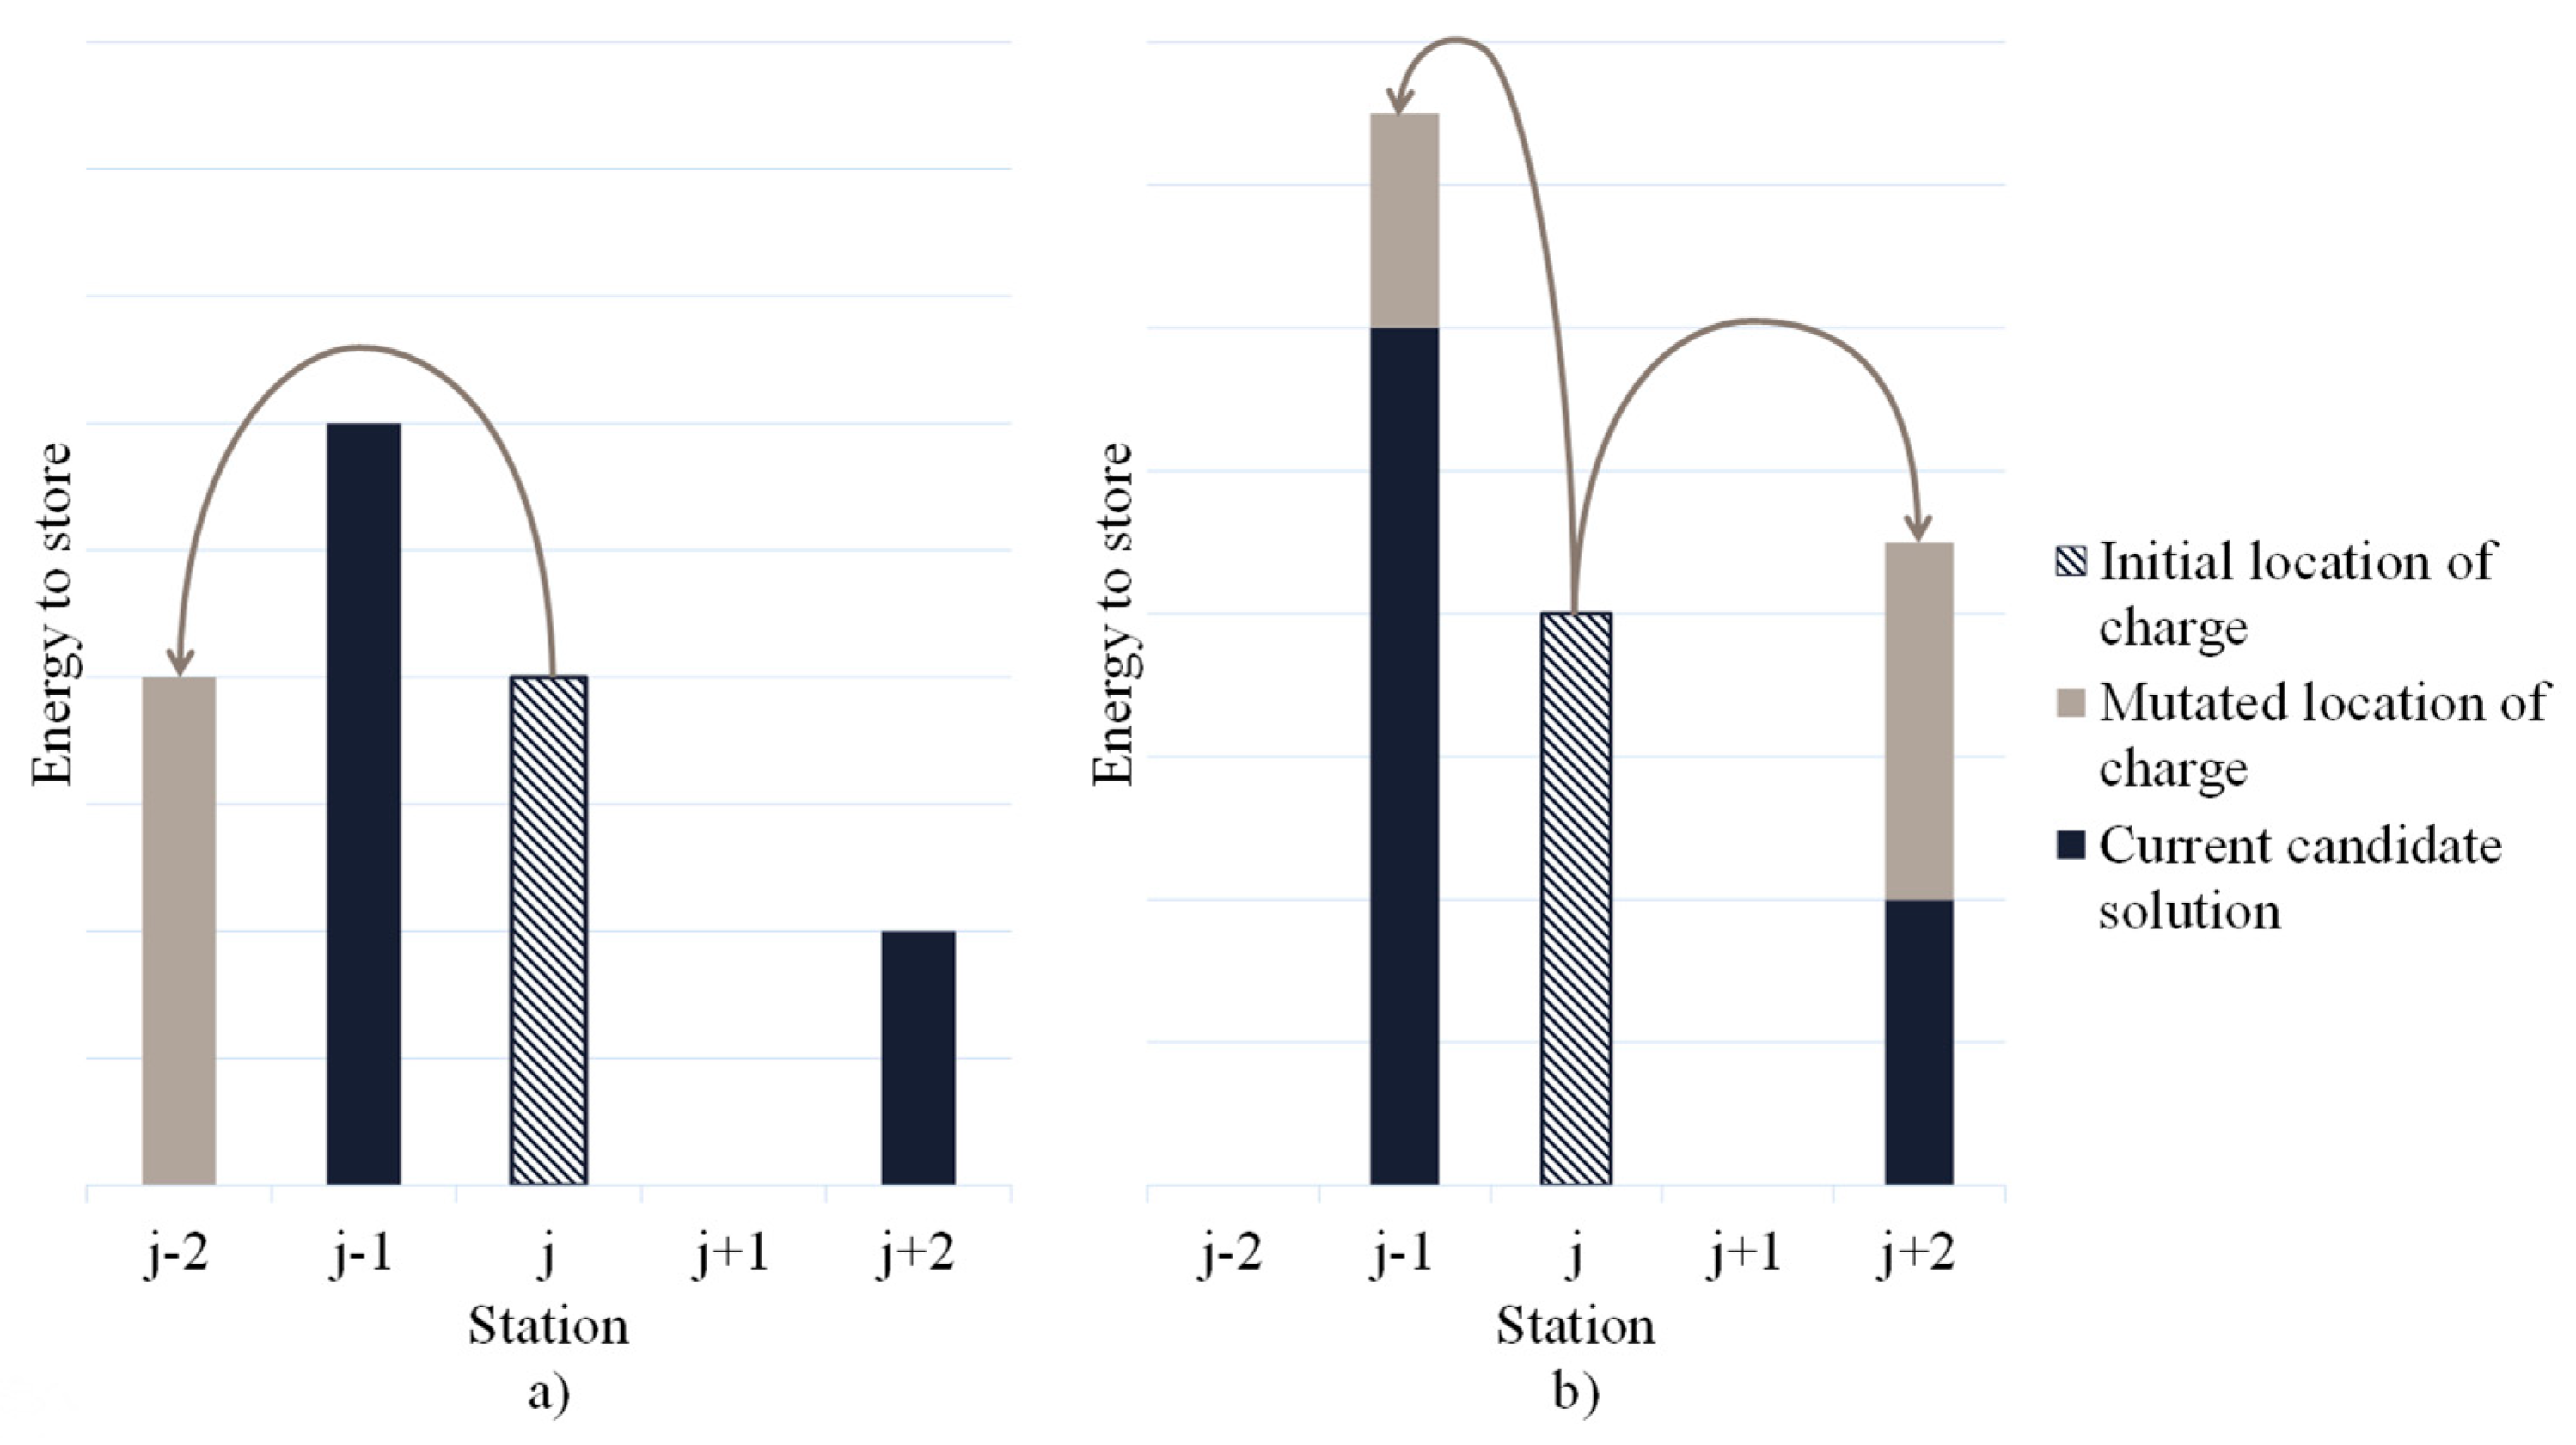
4.3. Charging Plans Research
- With a logic of recharging at the last reachable station, we found the first solution;
- We found the solutions that require the same number of stops as the first solution through a combinatorial search (or one more if the initial number of stops is one or two);
- These solutions were selected if they did not induce a trip 10% longer than the fastest route, to minimize the number of considered solutions.
4.4. Technical Feasibility
5. Application
5.1. Case Study
5.2. Data Presentation: Trips Characteristics
5.3. Preliminary Case Study
- Without coordination: EV drivers have no information about choices made by other EVs. Each driver optimizes their charging schedules individually to minimize their charging time. This strategy reproduces the choices that a driver can make, with only knowledge of charging stations position and power.
- Coordination: Strategy defined in Section 4, we supposed that all drivers use the system. We set the period T and at 10 min.
- Global optimization: (Section 3) Situation in which all information is centralized and choices are made in optimally, considering waiting times when making choices. This strategy led to the best-found solution.
5.4. Parametric Analysis
- The average waiting time in CSs;
- The average charging time;
- , the average number of times a vehicle changed its reservations after finding a combination of recharges that reduce trip time.
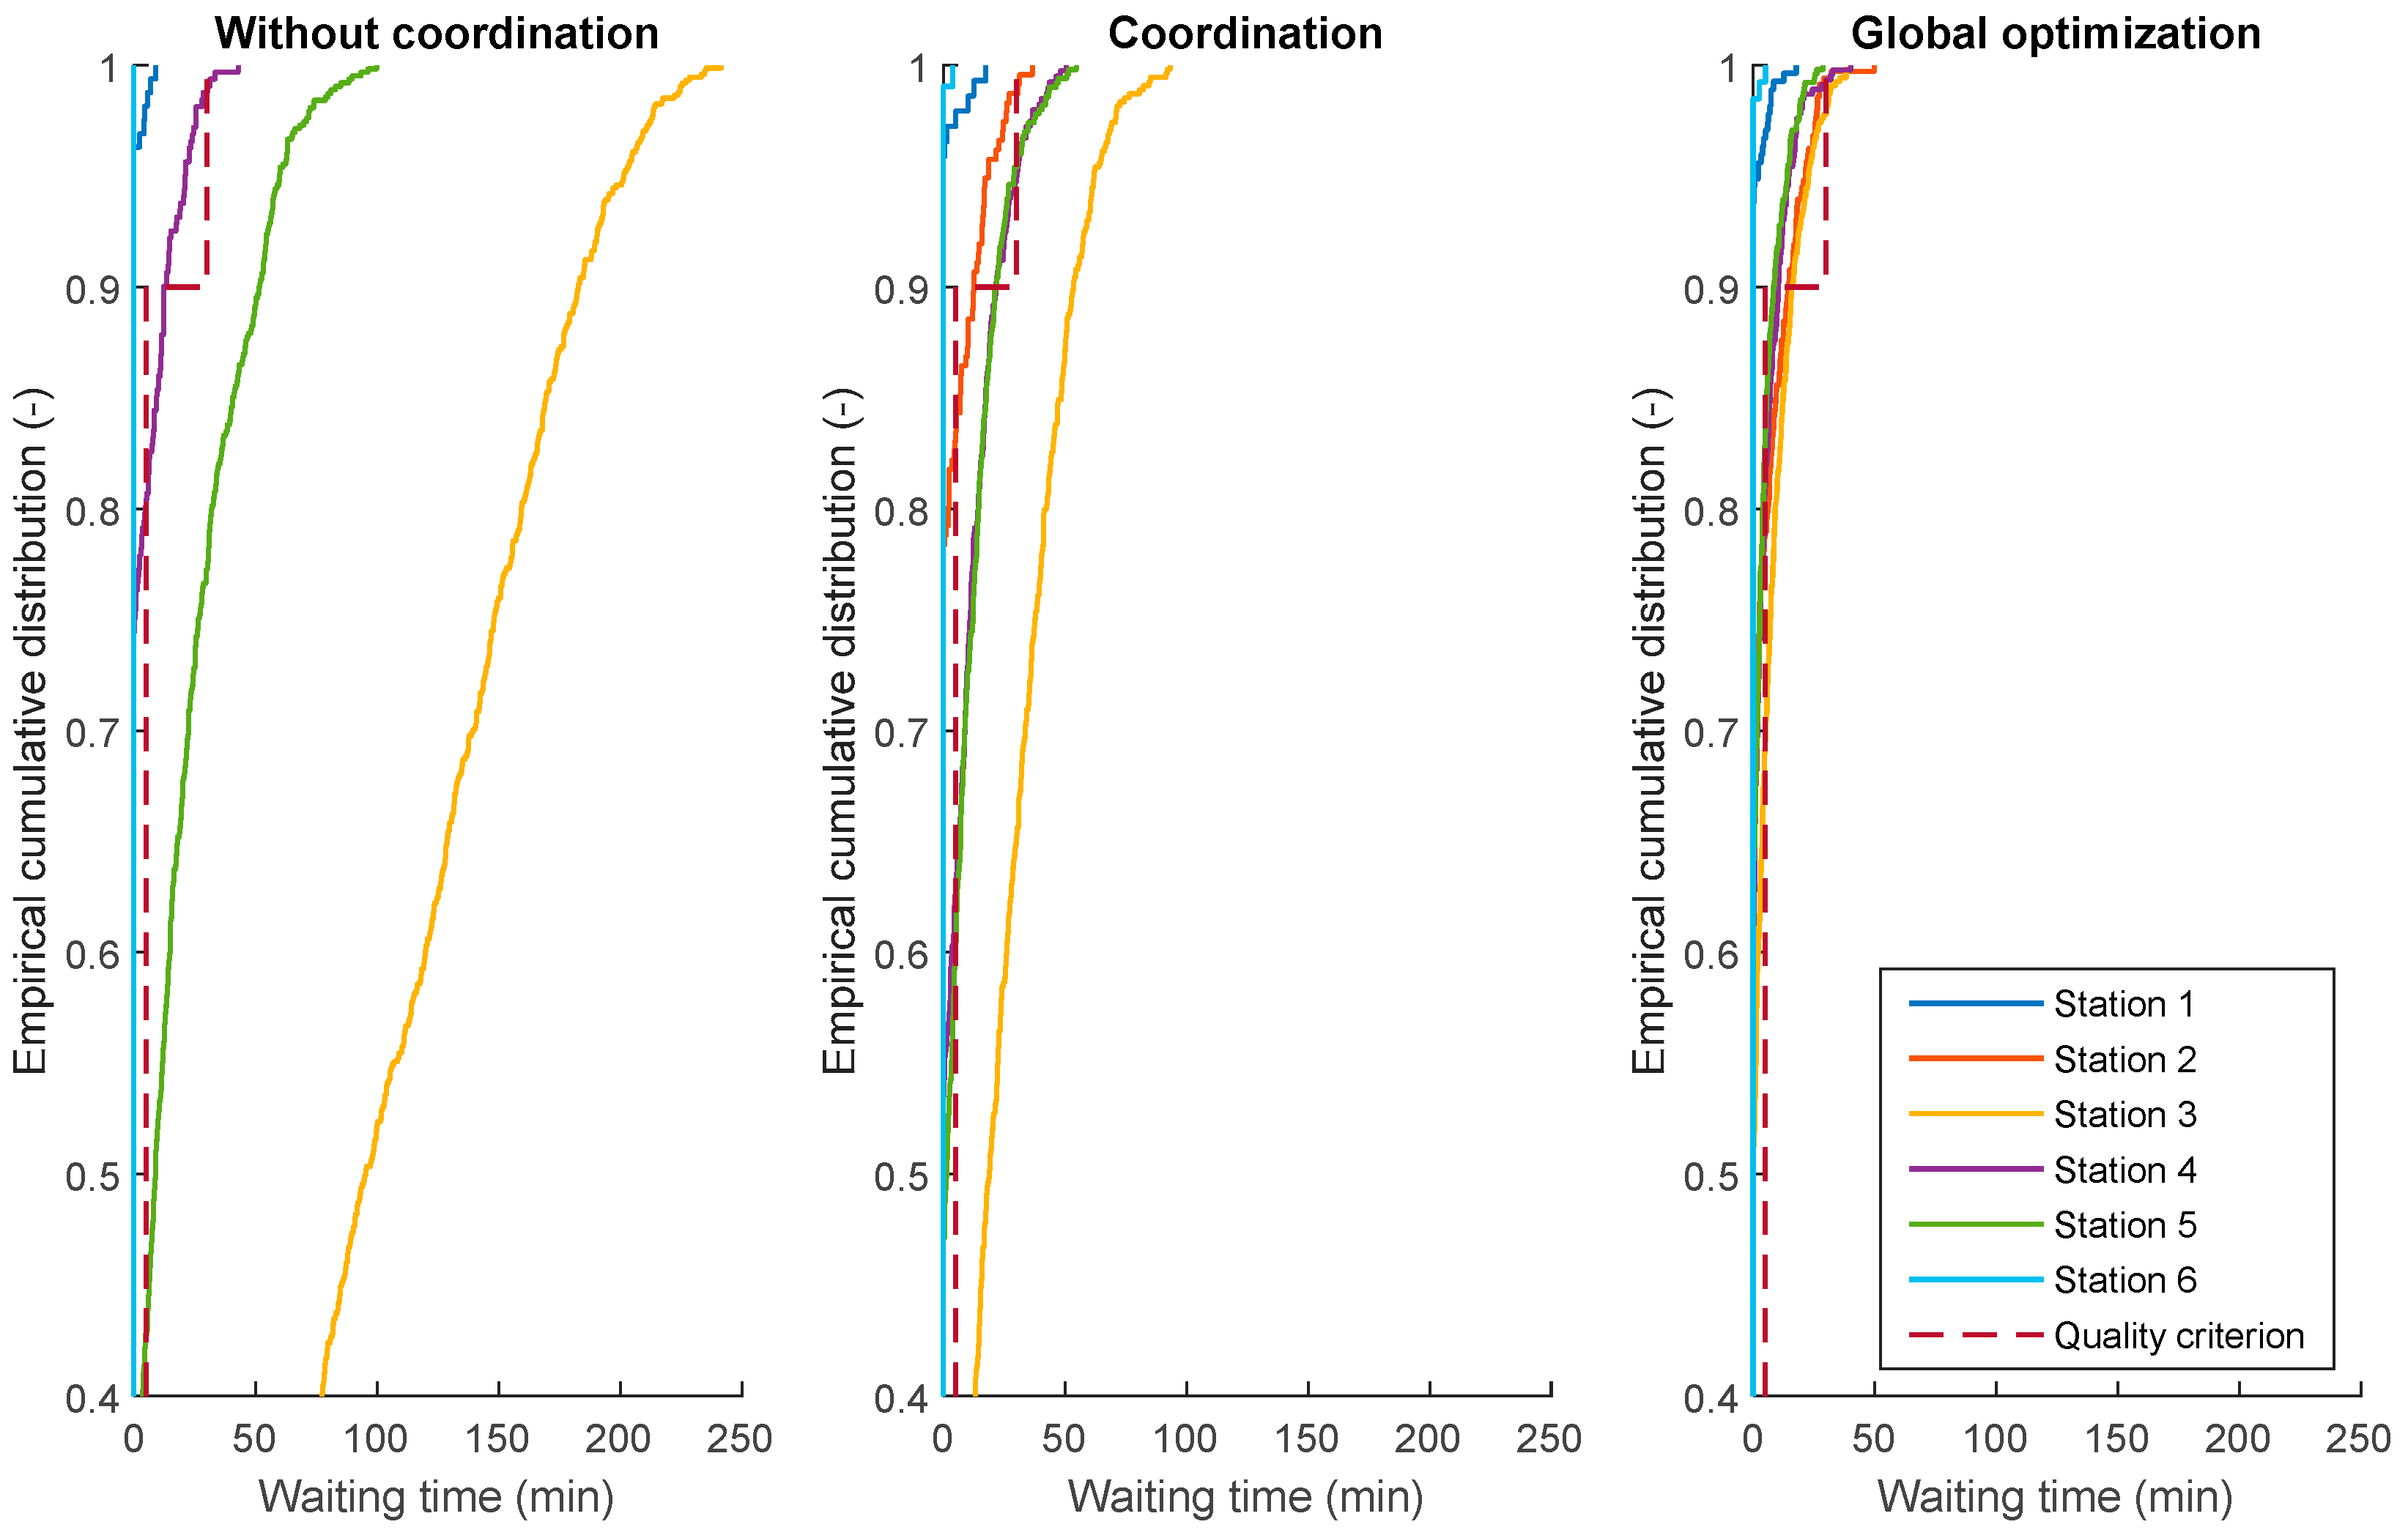
5.5. Comparison
- 90% of EVs entering a charging station had less than 5 min to wait;
- All waiting times were less than 30 min.
6. Conclusions
Author Contributions
Funding
Conflicts of Interest
Abbreviations and Variables
| EV | Electric vehicle |
| SoC | Battery state of charge (-) |
| CS | Charging station |
| Energy stored by EV n at charging station j (kWh) | |
| Energy required by vehicle to complete it trip (kWh) | |
| Number of changes of charging plans made by EVs (-) | |
| Maximum SoC during a charging session of vehicle (-) | |
| Minimum SoC of vehicle (-) | |
| SoC of EV when leaving the highway (-) | |
| Required SoC of EV when leaving the highway (-) | |
| Refreshment period (min) of drivers requirements | |
| For EV , time between the beginning of its trip (at home) and its entrance on the highway (min) | |
| Trip time (min) of EV | |
| Driving time (min) | |
| Time spent by EV in charging station (min) | |
| Waiting time for an available charging point, when the station is full (min) | |
| Time required to store the intended amount of energy (min) | |
| Duration needed for all other operations in a charging station: decelerating, accessing the station, launching the charging session (min) |
References
- IPCC; Masson-Delmotte, V.; Zhai, P.; Pörtner, H.-O.; Roberts, D.; Skea, J.; Shukla, P.; Pirani, A.; Moufouma-Okia, W.; Péan, C.; et al. Global Warming of 1.5 °C. An IPCC Special Report on the Impacts of Global Warming of 1.5 °C above Pre-Industrial Levels and Related Global Greenhouse Gas Emission Pathways, in the Context of Strengthening the Global Response to the Threat of Climate Change, Sustainable Development, and Efforts to Eradicate Poverty. 2018. Available online: https://www.ipcc.ch/sr15/ (accessed on 11 May 2021).
- Solaymani, S. CO2 Emissions Patterns in 7 Top Carbon Emitter Economies: The Case of Transport Sector. Energy 2019, 168, 989–1001. [Google Scholar] [CrossRef]
- Moro, A.; Lonza, L. Electricity Carbon Intensity in European Member States_ Impacts on GHG Emissions of Electric Vehicles. Transp. Res. Part D Transp. Environ. 2018, 64, 5–14. [Google Scholar] [CrossRef] [PubMed]
- Faria, R.; Marques, P.; Moura, P.; Freire, F.; Delgado, J.; de Almeida, A.T. Impact of the Electricity Mix and Use Profile in the Life-Cycle Assessment of Electric Vehicles. Renew. Sustain. Energy Rev. 2013, 24, 271–287. [Google Scholar] [CrossRef]
- Singh, B.; Strømman, A.H. Environmental Assessment of Electrification of Road Transport in Norway: Scenarios and Impacts. Transp. Res. Part D Transp. Environ. 2013, 25, 106–111. [Google Scholar] [CrossRef]
- Borne, O.; Perez, Y.; Petit, M. Market Integration or Bids Granularity to Enhance Flexibility Provision by Batteries of Electric Vehicles. Energy Policy 2018, 119, 140–148. [Google Scholar] [CrossRef]
- Varga, B.O.; Sagoian, A.; Mariasiu, F. Prediction of Electric Vehicle Range: A Comprehensive Review of Current Issues and Challenges. Energies 2019, 12, 946. [Google Scholar] [CrossRef] [Green Version]
- Donkers, A.; Yang, D.; Viktorović, M. Influence of Driving Style, Infrastructure, Weather and Traffic on Electric Vehicle Performance. Transp. Res. Part D Transp. Environ. 2020, 88, 102569. [Google Scholar] [CrossRef]
- Csonka, B.; Csiszár, C. Determination of Charging Infrastructure Location for Electric Vehicles. Transp. Res. Procedia 2017, 27, 768–775. [Google Scholar] [CrossRef]
- Funke, S.Á.; Plötz, P.; Wietschel, M. Invest in Fast-Charging Infrastructure or in Longer Battery Ranges? A Cost-Efficiency Comparison for Germany. Appl. Energy 2019, 235, 888–899. [Google Scholar] [CrossRef]
- Kosmanos, D.; Maglaras, L.A.; Mavrovouniotis, M.; Moschoyiannis, S.; Argyriou, A.; Maglaras, A.; Janicke, H. Route Optimization of Electric Vehicles Based on Dynamic Wireless Charging. IEEE Access 2018, 6, 42551–42565. [Google Scholar] [CrossRef]
- del Razo, V.; Jacobsen, H.-A. Smart Charging Schedules for Highway Travel With Electric Vehicles. IEEE Trans. Transp. Electrif. 2016, 2, 160–173. [Google Scholar] [CrossRef]
- Gusrialdi, A.; Qu, Z.; Simaan, M.A. Distributed Scheduling and Cooperative Control for Charging of Electric Vehicles at Highway Service Stations. IEEE Trans. Intell. Transp. Syst. 2017, 18, 2713–2727. [Google Scholar] [CrossRef]
- Qin, H.; Zhang, W. Charging Scheduling with Minimal Waiting in a Network of Electric Vehicles and Charging Stations. In Proceedings of the Eighth ACM International Workshop on Vehicular Inter-Networking, Las Vegas, NV, USA, 19–23 September 2011; pp. 51–60. [Google Scholar]
- Tan, J.; Wang, L. Real-Time Charging Navigation of Electric Vehicles to Fast Charging Stations: A Hierarchical Game Approach. IEEE Trans. Smart Grid 2015, 8, 846–856. [Google Scholar] [CrossRef]
- Yang, Y.; Yao, E.; Yang, Z.; Zhang, R. Modeling the Charging and Route Choice Behavior of BEV Drivers. Transp. Res. Part C Emerg. Technol. 2016, 65, 190–204. [Google Scholar] [CrossRef]
- Hassler, J.; Dimitrova, Z.; Petit, M.; Dessante, P. Service for Optimization of Charging Stations Selection for Electric Vehicles Users during Long Distances Drives: Time-Cost Tradeoff. IOP Conf. Ser. Mater. Sci. Eng. 2020, 1002, 012029. [Google Scholar] [CrossRef]
- IEC 62196-3:2014|IEC Webstore|LVDC. Available online: https://webstore.iec.ch/publication/6584&preview=1 (accessed on 23 January 2020).
- Salapic, V.; Grzanic, M.; Capuder, T. Optimal Sizing of Battery Storage Units Integrated into Fast Charging EV Stations. In Proceedings of the 2018 IEEE International Energy Conference (ENERGYCON), Limassol, Cyprus, 3–7 June 2018; pp. 1–6. [Google Scholar]
- Price, K.; Storn, R.M.; Lampinen, J.A. Differential Evolution: A Practical Approach to Global Optimization; Springer Science & Business Media: Berlin/Heidelberg, Germany, 2006; ISBN 978-3-540-31306-9. [Google Scholar]
- DiRIF Les comptages en Ile-de-France-Direction des routes Ile-de-France. Available online: http://www.dir.ile-de-france.developpement-durable.gouv.fr/les-comptages-a174.html (accessed on 13 March 2019).
- Data.gouv.fr Trafic Moyen Journalier Annuel sur le Réseau Routier National. Available online: /fr/datasets/trafic-moyen-journalier-annuel-sur-le-reseau-routier-national/ (accessed on 22 January 2020).


| Car Type | Urban | Sedan | Luxury |
|---|---|---|---|
| Battery (kW.h) | 50 | 60 | 100 |
| Maximum charging power (kW) | 50 | 100 | 125 |
| Consumption (kW.h/km) | 0.15 | 0.18 | 0.18 |
| Driving Speed (km/h) | 110 | 130 | 130 |
| Frequency of occurrence | 0.3 | 0.6 | 0.1 |
| Parameter | Value |
|---|---|
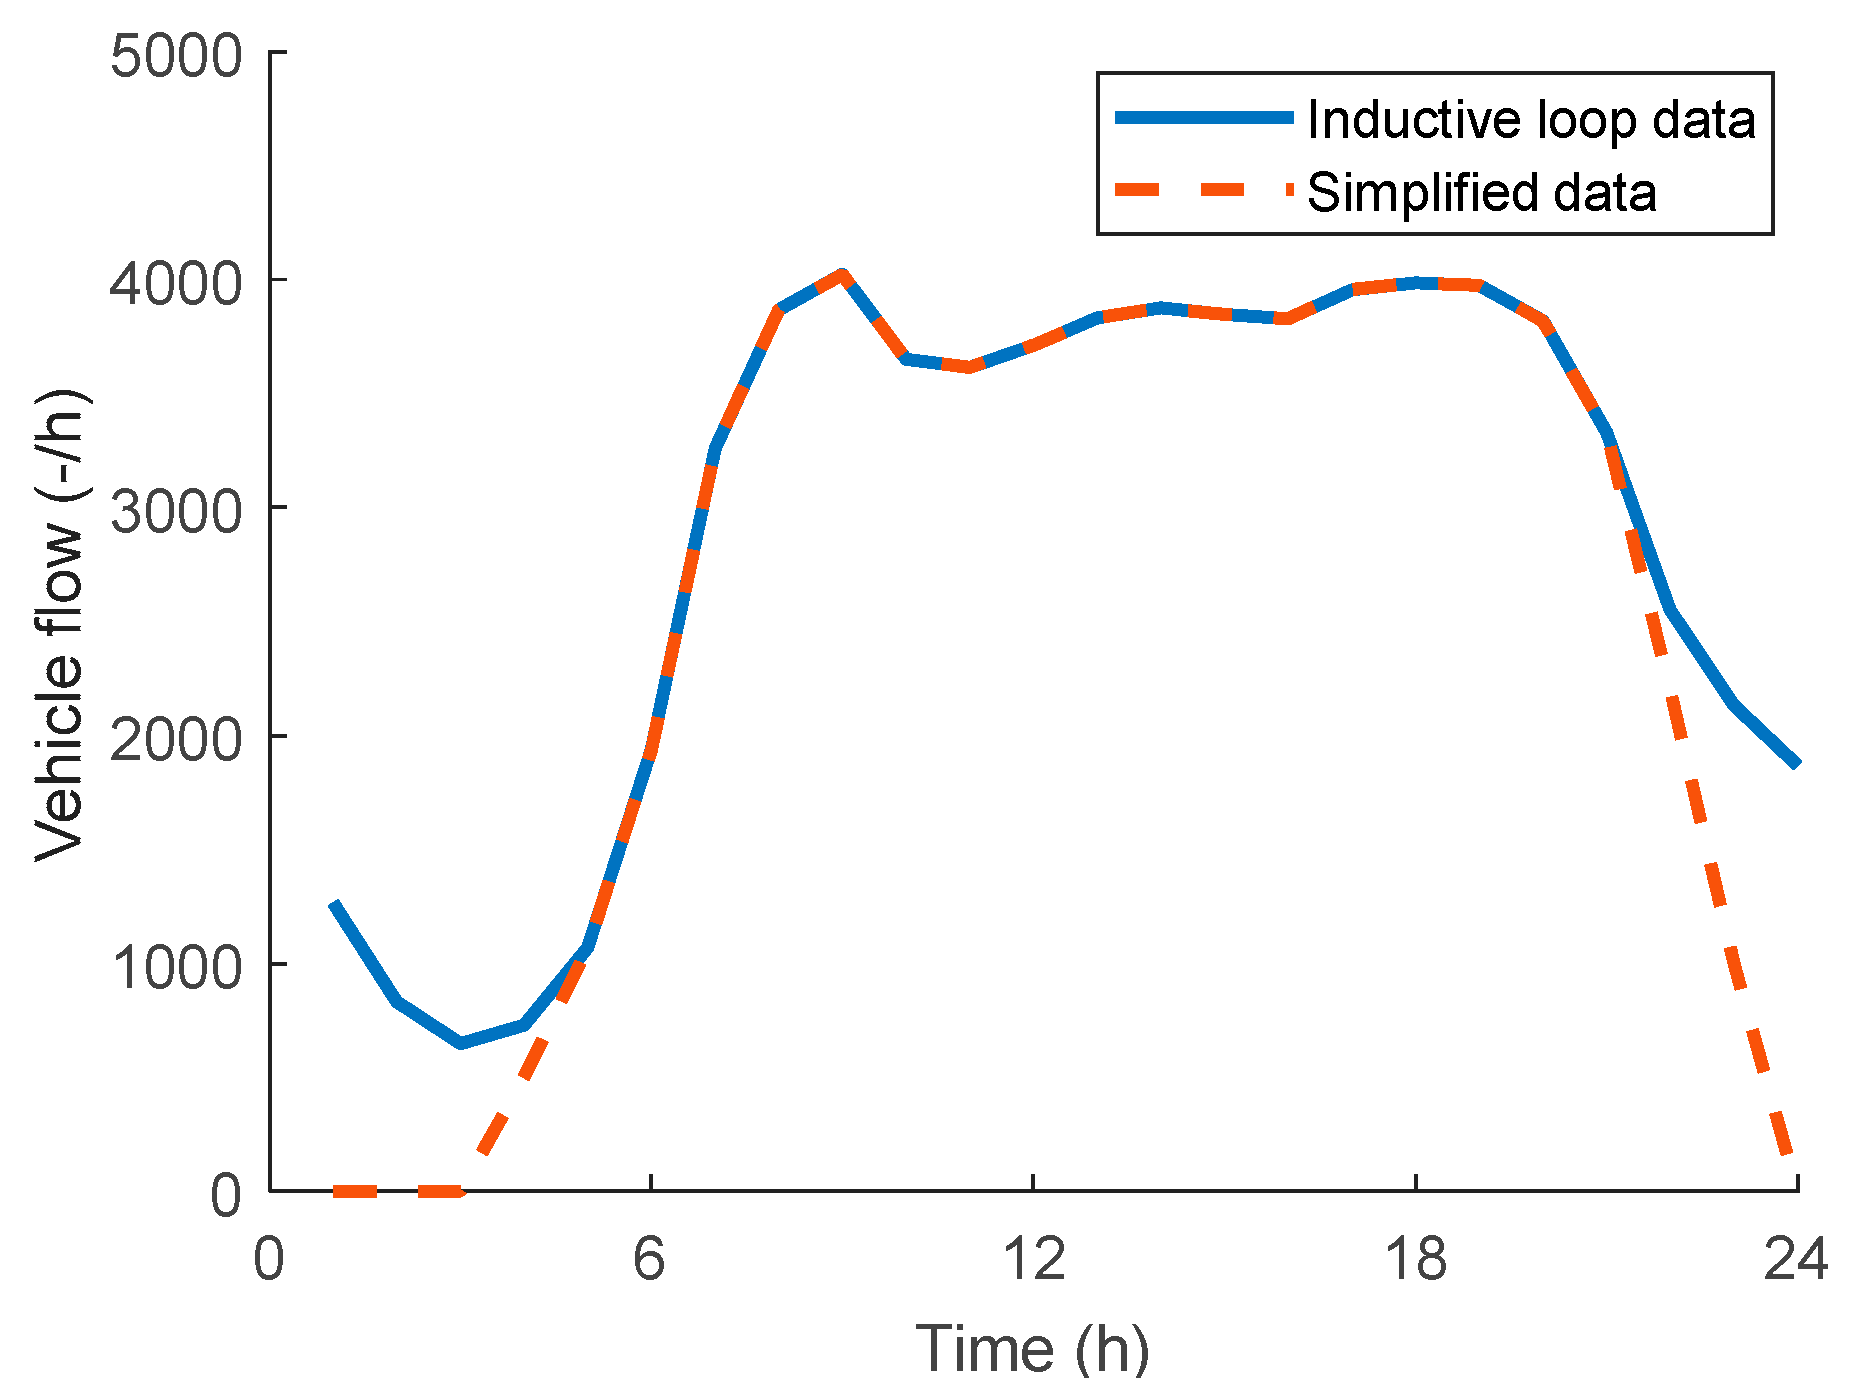
| Departure time | Figure 8 simplified data distribution |
| Uniform distribution [50; 100]% | |
| 30% | |
| 80% | |
| 15% | |
| Entrance | Uniform distribution |
| Exit | Uniform distribution , with first exit more than 250 km away from the chosen entrance |
| Results | No Coordination | Communication | Global Optimization |
|---|---|---|---|
| Average charging time (min) | 46 | 47.3 | 47.7 |
| Average waiting time (min) | 15.6 | 8.8 | 5.8 |
| Total (min) | 61.6 | 56.1 | 53.5 |
| Saving compared to No C. | - | 9% | 13% |
Publisher’s Note: MDPI stays neutral with regard to jurisdictional claims in published maps and institutional affiliations. |
© 2021 by the authors. Licensee MDPI, Basel, Switzerland. This article is an open access article distributed under the terms and conditions of the Creative Commons Attribution (CC BY) license (https://creativecommons.org/licenses/by/4.0/).
Share and Cite
Hassler, J.; Dimitrova, Z.; Petit, M.; Dessante, P. Optimization and Coordination of Electric Vehicle Charging Process for Long-Distance Trips. Energies 2021, 14, 4054. https://doi.org/10.3390/en14134054
Hassler J, Dimitrova Z, Petit M, Dessante P. Optimization and Coordination of Electric Vehicle Charging Process for Long-Distance Trips. Energies. 2021; 14(13):4054. https://doi.org/10.3390/en14134054
Chicago/Turabian StyleHassler, Jean, Zlatina Dimitrova, Marc Petit, and Philippe Dessante. 2021. "Optimization and Coordination of Electric Vehicle Charging Process for Long-Distance Trips" Energies 14, no. 13: 4054. https://doi.org/10.3390/en14134054
APA StyleHassler, J., Dimitrova, Z., Petit, M., & Dessante, P. (2021). Optimization and Coordination of Electric Vehicle Charging Process for Long-Distance Trips. Energies, 14(13), 4054. https://doi.org/10.3390/en14134054