1. Introduction
Natural radioactivity surrounds us everywhere. It originates from cosmic radiation, radionuclides created during the interaction of cosmic radiation with components of the atmosphere and radionuclides present in the earth’s crust. However, some places such as underground sites show a low level of natural radioactivity, making them an excellent place for specific research in the field of physics, astrophysics (search for dark matter, double beta decay), biology, environmental science, and other fields [
1,
2,
3,
4]. Therefore, it is essential to characterize these locations in terms of natural radioactivity and their sources of origin. In underground locations, natural radioactivity mainly comes from the cosmic ray muon flux (created when protons and secondary particles interact with atoms in the atmosphere), the decay of radionuclides belonging to the decay chains of uranium and thorium (
238U,
232Th) and single very long-lived radionuclides (
40K), the spontaneous fission of U and Th, and the interaction of neutrons that derive from (α, n) reactions. The level of natural radioactivity in underground locations depends on the depth of the underground laboratory, the local geology, and the materials used to strengthen the structures of underground rooms (including concrete). Measurements of the natural radiation background are, on the one hand, crucial to ensure safe work in underground locations, and, on the other hand, they allow areas in mines to be identified that are suitable for possible transformation of mining excavations for the needs of, e.g., physical sciences.
The study of natural radioactivity was carried out at the place which is considered to be one of the potentially suitable places for an Underground Laboratory in the future, the Polkowice-Sieroszowice mine, Poland. This facility was one of the testing sites (ULs) participating in the BSUIN (Baltic Sea Underground Innovation Network) and EUL (Empowering Underground Laboratories Network Usage) and is co-ordinated by the KGHM Cuprum R&D center. The mine is one of the largest active underground copper mines in the world. The mine’s infrastructure is very well developed and at the moment, there are hundreds of kilometers of workings, which are easily accessible. Still, there are no typical underground facilities or research panels within the excavated area, which could be used for the purposes of science, research and development of tourism. Therefore, conducting detailed measurements of the level of natural radioactivity in these locations is necessary to determine the radiation hazard and the possibility of conducting various experiments requiring unique conditions.
Earlier studies of natural radioactivity in the Polkowice-Sieroszowice mine were carried out in the salt bed in the P1 chamber at a depth of 930 m [
5,
6]. The studies showed a very low level of natural radioactivity. The average dose rate was 1.8 nGy/h [
5], and gamma-ray flux of 0.124 ± 0.002 cm
−2 s
−1 [
6]. Moreover, the determined values of Th and U concentrations in the collected salt samples were much lower (below 1 Bq/kg) than for a typical rock (about 20–30 Bq/kg) [
5,
7].
Due to inter alia, very stable tectonic conditions, and a very low level of natural background radiation, the mine was one of the primary candidates for the location of the underground SUNLAB laboratory—two laboratories SUNLAB1 (a small laboratory) located in a salt layer, and SUNLAB2 (a large laboratory) located in anhydrite [
8,
9]—to host the European project LAGUNA FP7 [
10] with a 100 kton GLACIER liquid argon detector for physics research.
As a result of the mine’s development plans, the P1 salt chamber was no longer considered. Therefore, the natural radioactivity was measured in a different location near the SW-1 shaft. The research included in situ gamma-ray spectrometry measurements, measurements of thermal neutron flux and radon concentration in the air, as well as laboratory analysis of radium (226,228Ra), uranium (234,238U), and potassium (40K) radioisotope concentration in the collected rock samples using alpha and gamma spectrometry.
Site Geology
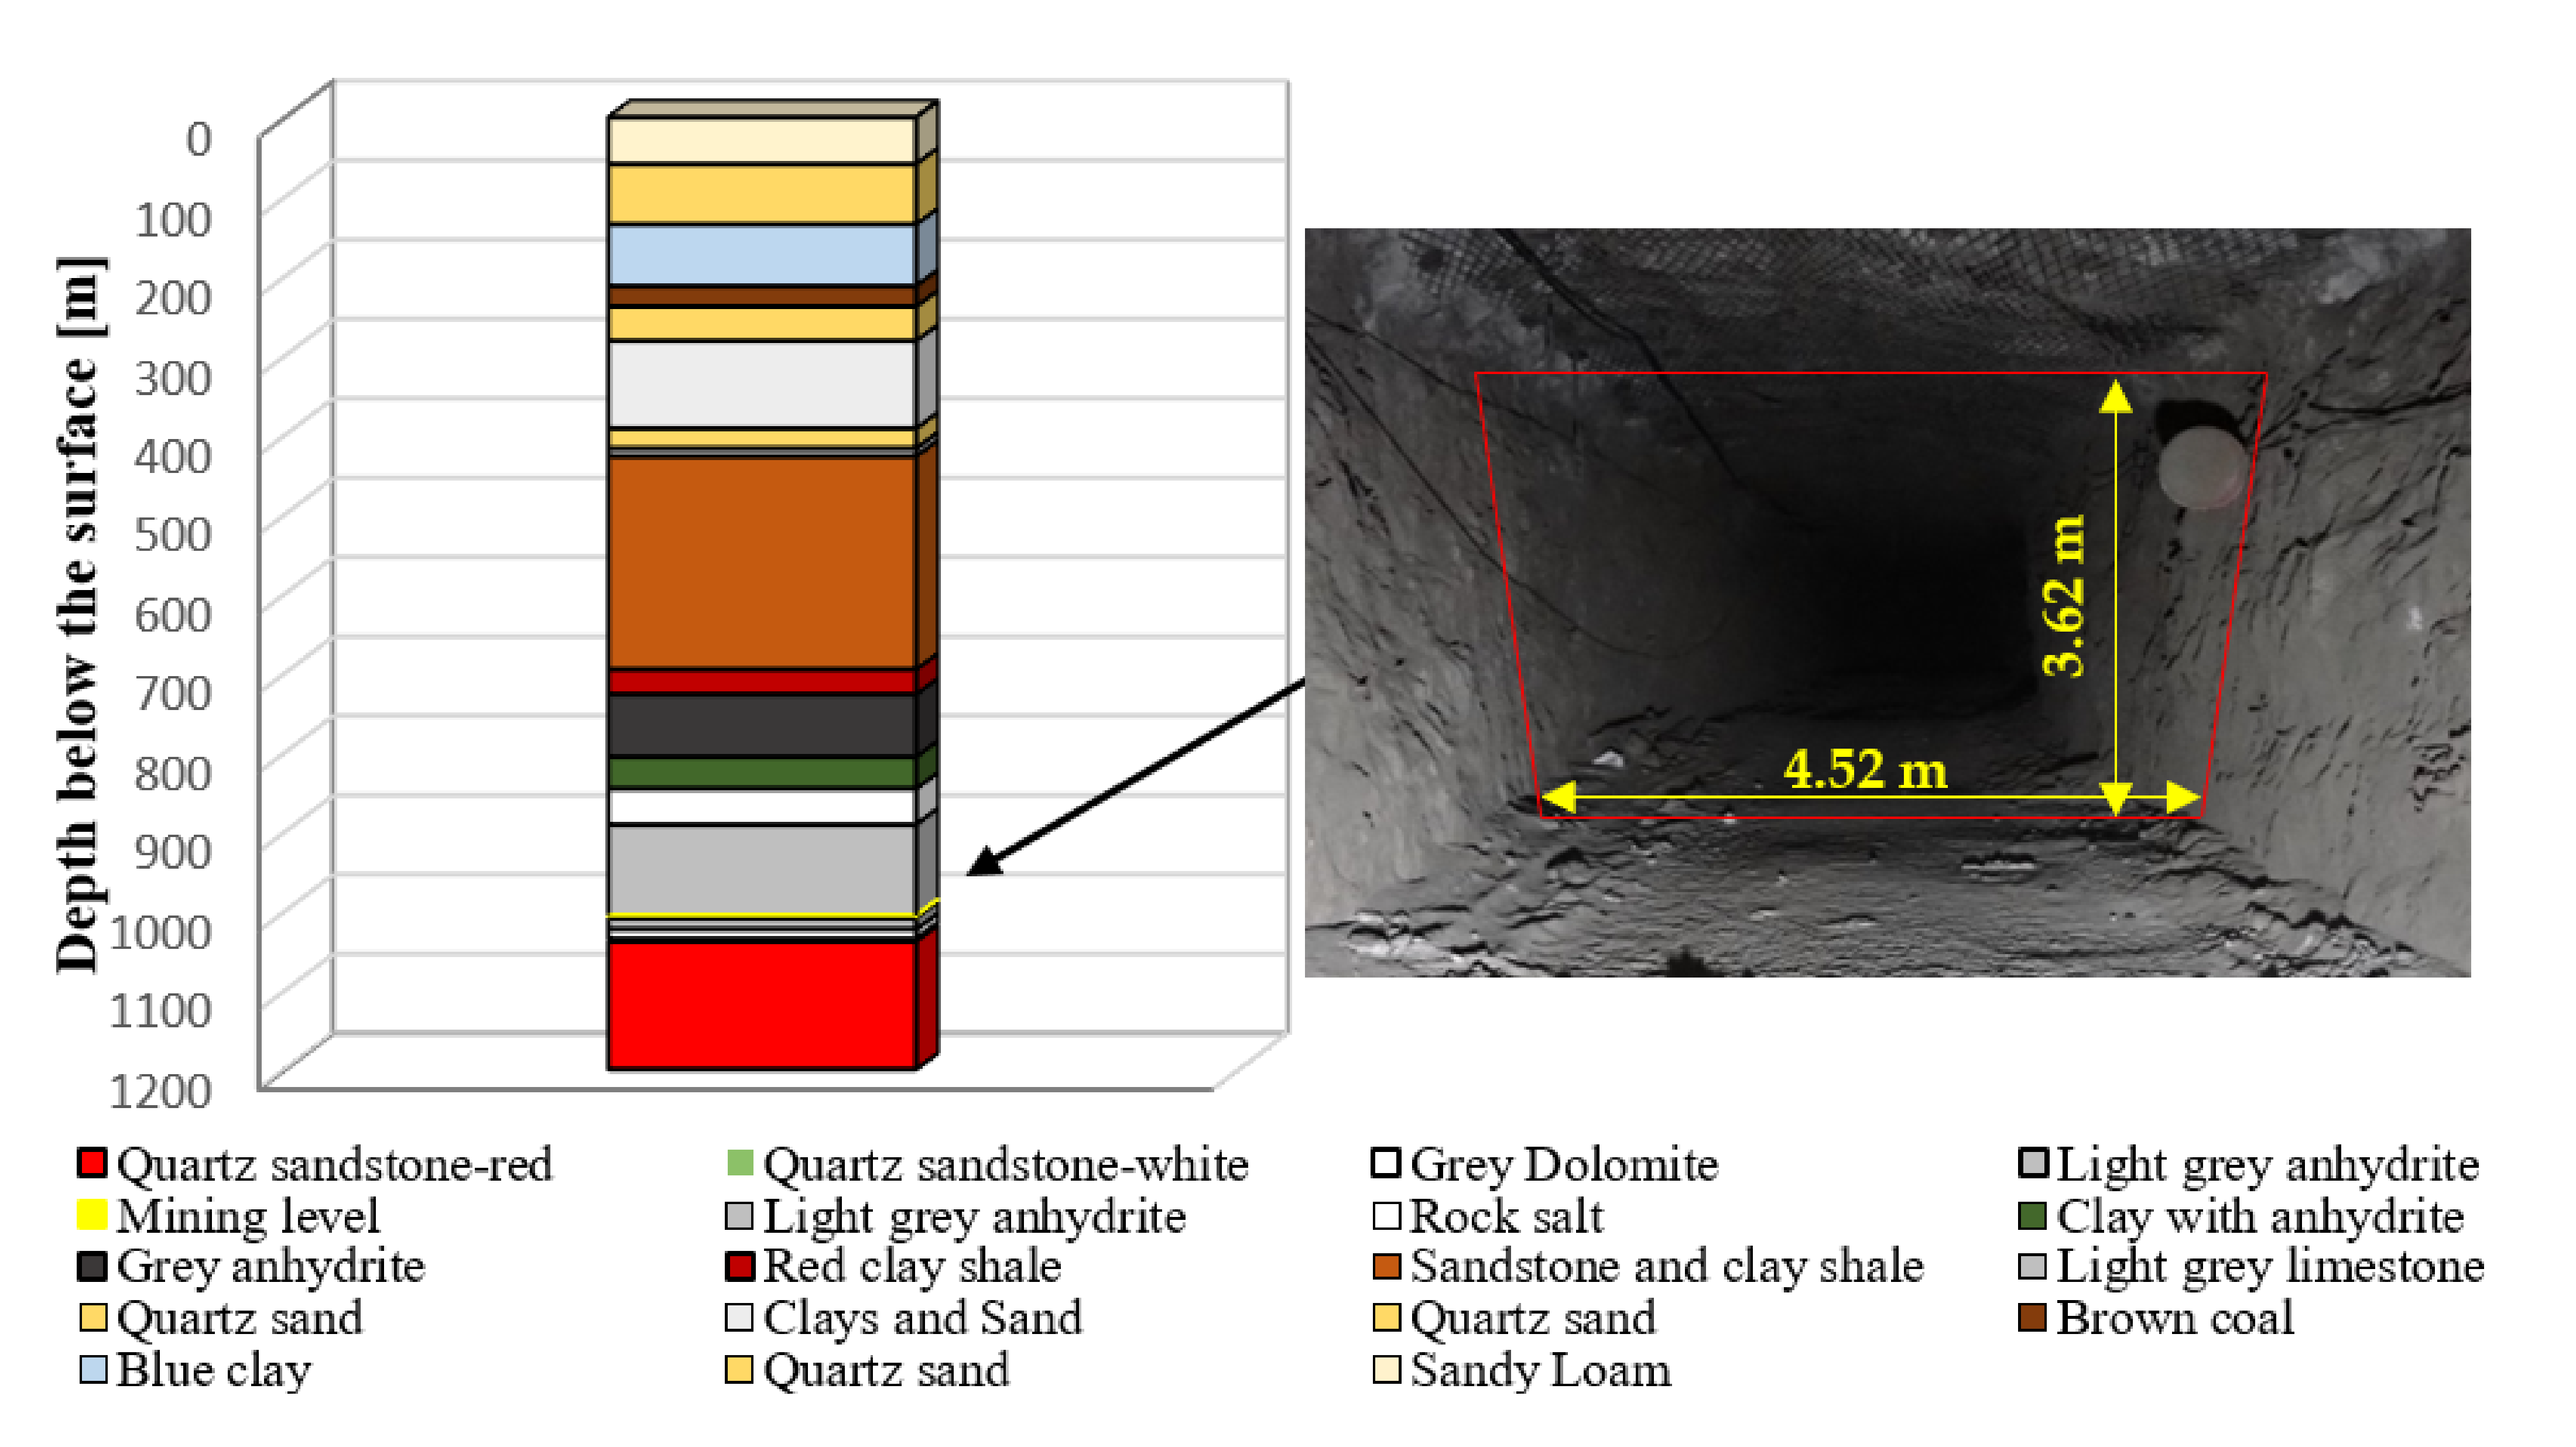
Continuous radiation measurement was conducted in the Polkowice-Sieroszowice underground copper mine, which is located to the northwest of the Polkowice city in the Lower Silesia Voivodeship. The measuring site was located in direct vicinity to the SW-1 shaft at a depth of 1014.4 m (2941.8 m w.e.) below the ground surface which corresponds to 786 m below sea level. The copper deposit in the research area is classified as stratoidal and single-level. The mining activities near the SW-1 shaft have proceeded within Light grey anhydrite strata. The roof of the analysed area consists of a high strength anhydrite layer with a thickness of 114.4 m. Over it, the rock salt strata and anhydrite with clays with a total thickness of about 200 m are located. The anhydrite and clay strata are covered by 270 m of sandstone layers. Above it, there are tertiary formations in the form of clays and quartz sands as well as quaternary sands and clay with a total thickness of about 430 m. In turn, on the floor of the measuring site, a thin layer of light grey anhydrite is located. Below it, there are weak layers of white and red quartz sandstone. The geologic profile of the analyzed region is presented in
Figure 1.
The cross-section of the gallery is about 16.4 m2. At the same time, its shape may be characterized as rectangular. Concerning the environmental conditions, the temperature and humidity in the surrounding measuring site were moderate. The dry-bulb temperature during the measurements was on average 25.6 °C, while the wet-bulb temperature was equal to 18.8 °C. The overall humidity was 52%.
2. Materials and Methods
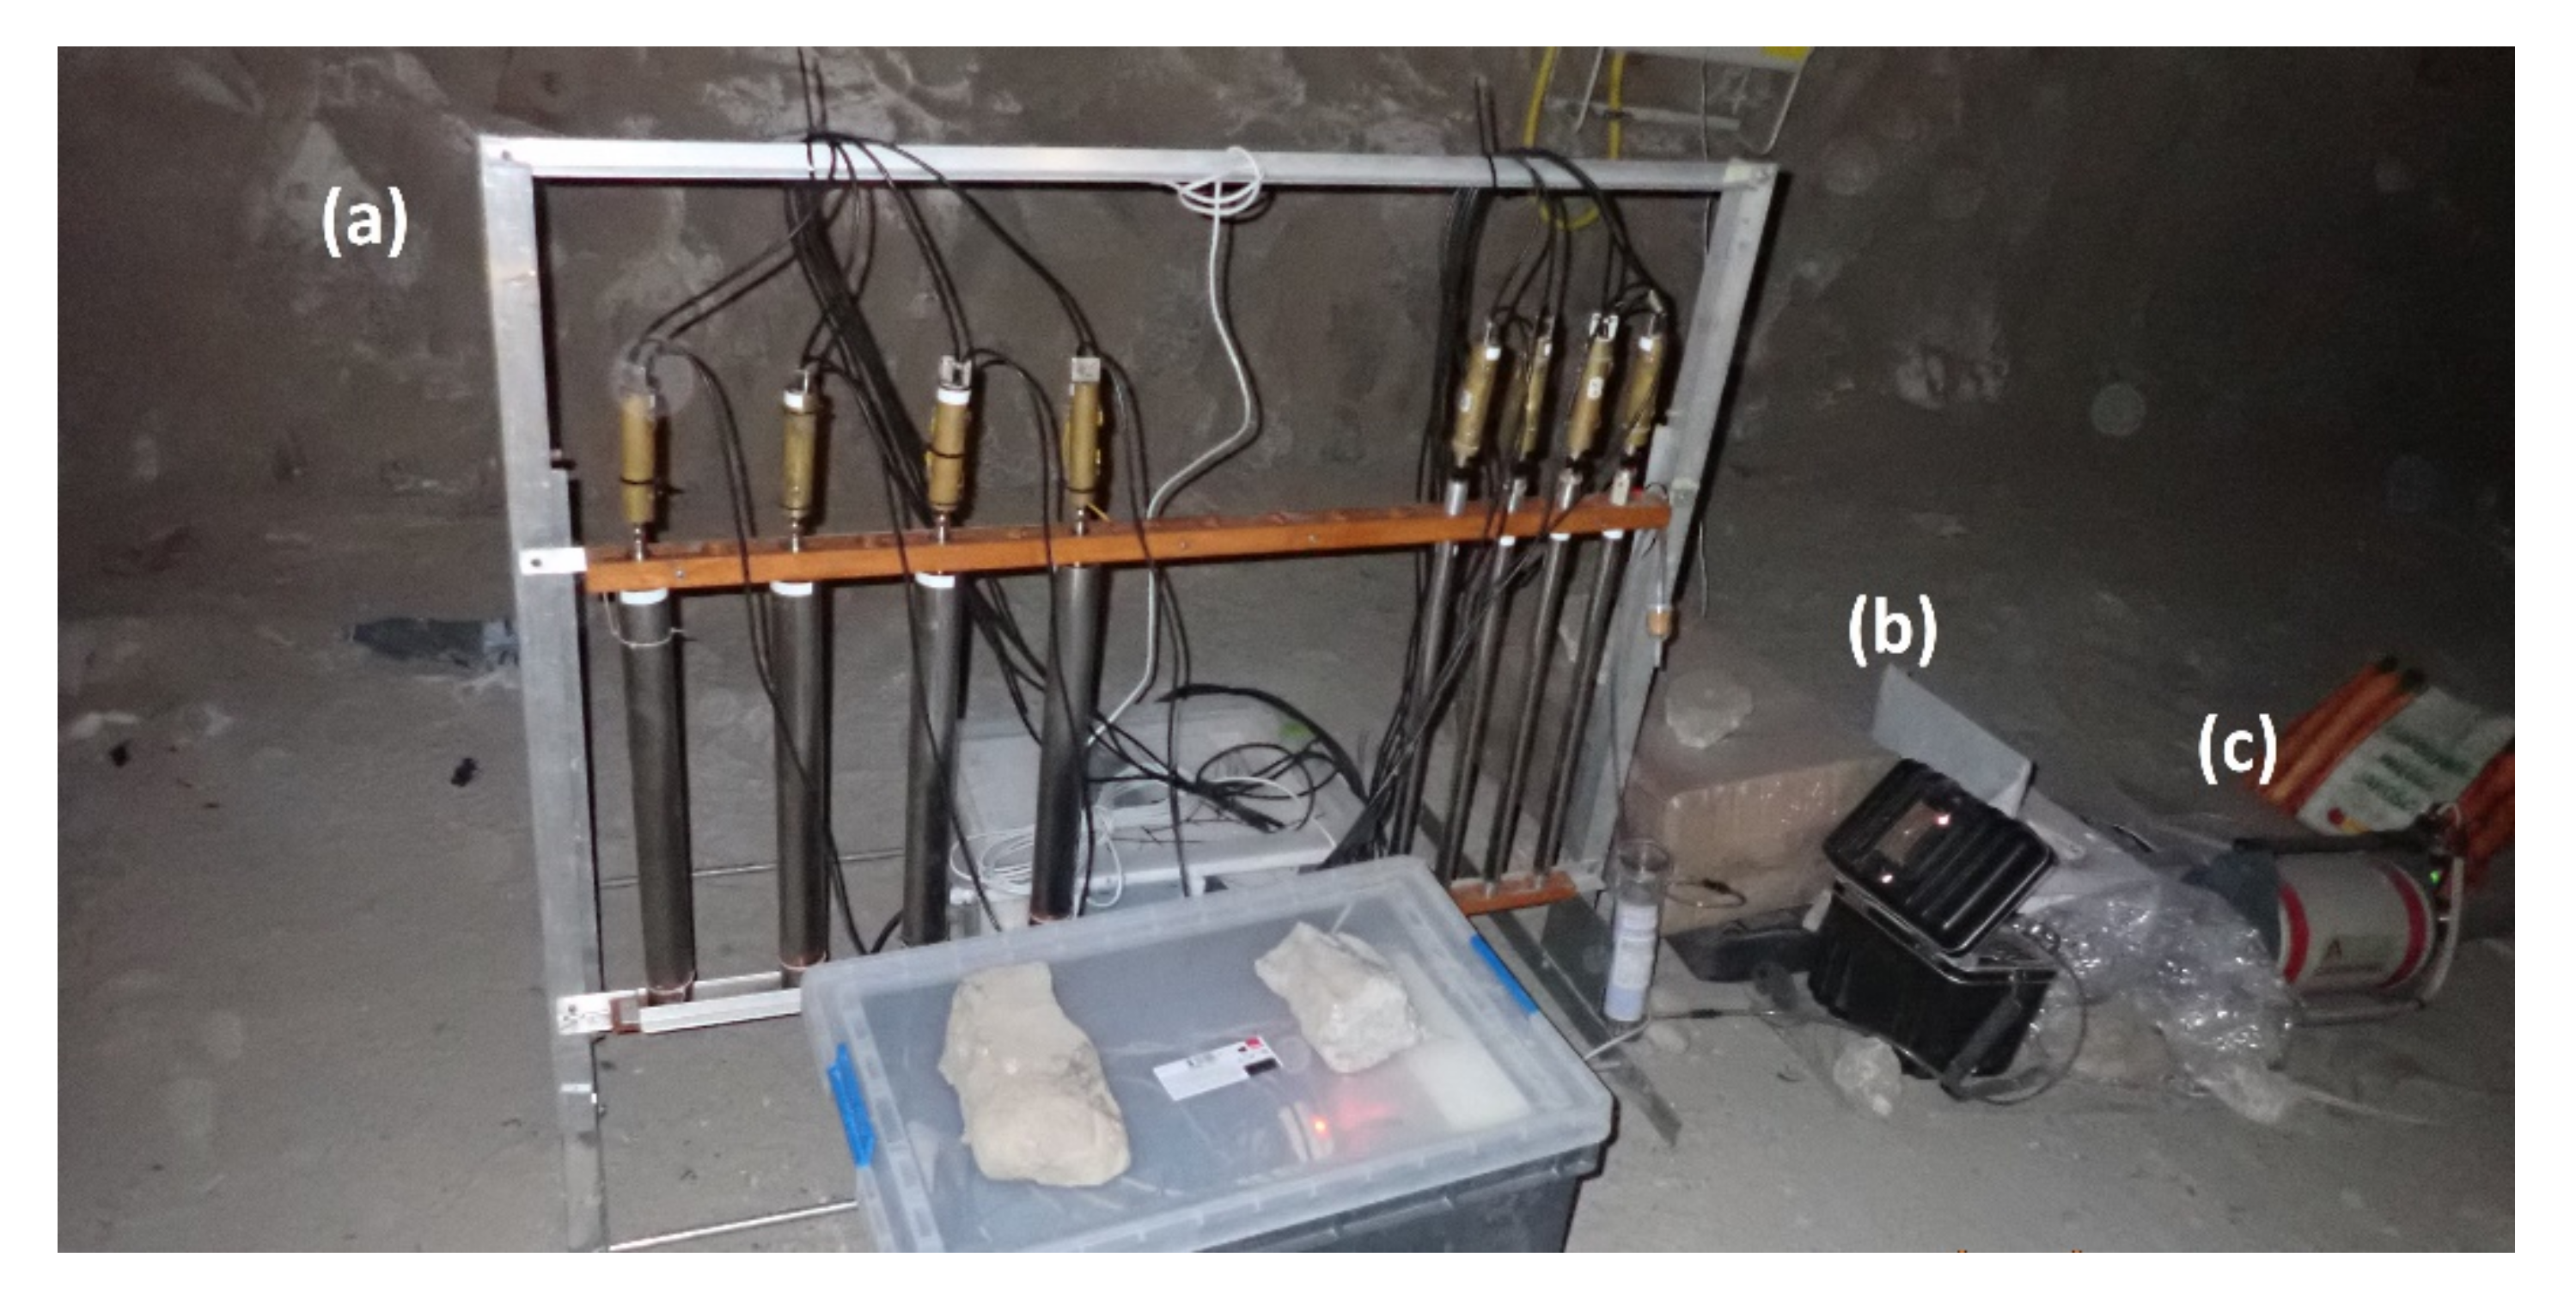
In situ gamma measurements were performed in excavation No. 3 in the vicinity of the SW-1 shaft (at a depth of 1014.4 m). Detectors were installed side by side at 85 m excavation No 3, 3.62 m high and 4.52 m wide, covered with anhydrite (
Figure 1). In situ measurements were performed using a high-purity germanium (HPGe) semiconductor spectrometer, an RAD7 electronic radon detector (Durridge Company, Inc.), and neutron helium proportional counters (
Figure 2). Additionally, seven rock samples were collected from the investigated location for more detailed natural radioactivity measurements. These measurements were performed in the August Chełkowski Institute of Physics, University of Silesia in Katowice, using alpha and gamma spectrometry techniques. Rock samples for laboratory analysis were collected directly from the walls of various parts of the mining gallery, where in situ measurements were carried out.
2.1. In Situ Gamma Spectrometry
A portable spectrometer setup (Canberra Industries, Inc., Meriden, CT, USA) consisting of a high-purity germanium detector with reverse electrodes (REGe) and a 0.6 mm thick carbon-composite entrance window connected via a multichannel analyser InSpector 2000 to a PC software GennieTM 2000 v.3.2.1, was used for in situ acquisition of gamma-ray spectra. The detector’s active volume was placed about 30 cm above the ground and about 2.2 m away from the side walls. The detector is liquid nitrogen cooled, has 40% nominal efficiency, 2.1 keV FWHM at 1.33 MeV 60Co line, and a peak-to-Compton ratio of 57/1. The measuring energy was established in the range 10–3100 keV using a spectrometric gain of 2.5.
Registered spectra were analyzed using GennieTM 2000 v.3.2.1 software in terms of radioisotopes identification based on peak energy and peak area determination. Energy calibration was conducted based on a well-known natural background radiation spectrum measured in laboratory conditions, which was assumed to be qualitatively similar to the one at the experimental site. The area under each peak of the spectrum was determined using the automated sequence of analysis involving unidentified second differential and non-linear LSQ fit available in GenieTM 2000 software. Each peak area result was reported with a relative uncertainty.
A spectrum registered in situ conditions enables the assessment of several quantities descriptive for the radiation hazard at the measurement point and its vicinity, provided that the proper calibrations and characterizations are accessible for the special equipment as well as for the measurement site.
The estimation of gamma-ray flux, apparent radioactivity (as seen by on-site detector, in contrast to laboratory radiochemical analysis of activity concentration in rock samples), or effective dose rate at a measurement point requires detection efficiency calibration. This is usually done experimentally when the experimental geometry can be recreated in laboratory conditions using calibration sources or computationally using efficiency modeling in dedicated software that uses detector characterization (established using Monte Carlo simulations) delivered by the manufacturer.
In the presented study, the efficiency curve for the HPGe detector was obtained in ISOCSTM software (Canberra Inc., Meriden, CT, USA) using geometry modeled in Geometry Composer software (Canberra Industries, Inc., Meriden, CT, USA). For the horizontal orientation of a spectrometer, the geometry for efficiency calibration was based on room/box with internal surface contamination (the best match for measurement geometry from the templates provided by the software producer) with dimensions of excavation No. 3. Radioactivity was assumed to be distributed equally between 5 out of the 6 walls (the back wall was excluded as having a negligible contribution to the registered spectra).
The gamma-ray detection efficiency (ε) was described as a function of photon energy (E) by the polynomial of the fifth-degree with Equation (1), which enables the calculation of the specific efficiency for gamma lines observed at the registered spectrum.
The gamma-ray flux density (Φ) at the measuring point was determined according to Equation (2), taking into account the net area of each gamma line peaked at energy E on the registered spectrum, the detection efficiency (ε), the area of detector surface (S
Ge) and the live time (LT) of measurement.
The uncertainty of flux density accounted for the uncertainties of the peak net area and 10% accuracy of the modeled efficiency, treated as independent variables.
Based on photon flux density and taking into account the quantum efficiencies of gamma ray emission by each identified radionuclide, the apparent activity of rocks as seen by the in situ spectrometer was assessed. For each radionuclide that emits photons of more than one energy, the activity was calculated as an average over the activities determined based on the particular peaks. In this case, the uncertainty was determined as the standard deviation.
Subsequently, using photon flux-to-dose conversion coefficients, an effective dose inside excavation No. 3 (at the point of spectrometer location) was estimated. ICRP conversion coefficients [
11] for isotropic geometry of irradiation were used, interpolated with the third-degree Lagrange formula for photon energies recognized at the registered spectrum. The uncertainty of effective dose rate took into account the uncertainties of photon flux density and 10% accuracy of ICRP conversion coefficients, treated as independent variables.
2.2. In Situ Radon Measurement in Air
222Rn concentration was measured using a RAD7 portable detector (Durridge Company, Inc.). The detector was placed next to the gamma spectrometer at the center of the shaft (
Figure 2b,c). The radon concentration in air was measured using a 2-day protocol with a 1-h measurement cycle. Analysis of radon was based on an electrostatic collection of alpha-emitters with spectral analysis using a semiconductor alpha detector with 5% absolute accuracy and intrinsic background of 0.005 pCi/L (0.2 Bq/m
3). This spectrometer enables
222Rn concentration to be measured based on the installed pre-programmed setups.
2.3. α- and γ-Laboratory Spectrometry Techniques
Rock samples were taken from different parts of the gallery so that it was possible to estimate the homogeneity of the radionuclide distribution. The measurements of the concentrations of 40K, 226Ra, and 228Ra(228Ac) isotopes in the collected rock samples were performed using a low-background laboratory gamma spectrometry technique. Before the measurements, samples were adequately prepared. Rock samples were dried, crushed, ground, and placed in Marinelli beakers. Beakers then were sealed and stored for a month to allow for secular equilibrium in the thorium and uranium series. Then, the samples were measured for about 3 to 10 days, depending on the activity. The measurements of 40K, 226Ra, and 228Ra concentrations were performed using a gamma spectrometer (Mirion Technologies (Canberra), Inc., Meriden, CT, USA). This spectrometer consists of high purity germanium (HPGe) detector model: GC2018 of 60.7 mm crystal diameter and a Cryo-Pulse 5 Plus an electrically-powered cryostat (Mirion Technologies (Canberra), Inc., Meriden, CT, USA). The detector is shielded with 11 cm low-background lead from Ortec. The HPGe detector has a relative efficiency of 20%, energy resolution FWHM of 1.8 keV, and a P/C ratio of 50:1 at a 1.33 MeV 60Co gamma line. The energy calibration and radioactivity concentrations were calculated based on a standard prepared from the certified materials obtained from the Central Laboratory for Radiological Protection in Poland. The acquisition and analysis of the spectra were performed with the use of Genie 2000™ software v.3.4.1.
The concentration of 40K isotope in rock samples was calculated based on the 1460.8 keV gamma line. The concentration of 228Ra was calculated based on the 911.1 keV gamma line originating from 228Ac. The 226Ra concentration in collected samples was calculated as the weighted mean of the activities of 214Pb (295.2, 351.9 keV) and 214Bi (609.3, 1120.3 keV).
The uncertainty of the final activities, especially for low radioactive samples, reached a value of 20%. For each analyzed isotope, the corresponding uncertainty was calculated as the square root of the sum of uncertainties in all quantities in the quadrate. The uncertainty of the weighted mean of 226Ra isotope was calculated as the reciprocal square root of the sum of all individual weights.
All samples were also analyzed for the presence of uranium radioisotopes (234,238U). For this purpose, sub-samples weighing about 1–2 g were prepared for alpha spectrometry measurements. Before the measurements, rock samples were digested in a PTFE pressure decomposition vessel using a microwave unit MAGNUM II (ERTEC, Poland). In order to calculate the 234,238U concentrations and determine the chemical efficiency, a 232U isotope was added to each sample. The wet-mineralization of the collected rock samples was performed using hot acids: HF, HNO3, HCl with H3BO3. Then, uranium was pre-concentrated with iron and co-precipitated with ammonia at pH 9. Uranium was separated from other alpha emitters using the anion exchange resin Dowex 1 × 8 (Cl−—type, 200–400 mesh). Then, a thin α spectrometry source was prepared from the uranium fraction by coprecipitation with NdF3 and filtration. The measurements of 234,238U concentrations were performed with the use of 7401VR (Canberra–Packard) and Alpha Analyst™ (Mirion Technologies (Canberra), Inc., USA) alpha spectrometers equipped with passivated implanted planar silicon (PIPS) detectors. The minimum detectable activity (MDA) was equal to 0.4 mBq/L for both 234,238U isotopes and measurement lasted two days. The spike sample was prepared based on distilled water of a volume of 0.5 L.
2.4. Neutron Flux Measurements
The neutron background measurements were made using helium counters, i.e., gas proportional counters filled with helium-3 (
3He). In this type of detector, neutrons are captured by the helium nucleus in the reaction (3) and the charged products (proton and tritium) of the reaction appear with kinetic energy of 764 keV. These products ionize so that they can be detected by a proportional counter like standard radiation. This method is sensitive only for thermal neutrons (energy ~ 0.02 eV). As the energy of these neutrons is negligible compared to the heat of the reaction (764 keV), neutron registrations form a very characteristic “peak and tail” amplitude spectrum. This allows neutron events to be distinguished even with a large background of other types of radiation.
The determination of the neutron flux requires the use of the Monte Carlo simulation. The simulations were carried out using the Geant4 package version 10.07 using the physical package QGSP_BERT_HP and NeutronHPThermalScattering, which is essential for low-energy neutron interactions with nucleons bound in nuclei. In this simulation, the helium counter tray model was placed in the center of an empty sphere with a diameter of 3 m. Each point at the sphere surface was an isotropic source of thermal neutrons. We evaluated the expected count probability per emitted neutron by each detector. There is an analytical formula for the evaluation of the isotropic neutron flux in the center of the sphere as a function of emitted neutron rate and sphere radius. Then, the ratio of the simulated counters counting rate to the simulated neutron flux was determined. Knowing this ratio and the measured counting rate one can determine the neutron flux at the measurement site.
3. Results and Discussion
3.1. Analysis of the Gamma-Rray Spectrum
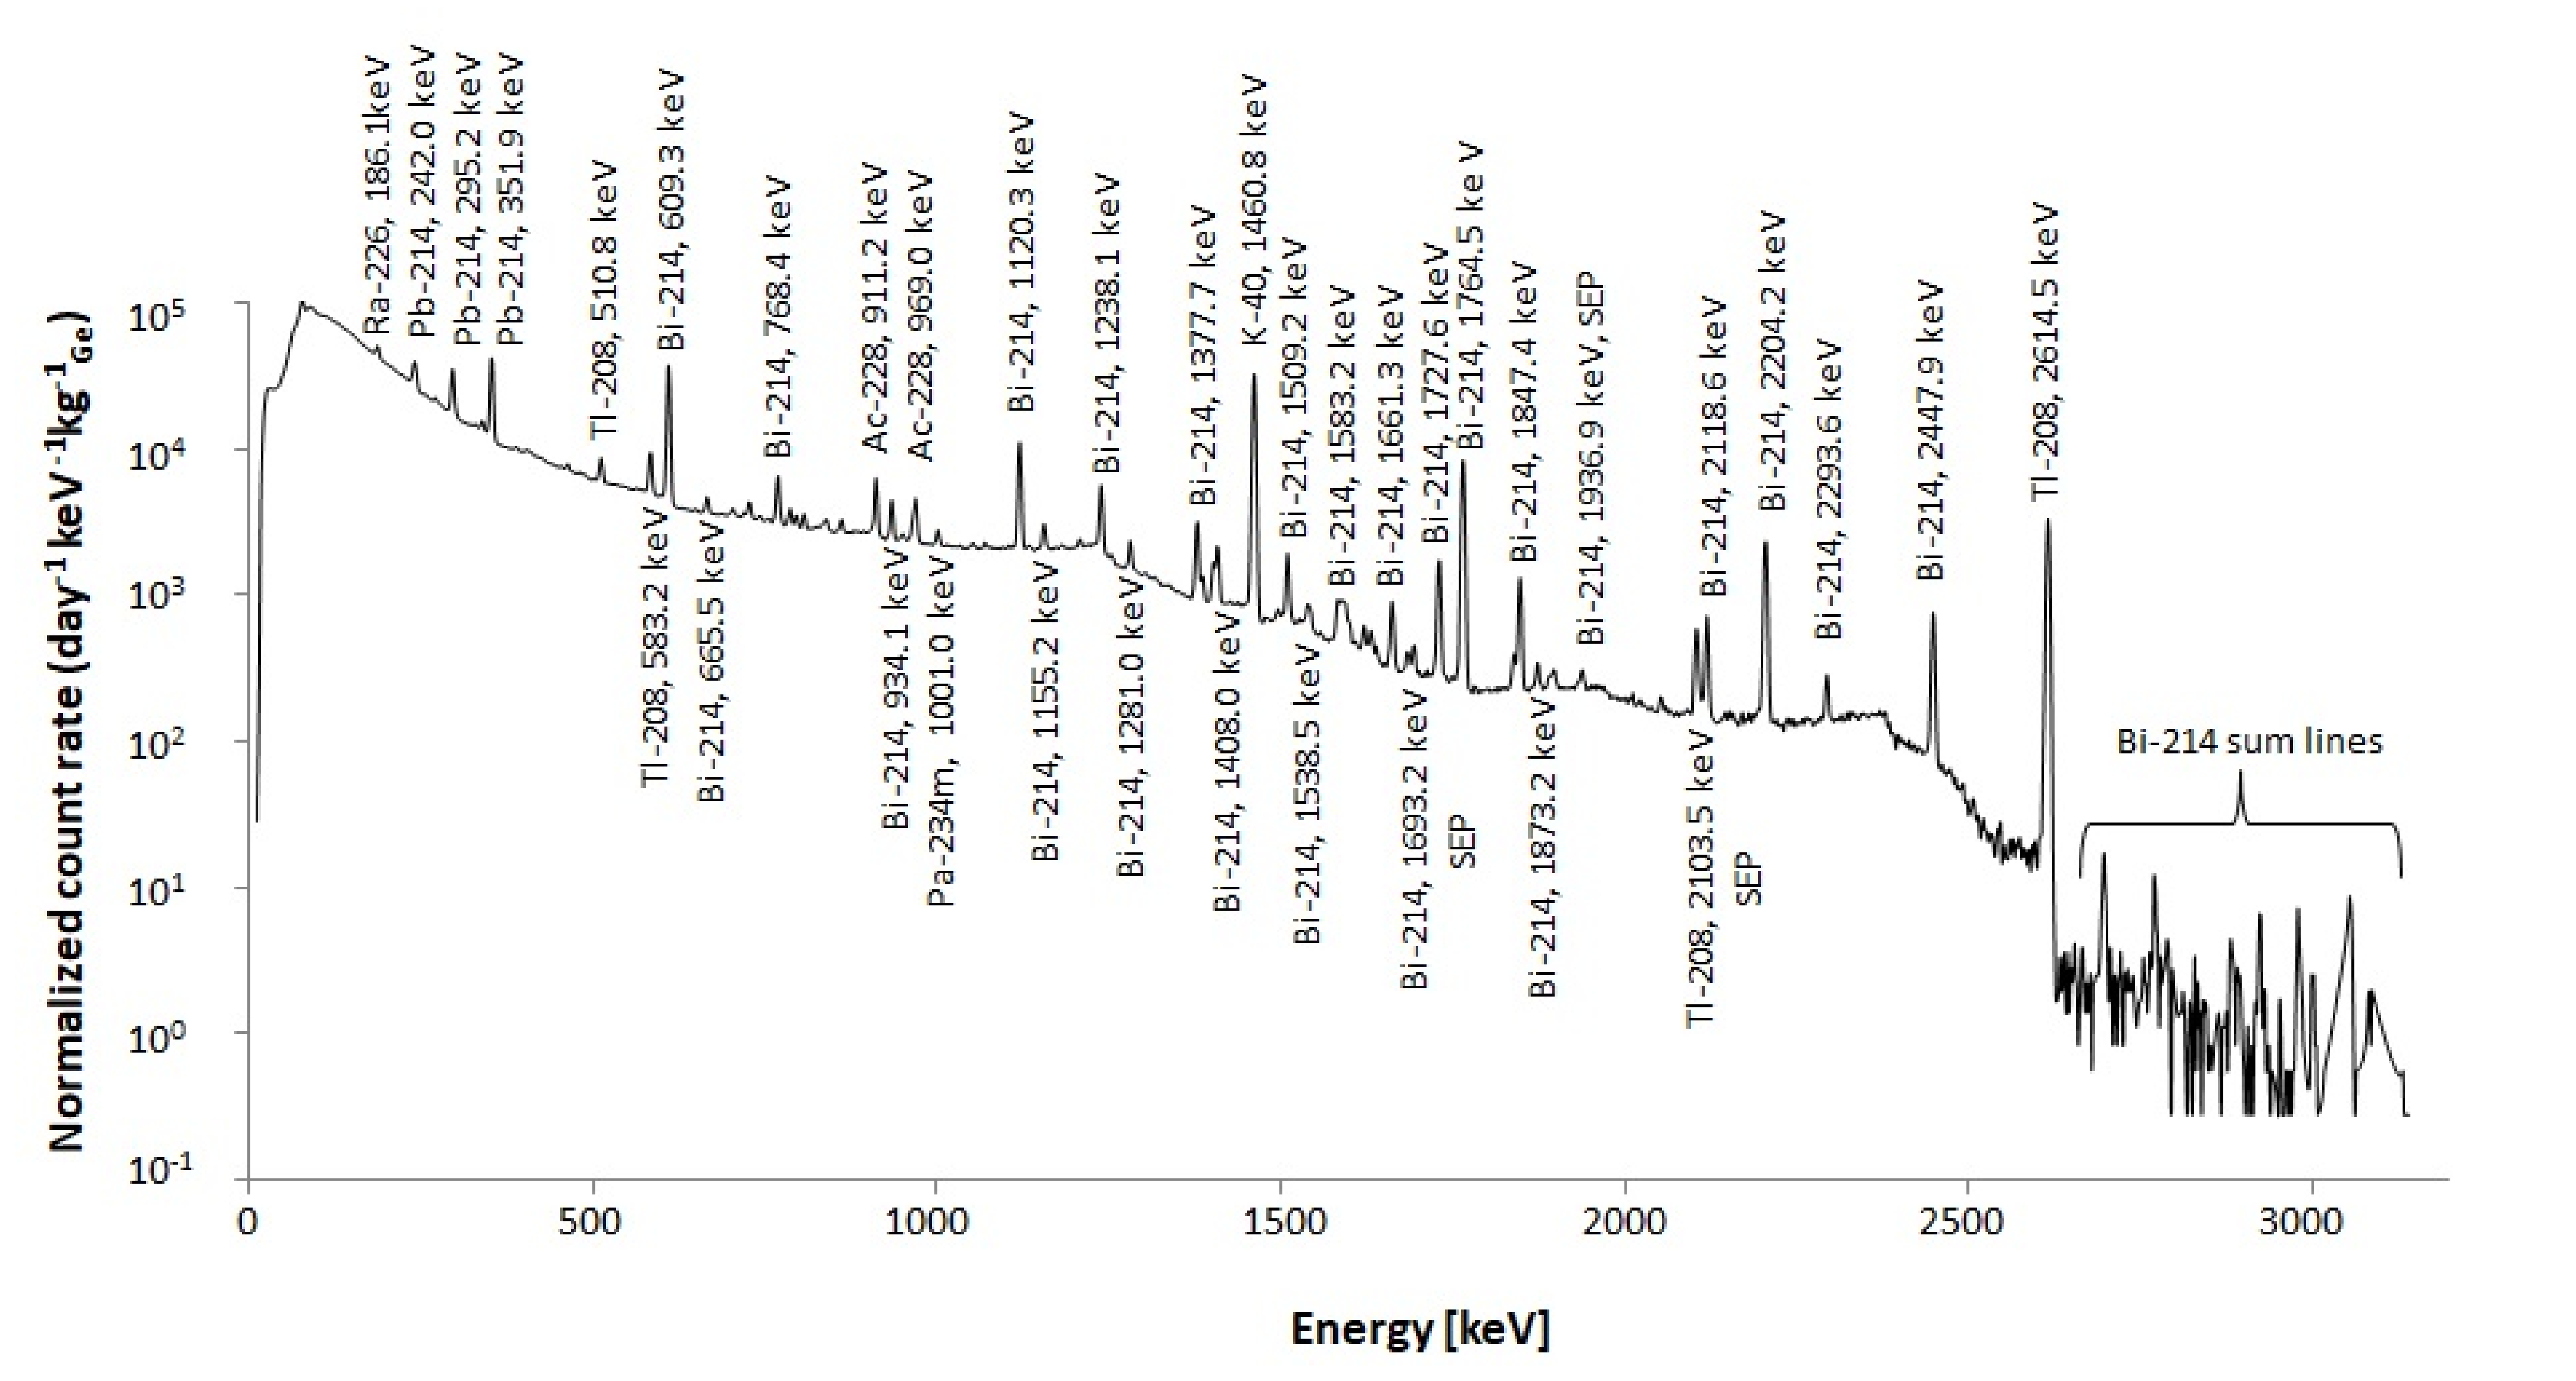
The gamma-ray spectrum registered in situ for 24 h inside excavation No. 3 near the SW-1 shaft of the Polkowice-Sieroszowice copper mine is shown in
Figure 3. The spectrum presented in terms of count rate normalized to the day, energy (keV), and mass of germanium crystal (kg
Ge) allows comparison the level of radioactivity with other underground locations. The comparison of the counts’ rate [s
−1] in various underground laboratories is presented in
Table 1.
The collective analysis of particular radionuclide contribution to apparent activity and effective dose rate is presented in
Table 2. Total effective dose rate in the studied location was equal to 0.008 ± 0.001 μSv/h (2.3 ± 0.3 pSv/s). The photon flux density is equal to 0.64 ± 0.20 cm
−2 s
−1, whereas the spectrum continuum amounts to 4.94 ± 0.77 cm
−2 s
−1.
Photon flux densities for deep underground localizations are typically of the order of 1 cm
−2 s
−1[
2]. Data from 0.25 to 2.16 cm
−2 s
−1 are reported for existing underground laboratories [
13]. In the previously studied localization in the salt layer (930 m below the ground) of the Polkowice-Sieroszowice copper mine the value of 0.124 ± 0.002 cm
−2 s
−1 was obtained for photon flux density, and 0.18 ± 0.05 cm
−2 s
−1 for spectrum continuum [
6].
The results of effective dose rate obtained with the same methodology and spectrometry system in other underground localizations show a higher radiation hazard at a depth of 1436 m within the volcanogenic sulphide deposit of Pyhäsalmi mine (Callio Lab, Finland)—0.158 ± 0.029 μSv/h [
13], as well as at a depth of 150 m within the gneiss formation of the Reiche Zeche shaft of TUBAF (Germany)—0.036 ± 0.008 μSv/h [
12]. This suggests that the excavation within the anhydrite formation in the Polkowice-Sieroszowice copper mine is low-background localization with restricted radiation hazard. However, results published in 2010 [
5] show an even lower gamma radiation dose within the salt excavation of the Polkowice-Sieroszowice mine, i.e., 0.002 μSv/h. Nevertheless, among non-salt localizations, the result of 8 nSv/h is about 2–3 times lower than results obtained in the calcschist rock in LSM Modane—20 nSv/h [
3], or in marble rock of Jinping—23 nSv/h [
14]. UNSCEAR reported the average effective dose of 0.41 mSv/year (47 nSv/h) from indoor exposure to gamma radiation originating in construction materials [
15].
The radioactivity level of thorium series radionuclides is lower than the radioactivity of uranium series radioisotopes, as shown in
Table 2. From the first one, only
208Tl and
228Ac are visible on the spectrum and peaks from
212Bi and
212Pb are absent. A relatively high concentration of uranium series nuclides is seen in the spectrum by the intensity of
214Bi lines, including escape peaks, summation peaks, and characteristic X-rays.
3.2. The Ratio of K-40/Bi-214
The most visible on the registered spectrum of natural background radiation among the uranium series radioisotopes is 214Bi. Moreover, it is one of radon’s daughters. Therefore its activity in the experimental site is connected with uranium concentration in the surrounding rock and radon generation. On the contrary, potassium 40K is only incorporated in the rock material in the underground location. Therefore, the ratio of count rates under the lines 1460.8 keV (40K) and 1764.5 keV (214Bi) could characterize the radiation environment and distinguish between deep and shallow underground localizations.
40K/
214Bi cps ratio in the studied location equals 3.8, which is consistent with the results for deep localizations, according to suggestions made previously [
12,
13]. A summary of the
40K/
214Bi cps ratio for selected localizations is presented in
Table 3.
3.3. Radon Concentration in Air
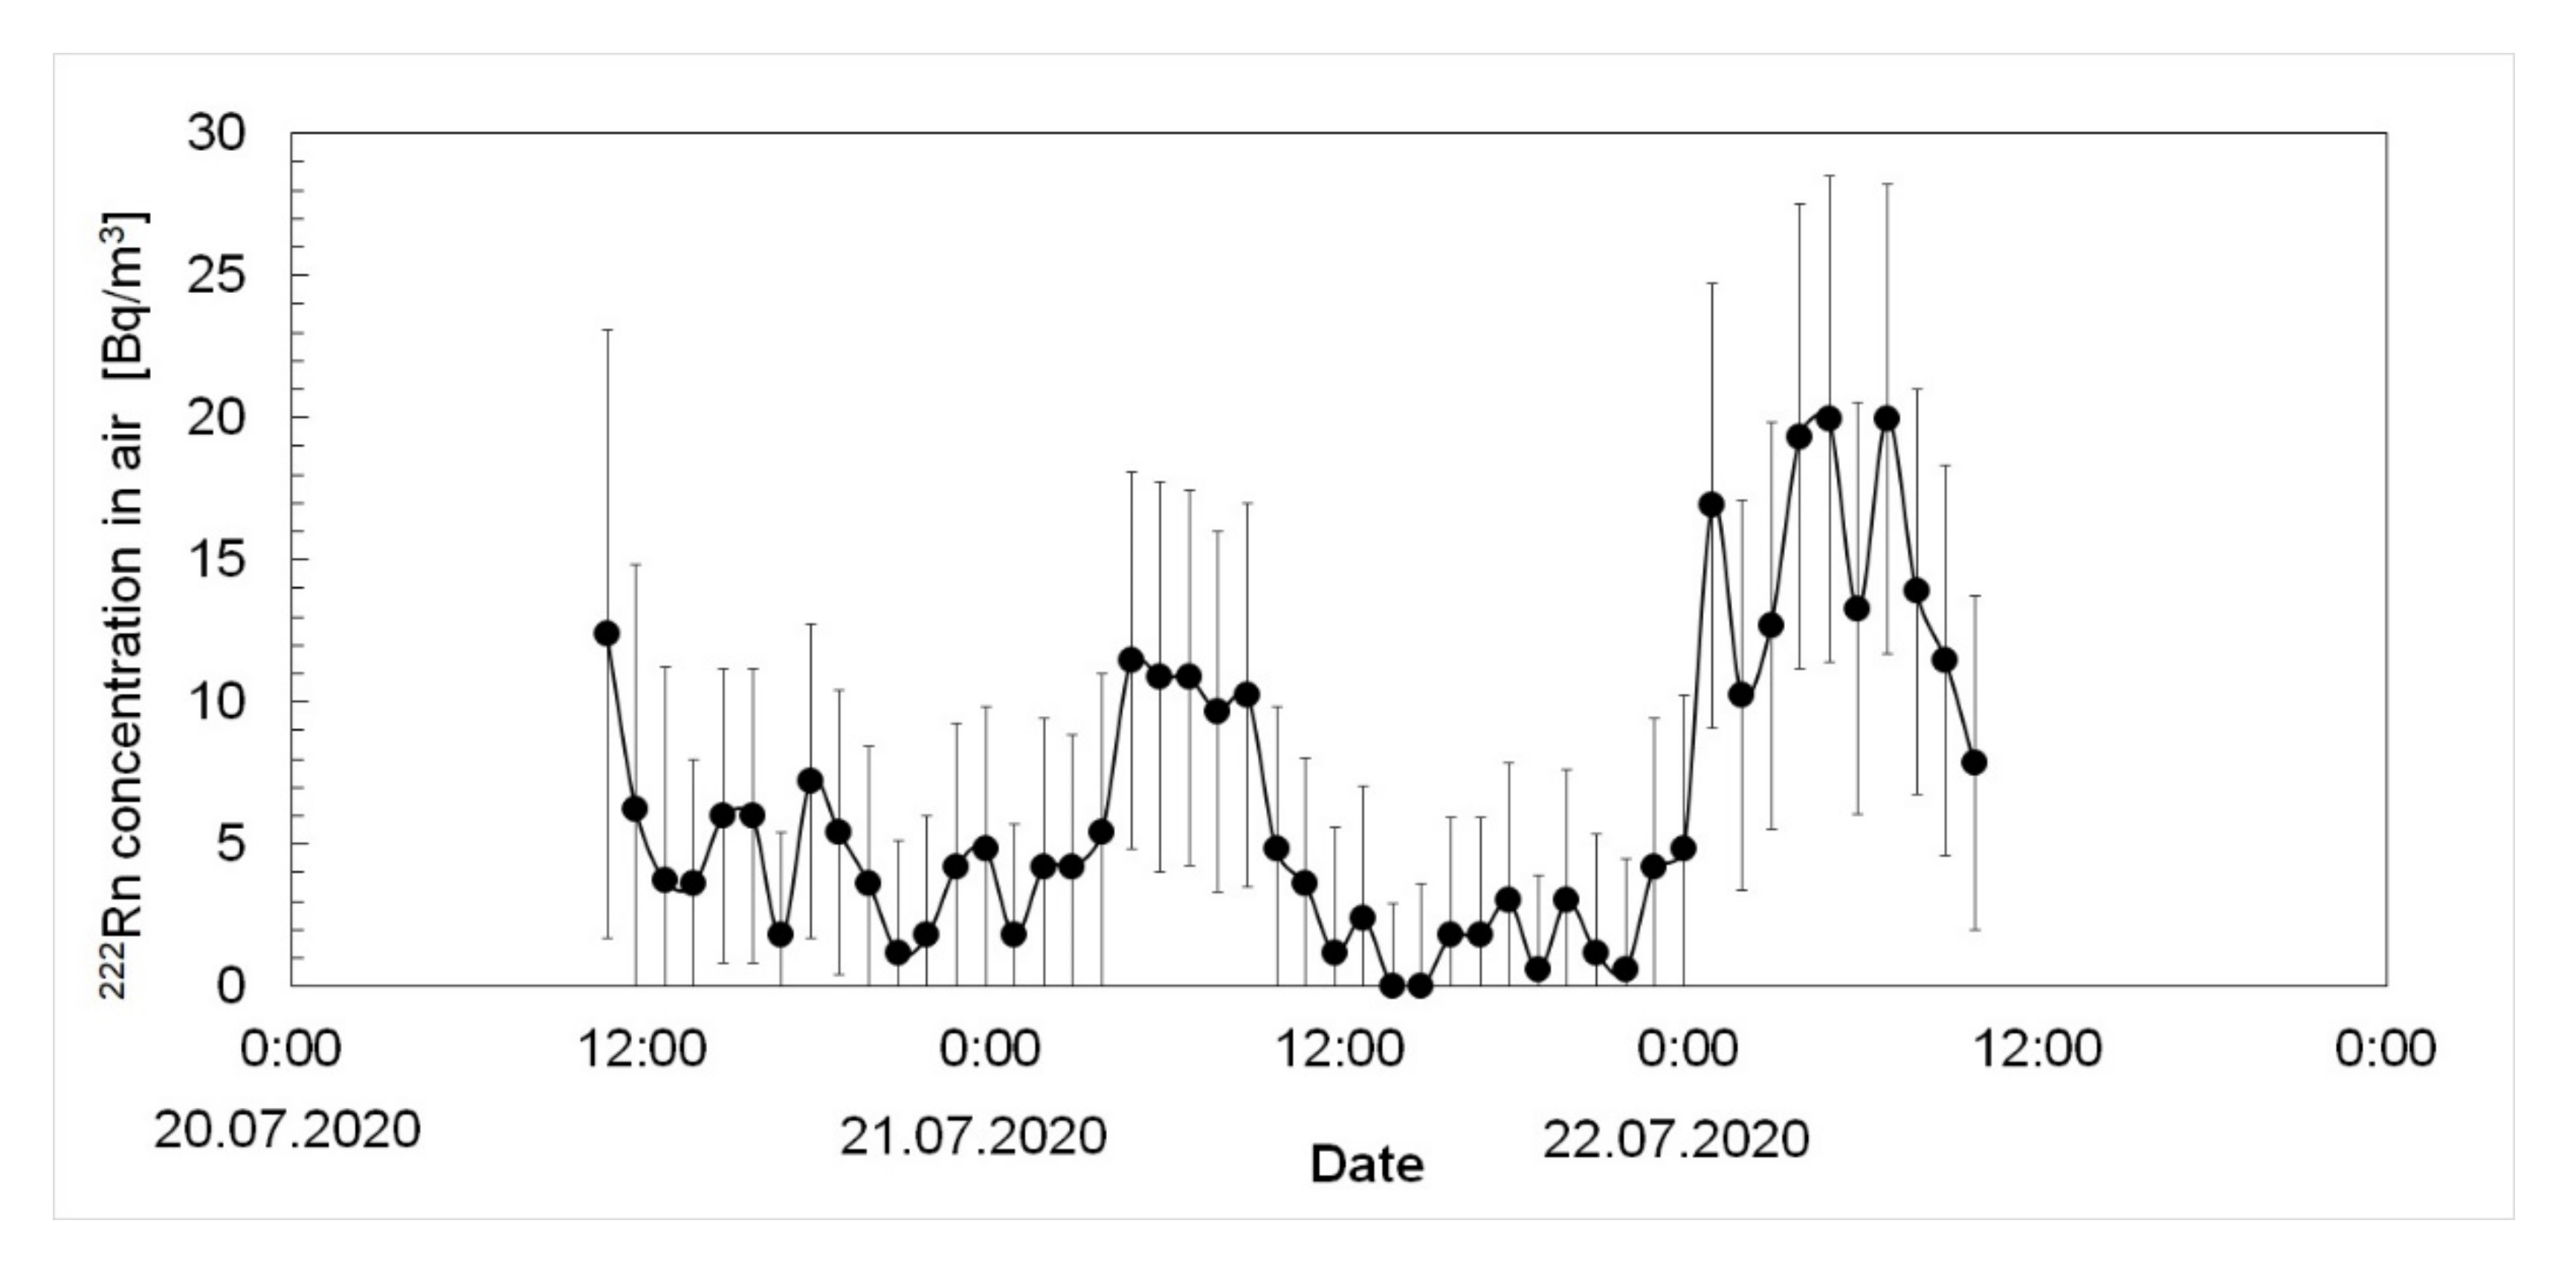
Radon
222Rn concentration monitoring was conducted from 20 July to 22 July 2020, in the range of 0.6–20.0 Bq/m
3 with an average value of 6.6 Bq/m
3 and a median of 4.8 Bq/m
3. Relatively high uncertainties accompany such small values (
Figure 4).
The radon concentration in the air in underground locations may vary by several orders of magnitude. The radon concentration is also influenced by humidity, temperature difference, and pressure between the surface and the underground site. The measured value of radon concentration in the air in the investigated location is relatively low compared to other European underground laboratories. The values of radon concentrations in the largest European underground laboratories are 3 Bq/m
3, 15 Bq/m
3 [
4], 80 Bq/m
3 [
3], and 120 Bq/m
3 [
4] for Boulby (UK), Modane (France), Canfrac (Spain), Gran Sasso (Italy) respectively with ventilation. An average value of 28.2 Bq/m
3 was measured in another location of the Polkowice-Sieroszowice mine in 2010 [
5]. For comparison, the concentration of radon in the air measured near the SW-1 Mining shaft is over 30 times lower than the radon concentration measured at Callio Lab (Finland), which was 213.3 Bq/m
3 [
13], and over 115 times lower than the concentration measured at the Reiche Zeche mine (Germany), which was 805.1 Bq/m
3 [
12].
3.4. Radioactivity Content in Rocks
The radium, potassium, and uranium radioisotope concentrations in rock samples were measured using alpha and gamma spectroscopy. The analyzed samples are characterized by low activity concentrations of the analyzed isotopes. The 226Ra concentrations ranged from 0.63 ± 0.03 Bq/kg to 21.1 ± 0.7 Bq/kg with the mean equal to 7.2 Bq/kg and the median equal to 1.1 Bq/kg. The values of 228Ra and 40K concentrations were in the range from 0.19 ± 0.03 Bq/kg to 0.60 ± 0.10 Bq/kg (mean: 0.3 Bq/kg, median: 0.2 Bq/kg) and from 6.1 ± 0.2 Bq/kg to 15.4 ± 0.3 Bq/kg (mean: 9.4 Bq/kg, median: 8.6 Bq/kg), respectively. The 238U and 234U concentrations were in the range: 0.82 ± 0.08 Bq/kg–24.37 ± 0.73 Bq/kg (mean: 8.8 Bq/kg, median: 1.6 Bq/kg) and 0.84 ± 0.08 Bq/kg–24.75 ± 0.74 Bq/kg (mean: 8.7 Bq/kg, median: 1.5 Bq/kg), respectively. The uranium content, calculated based on 238U activity, ranged from 0.07 ± 0.01 ppm to 1.97 ± 0.06 ppm. The analyzed samples showed a radioactive equilibrium between 234U and 238U isotopes. The mean and the median value of the 234U/238U activity ratios in the analyzed samples was equal to 1.0. All the samples exhibited lower values of 226Ra compared to parent isotope 238U and the 226Ra/238U activity ratio varied in a range from 0.68 ± 0.04 to 0.87 ± 0.04 with the median equal to 0.76.
For comparison, the
40K concentration values in rock samples from Lab 2 of Callio Lab (Finland), for which similar measurements were performed, were in the range from 104 ± 10 Bq/kg to 1136 ± 47 Bq/kg [
13] (concentration varied greatly depending on the place of sample collection). For the rock sample from the Reiche Zeche mine (Germany), the concentration of
40K was equal to 1049 ± 17 Bq/kg [
12]. However, for the
226Ra isotope, the concentration values in the rock samples from Lab 2 from Callio Lab ranged from 8.1 ± 0.4 to 188.2 ± 5.1 Bq/kg [
13], while for the rock sample from the Reiche Zeche mine it was equal to 43.8 ± 0.4 Bq/kg [
12]. In other European underground laboratories, the
40K values differ significantly. For example, in Boulby (UK), the measured concentration of
40K was equal to 11 ± 1 Bq/kg in halite, while in mudstone it was equal to 120 ± 2 Bq/kg [
16]. In contrast, in San Grasso (Italy), 26 ± 2 Bq/kg was measured for dolomitic limestone [
17], and in Modane (France), 213 ± 30 Bq/kg was measured in a rock sample [
18]. On the other hand, the concentration of
40K isotope in an anhydrite sample collected from another location in the Polkowice-Sieroszowice mine in 2010 was lower than the detection limit [
5]. Moreover, this sample showed a low concentration of
238U isotope (0.82 ± 0.09 Bq/kg). Previous studies [
5] of radionuclide content in anhydrite samples also exhibited higher values of daughter isotope
230Th than
238U.
3.5. Qualitative Neutron Activation Analysis
For a more in depth analysis of the site where in situ measurements were made, the rock sample’s neutron activation from the location studied was carried out. This study aimed to assess the effect of neutron flux on the production of potential neutron-induced radionuclides. Radioisotopes could be activated if the neutron flux was more intense and could affect the gamma energy spectrum and contribute to radiation hazards at this location. A rock sample was irradiated with a neutron flux from a 252Cf source for 45 days.
Immediately after the neutron activation of the rock sample, the gamma radiation spectrum was registered using the HPGe detector described in
Section 2.3. Several series of measurements were performed for the qualitative analysis of trace elements. First, short measurements were made to record spectral lines emitted by short-lived isotopes, while longer measurements made it possible to detect long-lived radionuclides. Such analysis allows short- and long-lived radioisotopes to be registered with a different quantum efficiency of spectral lines and to avoid overlapping spectral lines during more extended measurements by the spectral continuum from natural background radiation.
In the activated sample, two radioisotopes were recorded on the gamma radiation spectrum, formed on the rock’s impurities due to the reaction (n, γ). They were
24Na (1368.6 keV (100%)) and
56Mn (846.8 keV (98.9%)) [
19]. Based on the activated rock sample’s recorded spectra, it was estimated that the count rate ratio of
24Na/
56Mn was 2 to 4, depending on the spectral counting statistics. Considering the differences in the half-lives of both isotopes, this suggests a much higher sodium concentration in the activated rock than manganese concentration. Sodium and manganese have one stable isotope each:
23Na and
55Mn and are characterized by a high thermal neutron capture cross-section [
19] of 0.530 b and 13.3 b, respectively. This is important from the underground site’s point of view because the neutron thermal flux is the main component of the neutron flux deep into the location. Therefore, activated radionuclides could increase the radiation background there.
3.6. Neutron Flux Results
Data was collected for approximately four days (20–23 July 2020). We used two kinds of helium detectors: 2 inches in diameter, 50 cm long tubes with 2 atm of
3He, 0.5 atm of Argon, some CO gas, and 25-micrometer wires made by Centronic in 2008, and old thinner (1 inch), 50 cm long tubes with 4 atm of
3He and Krypton stopping gas produced by ZDAJ in 60ties. Centronic detectors were optimized to record most of the neutron counts in energies close to 764 keV (60% on average), whereas ZDAJ counters have on average 37% neutrons in the maximum energy peak. Accumulation of most neutrons in a large peak is essential for measuring a low neutron flux environment (to dominate internal alpha particle background). Results of the measurements are presented in
Table 4. Assuming that the neutron count rate is constant in time, one can fit the data and find the average rate of neutron counts per hour per single counter. The measurement described here amounted to 2.8 ± 0.2 counts/h for Centronic counters and 1.9 ± 0.2 counts/h for ZDAJ counters.
The measurement results were compared with the Monte Carlo simulation, assuming that the measurement setup was isotropically illuminated by thermal neutrons. As a result of the comparison, the neutron flux at the measurement site can be determined. It is 1.9 ± 0.2 × 10⁻⁶ cm−2 s−1 for Centronic counters and 2.2 ± 0.4 × 10⁻⁶ cm−2 s−1 for ZDAJ counters.
The obtained results are consistent within the limits of the statistical error. Therefore, their weighted average is the final result. Therefore, the thermal neutron flux in the Polkowice-Sieroszowice mine is: 2.0 ± 0.2 × 10⁻⁶ cm−2 s−1.
This result, comparing with the results of measurements carried out in other locations using a similar measurement set, is presented in
Table 5.
The neutron flux in the Polkowice-Sieroszowice mine turns out to be relatively low. Lower background conditions are only found in the Slanic salt mine (Prahowa, Romania), where the salt deposit is almost entirely devoid of natural radioactivity, and in the underground laboratory in the tunnel under the Gran Sasso mountains (LNGS Gran Sasso, Abruzzo, Italy) where neutrons are probably absorbed by the concrete tunnel cover, a meter thick and moist. Note that the excavation No 3 in the Polkowice-Sieroszowice mine is dry and devoid of a thick lining.


 ,
, 


