
Exhaustive Comparison between Linear and Nonlinear Approaches for Grid-Side Control of Wind Energy Conversion Systems

 , , ,
, , ,
Abstract
:1. Introduction
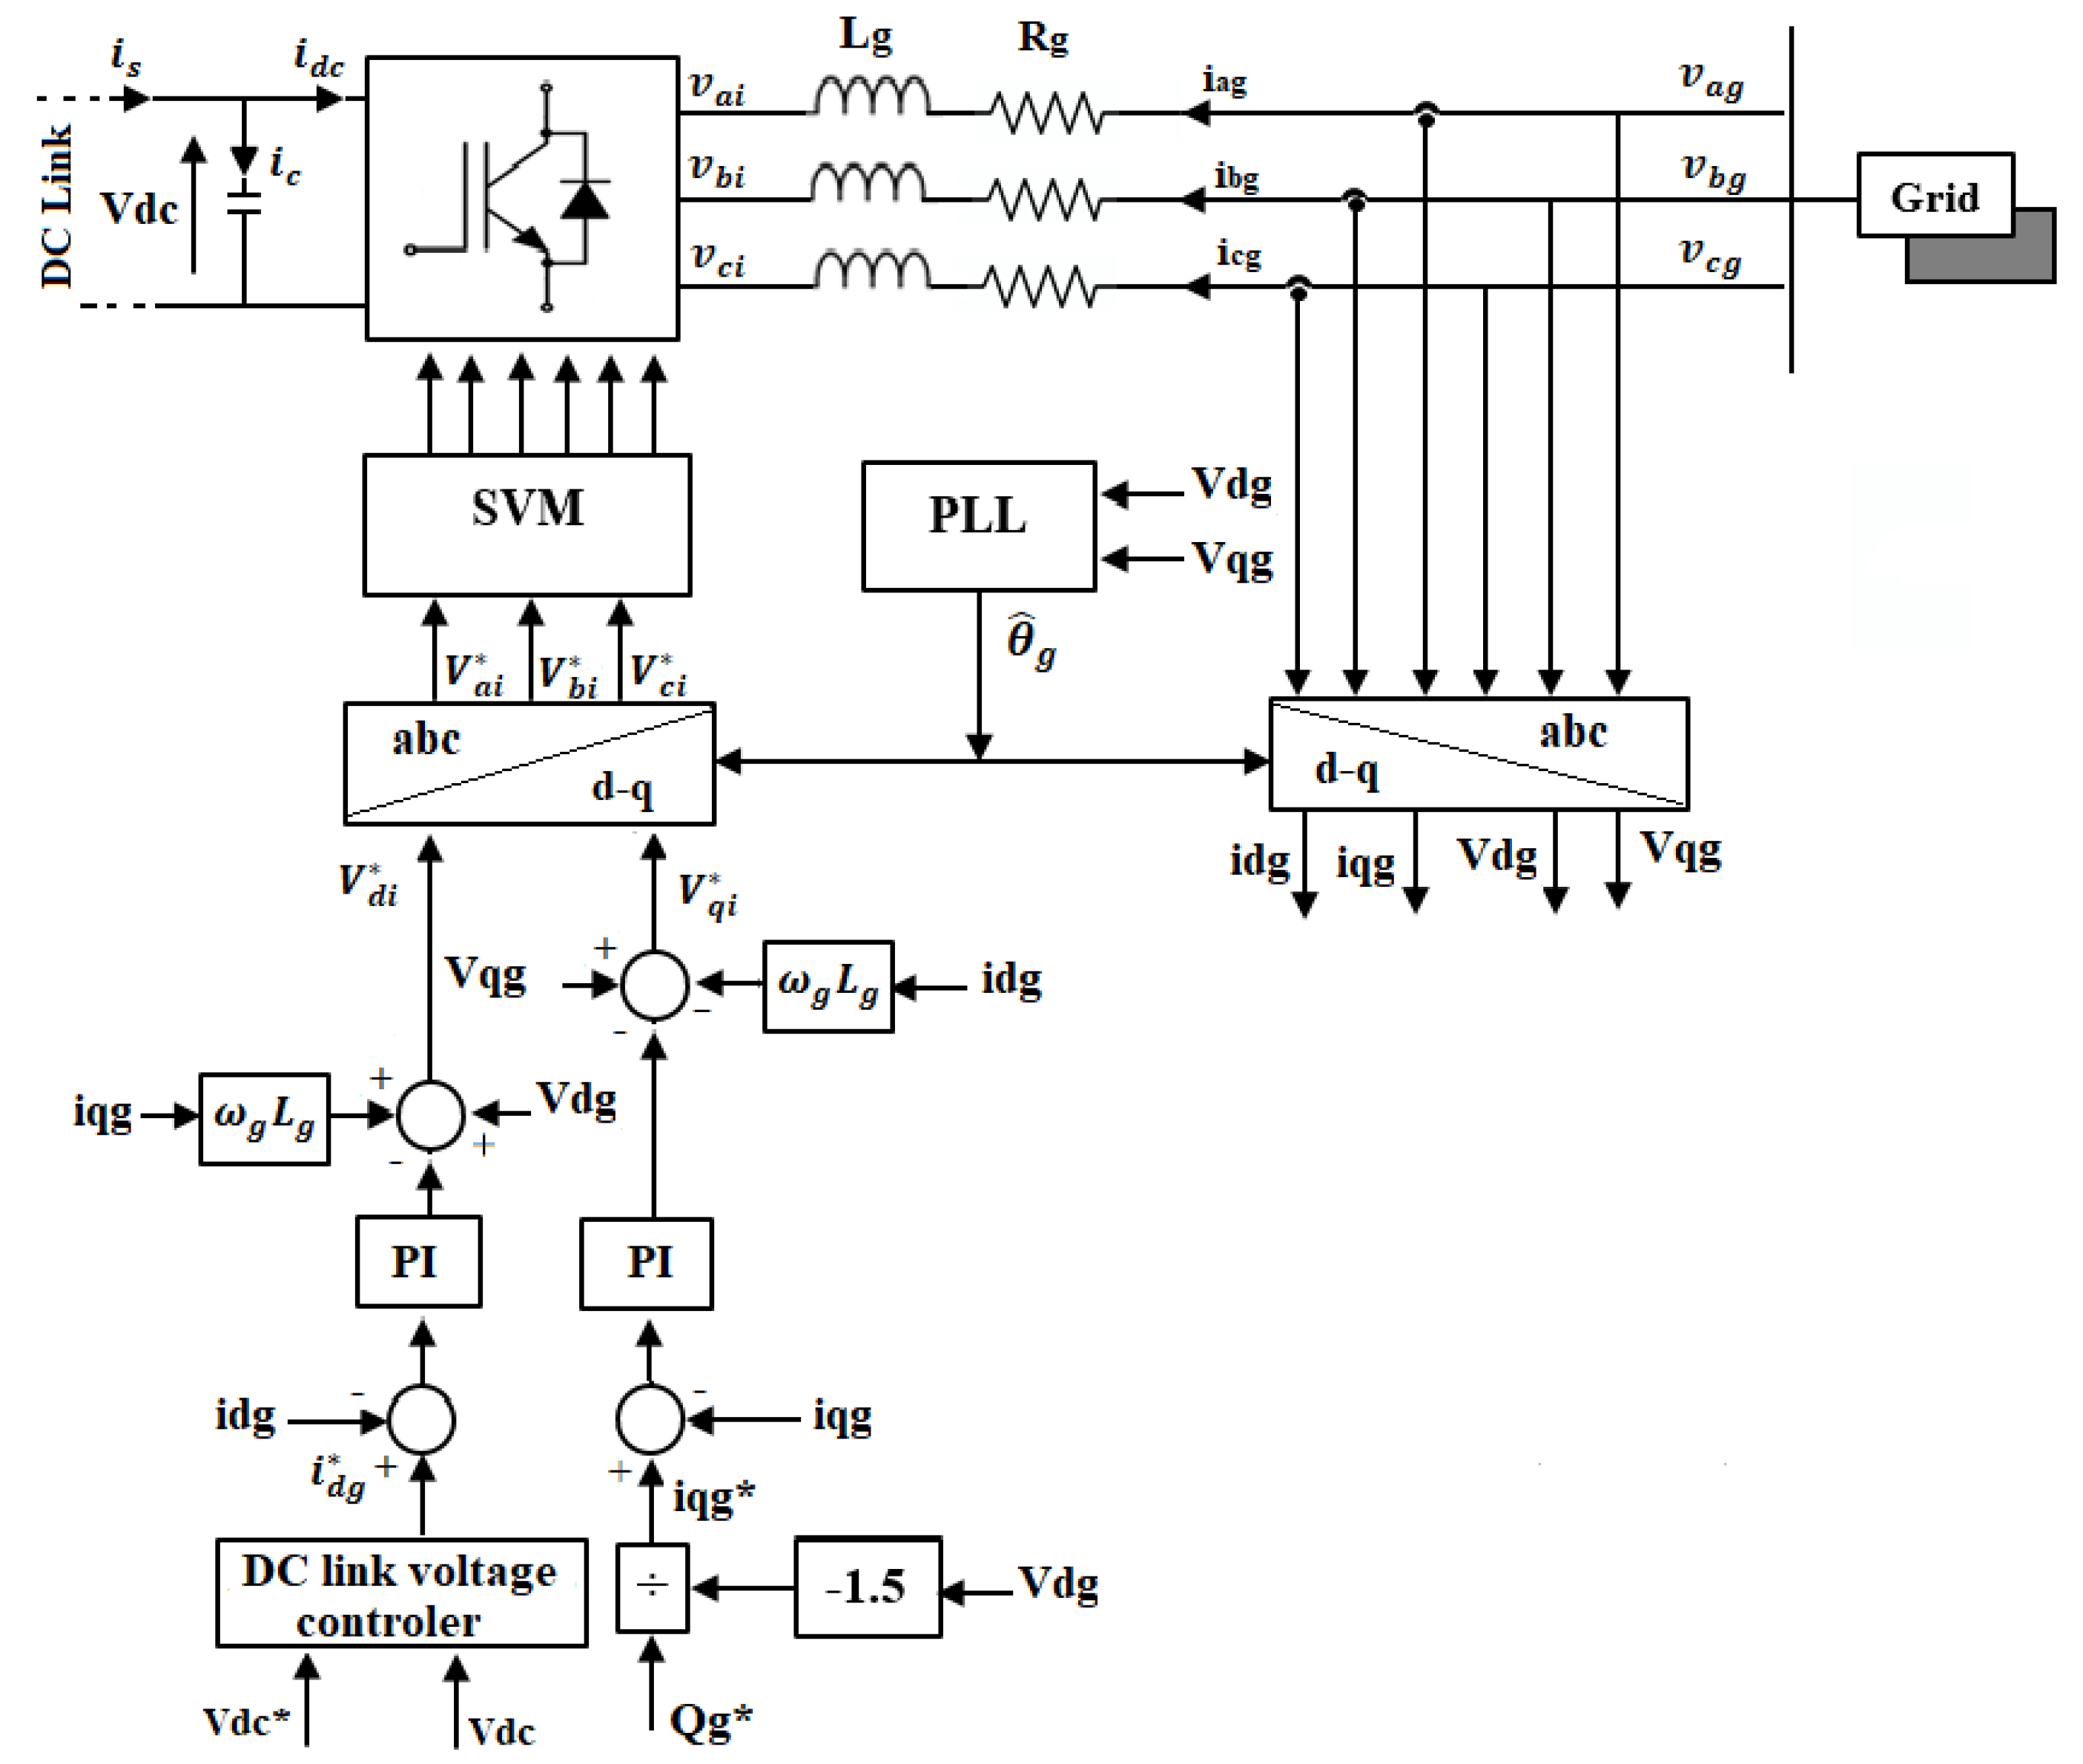
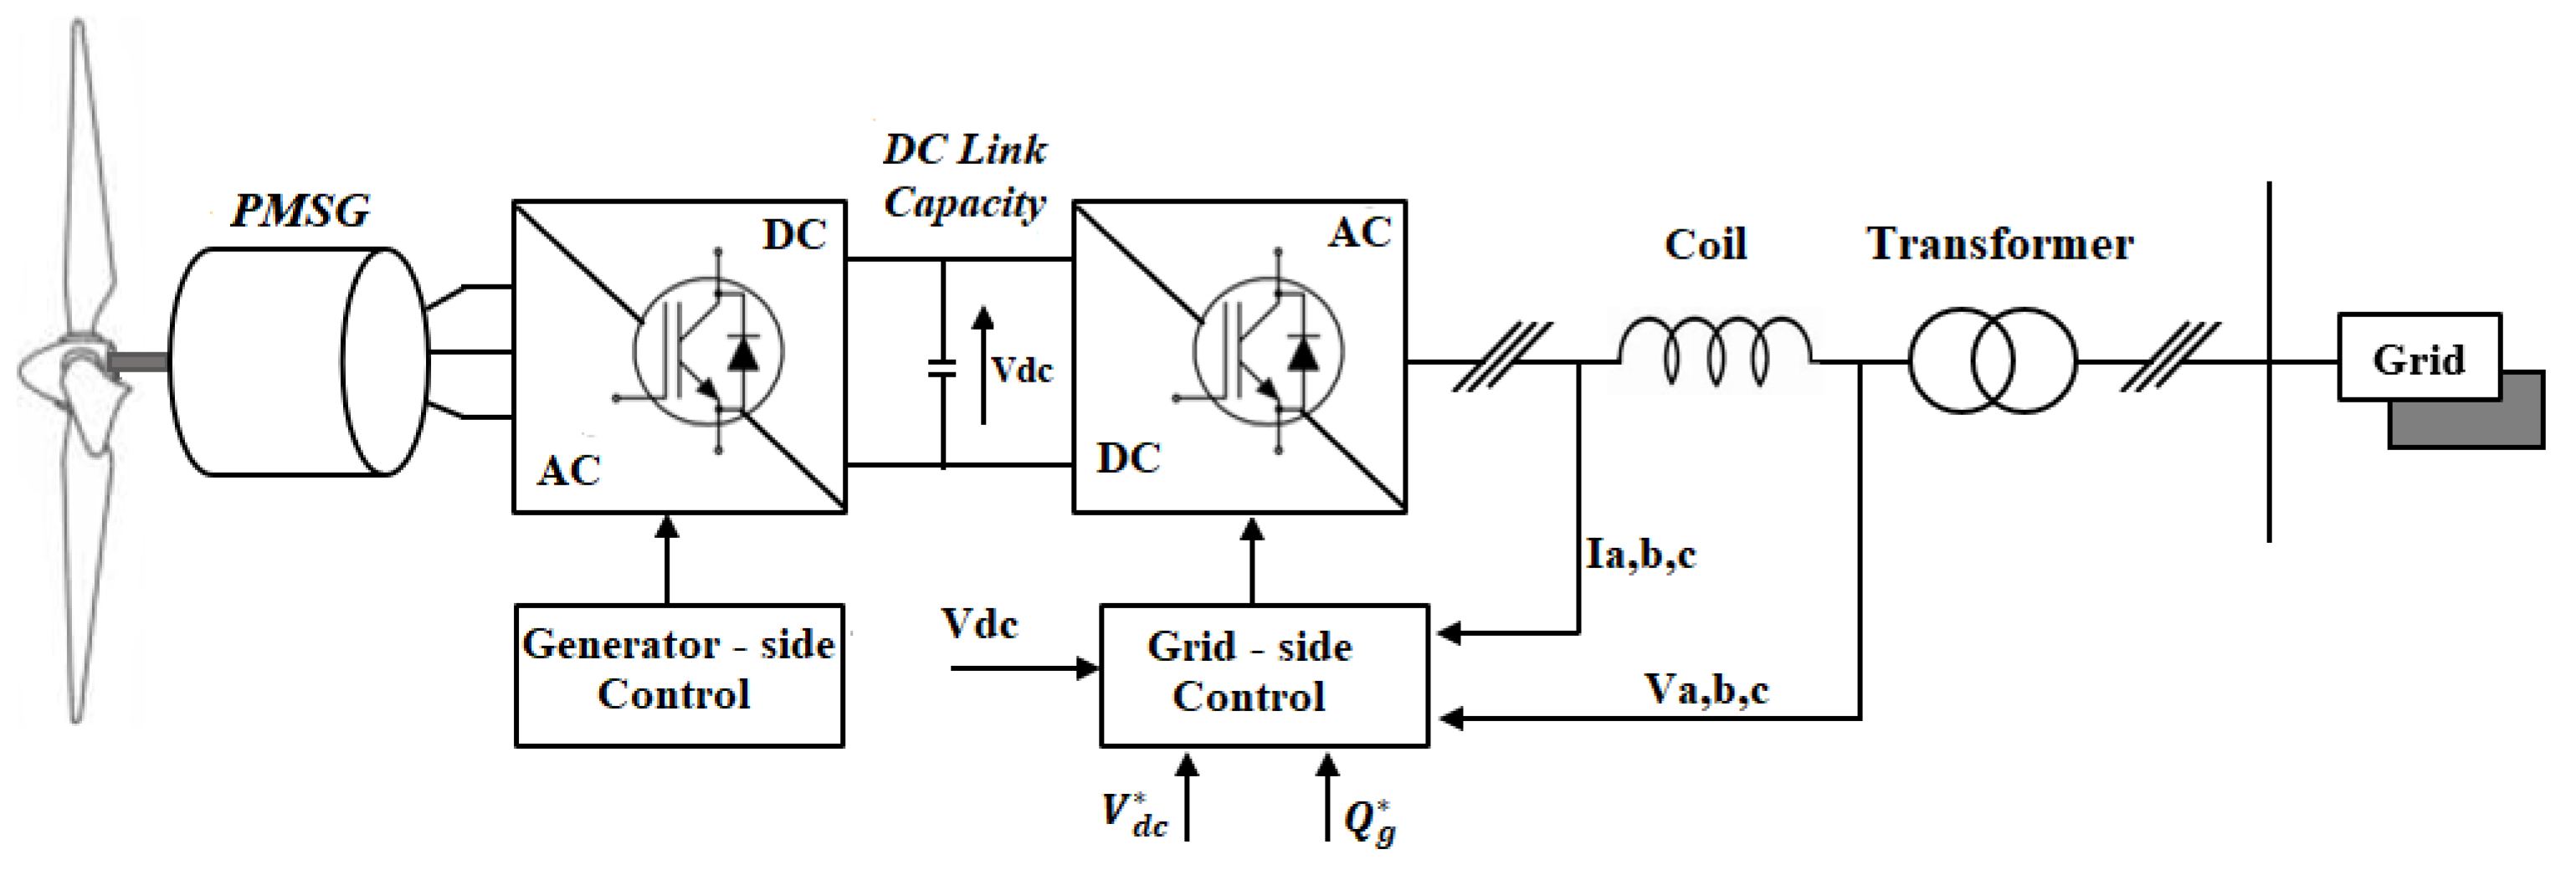
2. Grid-Side Conversion System
3. Control Strategies of the DC-Link Voltage
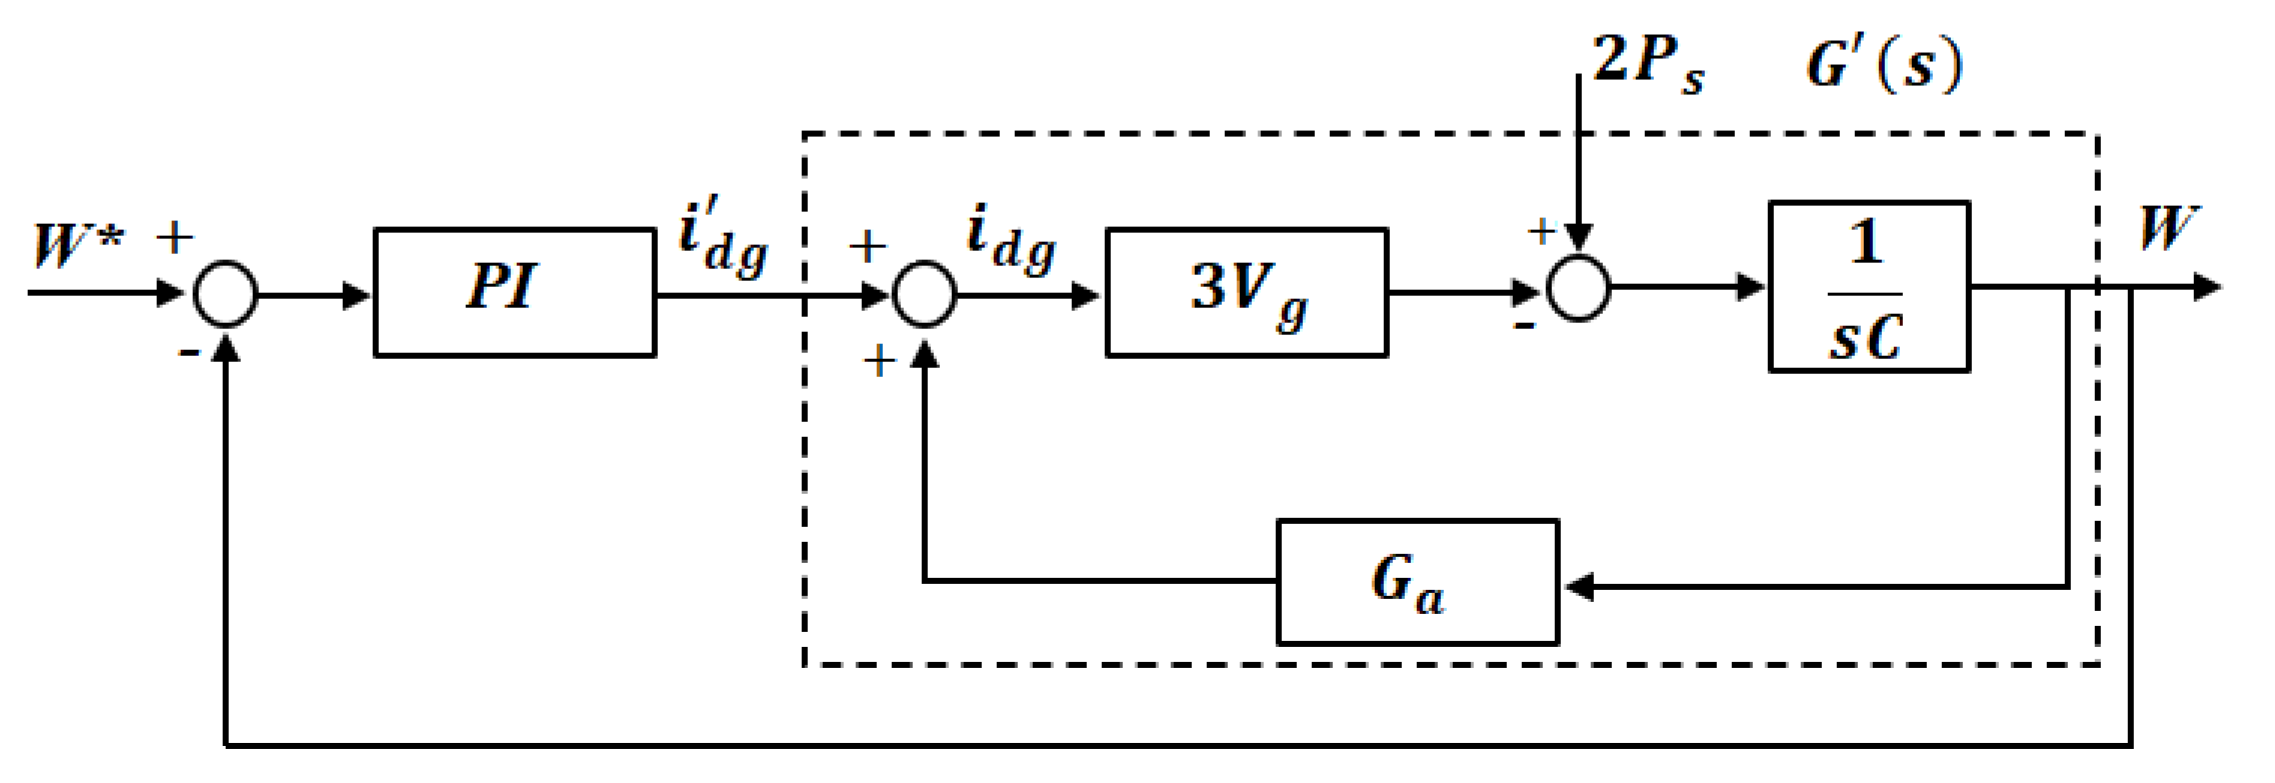
3.1. Linear Control with Active Damping
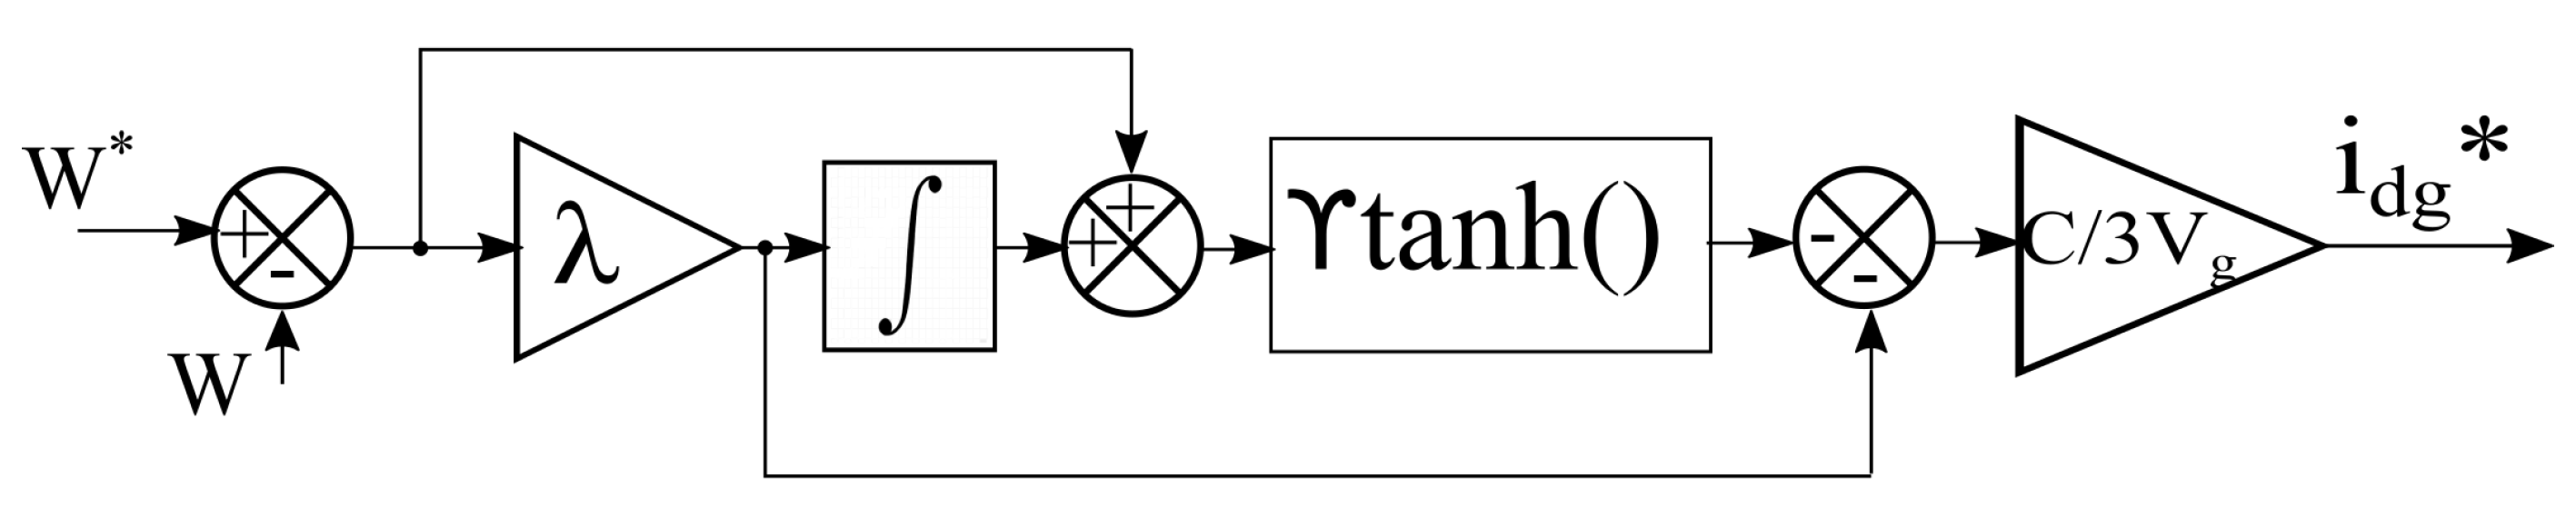
3.2. First Order Sliding Mode Control (SMC1)
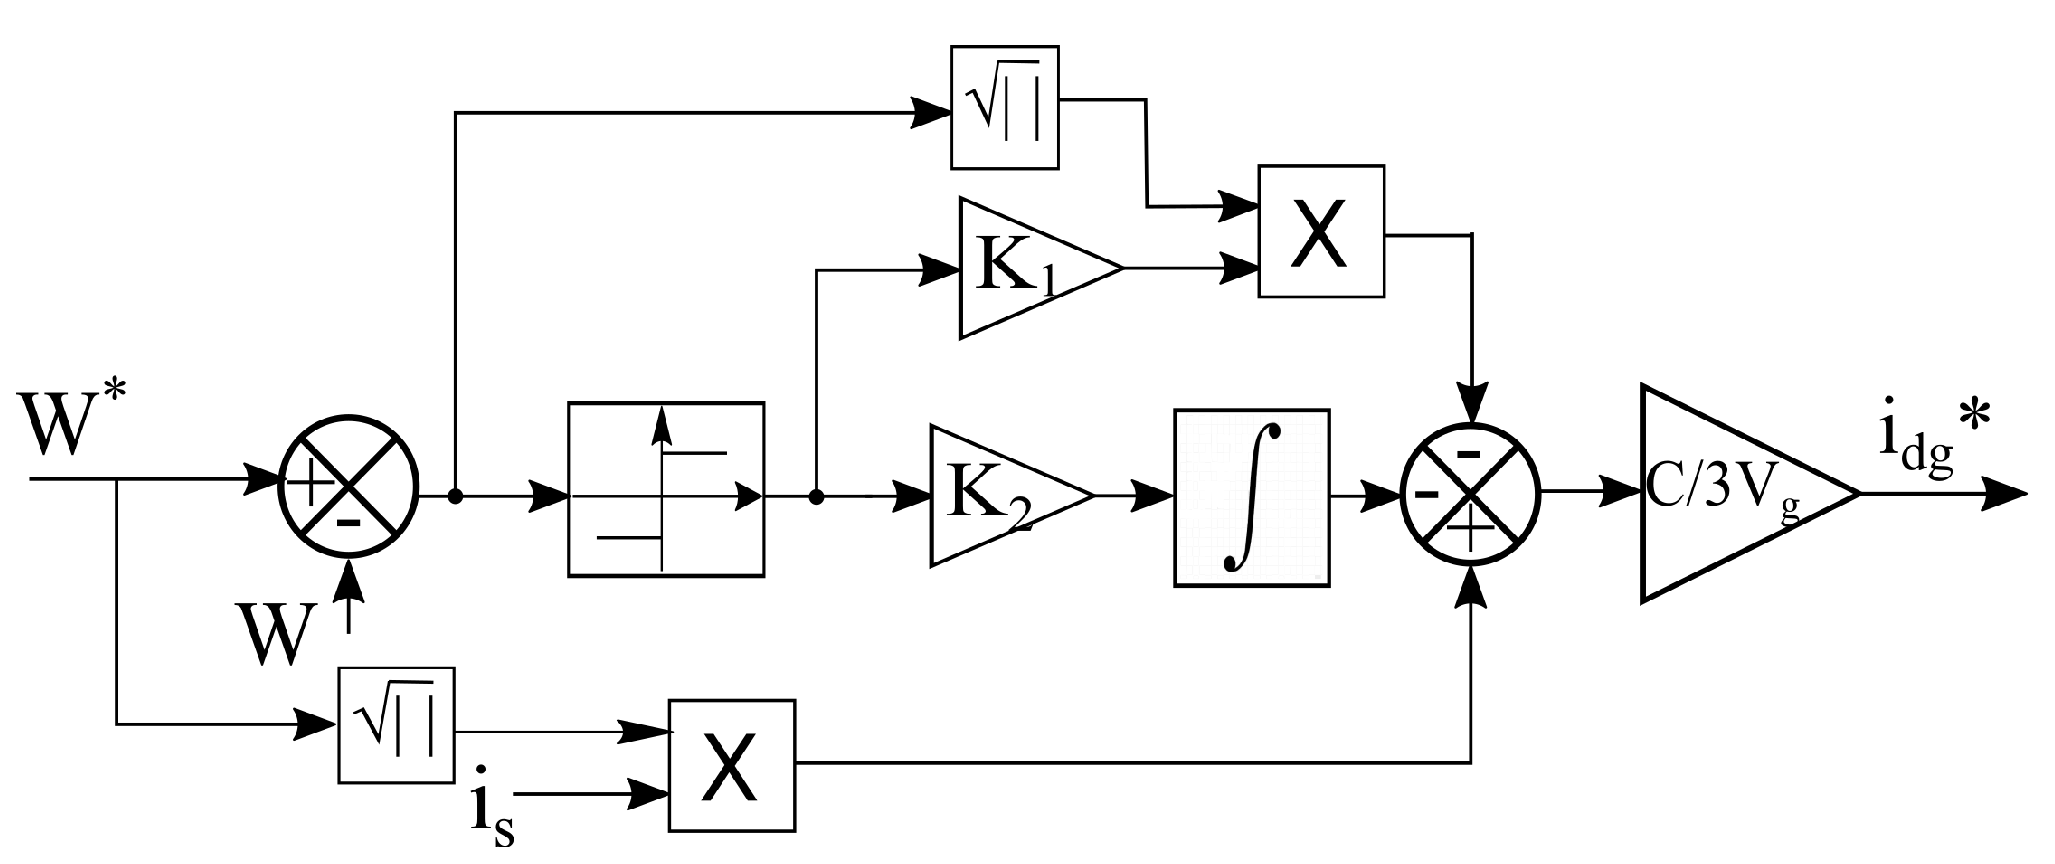
3.3. Second Order Sliding Mode Control (SMC2)
4. Simulation Results
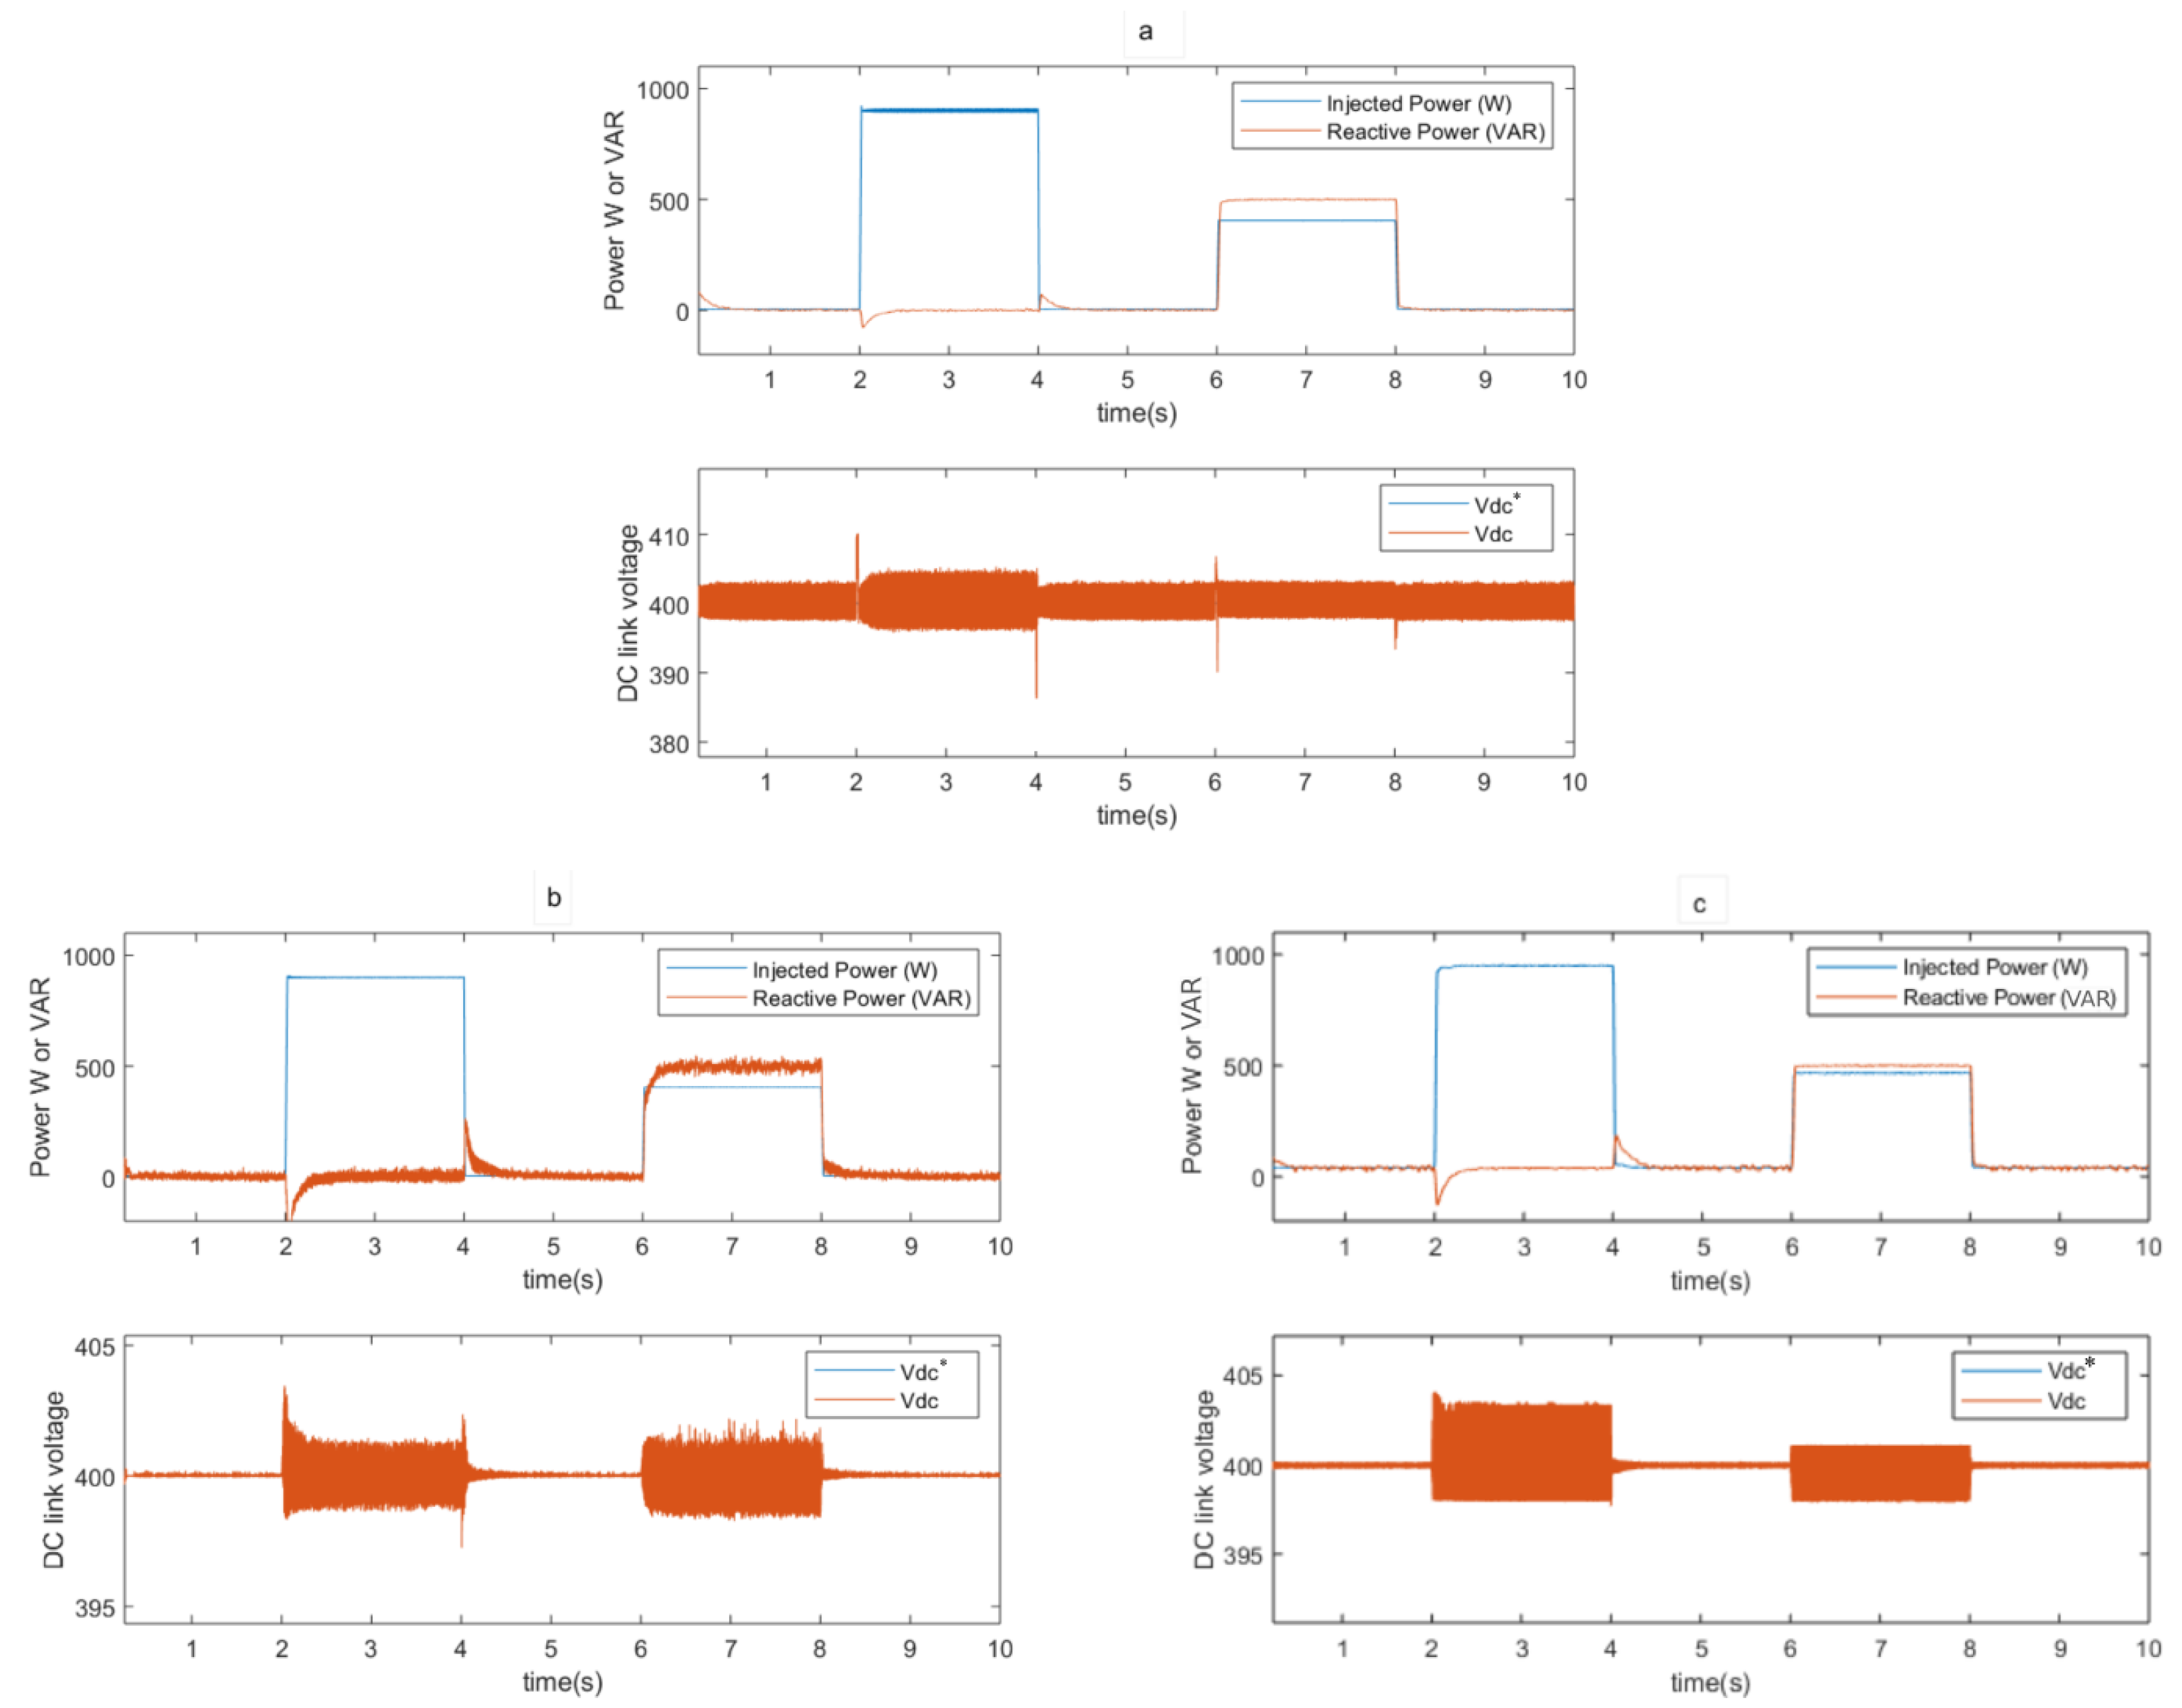
4.1. Results with Step Power
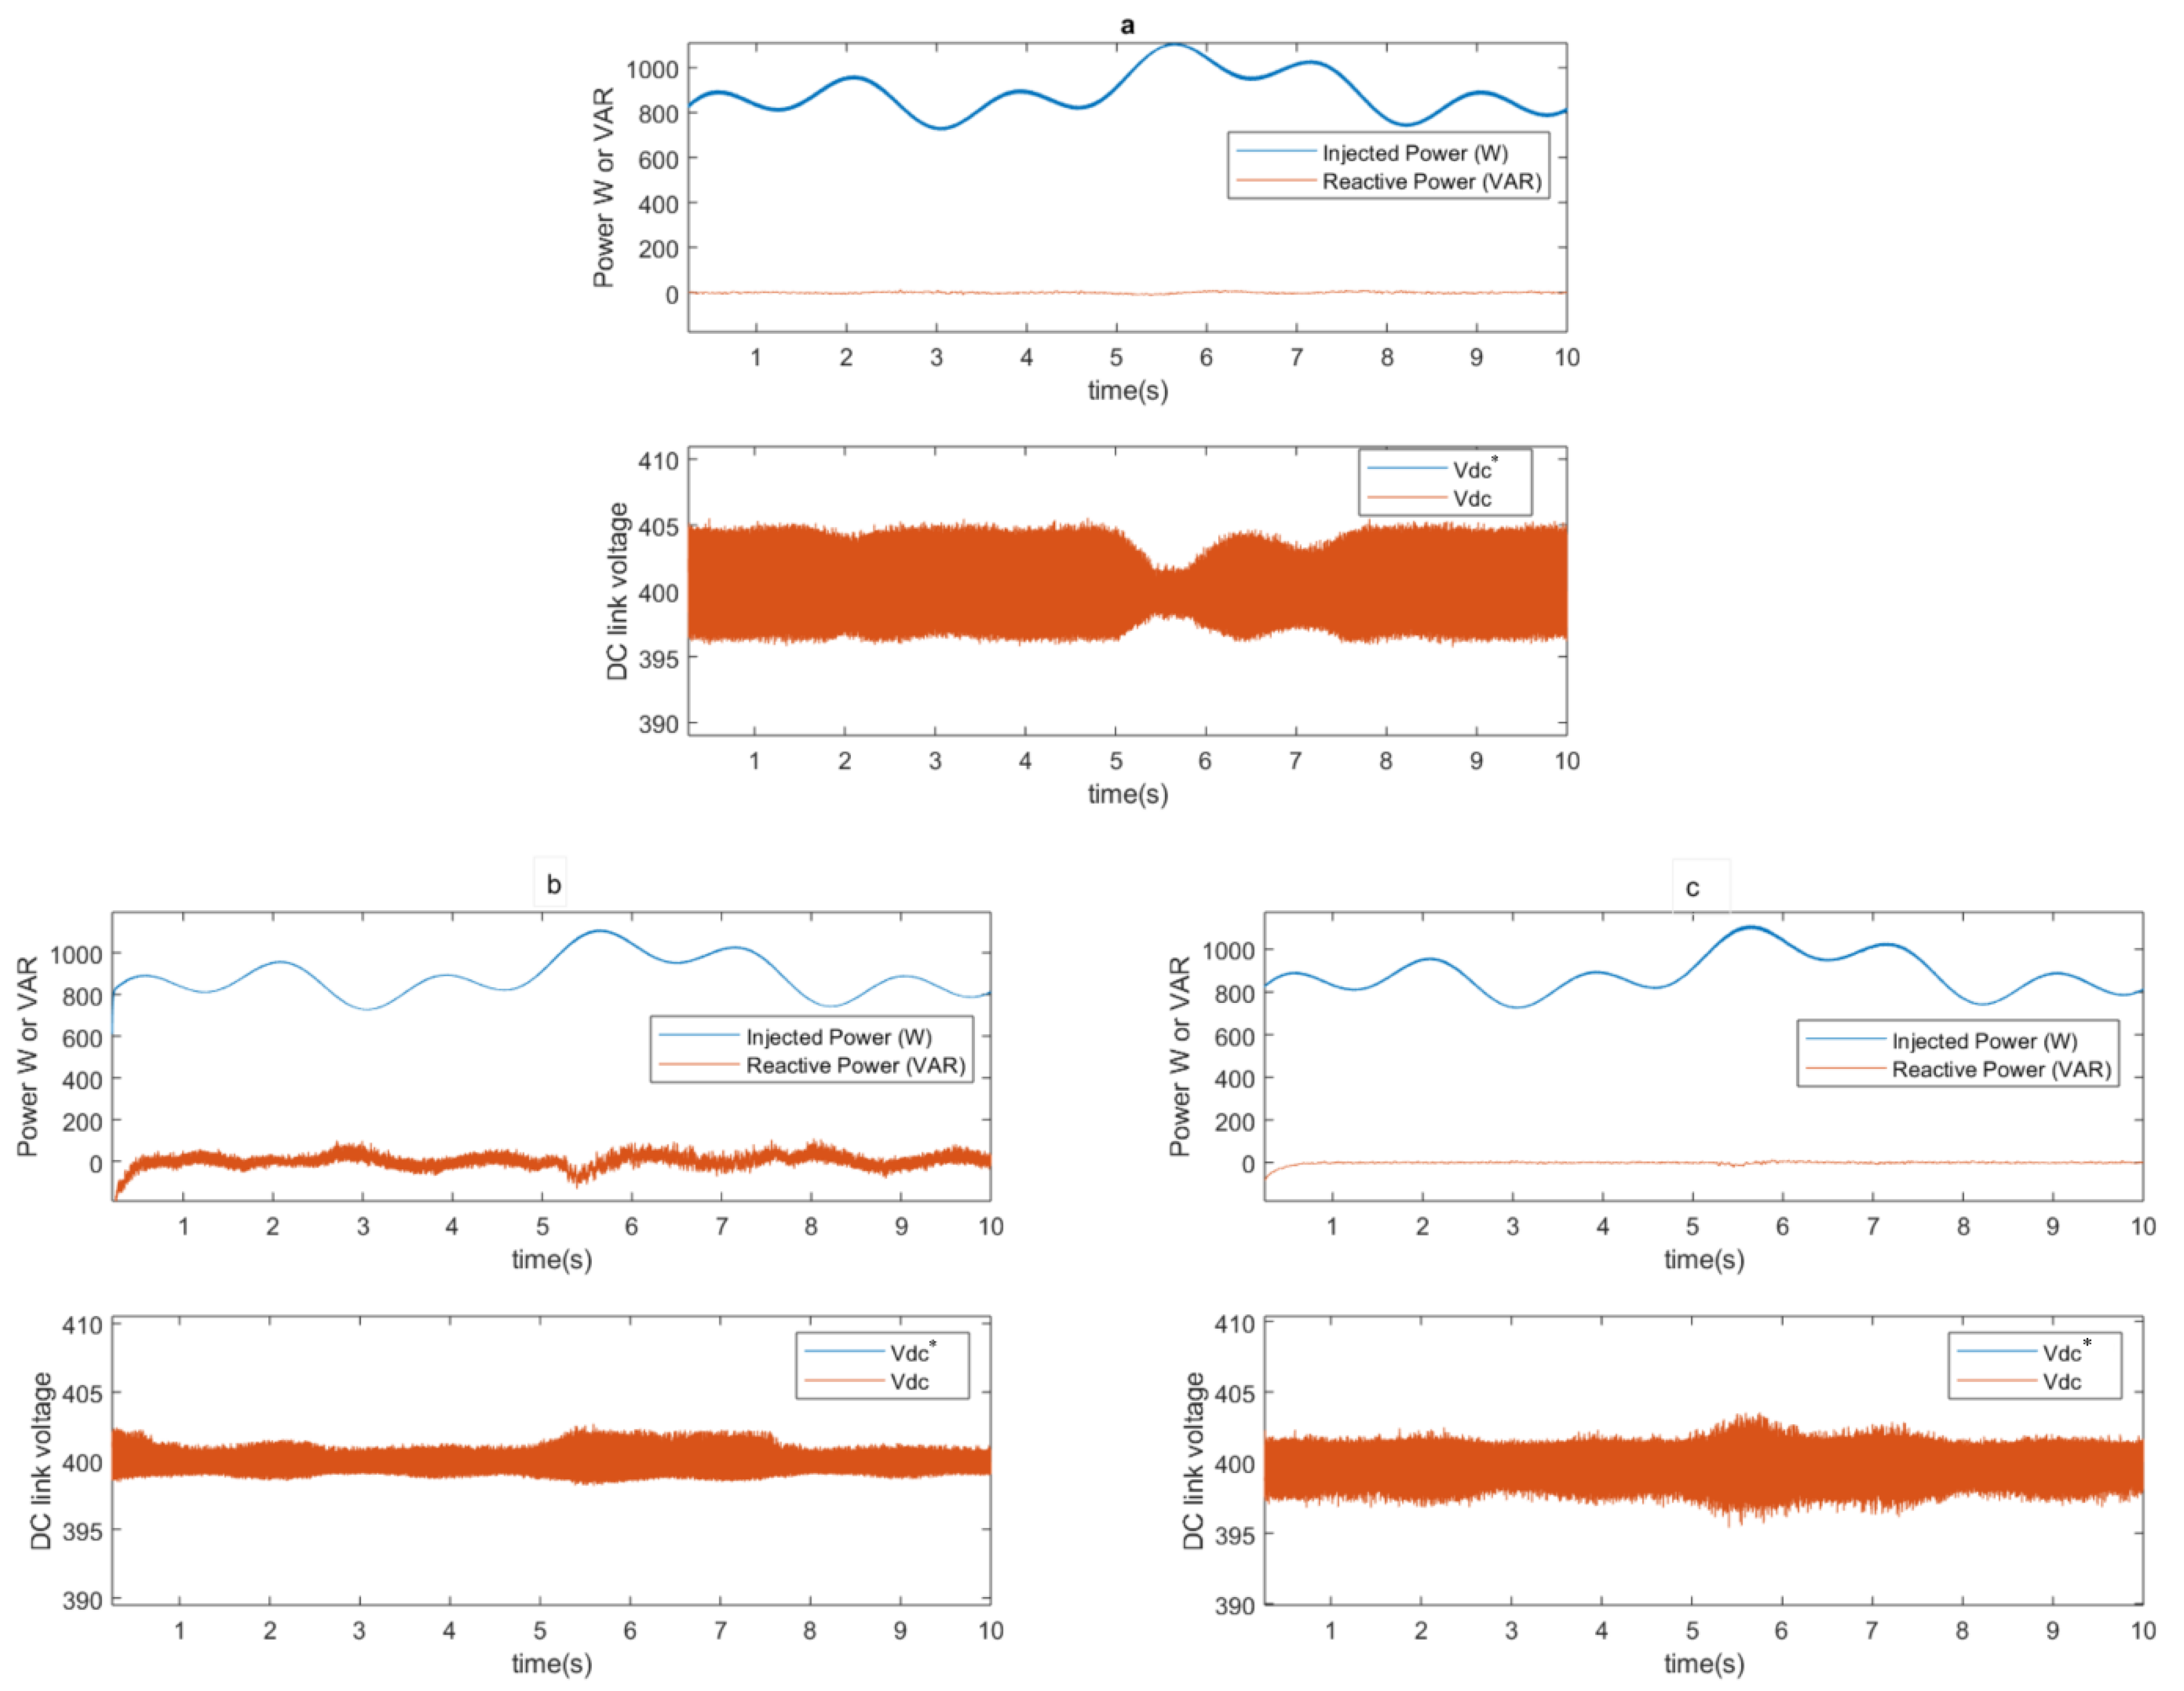
4.2. Results with Variable Power
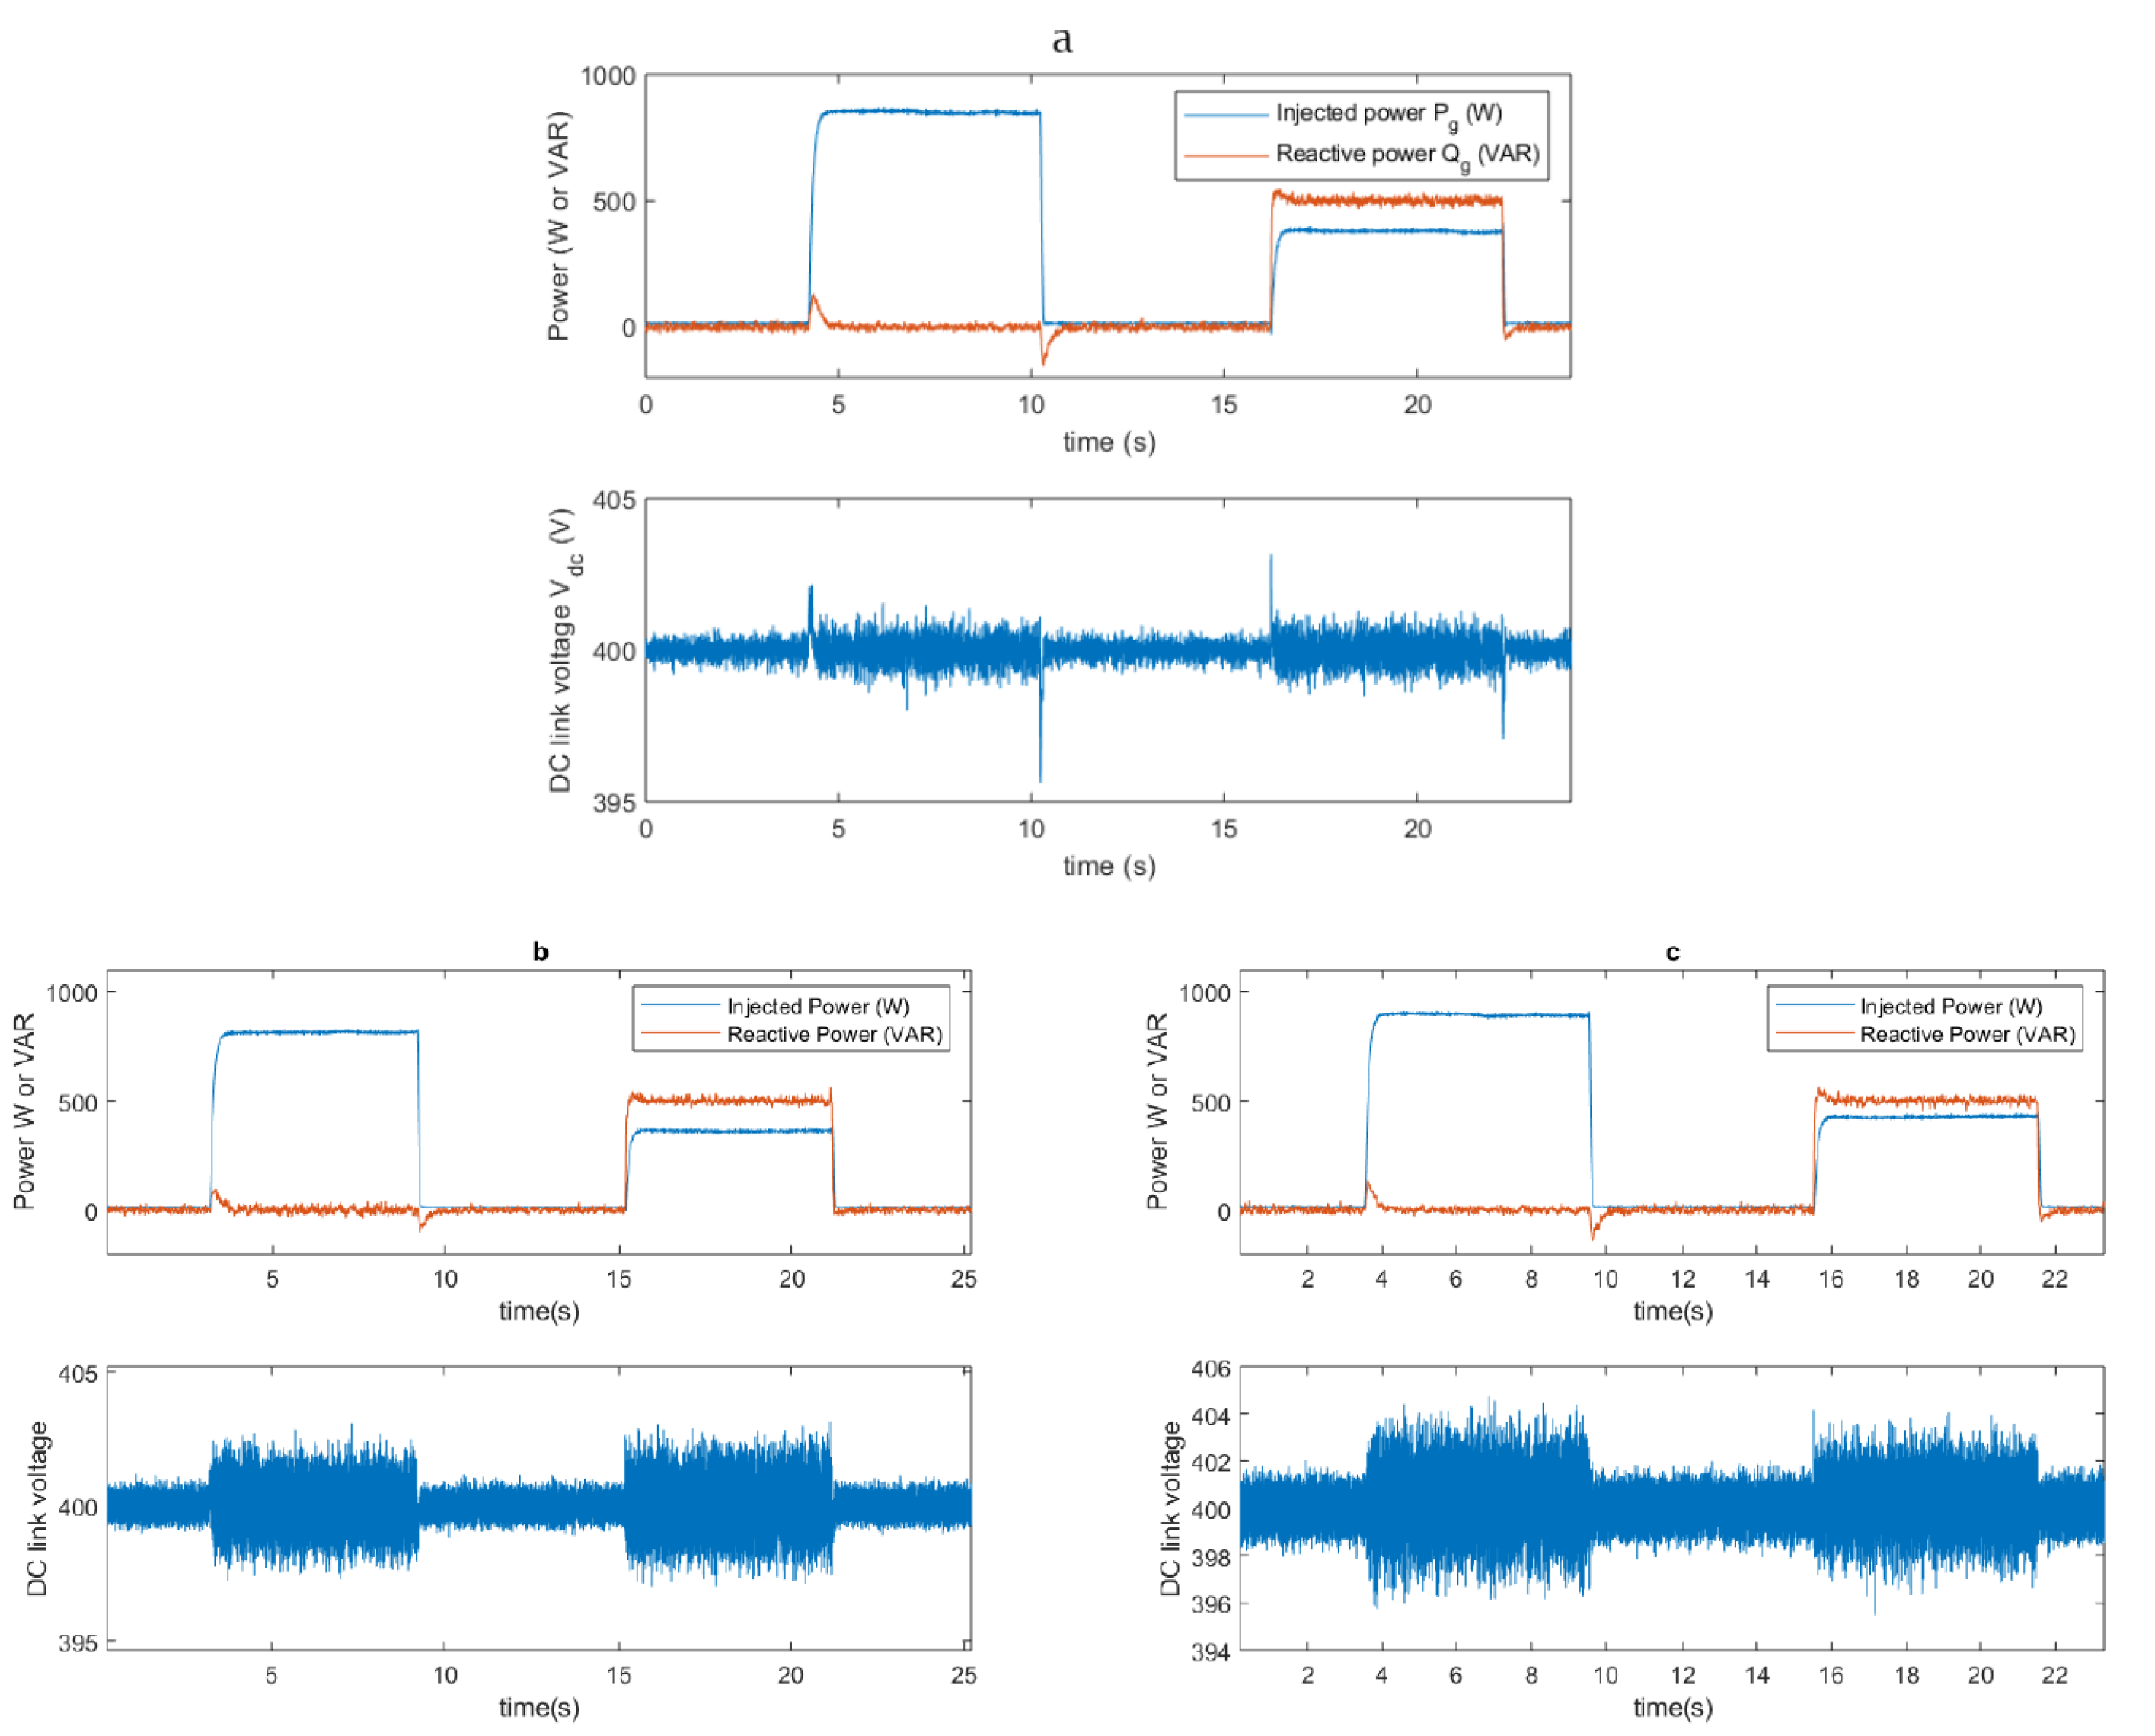
5. Experimental Results
5.1. Experimental Setup
5.2. Results with a Step Power
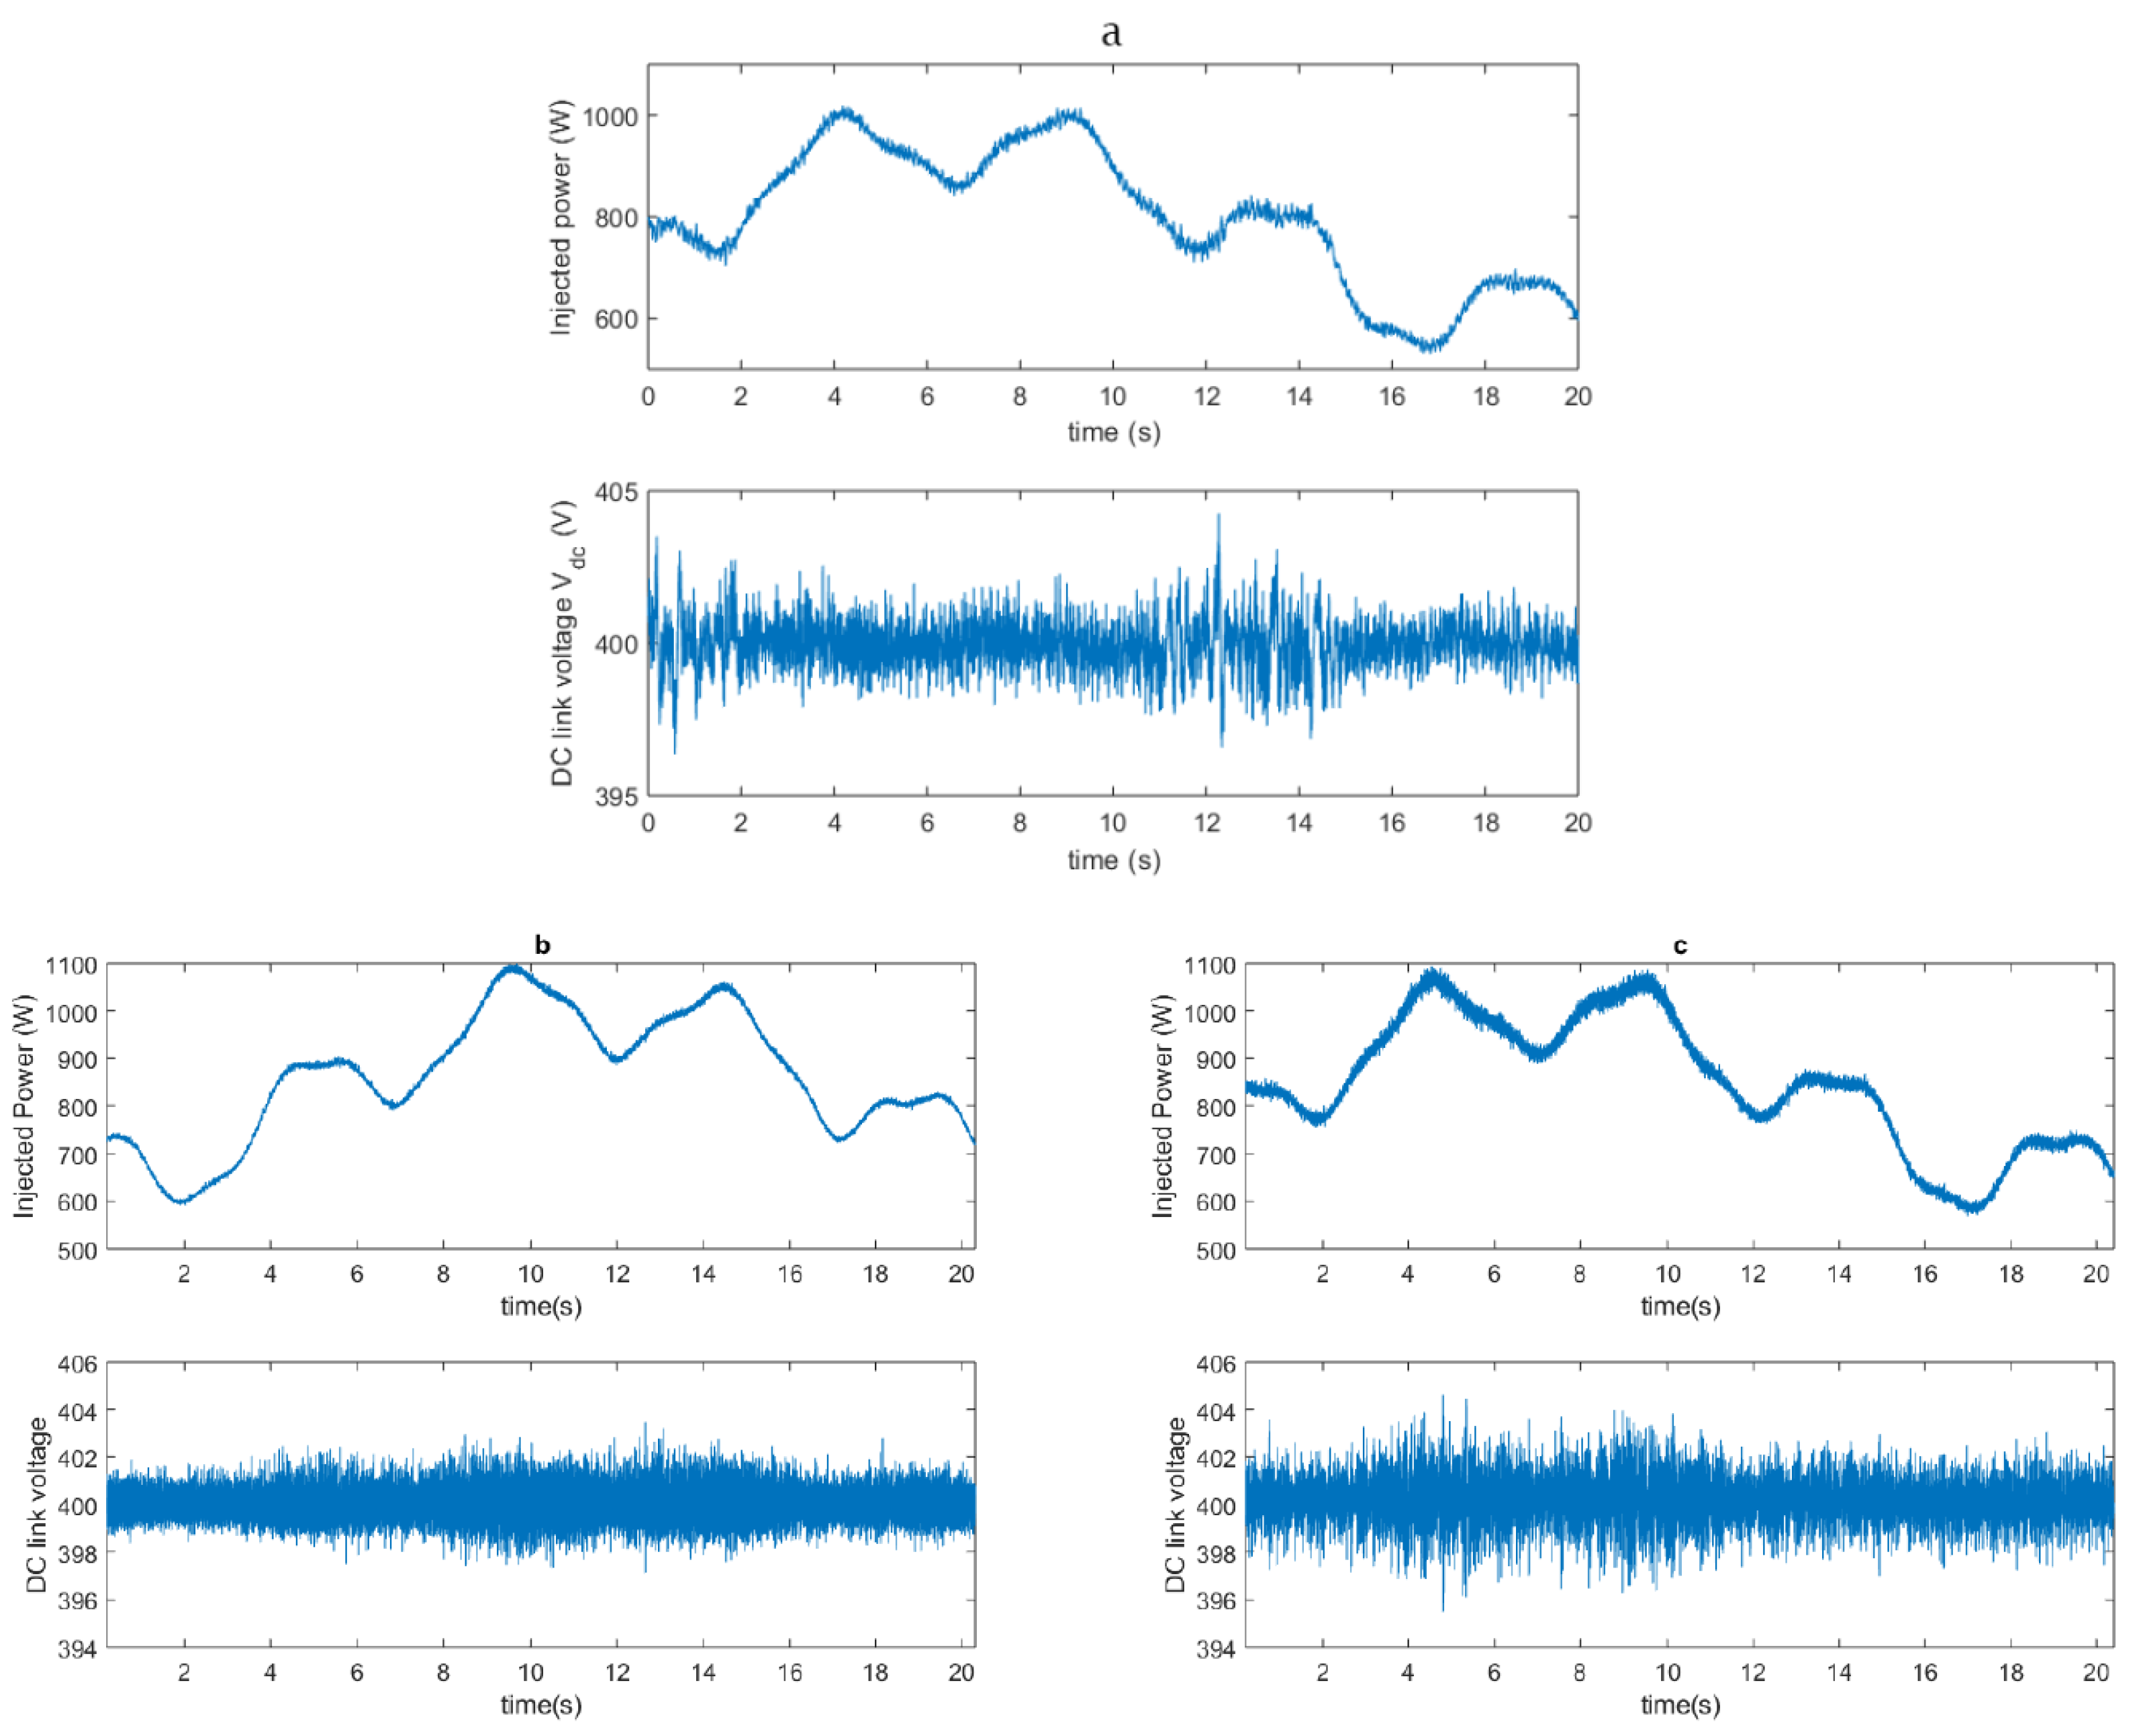
5.3. Results with Variable Power
6. Conclusions
Author Contributions
Funding
Acknowledgments
Conflicts of Interest
References
- Kabouris, J.; Kanellos, F.D. Impacts of Large-Scale Wind Penetration on Designing and Operation of Electric Power Systems. IEEE Trans. Sustain. Energy 2010, 1, 107–114. [Google Scholar] [CrossRef]
- McKenna, R.; Leye, P.O.V.d.; Fichtner, W. Key challenges and prospects for large wind turbines. Renew. Sustain. Energy Rev. 2016, 53, 1212–1221. [Google Scholar] [CrossRef]
- Menezes, E.J.N.; Araujo, A.M.; da Silva, N.S.B. A review on wind turbine control and its associated methods. J. Clean. Prod. 2018, 174, 945–953. [Google Scholar] [CrossRef]
- Kumar, D.; Chatterjee, K. A review of conventional and advanced MPPT algorithms for wind energy systems. Renew. Sustain. Energy Rev. 2016, 55, 957–970. [Google Scholar] [CrossRef]
- Tiwari, R.; Babu, N.R. Recent developments of control strategies for wind energy conversion system. Renew. Sustain. Energy Rev. 2016, 66, 268–285. [Google Scholar] [CrossRef]
- Toledo, S.; Rivera, M.; Elizondo, J.L. Overview of wind energy conversion systems development, technologies and power electronics research trends. In Proceedings of the IEEE International Conference on Automatica, Curico, Chile, 19–21 October 2016. [Google Scholar]
- Jain, B.; Jain, S.; Nema, R.K. Nema Control strategies of grid interfaced wind energy conversion system: An overview. Renew. Sustain. Energy Rev. 2015, 47, 983–996. [Google Scholar] [CrossRef]
- Abouri, H.; Guezar, F.E.; Bouzahir, H. An Overview of Control Techniques for Wind Energy Conversion System. In Proceedings of the 7th International Renewable and Sustainable Energy Conference (IRSEC), Agadir, Morocco, 27–30 November 2019. [Google Scholar]
- Baloch, M.H.; Wang, J.; Kaloi, G.S. A Review of the State of the Art Control Techniques for Wind Energy Conversion System. Int. J. Renew. Energy Res. 2016, 6, 1277–1295. [Google Scholar]
- Errami, Y.; Ouassaid, M.; Maaroufi, M. A performance comparison of a nonlinear and a linear control for grid connected PMSG wind energy conversion system. Int. J. Electr. Power Energy Syst. 2015, 68, 180–194. [Google Scholar] [CrossRef]
- Yaramasu, V.; Dekka, A.; Duran, M.J.; Kouro, S.; Wu, B. PMSG-based wind energy conversion systems: Survey on power converters and controls. IET Electr. Power Appl. 2017, 11, 956–968. [Google Scholar] [CrossRef]
- Szczesniak, P.; Kaniewski, J. Power electronics converters without DC energy storage in the future electrical power network. Electr. Power Syst. Res. 2015, 129, 194–207. [Google Scholar] [CrossRef]
- Chen, Z.; Guerrero, J.M.; Blaabjerg, F. A Review of the State of the Art of Power Electronics for Wind Turbines. IEEE Trans. Power Electron. 2009, 24, 1859–1874. [Google Scholar] [CrossRef]
- Diaz, M.; Cardenas, R.; Espinoza, M.; Rojas, F.; Mora, A.; Clare, J.C.; Wheeler, P. Control of Wind Energy Conversion Systems Based on the Modular Multilevel Matrix Converter. IEEE Trans. Ind. Electron. 2017, 64, 8799–8810. [Google Scholar] [CrossRef]
- Amin, M.M.; Mohammed, O.A. Development of High-Performance Grid-Connected Wind Energy Conversion System for Optimum Utilization of Variable Speed Wind Turbines. IEEE Trans. Sustain. Energy 2011, 2, 235–245. [Google Scholar] [CrossRef]
- Beddar, A.; Bouzekri, H.; Babes, B.; Afghoul, H. Experimental enhancement of fuzzy fractional order PI+I controller of grid connected variable speed wind energy conversion system. Energy Convers. Manag. 2016, 123, 569–580. [Google Scholar] [CrossRef]
- Soliman, M.A.; Hasanien, H.M.; Azazi, H.Z.; El-Kholy, E.E.; Mahmoud, S.A. An Adaptive Fuzzy Logic Control Strategy for Performance Enhancement of a Grid-Connected PMSG-Based Wind Turbine. IEEE Trans. Ind. Inform. 2019, 15, 3163–3173. [Google Scholar] [CrossRef]
- Tremblay, E.; Chandra, A.; Member, S.; Lagace, P.J. Grid-Side Converter Control of DFIG Wind Turbines to Enhance Power Quality of Distribution Network. In Proceedings of the EEE Power Engineering Society General Meeting, Montreal, QC, Canada, 18–22 June 2006. [Google Scholar]
- Wu, B.; Lang, Y.; Zarkari, N.; Kouro, S. Power Conversion and Control of Wind Energy Systems; IEEE Press: Hoboken, NJ, USA, 2011; Chapter 4; pp. 142–152. [Google Scholar]
- Barambones, O.; Cortajarena, J.A.; Alkorta, P.; de Durana, J.M.G. A Real-Time Sliding Mode Control for a Wind Energy System Based on a Doubly Fed Induction Generator. Energies 2014, 7, 6412–6433. [Google Scholar] [CrossRef]
- Merabet, A.; Ahmed, K.T.; Ibrahim, H.; Beguenane, R. Implementation of Sliding Mode Control System for Generator and Grid Sides Control of Wind Energy Conversion System. IEEE Trans. Sustain. Energy 2016, 7, 1327–1335. [Google Scholar] [CrossRef]
- Zhang, J.; Cheng, M. DC link voltage control strategy of grid-connected wind power generation system. In Proceedings of the 2nd International Symposium on Power Electronics for Distributed Generation Systems, Hefei, China, 16–18 June 2010. [Google Scholar]
- Benouareth, I.; Houabes, M.; Khelil, K. Fuzzy Logic Based P/Q Control Design for Grid- Connected Wind conversion System. In Proceedings of the International Conference on Wind Energy and Applications, Algiers, Algeria, 6–7 November 2018. [Google Scholar]
- Douiri, M.R.; Essadki, A.; Cherkaoui, M. Neural Networks for Stable Control of Nonlinear DFIG in Wind Power Systems. Procedia Comput. Sci. 2018, 127, 454–463. [Google Scholar] [CrossRef]
- Jday, M.; Haggège, J. Modeling and neural networks based control of power converters associated with a wind turbine. In Proceedings of the International Conference on Green Energy Conversion Systems (GECS), Hammamet, Tunisia, 23–25 March 2017. [Google Scholar]
- Bounasla, N.; Hemsas, K.E. Second order sliding mode control of a permanent magnet synchronous motor. In Proceedings of the 14th International Conference on Sciences and Techniques of Automatic Control & Computer Engineering, Sousse, Tunisia, 20–22 December 2013; pp. 535–539. [Google Scholar] [CrossRef]
- Corradini, M.L.; Fossi, V.; Giantomassi, A.; Ippoliti, G.; Longhi, S.; Orlando, G. Discrete time sliding mode control of robotic manipulators: Development and experimental validation. Control Eng. Pract. 2012, 20, 816–822. [Google Scholar] [CrossRef]
- Alsmadi, Y.M.; Utkin, V.; Haj-ahmed, M.A.; Xu, L. Sliding mode control of power converters: DC/DC converters. Int. J. Control 2018, 91, 2472–2493. [Google Scholar] [CrossRef]
- Gambhire, S.J.; Kishore, D.R.; Londhe, P.S.; Pawar, S.N. Review of sliding mode based control techniques for control system applications. Int. J. Dyn. Control 2021, 9, 363–378. [Google Scholar] [CrossRef]
- Babaie, M.; Sharifzadeh, M.; Mehrasa, M.; Al-Haddad, K. Optimized based algorithm first order sliding mode control for grid-connected packed e-cell (PEC) inverter. In Proceedings of the 2019 IEEE Energy Conversion Congress and Exposition (ECCE), Baltimore, MD, USA, 29 September–3 October 2019; pp. 2269–2273. [Google Scholar] [CrossRef]
- Utkin, V.; Poznyak, A.; Orlov, Y.; Polyakov, A. Conventional and high order sliding mode control. J. Frankl. Inst. 2020, 357, 10244–10261. [Google Scholar] [CrossRef]
- Eker, I. Second-order sliding mode control with experimental application. ISA Trans. 2010, 49, 394–405. [Google Scholar] [CrossRef] [PubMed]
- Beltran, B.; Benbouzid, M.E.H.; Ahmed-Ali, T. Second-order sliding mode control of a doubly fed induction generator driven wind turbine. IEEE Trans. Energy Convers. 2012, 27, 261–269. [Google Scholar] [CrossRef] [Green Version]
- Zheng, E.H.; Xiong, J.J.; Luo, J.L. Second order sliding mode control for a quadrotor UAV. ISA Trans. 2014, 53, 1350–1356. [Google Scholar] [CrossRef] [PubMed]
- Bartolini, G.; Ferrara, A.; Usai, E. Chattering avoidance by second-order sliding mode control. IEEE Trans. Automat. Contr. 1998, 43, 241–246. [Google Scholar] [CrossRef]
- Benbouzid, M.; Beltran, B.; Mangel, H.; Mamoune, A. A high-order sliding mode observer for sensorless control of DFIG-based wind turbines. In Proceedings of the IECON—38th Annual Conference on IEEE Industrial Electronics Society, Montreal, QC, Canada, 25–28 October 2012. [Google Scholar]
- Narayana, M.; Putrus, G.A.; Jovanovic, M.; Leung, P.S.; McDonald, S. Generic maximum power point tracking controller for small-scale wind turbines. Renew. Energy 2012, 44, 72–79. [Google Scholar] [CrossRef] [Green Version]
- Ottersten, R. On Control of Back-to-Back Converters and Sensorless Induction Machine Drvies. Ph.D. Thesis, Chalmers University of Technology Goteborg, Goteborg, Sweden, 2003; pp. 90–93. [Google Scholar]
- Yazdanian, M.; Mehrizi-Sani, A. Internal Model-Based Current Control of the RL Filter-Based Voltage-Sourced Converter. IEEE Trans. Energy Convers. 2014, 29, 873–881. [Google Scholar] [CrossRef]
- Abubakar, U.; Mekhilef, S.; Mokhlis, H.; Seyedmahmoudian, M.; Horan, B.; Stojcevski, A.; Bassi, H.; Rawa, M.J.H. Transient faults in wind energy conversion systems: Analysis, modelling methodologies and remedies. Energies 2018, 11, 2249. [Google Scholar] [CrossRef] [Green Version]
- Chung, S.-K. A Phase Tracking System for Three Phase Utility Interface Inverters. IEEE Trans. Power Electron. 2000, 15, 431–438. [Google Scholar] [CrossRef] [Green Version]
- Perruquetti, W.; Barbot, J.-P. Sliding Mode Control in Engineering; CRC Press: Boca Raton, FL, USA, 2002. [Google Scholar]
- Moreno, J.A.; Osorio, M. A lyapunov approach to a second-order sliding mode controllers and observers. In Proceedings of the 47th IEEE Conference on Decision and Control, Cancun, Mexico, 9–11 December 2008; pp. 2856–2861. [Google Scholar]
- Aubree, R.; Auger, F.; Mace, M.; Loron, L. Design of an efficient small wind-energy conversion system with an adaptive sensorless MPPT strategy. Renew. Energy 2016, 86, 280–291. [Google Scholar] [CrossRef]


| Electric Parameter | Value |
|---|---|
| Reference DC link voltage | V |
| Grid side voltage | V |
| Grid side frequency | Hz |
| Coil Resistance | |
| Coil Inductance | mH |
| Control Parameter | Value |
| Proportional gain to control | |
| Integral gain to control | |
| Time constant to control | ms |
| Indicators | C | Step Power | |||||
|---|---|---|---|---|---|---|---|
| and | and | ||||||
| Linear Control | SMC1 | SMC2 | Linear Control | SMC1 | SMC2 | ||
| F | 12 | 13 | |||||
| F | |||||||
| F | |||||||
| F | |||||||
| F | |||||||
| F | |||||||
| F | 3 | ||||||
| F | 1 | ||||||
| F | |||||||
| F | |||||||
| THD (%) | F | ||||||
| F | |||||||
| F | |||||||
| F | |||||||
| F | 4 | ||||||
| index | i | 0 | 1 | 2 | 3 | 4 |
| Amplitude | 9.0 | 0.2 | 2.0 | 1 | 0.2 | |
| Period | 0.11 | 0.28 | 1.29 | 10.00 |
| Indicators | C | Variable Power | ||
|---|---|---|---|---|
| Linear Control | SMC1 | SMC2 | ||
| F | ||||
| F | ||||
| F | ||||
| F | ||||
| F | ||||
| F | ||||
| F | ||||
| F | ||||
| F | ||||
| F | ||||
| THD (%) | F | |||
| F | ||||
| F | ||||
| F | ||||
| F | ||||
| Quantity | C | Step Power | |||||
|---|---|---|---|---|---|---|---|
| and | and | ||||||
| Linear Control | SMC1 | SMC2 | Linear Control | SMC1 | SMC2 | ||
| F | |||||||
| F | |||||||
| F | |||||||
| F | |||||||
| F | |||||||
| 1 | |||||||
| THD (%) | F | ||||||
| F | |||||||
| F | |||||||
| F | |||||||
| F | |||||||
| Indicators | C | Variable Power | ||
|---|---|---|---|---|
| Linear Control | SMC1 | SMC2 | ||
| F | ||||
| F | ||||
| F | ||||
| F | ||||
| F | ||||
| F | ||||
| F | ||||
| F | ||||
| THD (%) | F | |||
| F | ||||
| F | ||||
| F | ||||
| Efficiency (%) | F | |||
| F | 94 | |||
| F | ||||
| F | ||||
Publisher’s Note: MDPI stays neutral with regard to jurisdictional claims in published maps and institutional affiliations. |
© 2021 by the authors. Licensee MDPI, Basel, Switzerland. This article is an open access article distributed under the terms and conditions of the Creative Commons Attribution (CC BY) license (https://creativecommons.org/licenses/by/4.0/).
Share and Cite
Azelhak, Y.; Benaaouinate, L.; Medromi, H.; Errami, Y.; Bouragba, T.; Voyer, D. Exhaustive Comparison between Linear and Nonlinear Approaches for Grid-Side Control of Wind Energy Conversion Systems. Energies 2021, 14, 4049. https://doi.org/10.3390/en14134049
Azelhak Y, Benaaouinate L, Medromi H, Errami Y, Bouragba T, Voyer D. Exhaustive Comparison between Linear and Nonlinear Approaches for Grid-Side Control of Wind Energy Conversion Systems. Energies. 2021; 14(13):4049. https://doi.org/10.3390/en14134049
Chicago/Turabian StyleAzelhak, Younes, Loubna Benaaouinate, Hicham Medromi, Youssef Errami, Tarik Bouragba, and Damien Voyer. 2021. "Exhaustive Comparison between Linear and Nonlinear Approaches for Grid-Side Control of Wind Energy Conversion Systems" Energies 14, no. 13: 4049. https://doi.org/10.3390/en14134049
APA StyleAzelhak, Y., Benaaouinate, L., Medromi, H., Errami, Y., Bouragba, T., & Voyer, D. (2021). Exhaustive Comparison between Linear and Nonlinear Approaches for Grid-Side Control of Wind Energy Conversion Systems. Energies, 14(13), 4049. https://doi.org/10.3390/en14134049