Article

Risk Assessment Method Combining Independent Protection Layers (IPL) of Layer of Protection Analysis (LOPA) and RISKCURVES Software: Case Study of Hydrogen Refueling Stations in Urban Areas

1
Fire Research Institute, Korea Institute of Civil Engineering and Building Technology, Goyang-si 18544, Gyeonggi-do, Korea
2
School of Social Safety System Engineering, Hankyong National University, Anseong 17579, Gyeonggi-do, Korea
*
Authors to whom correspondence should be addressed.
Energies 2021, 14(13), 4043; https://doi.org/10.3390/en14134043
Submission received: 15 May 2021 / Revised: 30 June 2021 / Accepted: 1 July 2021 / Published: 5 July 2021
(This article belongs to the Special Issue Advances in Hydrogen Safety)

Abstract

:
The commercialization of eco-friendly hydrogen vehicles has elicited attempts to expand hydrogen refueling stations in urban areas; however, safety measures to reduce the risk of jet fires have not been established. The RISKCURVES software was used to evaluate the individual and societal risks of hydrogen refueling stations in urban areas, and the F–N (Frequency–Number of fatalities) curve was used to compare whether the safety measures satisfied international standards. From the results of the analysis, it was found that there is a risk of explosion in the expansion of hydrogen refueling stations in urban areas, and safety measures should be considered. To lower the risk of hydrogen refueling stations, this study applied the passive and active independent protection layers (IPLs) of LOPA (Layer of Protection Analysis) and confirmed that these measures significantly reduced societal risk as well as individual risk and met international standards. In particular, such measures could effectively reduce the impact of jet fire in dispensers and tube trailers that had a high risk. Measures employing both IPL types were efficient in meeting international standard criteria; however, passive IPLs were found to have a greater risk reduction effect than active IPLs. The combination of RISKCURVES and LOPA is an appropriate risk assessment method that can reduce work time and mitigate risks through protective measures compared to existing risk assessment methods. This method can be applied to risk assessment and risk mitigation not only for hydrogen facilities, but also for hazardous materials with high fire or explosion risk.

1. Introduction

The growing world population and the desire to improve the quality of life drive energy consumption, causing continuous energy depletion [1,2,3]. As a result, hydrogen, an eco-friendly alternative fuel, has emerged as a promising ideal sustainable energy carrier for the future owing to its outstanding properties [4,5]. Currently, hydrogen fuel cells, hydrogen cars, and hydrogen charging stations have been developed and commercialized [6,7].
However, there is still a problem in the use of hydrogen due to explosion accidents caused by leakage in hydrogen treatment/production facilities, and the expansion of related facilities is thus limited [8,9]. Hydrogen has a wide explosive limit and low minimum ignition energy compared to other fuels, such as natural gas or gasoline. In addition, it can be regarded as a relatively dangerous substance because it is easily ignited when exposed to air [10]. When the extended pipe is short, self-ignition does not occur easily; however, it can be seen that the higher the ejection pressure, the higher the possibility of self-ignition [11]. Nevertheless, the recent commercialization of hydrogen-fueled vehicles has increased the necessity of installing hydrogen refueling stations; according to the U.S. Department of Energy, as of June 2021, there are 68 hydrogen refueling stations, 53 of which are located in California [12]. It is also known that there are 177 hydrogen refueling stations in Europe as of 2019 [13]. Therefore, it is necessary to secure reliable process safety control technologies for hydrogen gas in order to enter an era where it can be used as a public fuel such as gasoline or natural gas [14,15].
Risk assessment technologies to ensure safety from leaks and explosions in hydrogen refueling stations and the spread of jet flames from various perspectives have been evaluated to prevent catastrophic accidents [16]. Quantitative risk assessment studies of hydrogen facilities were conducted using fault tree analysis (FTA), hazard and operability analysis (HAZOP), failure mode effect analysis (FMEA), and generic risk analysis (GRA) [17,18,19,20]. Computational fluid dynamics calculations for safety from gas explosions and leaks have been widely used in the oil and gas industry to perform risk assessments for over a decade [21]. Recently, various risk assessment software programs have been used to determine the safety distance and risk of explosion through simulation analysis studies on hydrogen facilities [22,23]. For example, a study was conducted to determine the safety distance of a hydrogen refueling station facility by calculating the jet flame length using HyRAM [24], and a study was conducted to identify and establish hydrogen explosion locations using the FLACS-CFD software [25]. In addition, studies have been conducted to analyze the damage effect of jet flames using Phast and Safeti [26,27]. Although risk assessment was performed using various methods for each component, such as pipe and storage, quantitative risk assessment considering the entire hydrogen refueling station is still insufficient [28].
Layer of Protection Analysis (LOPA) was created by complementing the strengths and weaknesses of a qualitative and quantitative risk assessment. LOPA was established by the US Center for Chemical Process Safety (CCPS) and evaluates the effectiveness of a passive or active independent protection layer (IPL) that reduces the frequency or intensity of unwanted accidents [29]. Pasman and Rogers (2012) analyzed gas risk in hydrogen tank stations by combining a Bayesian network and LOPA to make it more effective [30]. To expand the infrastructure of hydrogen refueling stations in California, USA, risk assessment in the standard FMEA process in accordance with the IEC standard with HAZOP/LOPA was carried out, claiming that a higher level of structured and safety-considered products could be obtained [31]. RISKCURVES software is a full-feature computer program and was developed by Gexon (Norway) to perform QRA analysis. It quantifies the risk to the environment and (petroleum) chemical facilities of the storage and transport of hazardous substances to surrounding populations and structures. RISKCURVES provides calculation results in a variety of ways, including individual risk contours, F–N curves for societal risks, and risk ranking reports [32].
Currently, most of the hydrogen refueling stations installed in South Korea are located in suburban areas; therefore, the risk of fire or explosion is not significant. However, to increase the proximity of hydrogen facilities, there is a need for measures to increase safety by proceeding toward being established in urban areas and to minimize damage in the case of jet fires or explosions caused by hydrogen. The purpose of this study was to determine the risk of hydrogen refueling stations installed in urban areas by combining LOPA and RISKCURVES software to determine whether the risk was reduced using passive or active independent protection layers (IPLs). A qualitative risk analysis (QRA) was performed using RISKCURVES, and F–N curve analysis was used to verify that there was a safety concern when hydrogen refueling stations are installed in urban areas. LOPA’s passive and active independent protection layers (IPLs) have been used to mitigate the risk caused by the increase in hydrogen refueling stations in urban areas. It was also confirmed whether the risk mitigated by IPLs was located in the as low as reasonably practicable (ALARP) region through the F–N curves of RISKCURVES. As a result, the safety effect of each IPL installed at the hydrogen refueling station was verified and compared.

2. Materials and Methods

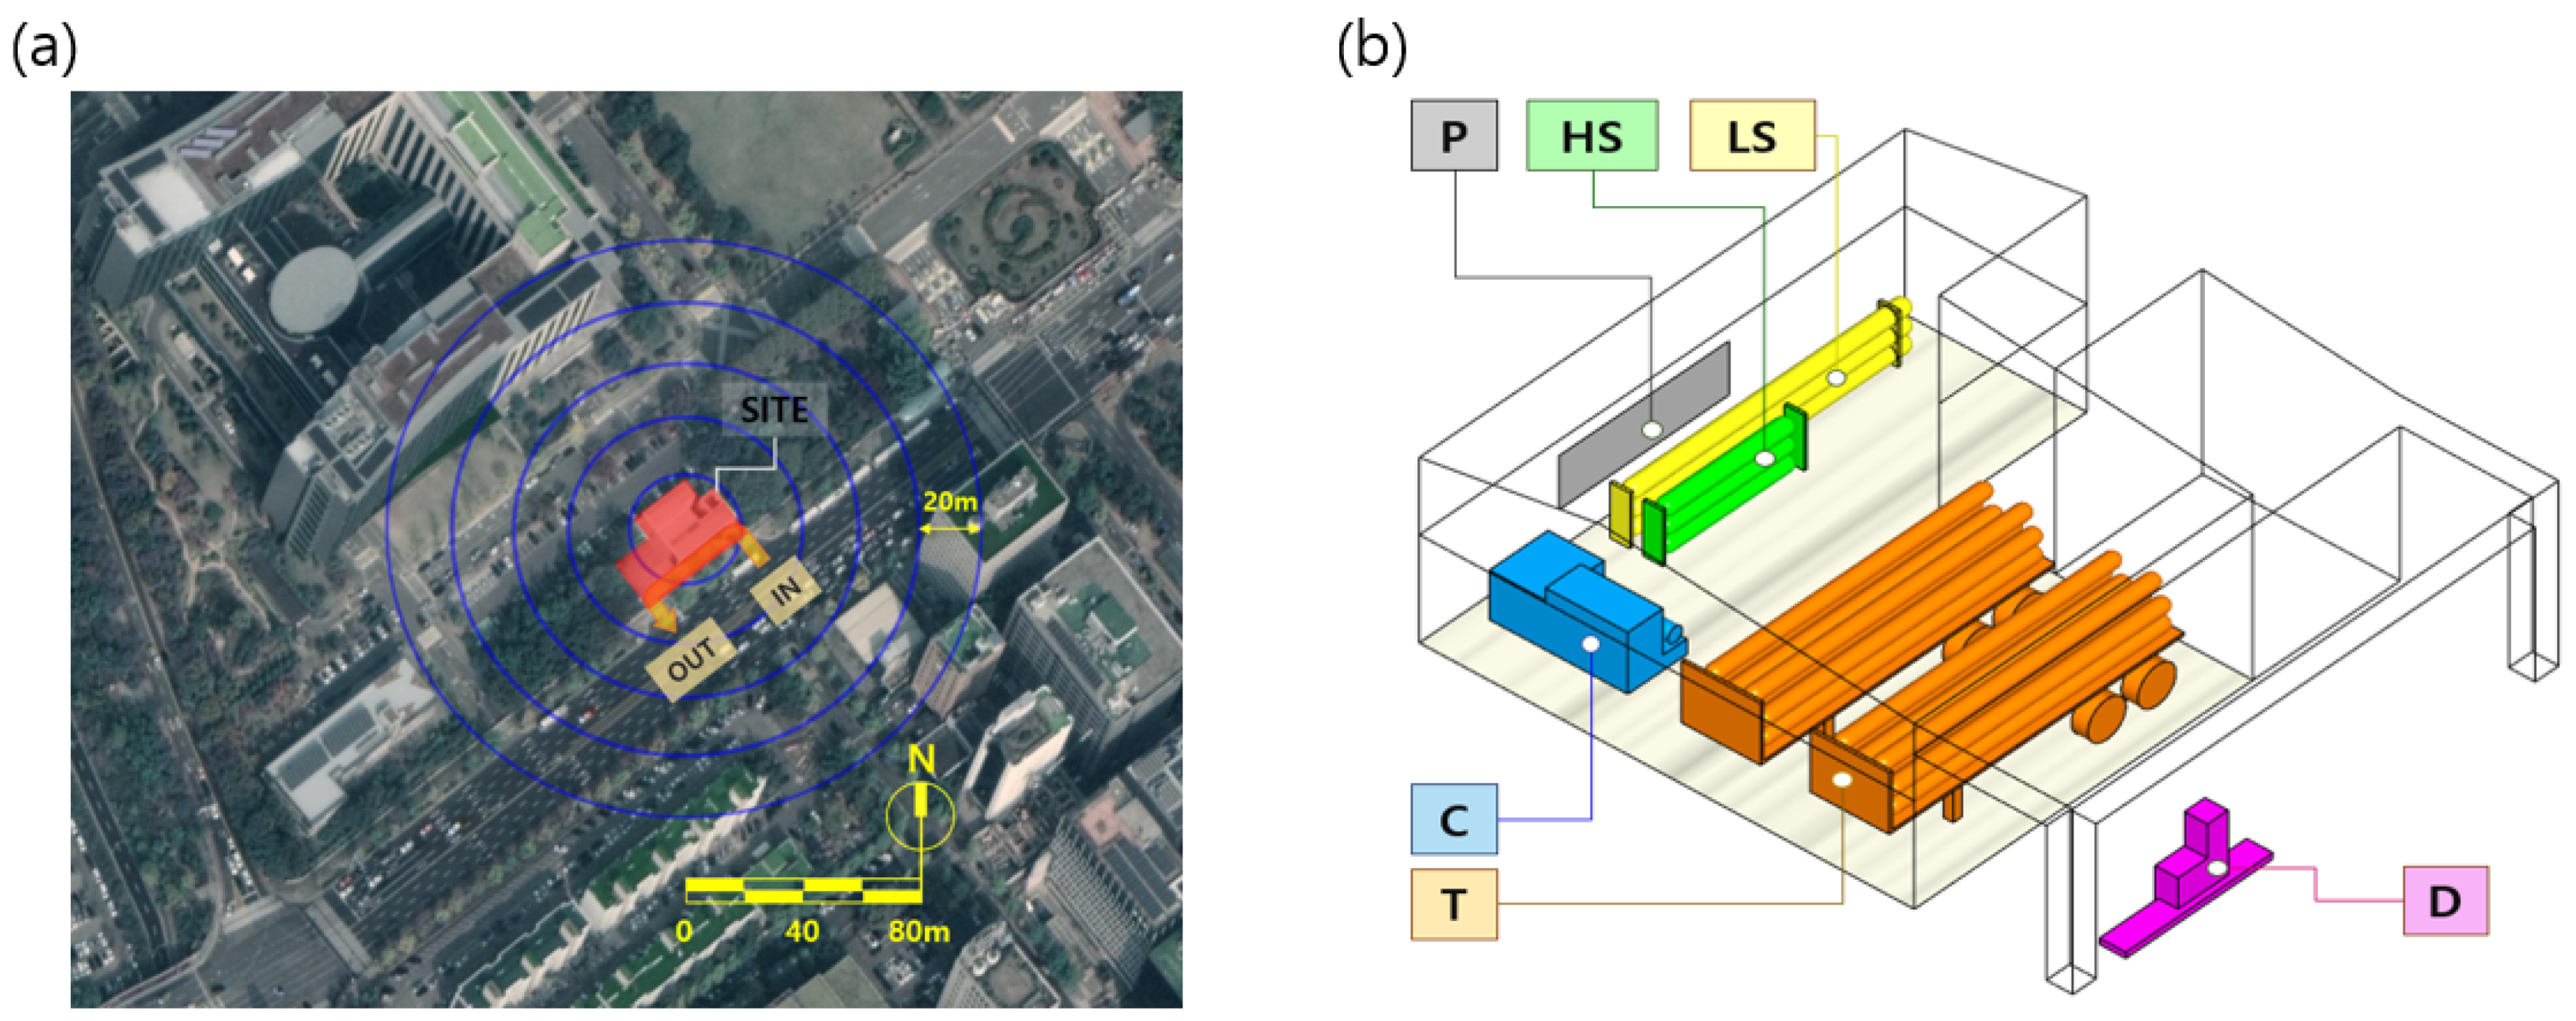
2.1. Risk Assessment Using RISKCURVES

The method of quantifying the risk of industrial facilities can be largely classified into risk index (RI), individual risk (IR), and societal risk (SR). To evaluate the risk of the urban expansion of hydrogen refueling station facilities, individual risks that consider the risk of individuals within the affected area of the accident and societal risk that considers the risk to the population within the impact area of the accident were used. RISKCURVE (Gexcon, Norway) was used to analyze the degree of damage to nearby buildings and residents from the explosion of a hydrogen refueling station. Individual and societal risks due to jet fires that may occur in hydrogen refueling stations were calculated. Figure 1a shows a map of the surrounding environment of hydrogen refueling stations, including sidewalks, parking lots, and driveways. The hydrogen refueling station is located between the outdoor parking lot and the sidewalk and has a driveway next to the sidewalk. Commercial buildings, apartments and subway platforms are located 60 m, 80 m, and 100 m away from the hydrogen refueling station, respectively. The average daily charging capacity of a hydrogen refueling station is approximately 280 kg. Figure 1b shows a schematic of the hydrogen refueling station facilities. Five of the major facilities at the hydrogen refueling station are located in the facility area (tube trailer (T), high-pressure hydrogen storage (HS), low-pressure hydrogen storage (LS), compressor (C), and priority panel (P)), while the dispenser (D) is located in the refueling area.
In RISKCURVES, individual risk was calculated using Equations (1) and (2) [33].
  I R x , y = i = 1 n I R x , y , i
I R x , y , i = f i   P f , i
where IRx,y is the total individual risk of death at geographic location “x, y” IRx,y,i is the individual risk of death at geographic location “x, y” in accident case “ifi is the frequency of accident case “i” and Pf,i is probability of accident case “i” causing death at location “x, y”. The results of these calculations accounted for the individual risk through a risk contour.
The method of calculating the F–N curve to determine societal risk, which is similar to the method of calculating individual risk, is expressed in Equation (3). The number of people affected by each accident should be combined to determine the societal risk.
Ni = x , y P x , y P f , i
where Ni is the number of deaths caused by accident case “i” and Px,y is number of people at location “x, y”.
The societal risk is the cumulative frequency of accidents that can cause any number of casualties and is typically expressed as an F–N curve representing the number of deaths (N) and the frequency analysis (F) for accidents. The risk analysis using the F–N curve was performed at three locations: (a) sidewalk (location I), (b) parking lot (location II), and (c) driveway (location III); the number of people used in the calculation is listed in Table 1. Table 2 presents the initial conditions used for RISKCURVES. The probability of accidents at the hydrogen station facility was analyzed by assuming the worst-case scenario. The F–N curve is expressed numerically by converting the number of disasters that can cause harm to many people per year. The F–N curve can be classified into three regions (i.e., acceptable region, as low as reasonably practical (ALARP), and unacceptable region), and different standards exist for different countries [34,35]. In this study, various international criteria were applied to determine the societal risk. For the hydrogen refueling station, the leakage frequency data according to the leak size of the hydrogen facility presented by Sandia National Laboratory were applied [36]. Table 3 summarizes the probability of the occurrence of accidents related to facilities of hydrogen refueling stations in terms of pressure, leakage size, leakage rate, and leak frequency.

2.2. Active/Passive Individual Protection Layers

After evaluating the societal risk through the F–N curve, the IPLs of LOPA, which is a semi-quantitative risk assessment method widely used in chemical plants, was applied to mitigate the societal risk in hydrogen refueling stations. To install and operate a facility that handles hazardous chemicals in South Korea, similar to the EPA’s risk management program (RMP) in the United States, an off-site risk assessment must be submitted, which ensures sufficient safety for the handling facility. The degree of safety improvement of passive and active IPLs was estimated using the probability of failure on demand (PFD) prepared by a safety specialized agency such as CCPs and IEC [28,37,38,39]. The PFDs of the general passive and active IPLs used in this study are listed in Table 4 and Table 5, respectively. Individual and societal risk analyses were performed again using various IPLs, and the effectiveness of the IPLs was verified. The IPLs applied in this study were presented in Table 6. The degree of risk reduction when using active/passive IPLs was compared, and the necessity of IPLs was confirmed according to the installation of hydrogen refueling stations in urban areas.

3. Results and Discussion

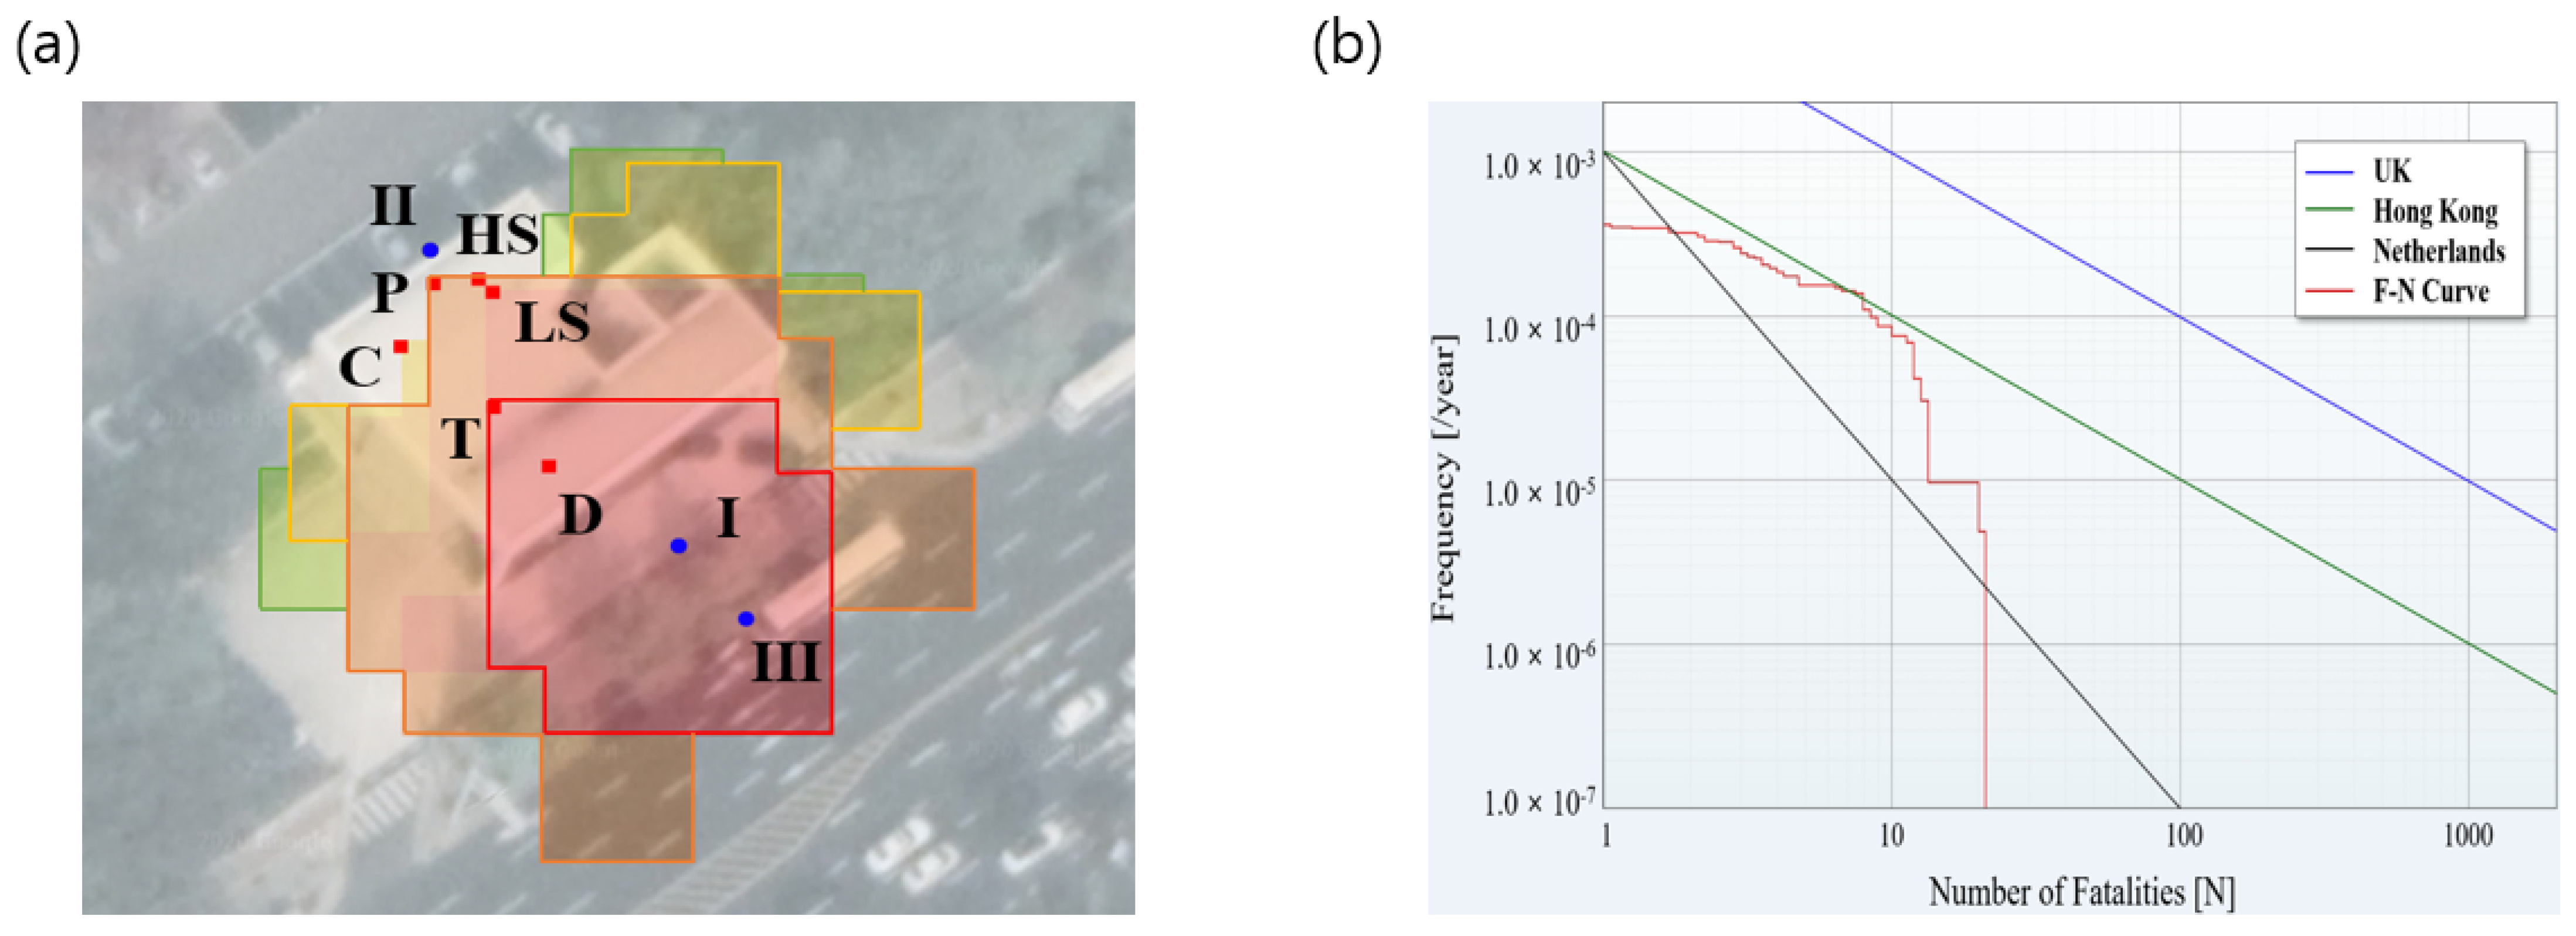
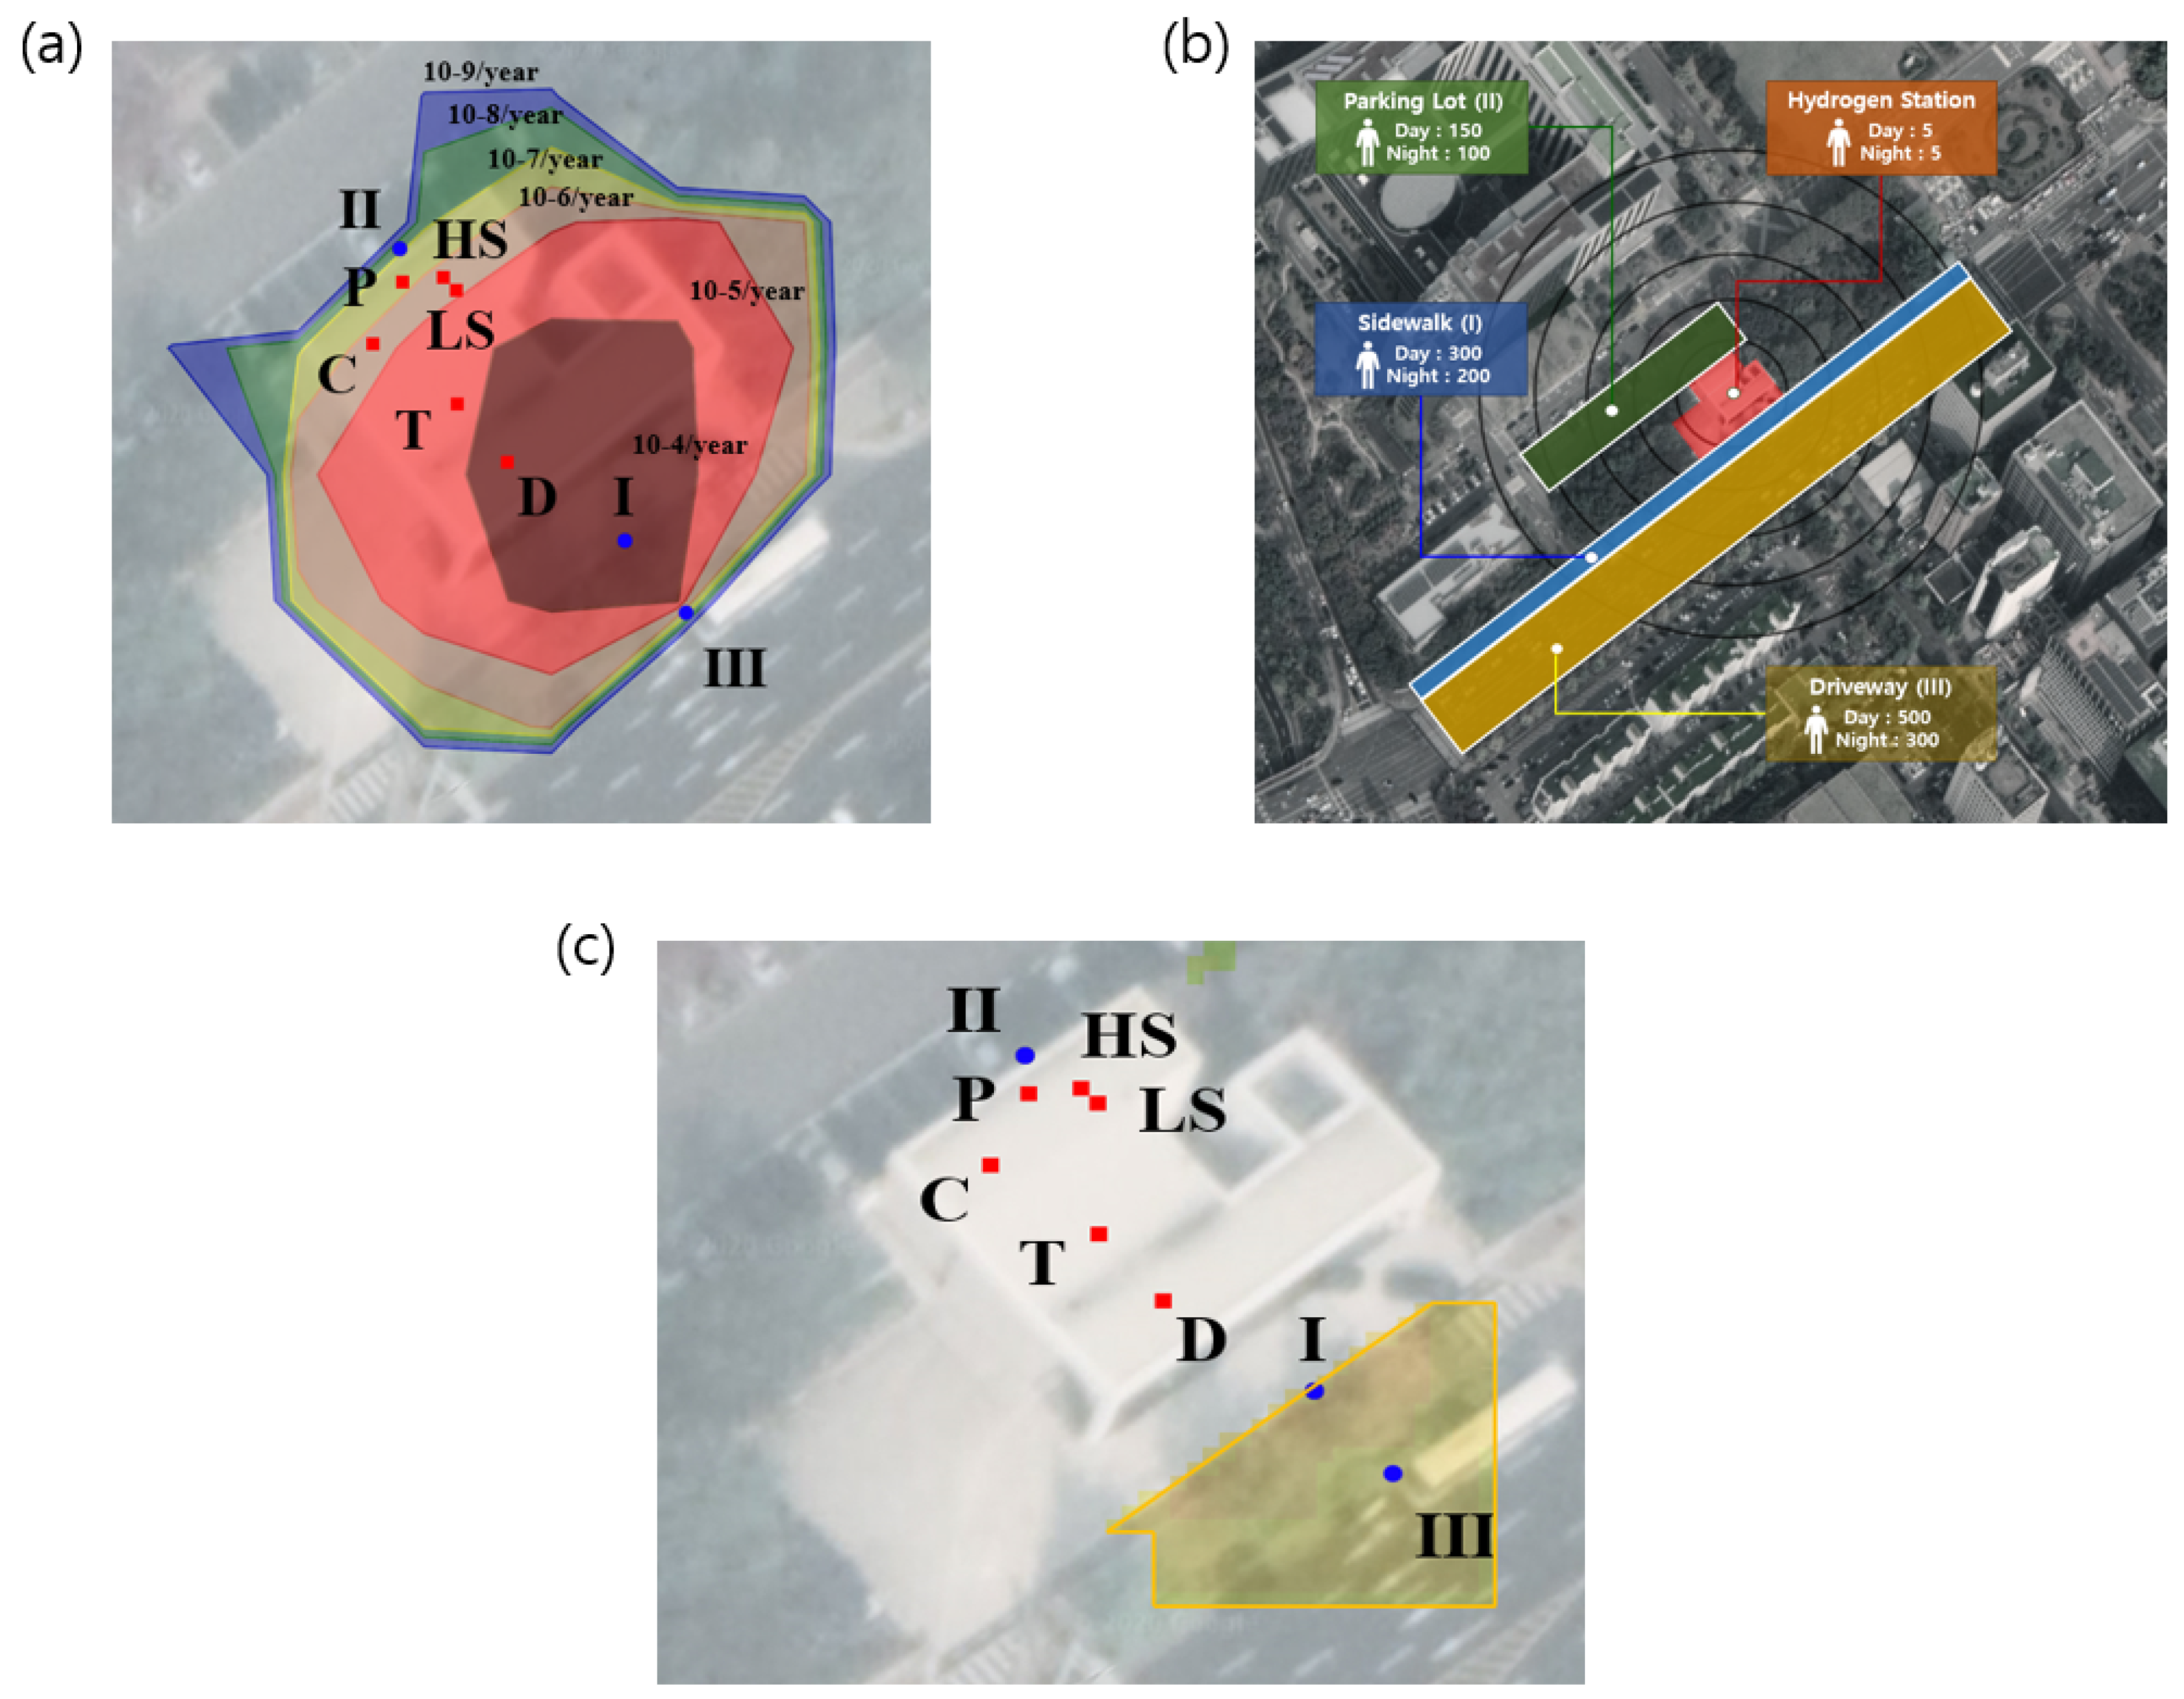
3.1. Risk Assessment without IPLs

Figure 2 shows the results of the individual risk analysis for each facility and its location in the hydrogen refueling station. The analysis results were based on the frequency and probability of accidents at hydrogen-related facilities. Detailed analysis results are presented in Table S1. The highest individual risk was analyzed in the dispenser (D), and the priority panel (P) showed the lowest value among the six facilities, as shown in Figure 2a. It was confirmed that the individual risk of the dispenser (D) and the tube trailer (T) are higher than those of other facilities, and hence, they need additional safety measures. For example, a dispenser among hydrogen refueling station facilities means that there is a possibility of 10−4 times per year due to jet fires. The high individual risks are attributed to the high likelihood of pressure leakage from the dispenser and the lack of legal minimum requirements for tube trailers [40]. The information regarding the three locations is shown in Figure 2b. The number of inhabitants of the driveway and sidewalk was relatively higher than that of the parking lot. Figure 2c shows the contribution of each place to the analysis of individual risk on a map. The individual risk was higher in the sidewalk (2.54 × 10⁻⁴/year) and driveway (7.63 × 10⁻⁵/year) because there was a relatively large frequency of accident around the hydrogen refueling station compared to the parking lot (2.30 × 10⁻⁹/year). Detailed analysis results are presented in Table S2.
Figure 3 shows the societal risk analysis when IPLs are not applied. Figure 3a presents the results of the societal risk contribution analysis, and the areas that exhibit relatively high potential risks are marked in green, yellow, and red on the map. It means that the relative risk contributions of the dispenser and tube trailer are higher than those of other hydrogen facilities. It also showed that the relative societal risk was high in places near sidewalks and driveways because of large populations. Figure 3b shows the societal risk of installing a hydrogen refueling station in an urban area using risk acceptance criteria for quantitative risk analysis (QRA) of the UK, Hong Kong, and the Netherlands. In the study of Jonkman et al. (2003), the above region of the F–N curve is classified as an unacceptable or intolerable risk zone [34]. The societal risk of hydrogen facilities marked in red is below the UK, while being above the Netherlands and Hong Kong. As a result of social risk analysis applying the distribution of population around hydrogen refueling stations, it was confirmed that preventive measures to ensure safety against explosions met the allowable standards in the UK but not those in Hong Kong and the Netherlands. These results indicate that safety problems may arise when the hydrogen refueling station is expanded to urban areas in the near future.

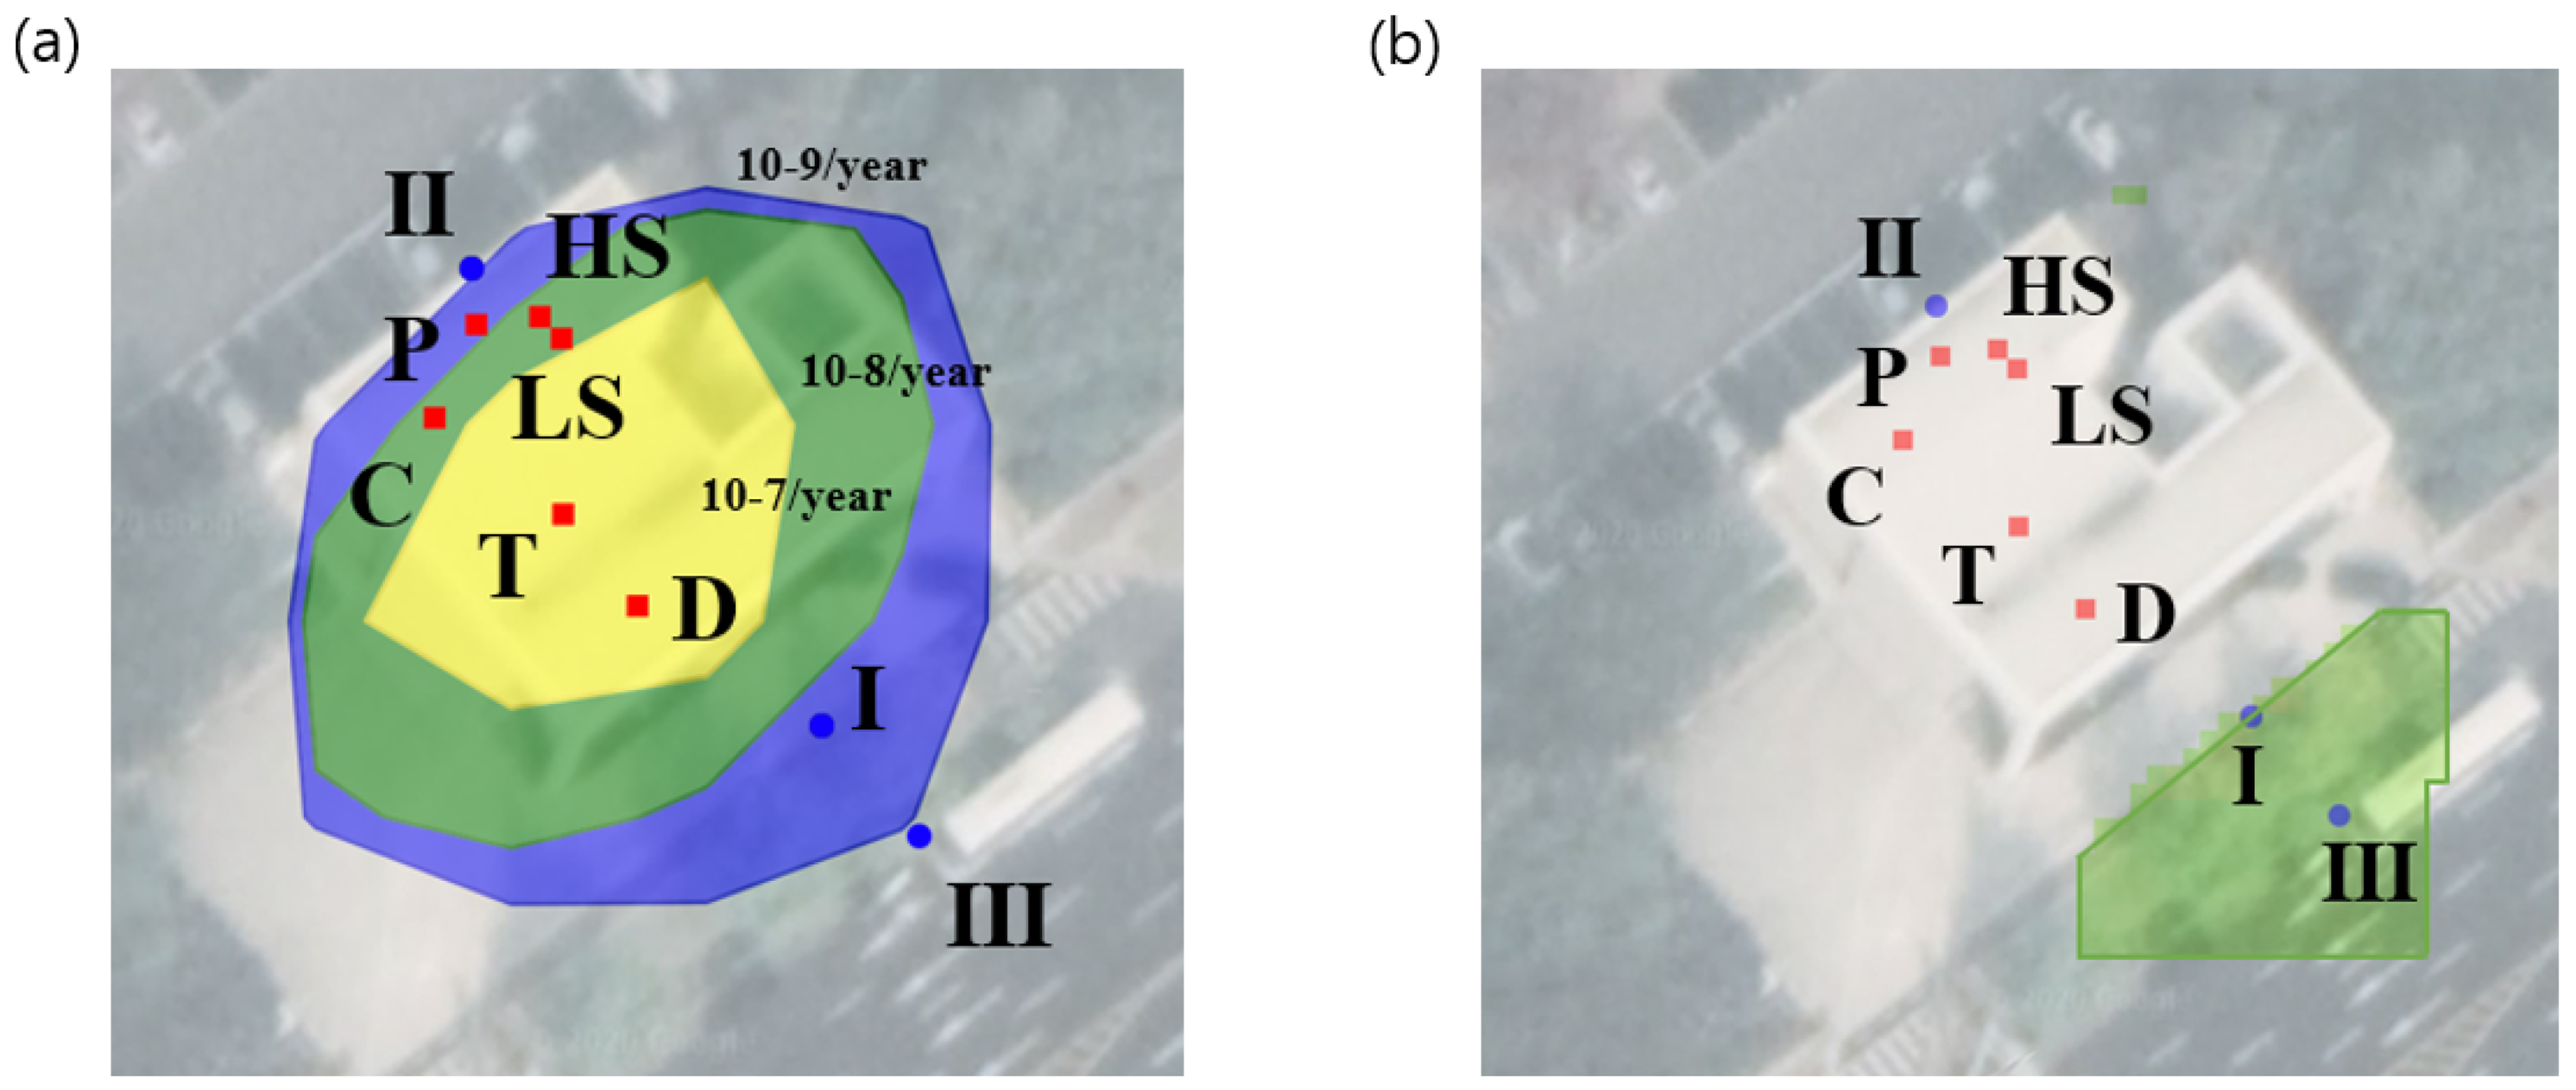
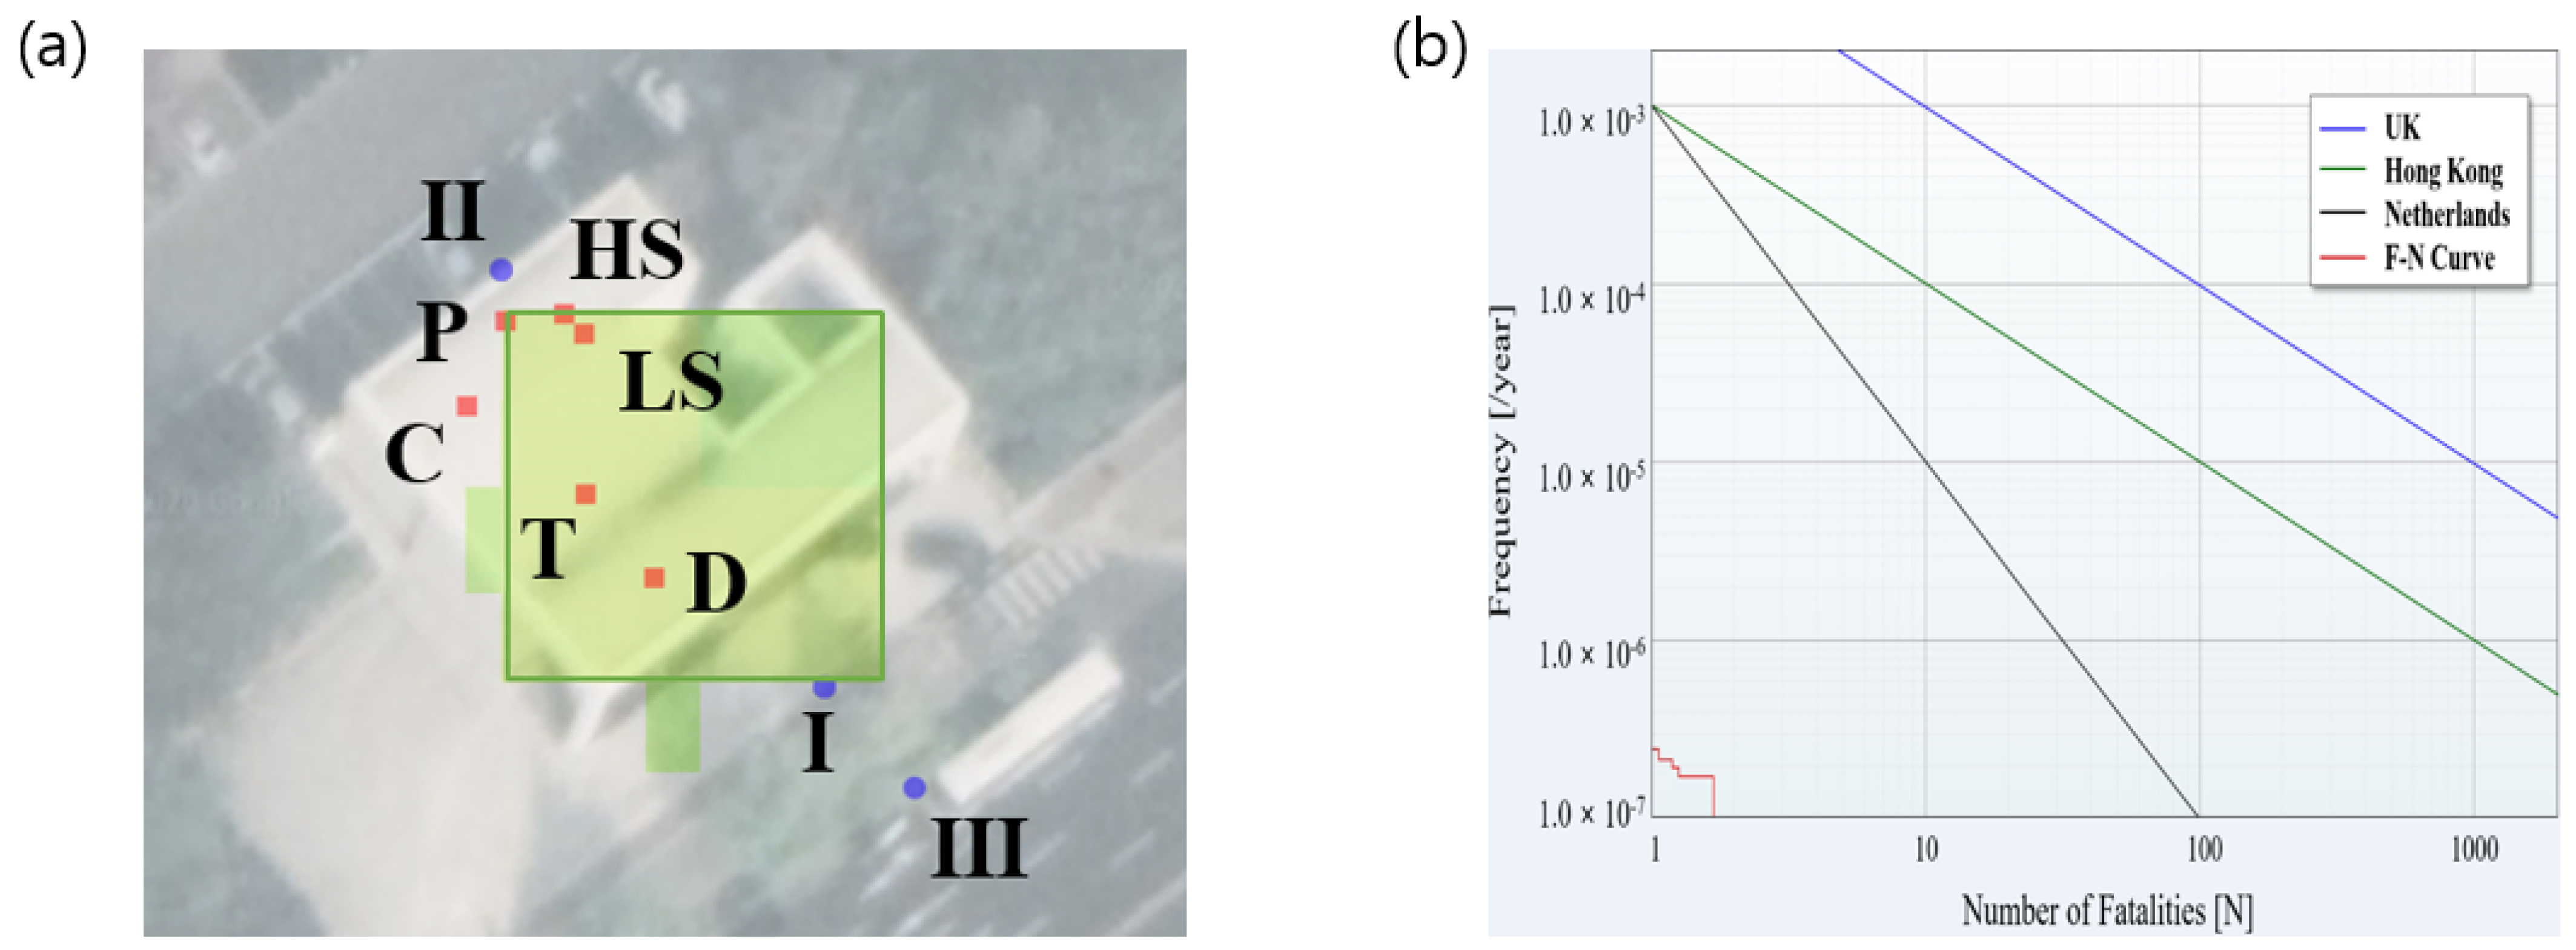
3.2. Risk Assessment with Passive IPLs

Figure 4a shows the individual risks of applying passive IPLs to the map. It was confirmed that the risk of jet fire was significantly reduced compared to the case where the IPLs were not applied, as shown in Figure 2a. In particular, it can be seen that the dangerous zone marked in dark red disappears and turns yellow. The risk was significantly lower compared to the case where IPLs were not applied. This means that passive IPLs are an efficient solution to secure the safety. Although the individual risk was greatly mitigated in the dispenser and tube trailer (yellow), their risks were still higher than those of other hydrogen facilities. Figure 4b presents the results of analyzing the individual risk of passive IPLs of three locations. Sidewalks (4.15 × 10⁻⁸/year) and driveways (7.13 × 10⁻⁹/year) showed a greater risk than parking lots (2.30 × 10⁻¹¹/year). There were many differences in the individual risk of each position between cases with and without passive IPLs, and the corresponding individual risk was reduced from approximately 103 to 104 without IPLs. Although the risk did not completely disappear, it was found that passive IPLs greatly contributed to the safety improvement.
Figure 5 shows the results of applying passive IPLs to reduce the societal risk of facilities at hydrogen refueling stations. Figure 5a shows the results of the societal risk contribution analysis for each hydrogen refueling facility. When passive IPLs were installed, it was confirmed that the societal risk of the dispenser with the greatest value was significantly reduced. The risk of jet fire from tube trailers, dispensers and low pressure H2 reservoirs has been greatly reduced due to the application of passive IPLs. In the case where passive IPLs were installed, the risk was reduced by more than 103 times compared to the case where IPLs were not applied. In Figure 5b, international criteria are compared through the F–N curve when passive IPL is applied. When passive IPLs are applied, the societal risk is much lower than those of the UK, the Netherlands, and Hong Kong. Moreover, safety measures of hydrogen station facilities are considerably improved when these protection techniques are applied. Detailed data comparing the safety of cases with passive IPLs and no IPLs are presented in Table S3.

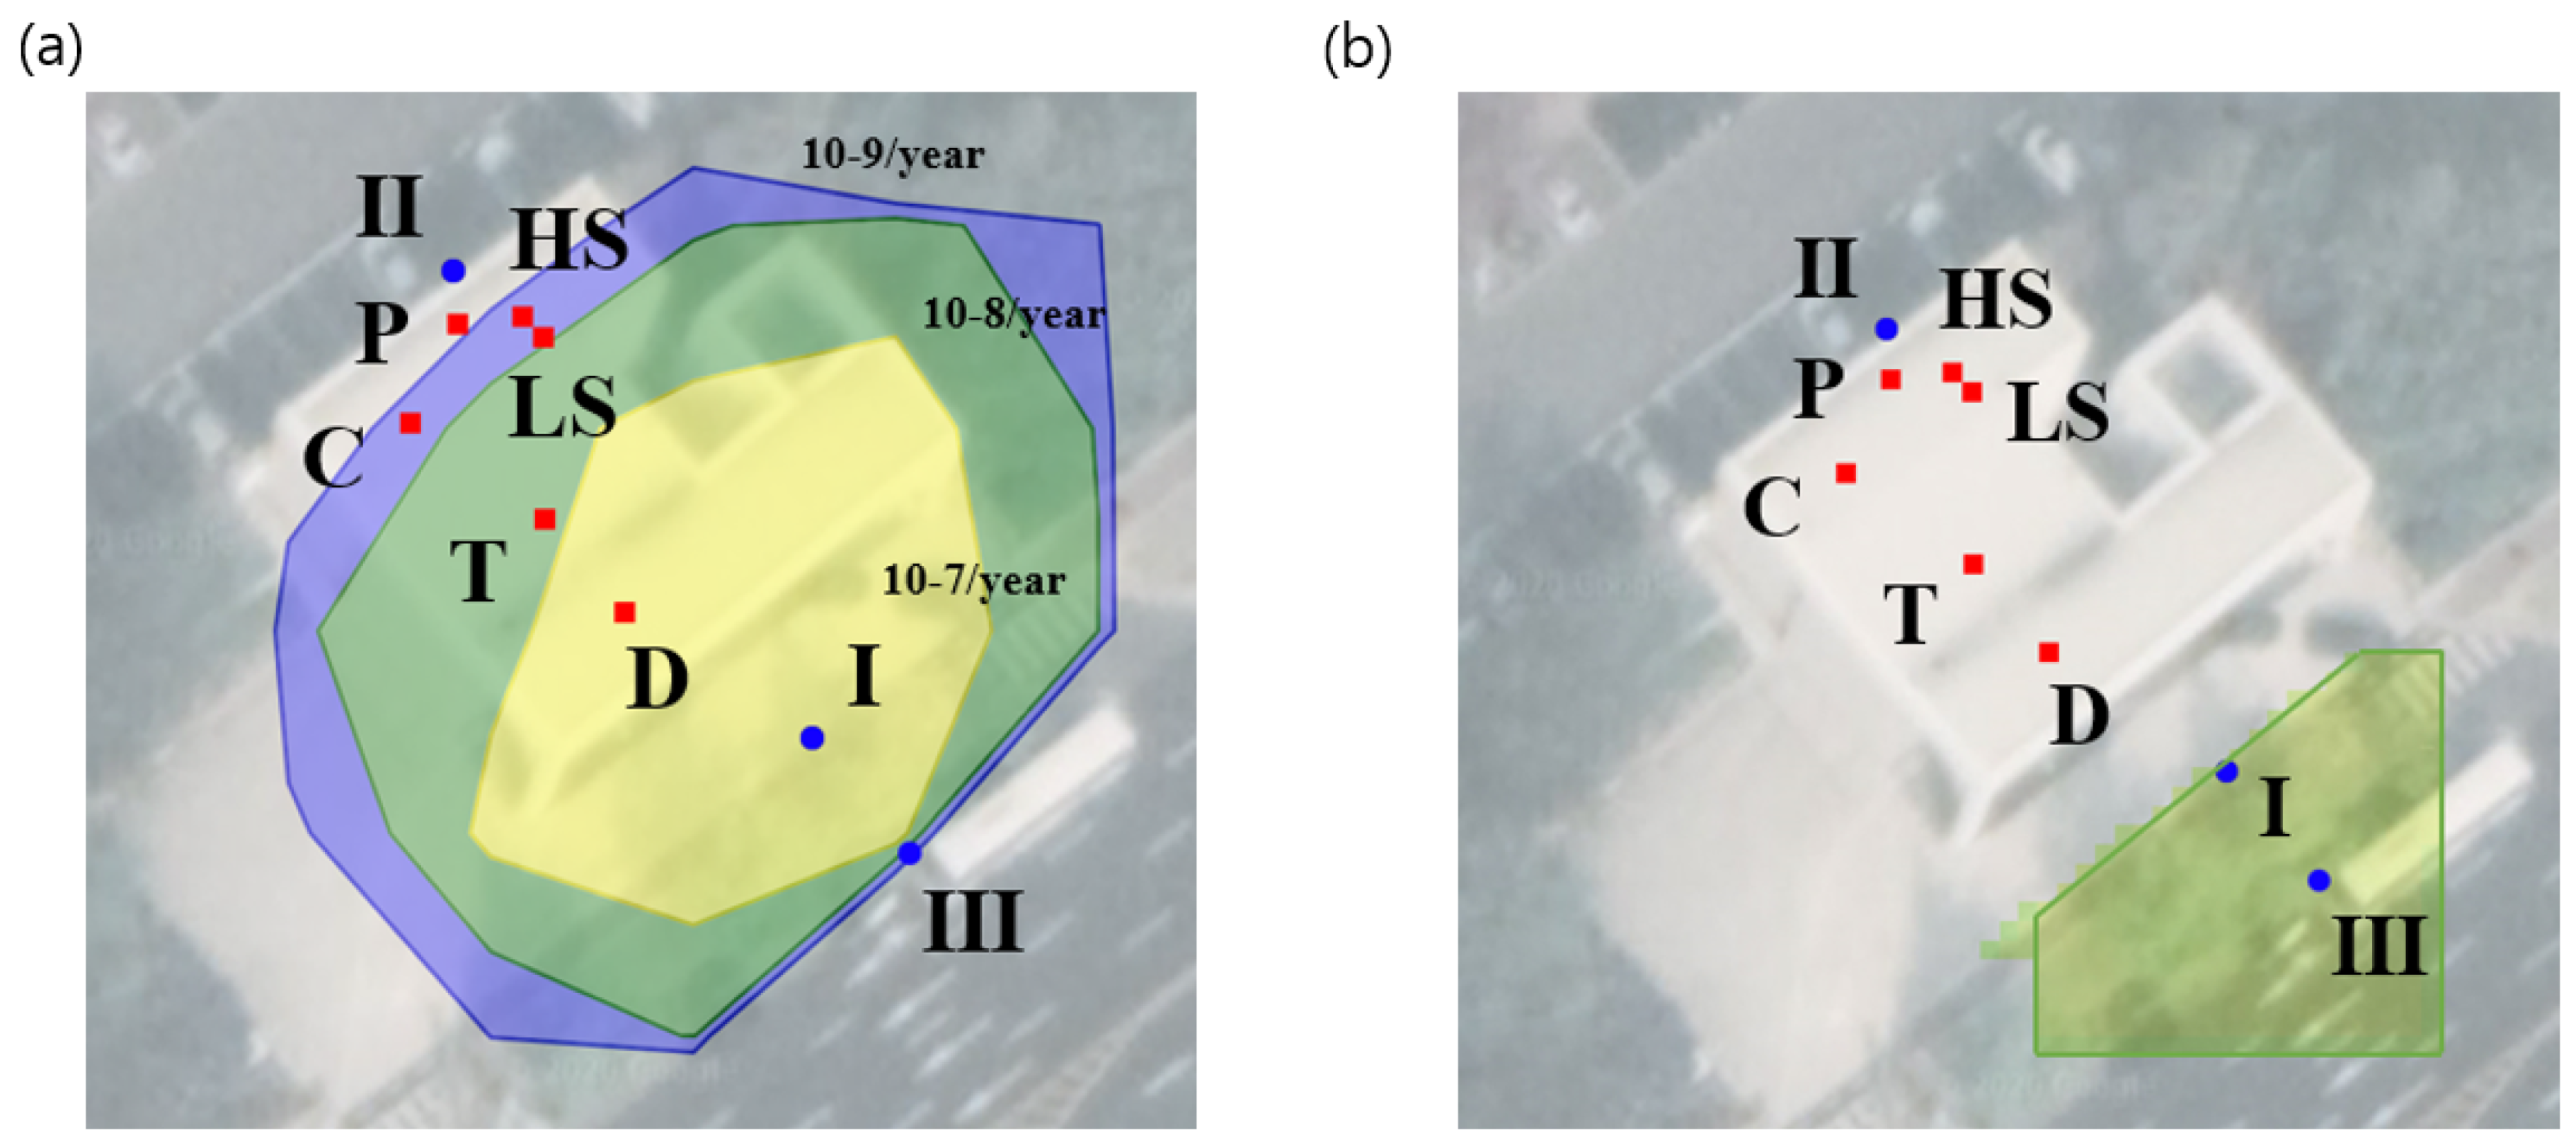
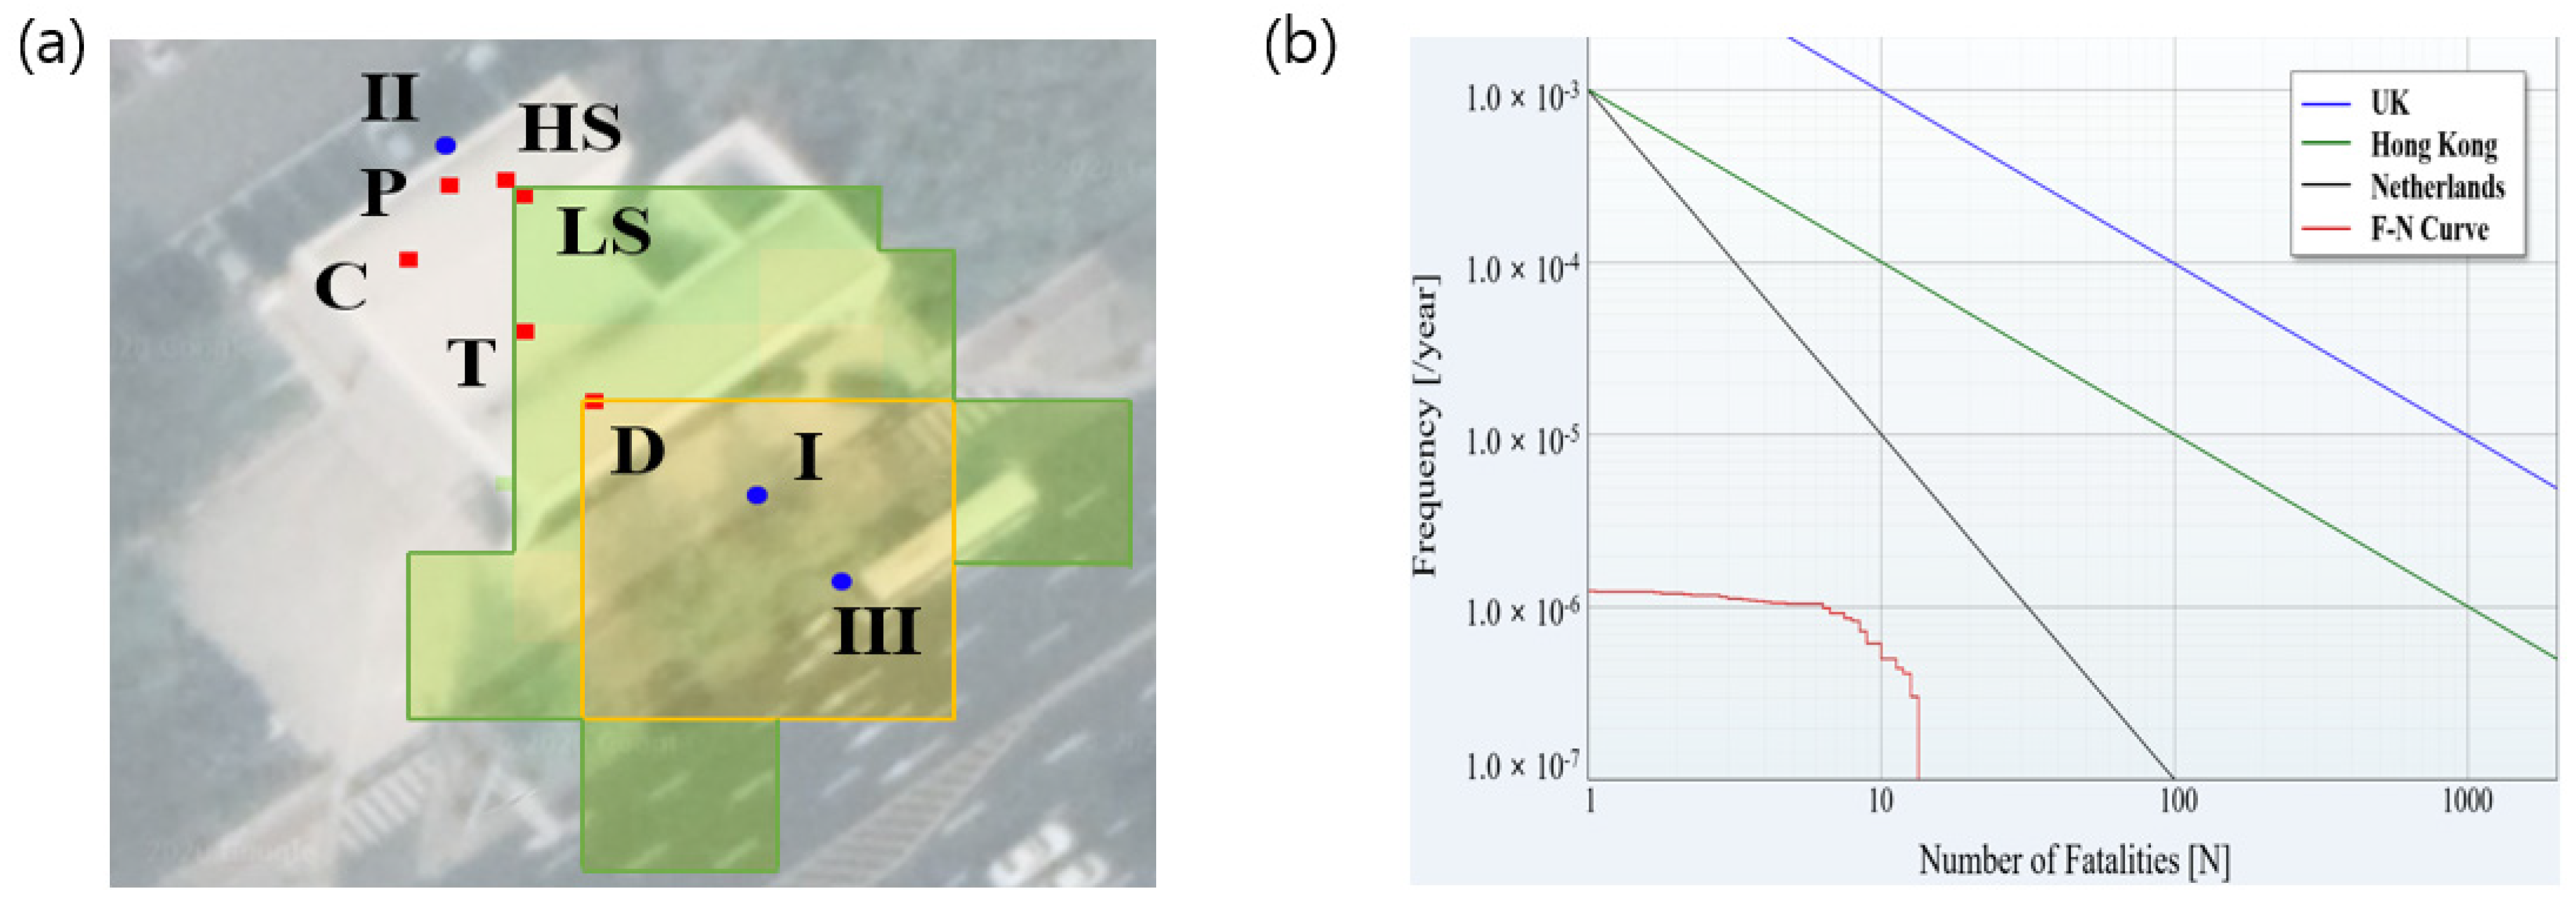
3.3. Risk Assessment with Active IPLs

Figure 6 and Figure 7 show how the risk changes when applying active IPLs compared to the case where IPLs are not applied; they also indicate how individual and social risks change when applying active IPLs compared to the case of applying passive IPLs. Figure 6a shows the results of the changes in individual risk. Although individual risk in the dispenser and sidewalk still exists, it can be said to be an effective safety measure compared to the case where IPLs are not applied. Compared to the case where IPLs were not applied, individual risks differed for the hydrogen facilities but decreased by 100 to 1000 times. These results imply that active IPLs applied to hydrogen-refilling facilities provide effective safety methods. Nevertheless, the individual risks of the case with active IPLs were at least 10 to 100 times greater than those of the case with passive IPLs. These results imply that the use of passive IPLs is a more effective protective measure for reducing individual risk. Figure 6b shows the contribution of individual risk. The risk slightly increased compared to passive IPLs, but the risk significantly decreased compared to the case where IPLs were not applied. Sidewalks (9.66 × 10⁻⁷/year) and driveways (7.18 × 10⁸/year) showed a greater risk than parking lots (2.30 × 10⁻¹²/year).
Figure 7 shows the results of the societal risk analysis based on the use of active IPLs. In Figure 7a, the contribution of societal risk due to jet fires in hydrogen refueling facilities is presented. In the case of protective measures using active IPLs, the contribution and societal risk of the dispenser were found to be the greatest. It was also found that it contributes to the reduction in societal risk compared to without IPLs. When applying active IPLs, the societal risk of dispensers, tube trailers, and H2 storage increased significantly compared to the case when using passive IPLs, and the risk of jet fires also occurred in adjacent sidewalks and driveways. Figure 7b shows the results of the F–N curve analysis. F–N curves obtained after applying active IPLs met the criteria of the UK, the Netherlands, and Hong Kong but did not appear to be superior to those from the case of using passive IPLs in terms of societal risk. The analysis results for scenarios without IPLs and passive and active IPLs are presented in Table S3.

4. Conclusions

With the growing interest in eco-friendly hydrogen energy, 320 hydrogen refueling stations will be built in South Korea by 2022. Most of the existing hydrogen refueling stations have been installed in rural areas; however, because hydrogen-related facilities are being expanded to urban areas, concerns about jet fires caused by hydrogen leakage have been raised. In this study, a new risk assessment method that combines the advantages of LOPA and a new risk assessment analysis method proven by RISKCURVES was applied to a hydrogen refueling station. Through protective measures such as the use of passive and active IPLs, the degree of risk reduction was confirmed, and the effectiveness was compared. As a result, it has been shown that appropriate protective measures are essential for the safety of residents in order to increase hydrogen refueling stations in urban areas. Without these measures, it is judged that the installation of hydrogen refueling facilities in urban areas would increase the risk of explosion.
QRA was performed using RISKCURVES, assuming that a hydrogen refueling station was installed in an urban area. Of the six facilities, the individual risk was greatest for dispensers and tube trailers, possibly due to the high possibility of hydrogen leaks and lack of safety regulations. Among the three locations (parking lot, sidewalk, and driveway), sidewalks showed the highest individual risk. According to the societal risk analysis, dispensers, tube trailers, and priority panels pose a relatively higher risk than other hydrogen facilities. Risk analysis results using the F–N curve met the criteria of the UK but not those of Hong Kong and the Netherlands, and it was found that additional safety measures were necessary.
Attempts to lower individual and societal risk by applying LOPAs’ passive IPLs are very effective and are proven to be necessary to expand hydrogen charging stations to urban areas in the future. When passive IPLs were applied, the risk of hydrogen refueling facilities decreased from 104 to 108 times compared to the case without passive IPLs. The effectiveness of this technique was reflected in the F–N curve analysis and satisfied all of the criteria of the UK, Hong Kong, and the Netherlands.
When active IPLs were applied, the safety was higher compared to the case without IPLs; however, the efficiency was found to be inferior to that of the case with passive IPLs. If IPLs are not applied, the dispenser has the highest societal risk. The application of active IPLs increased the risk by approximately 105 times compared to application of passive IPLs. However, compared to the case where IPLs were not applied, the societal risk was reduced by 100 times. According to the F–N curve analysis, all criteria of the UK, Hong Kong, and the Netherlands were satisfied; however, the societal risk was higher than that when using passive IPLs.
Existing computation fluid dynamics (CFD) analysis took a lot of time and effort, such as setting boundary conditions, etc., but RISKCURVES has the advantage of being able to evaluate risk in a relatively short time and expand the scope of the space to the entire city. Therefore, LOPA-RISKCURVES technology can be used not only for hydrogen facilities, but also for risk assessment and risk reduction in hazardous materials with high fire or explosive risk through protective measures. It has been confirmed that it is not appropriate to increase hydrogen refueling stations in urban areas unless safe protective measures are preceded. Through the installation of passive or active IPLs, it was possible to secure safety at hydrogen refueling stations in urban areas.

Supplementary Materials

The following are available online at https://www.mdpi.com/article/10.3390/en14134043/s1, Table S1: Summary of with/without IPLs, Table S2: Summary of individual risk for each position, Table S3: Summary of societal risk with/without IPLs.

Author Contributions

Conceptualization, C.K. and Y.K.; methodology, B.P.; software, B.P.; validation, K.L. and S.P.; formal analysis, B.P.; data curation, C.K. and B.P.; writing—original draft preparation, C.K. and Y.K.; writing—review and editing, B.P.; visualization, B.P.; supervision, C.K. and Y.K.; project administration, Y.K.; funding acquisition, Y.K. All authors have read and agreed to the published version of the manuscript.

Funding

This research was funded by the Fire Safety Agency’s ESS Hydrogen Facility Fire Safety Technology Research and Development Project (No. 20011579).

Institutional Review Board Statement

Not applicable.

Informed Consent Statement

Not applicable.

Data Availability Statement

Not applicable.

Conflicts of Interest

The authors declare no conflict of interest.

Abbreviation

AbbreviationMeaning
LOPALayer of Protection Analysis
QRAQuantitative Risk Assessment
FTAFault Tree Analysis
HAZOPHazard and Operability Analysis
FMEAFailure Mode Effect Analysis
GRAGeneric Risk Analysis
CCPSCenter for Chemical Process Safety
IPLsIndependent Protection Layers
ALARPAs low As Reasonably Practicable
IRIndividual Risk
SRSocietal Risk
F–N curveFrequency–Number of Fatalities Curve
RMPRisk Management Program
EPAEnvironmental Protection Agency
PFDProbability of Failure on Demand
IECInternational Electrotechnical Commission
CFDComputation Fluid Dynamics

References

  1. Zhang, B.; Wu, Y. Recent advances in improving performances of the lightweight complex hydrides Li-MgN-H system. Prog. Nat. Sci. Mater. Int. 2017, 27, 21–33. [Google Scholar] [CrossRef]
  2. Deveci, M. Site selection for hydrogen underground storage using interval type-2 hesitant fuzzy sets. Int. J. Hydrog. Energy 2018, 43, 9353–9368. [Google Scholar] [CrossRef]
  3. Abe, J.O.; Popoola, A.P.I.; Ajenifuja, E.; Popoola, O.M. Hydrogen energy, economy and storage: Review and recommendation. Int. J. Hydrog. Energy 2019, 44, 15072–15086. [Google Scholar] [CrossRef]
  4. Sahaym, U.; Norton, M.G. Advances in the application of nanotechnology in enabling a ‘hydrogen economy’. J. Mater. Sci. 2008, 43, 5395–5429. [Google Scholar] [CrossRef] [Green Version]
  5. Jovan, D.J.; Dolanc, G. Can green hydrogen production be economically viable under current market conditions. Energies 2020, 13, 6599. [Google Scholar] [CrossRef]
  6. Staffell, I.; Scamman, D.; Abad, A.V.; Balcombe, P.; Dodds, P.E.; Ekins, P.; Shah, N.; Ward, K.R. The role of hydrogen and fuel cells in the global energy system. Energy Environ. Sci. 2019, 12, 463–491. [Google Scholar] [CrossRef] [Green Version]
  7. De Miranda, P.E. Science and Engineering of Hydrogen-Based Energy Technologies, 1st ed.; Academic Press: New York, NY, USA, 2018; pp. 33–45. [Google Scholar]
  8. Liu, Y.; Liu, Z.; Wei, J.; Lan, Y.; Yang, S.; Jin, T. Evaluation and prediction of the safe distance in liquid hydrogen spill accident. Process Saf. Environ. Prot. 2021, 146, 1–8. [Google Scholar] [CrossRef]
  9. Hansen, O.R. Hydrogen infrastructure- Efficient risk assessment and design optimization approach to ensure safe and practical solutions. Process Saf. Environ. Prot. 2020, 143, 164–176. [Google Scholar] [CrossRef]
  10. Crowl, D.A.; Jo, Y.D. The hazards and risks of hydrogen. J. Loss Prev. Process Ind. 2007, 20, 158–164. [Google Scholar] [CrossRef]
  11. Pan, X.; Yan, W.; Jiang, Y.; Wang, Z.; Hua, M.; Wang, Q.; Jiang, J. Experimental investigation of the self-ignition and jet flame of hydrogen jets released under different conditions. ACS Omega 2019, 4, 12004–12011. [Google Scholar] [CrossRef] [Green Version]
  12. Alternative Fueling Station Counted by State. Available online: https://afdc.energy.gov/stations/states (accessed on 14 June 2021).
  13. Hydrogen Mobility Europe. Available online: https://h2me.eu/about/ (accessed on 13 June 2021).
  14. Chaybe, A.; Chapman, A.; Shigetomi, Y.; Huff, K.; Stubbins, J. The role of hydrogen in archiving long term Japanese energy system goals. Energies 2020, 13, 4539. [Google Scholar] [CrossRef]
  15. Jaworski, J.; Kulaga, P.; Blacharski, T. Study of the effect of addition of hydrogen to natural gas on diaphragm gas meters. Energies 2020, 13, 3006. [Google Scholar] [CrossRef]
  16. Matsuoka, S.; Yamabe, J.; Matsunaga, H. Criteria for determing hydrogen compatibility and the mechanism for hydrogen-assisted, surface crack growth in austenitic stainless steels. Eng. Fract. Mech. 2016, 153, 103–127. [Google Scholar] [CrossRef]
  17. Wessiani, N.A.; Yoshio, F.Y. Failure mode effect analysis and fault tress analysis as a combined methodology in risk management. In IOP Conference Series: Materials Science and Engineering; IOP Publishing: Bristol, UK, 2018; Volume 337, p. 012033. [Google Scholar]
  18. Fuentes-Bargues, J.L.; González-Cruz, M.C.; González-Gaya, C.G.; Baixauli-Pérez, M.P. Risk analysis of a fuel storage terminal using HAZOP and FTA. Int. J. Environ. Res. Public Health 2017, 14, 705. [Google Scholar] [CrossRef]
  19. Chief Fire & Rescue Adviser. Fire and Rescue Service Operation Guidance: GRAs Generic Risk Assessments, 1st ed.; TSO (The Stationery Office): Norwich, UK, 2009; pp. 1–26. [Google Scholar]
  20. Suzuki, T.; Shiota, K.; Izato, Y.; Komori, M.; Sato, K.; Takai, Y.; Ninomiya, T.; Miyake, A. Quantitative risk assessment using a Japanese hydrogen refueling station model. Int. J. Hydrogen Energy 2021, 46, 8329–8343. [Google Scholar] [CrossRef]
  21. Hansen, O.R.; Middha, P. CFD-based risk assessment for hydrogen applications. Process Saf. Prog. 2008, 27, 29–34. [Google Scholar] [CrossRef]
  22. Russo, P.; De Marco, A.; Parisi, F. Assessment of the damage from hydrogen pipeline explosions on people and buildings. Energies 2020, 13, 5051. [Google Scholar] [CrossRef]
  23. Overview of Software. Available online: https://link.springer.com/content/pdf/bbm%3A978-1-84628-717-6%2F1.pdf (accessed on 28 March 2021).
  24. Groth, K.M.; Hecht, E.S. HYRAM: A methodology and toolkit for quantitative risk assessment of hydrogen systems. Int. J. Hydrogen Energy 2017, 42, 7485–7493. [Google Scholar] [CrossRef] [Green Version]
  25. Jallais, S.; Vyazmina, E.; Miller, D.; Thomas, J.K. Hydrogen jet vapor cloud explosion: A model for predicting blast size and application to risk assessment. Process Saf. Prog. 2018, 37, 397–410. [Google Scholar] [CrossRef]
  26. Nakayama, J.; Misono, H.; Sakamoto, J.; Kasai, N.; Shibutani, T.; Miyake, A. Simulation-based safety investigation of a hydrogen fueling station with an on-site hydrogen production system involving methylcyclohexane. Int. J. Hydrog. Energy 2017, 42, 10636–10644. [Google Scholar] [CrossRef]
  27. Introduction to Consequence Modelling. Available online: https://www.dnv.com/Images/Introduction%20to%20Consequence%20Modelling%20Webinar%20-%20QaA_tcm8-86021.pdf (accessed on 28 March 2021).
  28. Sakamoto, J.; Misono, H.; Nakayama, J.; Kasai, N.; Shibutani, T.; Miyake, A. Evaluation of safety measures of a hydrogen fueling station using physical modeling. Sustainability 2018, 10, 3846. [Google Scholar] [CrossRef] [Green Version]
  29. Crowl, D.A.; Louvar, J.F. Chemical Process Safety Fundamentals with Applications, 4th ed.; Pearson Inc.: Boston, MA, USA, 2019; pp. 515–525. [Google Scholar]
  30. Pasman, H.J.; Rogers, W.J. Risk assessment by men as of Bayesian networks: A comparative study of compressed and liquefied H2 transportation and tank station risks. Int. J. Hydrog. Energy 2012, 37, 17415–17425. [Google Scholar] [CrossRef]
  31. H2STATION Hydrogen Safety Plan. Available online: https://h2tools.org/sites/default/files/App2_Consolidated_Safety_Plans.pdf (accessed on 29 March 2021).
  32. GEXCON, RISKCURVES: Comprehensive Quantitative Risk Analysis. Available online: https://www.gexcon.com/wp-content/uploads/2020/04/Gexcon2019_Datacards_Product_RISKCURVES_11.11.20.pdf (accessed on 14 June 2021).
  33. Tzenova, Z. Calculation of individual risk and social risk in accident situations in industrial production. In AIP Conference Proceedings; AIP Publishing LLC: Melville, NY, USA, 2018; Volume 2048, p. 020012. [Google Scholar]
  34. Bommer, J.J.; Crowley, H.; Pinho, R. A risk-mitigation approach to the management of induced seismicity. J. Seismol. 2015, 19, 623–646. [Google Scholar] [CrossRef] [PubMed] [Green Version]
  35. Sun, M.; Zheng, Z.; Gang, L. Uncertainty analysis of estimated risk in formal safety assessment. Sustainability 2018, 10, 321. [Google Scholar] [CrossRef] [Green Version]
  36. Sandia National Laboratories. Analyses to Support Development of Risk-Informed Separation Distances for Hydrogen Codes and Standards. Available online: https://energy.sandia.gov/wp-content/uploads/2018/05/SAND2009-0874-Analyses-to-Support-Development-of-Risk-Informed-Separation-Distances-for-Hydrogen-Codes-and-Standards.pdf (accessed on 20 June 2021).
  37. Crowl, D.A. Simplified Process Risk Assessment: Layer of Protection Analysis, 1st ed.; American Institute of Chemical Engineers: New York, NY, USA, 2001; pp. 50–134. [Google Scholar]
  38. International Electrotechnical Commission. IEC 61508; Functional Safety of Electrical/Electronic/Programmable Electronic Safety-Related Systems, Parts 1~7; International Electrotechnical Commission: Geneva, Switzerland, 1998. [Google Scholar]
  39. International Electrotechnical Commission. IEC 61511; Functional Safety Instrumented System for the Process Industry Sector, Parts 1~3; International Electrotechnical Commission: Geneva, Switzerland, 2004. [Google Scholar]
  40. Mair, G.W.; Thomas, S.; Schalau, B.; Wang, B. Safety criteria for the transport of hydrogen in permanently mounted composite pressure vessels. Int. J. Hydrog. Energy 2021, 46, 12577–12593. [Google Scholar] [CrossRef]
Figure 1. (a) Location of hydrogen refueling facilities and (b) schematic layout of the facilities of the hydrogen refueling station.
Energies 14 04043 g001
Figure 2. Contour mapping of individual risk in hydrogen refueling stations: (a) risk of each facility, (b) details of three locations, and (c) contribution of individual risk in each place without IPLs.
Energies 14 04043 g002
Figure 3. (a) Analysis of the contribution of societal risk posed by hydrogen refueling facilities and (b) F–N curve analysis according to the installation of hydrogen refueling station facilities in urban areas.
Energies 14 04043 g003
Figure 4. (a) Analysis of individual risk when applying passive IPLs and (b) contribution of individual risk in each place with passive IPLs.
Energies 14 04043 g004
Figure 5. Analysis of societal risk according to applied to passive IPLs. (a) Analysis of the contribution of societal risk posed by hydrogen refueling facilities and (b) F–N curve analysis according to the application of passive IPLs.
Energies 14 04043 g005
Figure 6. (a) Analysis of individual risk when applying active IPLs and (b) contribution of individual risk in each place with active IPLs.
Energies 14 04043 g006
Figure 7. Analysis of societal risk according to applied to active IPLs. (a) analysis of the contribution of societal risk posed by hydrogen refueling facilities and (b) F–N curve analysis according to the application of active IPLs.
Energies 14 04043 g007
Table 1. Detailed information on the population for the F–N curve.
Sidewalk (I)Parking Lot (II)Driveway (III)
Number of people (day)300150500
Number of people (night)200100300
Table 2. Detailed initial conditions used in RISKCURVES.
ParametersAverage
Temperature
HumidityWind SpeedWind DirectionAtmospheric PressureAccident Type
Value13.3 ˚C63.3%2.37 m/sNW1 atmJet flame
Table 3. Input values for each component for risk assessment of hydrogen refueling stations (Sandia National Laboratories, 2009).
No.ComponentsPressure (MPa)Scenario (Leak)Leak Size (mm)Leak Rate (kg/s)Leak Frequency (/year)
1Tube trailer20Small0.401.30 × 10−31.07 × 10⁻³
Medium4.021.31 × 10−13.21 × 10⁻⁴
Large12.701.31 × 1001.80 × 10−4
2H2 storage (HP)82Small0.231.76 × 10−33.47 × 10⁻³
Medium2.261.70 × 10−12.09 × 10⁻⁴
Large7.161.71 × 1001.02 × 10−4
3H2 storage (LP)40Small0.251.02 × 10−33.47 × 10⁻³
Medium2.501.02 × 10−12.09 × 10⁻⁴
Large7.921.02 × 1001.02 × 10−4
4Dispenser70Small0.231.50 × 10−37.06 × 10⁻⁴
Medium2.261.45 × 10−11.85 × 10⁻⁴
Large7.161.46 × 1009.88 × 10−5
5Compressor82Small0.231.76 × 10−32.76 × 10⁻³
Medium2.261.70 × 10−12.62 × 10⁻⁵
Large7.161.71 × 1004.24 × 10−6
6Priority panel82Small0.231.76 × 10−31.20 × 10⁻³
Medium2.261.70 × 10−18.32 × 10⁻⁵
Large7.161.71 × 1003.84 × 10−5
Table 4. PFDs (per year) for passive IPLs.
No.Passive IPLsContentsPFDs from CCPS
P1DikeReduces the range of leakage from the hydrogen storage tank10−2
P2Underground draining systemReduces the range of leakage of a tank overfill, rapture, spill, etc.10−2
P3Open vent (no valve)Prevents overpressure10−2
P4FireproofingReduces the rate of heat input and provides additional time for firefighting10−2
P5Blast wall or bunkerReduces the range of damage from major accidents10−3
P6Inherently safer designReduces accident scenarios through fundamental safety design10−2
P7Flame or detonation arrestorsRestriction of entry of flame sources into tanks or piping10−2
P8OthersPassive IPLs other than the above devices
Table 5. PFDs (per year) for active IPLs.
No.Passive IPLsContentsPFDs from CCPS
A1Gas detector and emergency shutoff valveFacility to immediately detect and act when hydrogen leaks10−1
A2Relief valve/rapture discPrevents overpressure from being exceeded in hydrogen plants10−2
A3Basic process control systemKeep the process under control10−1
A4OthersActive IPLs other than the above devices
Table 6. Applied IPLs for each facility used to reduce the risk.
No.ComponentsSafety Device
PassiveActive
1Tube trailerA1, A2P1, P3, P4, P6
2H2 storage (HP)A1, A2P1, P3, P4, P6
3H2 storage (LP)A1, A2P1, P3, P4, P6
4DispenserA2P2, P6
5CompressorA1, A2P6
6Priority panelA1, A2P6
Publisher’s Note: MDPI stays neutral with regard to jurisdictional claims in published maps and institutional affiliations.

