Article

Comparison of Building Simulation Methods for Modeling Apartment Balconies

1
Department of Architectural Engineering, Hanyang University, Gyeonggi-do, Ansan 15588, Korea
2
Department of Smart City Engineering, Hanyang University, Gyeonggi-do, Ansan 15588, Korea
3
Sun & Light R&D Center, Seoul 06448, Korea
*
Author to whom correspondence should be addressed.
Energies 2021, 14(13), 3955; https://doi.org/10.3390/en14133955
Submission received: 8 June 2021 / Revised: 25 June 2021 / Accepted: 28 June 2021 / Published: 1 July 2021
(This article belongs to the Section G: Energy and Buildings)

Abstract

:
The purpose of this study is to compare the load calculation results by a model using the air changes per hour (ACH) method and a model using an airflow network (AFN) and to ascertain what causes the difference between the two models. In the basic case study, the difference in the heat transfer distribution of the model in the interior space was investigated. The most significant difference between the two models is the heat transfer that results from infiltration. Parameter analysis was performed to investigate the relationship between the difference and the environmental variables. The result shows that the greater the difference is between the air temperature inside the balcony and the outdoor air temperature, and the greater the air flows from the balcony to the residential area, and the greater the heating and cooling load difference occurs. The analysis using the actual weather files of five domestic cities in South Korea rather than a virtual case shows that the differences are not so obvious when the wind blows at a constant speed throughout the year, but are dominant when the wind does not blow during the night and is stronger alongside the occurrence of sunlight during the day.

1. Introduction

According to Statistics Korea’s housing census, as of 2019, the number of residential houses nationwide is about 17.63 million. Multi-family housings account for about 14.21 million (78%) and detached houses account for about 3.91 million units (22%). The proportion of apartments among multi-family housings is 79.4%, with 11 million apartments scattered across the country. A proportion of 24% of all energy consumption comes from the building sector, and among the government’s greenhouse gas reduction targets, the building sector has the second highest reduction ratio after transportation. Of these, energy consumption in residential buildings exceeds 50%. Energy saving in apartments, which occupies about 80% of residential buildings, is a very important factor in national policy.
One of the characteristics of domestic apartments is that the balcony is not open to the outside but is insulated from the outside by windows. In Korea, windows installed on balconies which were open at the time of completion are often observed. This type of balcony is called a “glazed balcony” in foreign countries.
This space has served as a thermal buffer space to reduce the heating and cooling load of the installed household. However, this space was inserted as a space in the residential area as the expansion of balconies in apartment houses became legal in South Korea from 2006. The residential area was enlarged, but the thermal buffer space called the balcony was lost. With the legalization of balcony expansion and the prevalence of expansion, a number of studies were conducted to predict changes in the thermal environment and energy consumption of households before and after expansion. Although predictions using simulation have been made variously in Korea, numerous studies, which found different patterns of change in internal load due to expansion, were found. Most studies conducted in Korea have concluded that both heating and cooling loads increase when the balcony is expanded [1,2,3,4], but several studies have shown that the heating load may be reduced when the balcony is expanded [5,6]. To find the cause of such conflicting results, the modeling techniques of a glazed balcony and their differences are examined.
When modeling an apartment with a glazed balcony in an existing energy simulation program, the balcony was modeled by classifying it into a single non-air conditioning zone adjacent to the residential area [1,2,3,4,5,6,7]. One thing to consider when modeling a non-air conditioning zone surrounded by such adjacent glass is the heat transfer from the balcony to the residential area. A previous study mentions the importance of modeling in which the solar radiation through the balcony window reaches the residential area with the balcony [8]. Because the method of handling the solar radiation passed through the window varies depending on the solar model, there is a difference in calculating the heating and cooling loads between programs depending on whether the calculation of the direct solar radiation passing through the balcony in consideration of reaching the adjacent residential area is possible.
Another heat transfer is heat transfer by air flow from the balcony to the residential area. A method of calculating the air flow by internal and external pressure difference based on the crack method has been used instead of the conventional method of assuming infiltration by the method of air change per hour when the inflow of air heated by solar radiation into the room, such as double skin façade system model, needed to be precisely calculated [9,10,11,12,13,14,15]. Since the glazed balcony and double envelope have the same physical shape, there are studies abroad that used modeling based on this crack method when modeling a glazed balcony [16,17], but modeling, which mainly uses the method of air change per hour, has been mainly used in South Korea. The difference between the existing method of air change per hour is that it does not take into account heat transfer due to air flow between the balcony and the residential area.
The method, which uses the crack method, needs to measure the air leakage of the building envelopes and accurately specify the infiltration route of the building as well as the wind speed. Compared to the existing method, the number of input data is large and accurate measurement of input data is not easy. However, modeling that uses this method can theoretically accurately calculate heat transfer by airflow between the balcony and the residential area. For this, prior studies which seeks accurate input data have been explored in advance. Using this, a method of obtaining input data necessary for modeling that uses the crack method was examined [18]. This study was planned to examine the effect of air flow between balcony and residential area on heating and cooling load.
The purpose of this study is to compare the calculated results for the cooling and heating loads produced by a model using the air changes per hour (hereinafter referred to as ACH) method with a model that uses an air flow network (hereinafter referred to as AFN) based on the crack method and to ascertain what causes the difference. There is an existing study which compared ACH and AFN, but it examined infiltration and did not address heat transfer through air flow [19]. In this study, the simulation model was calibrated by experiment and the annual heating and cooling loads were calculated based on this model. The amount of heat lost and gained due to air flow, both of which influence the heating and cooling load, were also investigated. In addition, an examination of cases in which modeling differences occur was carried out by implementing models of several representative cities in South Korea.
A small modular house with a floor area of 24.1 m2 was used as the test bed for modeling calibration and verification in this study, and simulations of this test bed were used for the analysis. In order to simplify the experimental conditions, both the experiment and the simulations were carried out with only internal lighting and equipment loads and any loads produced by residents were not included. Because this study aims to investigate the deviations between models under the simplest conditions and the causes for these differences, additional research is needed to apply the results in modeling larger domestic apartments of 54 m2 and 84 m2 in which additional lighting and electrical equipment are used, and in which residents live.
In this study, we implemented the same physical environment as the airflow network simulation in the experiment, and calibrated the simulation using the experimental results. In addition, this is the first attempt to compare the differences between the air change per hour method and the airflow network method for energy simulation of Korean apartment houses, including glazing balconies.

2. Materials and Methods

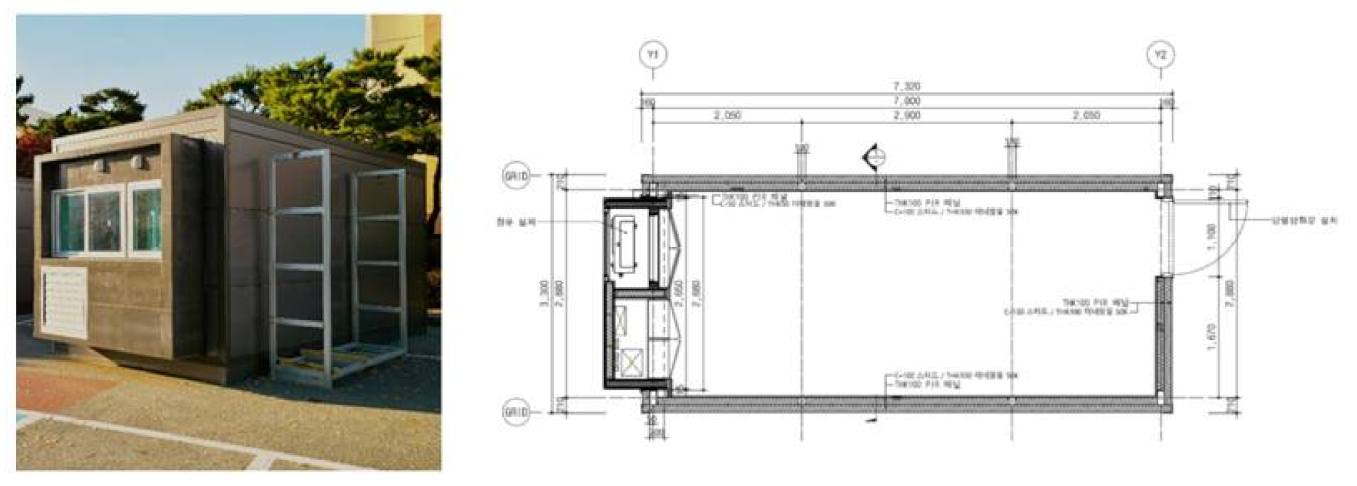
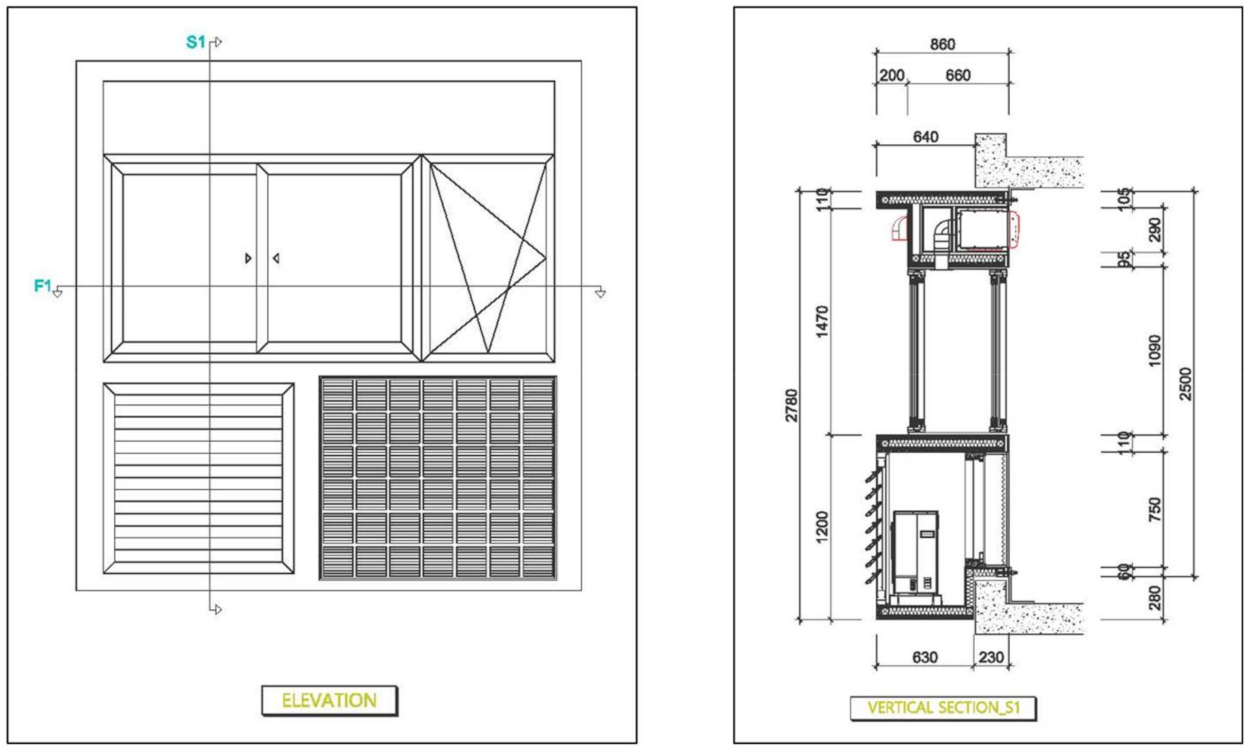
2.1. Test Bed Conditions

The experiment was conducted using a modular house with an external envelope that included a simple balcony as a test bed. The modular house was installed in front of Engineering Building 1 at Erica Campus, Hanyang University, which is located in Ansan, Gyeonggi-do. The modular house with a floor area of 14.6 m2 was installed as in Figure 1. An external envelope package containing a double envelope that served as a simple balcony with a depth of 0.600 m was installed. The house was installed so that the windows faced southward and the house was placed on a support that elevated the entire structure approximately 0.600 m from the ground. The house was in the form of a box-shaped building with a rectangular floor measuring 3.300 m × 7.320 m, a ceiling height of 2.400 m, and a floor-to-floor height of 2.850 m. The walls, floor, and ceiling were insulated with two 100 mm Polyisocyanurate form (PIR) panels. The interior of the four walls was finished with metal sheeting, and the floor was finished using wood panels. The ceiling has 0.200 m of air space and gypsum board was used as the ceiling material. Since it was installed on a 0.600 m high support, the floor was not in direct contact with the ground. Installed on a 0.60 m high support meant that the floor was not in direct contact with the ground, and the floating floor area under each wall was finished with insulation, thereby minimizing the possibility of air infiltrating through the building floor and any associated temperature changes. The air-to-air heat pump system (model name: CSV-Q115B) by Carrier, which is capable of both heating and cooling, was installed to measure the amount of energy consumed. The cooling/heating capacity of this unit is 4600/5600 W and the power consumption is 1.58 kW for cooling and 1.65 kW for heating. The rated COP for this pump is 2.91 for cooling and 3.34 for heating. A meter was used to measure the energy consumed by this air conditioner during the experiment.
The experiment was conducted over a 4-month period from 30 November to 28 February 2020, and the experiment to provide the necessary data was carried out on 19 and 20 February.
The external envelope package containing the double skin facade that was utilized to emulate the balcony had sliding windows and turn and tilt windows installed on the outside and inside, respectively. The left side of Figure 2 illustrates the external envelope package that was used as a balcony, and the right side is a cross-section.

2.2. Experimental Setting

A custom-made product with a hybrid air cleaning ventilation system manufactured by Huteco with an additional mode was utilized for the air flow experiment. The shape of this device is provided on the left of Figure 3, while the operating conditions of the damper and fan during the experiment are illustrated on the right.
The setting in the experiment that was used for verification of the AFN model was established such that the air outside the balcony entered the cavity space of the balcony through a crack, and then flowed into the room through the air purifier as a result of the pressure difference between the inside and outside that was generated by the fan in the ventilation system. The energy consumed by heating was then measured. It can be seen in Figure 3 that damper D4 of the air cleaning ventilation system was connected to the cavity space, which was kept open during the experiment. Air from the cavity space was drawn into the room by the fan via damper D2. At this point, the heat exchanger element between dampers D2 and D4 was removed to prevent any additional heat loss or gain, and all the other dampers were closed. Moreover, additional work was carried out on the closed dampers to prevent the unnecessary inflow of air as a result of differences in the internal and external pressure. All cracks in the interior windows and walls were sealed to prevent air from entering during the experiment. The turn-and-tilt windows located outside were kept semi-open so that the same amount of air could enter the room as that drawn into the cavity space by the fan.
The experiment for verification of the model using ACH was conducted by operating the bypass mode of the air cleaning ventilation system. All dampers other than D7, which was connected to the exterior, and D6, which was connected to the interior in the lower right corner (Figure 3), were closed, and external air was introduced by operating the M3 motor between these two dampers. Air from the cavity space cannot enter the room under these conditions, and only air from outside enters the room. The building is not affected by wind because the front, left and right, and the rear of the test bed are surrounded by buildings and woods. This means that no air infiltrates the building other than that introduced by the fan.
In both cases, the fan air volume was set such that the infiltration volume was 1 ACH.

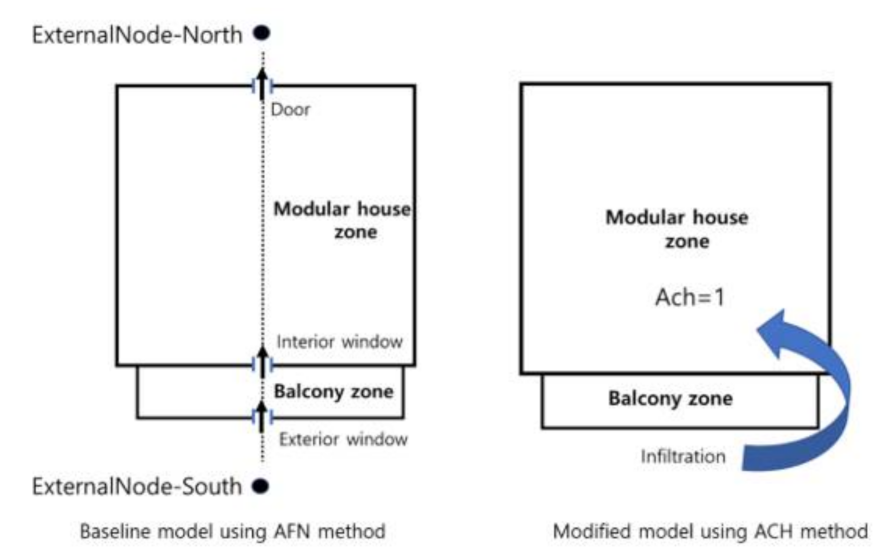
2.3. Simulation Setup

The simulation program used in this study is Energy plus V9.3. The modeling using the air change method, which does not take into account heat transfer by air flow, was implemented by using the Air Changes per Hour (ACH) module in Zone Infiltraikon: Design Flow Rate, one of the models for setting infiltration in Energyplus [20]. The modeling used to calculate heat transfer by air flow was developed using Airnet developed by National Institute of Standards and Technology (NIST), which is a program that predicts air flow between rooms based on the crack method, and was implemented by using the Air flow network, which is an air flow calculation model inserted into Energy plus.
Using Energyplus, a baseline model for the test bed with the AFN (Air flow network) method was created. The modified model was made using the existing ACH (Air change per hour) method instead of the AFN method. The air flow from infiltration in both models is as shown in Figure 4. Infiltration is defined as the unintended intrusion of external air; therefore, external air was assumed to have been directly introduced into the room without going through any intermediate points under any circumstances in the case of the existing ACH method, and this was used to calculate the load. On the other hand, in the AFN (Airflow network) method, the air that infiltrates through the balcony is also modeled as a condition under which heat is gained or lost as it passes through the balcony and was therefore used in the calculation of the load in the residential area.
When setting the infiltration route using the AFN (airflow network model), air was assumed to enter through the balcony flow into the residential area through the interior window, and exit through the rear door. The infiltration performance of the exterior window, interior window, and door was set such that the annual average infiltration was 1 ACH according to the weather data. In order to simulate the occurrence of infiltration of 1 ACH so that it was the same as that in the experiment, the weather data were modified to 2 m/s for 8760 h per year, and the wind was set to blow in a southerly direction. The weather data were modified using Elements v1.06. The air mass flow coefficient in the reference condition and the air mass flow exponent were also set such that the infiltration was 1ACH. The actual building air mass flow exponent of 0.65 was used to describe the air mass flow, as in the preliminary experiment, and the model was set such that infiltration of 1ACH takes place by calibrating the air mass flow coefficient with the reference conditions. It was assumed that the infiltration performance of the interior window was equal to or worse than the infiltration performance of the exterior window. In order to simplify the model, the assumption that the air mass flow coefficient in the reference condition and the air mass flow exponent of the exterior window, interior window, and door were the same in the baseline model. This is based on the assumption that more air flows through the interior window than the exterior window because the interior window is opened and closed more often.
Only the two external nodes south and north were used when setting the AFN infiltration route. This is so that only air moving from the south to the north was set in the model, as it was in the experiment. The height of the external nodes was set to 2.185 m, which is the same height as the infiltration node of the exterior window, interior window, and door. If these heights differ, the pressure difference due to the stack effect is additionally calculated; thus, when the external wind speed is low, the infiltration is assumed to flow in the opposite direction, i.e., from north to south. The infiltration route was therefore set to match the height of the neutral zone in order to disregard the stack effect.
In modeling the balcony, the effect of solar radiation penetrating the space behind a window is one of the most important factors that determines heating and cooling loads. There are 6 solar distribution models in Energyplus. “Full Interior and Exterior” or “Full Interior and Exterior with Reflection” were selected in order to accurately calculate the effects of direct sunlight reaching through the exterior window and penetrating a room through the interior window. The effect of direct solar radiation cannot be determined as other simpler models use the assumption that all solar radiation that passes through the exterior window is diffused and the diffused radiation is transmitted through the interior window.
In the baseline model, the direct heat gain and heat loss in the air within the residential area are caused by convection within the inner wall of the residential area, convection within the inner wall where the interior window lies between the balcony and the residential area, and the air flowing between the balcony and the residential area. Among the output variables of Energyplus, “Surface Inside Face Convection Heat Gain Energy” shows the amount of convective heat gained per hour by the inner wall of a residential area. This output variable shows the heat transfer that occurs across all interior walls. The sum of the heat that is transferred between the double balcony and the residential area via the interior window and the wall on which it is installed represents the heat transfer that occurs as a result of convection between the balcony and the residential area. The interzone air transfer heat transfer between balcony and residential area can be ascertained through “AFN Zone Mixing Sensible Heat Loss Energy” and “Mixing Sensible Heat Gain Energy.” The heating and cooling load each hour is the same as the sum of all the values in the “AFN Zone Mixing Sensible Heat Loss Energy,” “Mixing Sensible Heat Gain Energy” and “Surface Inside Face Convection Heat Gain Energy.” In fact, the values of the cooling load and the sums mentioned above are not exactly the same, but analysis was conducted using these heat transfer values in this study since the difference appears to be less than 1%.
In actual residential buildings, heat is also generated by the human body, appliances, and lighting. However, this heat was not considered in the simulation as no lighting and/or appliances were working in the test bed, and the experiment was conducted with the exclusion of residents.
The solar radiation enters through the interior window between the balcony and the residential area does not directly increase the air temperature in the residential area, but it does affect the indoor air temperature via convection after being absorbed by the interior surfaces. In Energyplus, the amount of insolation that penetrates through the interior window can be confirmed through the output variables “Zone Interior Windows Total Transmitted Beam Solar Radiation Energy”, which is directly transmitted solar radiation, and “Zone Interior Windows Total Transmitted Diffuse Solar Radiation Energy”, which describes diffusely transmitted solar radiation. In EnergyPlus, the solar radiation that penetrates through the interior window is evenly distributed over the interior surface by diffusion. Thus, in Energyplus, the amount of solar radiation that penetrates the window to be absorbed by the wall can be obtained by using the “Surface Inside Face Solar Radiation Heat Gain Energy” for each indoor wall as an output variable and summing the heat gains that are received by each wall.
As mentioned above, solar radiation that enters through the window is absorbed by the wall and affects the indoor air temperature through convective heat transfer. The solar heat gain that is absorbed by the interior wall, convective heat transfer with other interior walls, conducted heat transfer on the interior wall, and convective heat transferred on the interior wall surface must achieve thermal equilibrium. That is, the sum should converge to zero. The result is not actually 0, but it converges to 0 with a difference of less than 1% as compared to the total heat transfer. Accordingly, through these four types of heat transfer, the means by which solar radiation affects the air temperature through convective heat transfer on the interior wall surface can be identified. In Energyplus, conduction heat transfer on the interior wall can be found by using “Surface Inside Face Conduction Heat Transfer Energy” as an output variable and the convective heat transfer of the other indoor walls can be found by using “Surface Inside Face Net Surface Thermal Radiation Heat Gain Energy”.
The model using the AFN method was calibrated using the data obtained by the experiment. The model was calibrated such that the normalized mean bias error (NMBE) was within ± 10%, and the coefficient of variation of the root mean squared error (CV (RMSE)) was within 30% according to the Measurement and Verification (M&V) standards. The CV (RMSE) for the value obtained by the simulation that used the AFN method compared to the measured data for the hourly electricity consumption of the heat pump installed in the modular house was 26.8% and the NMBE was 8.3%.

3. Results

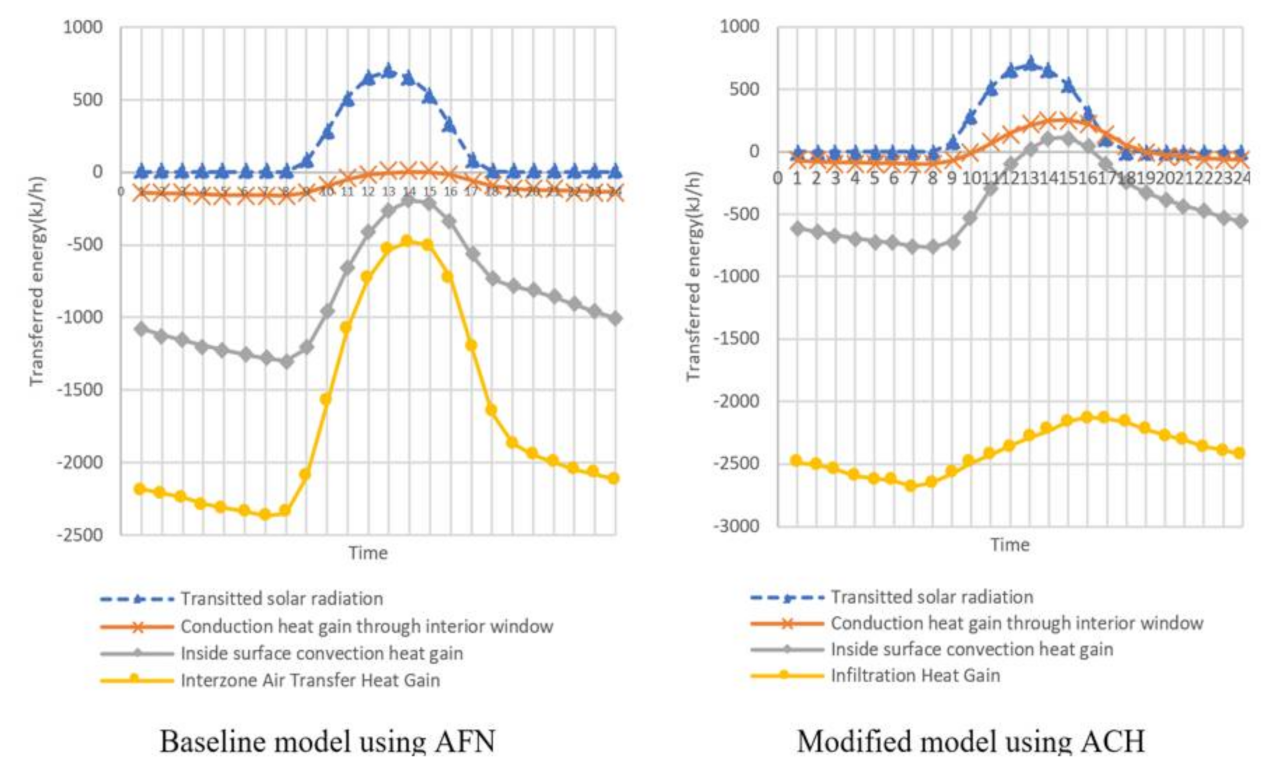
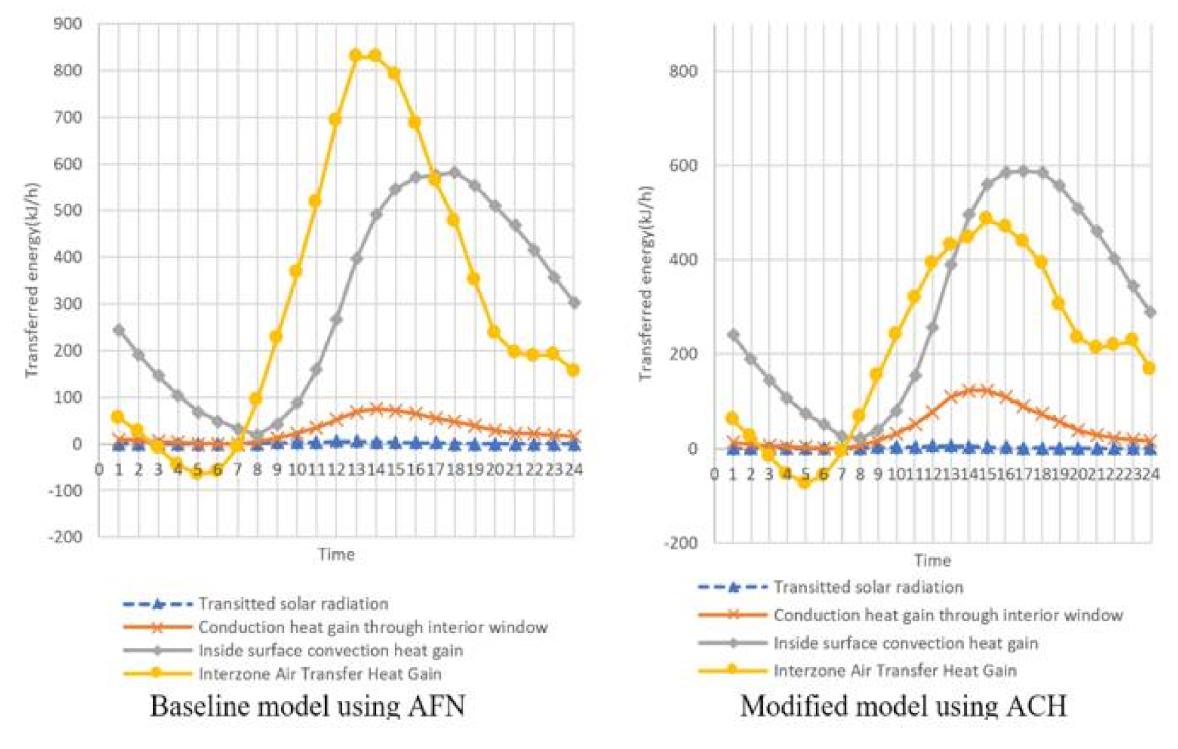
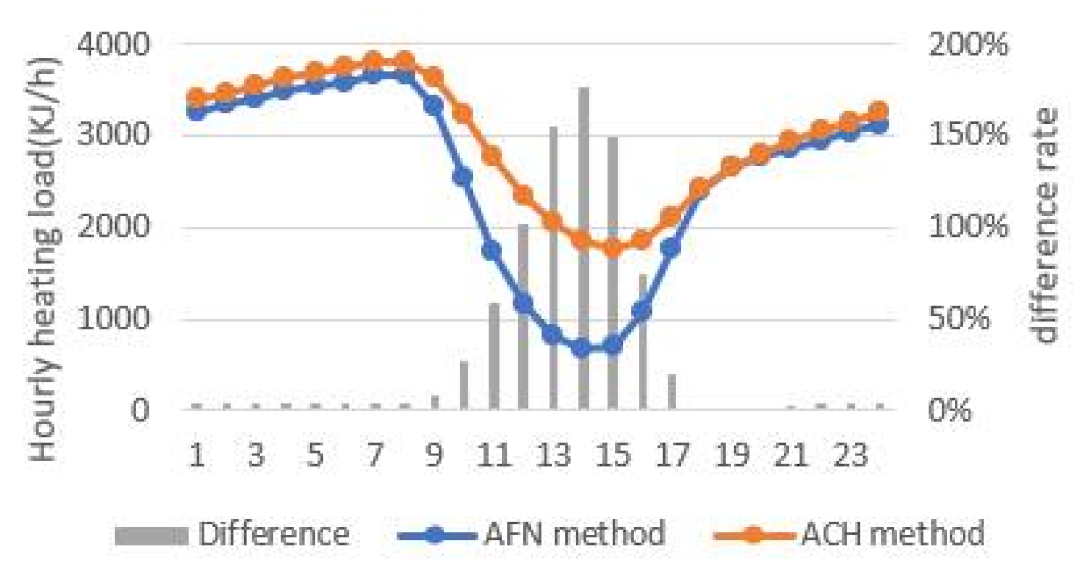
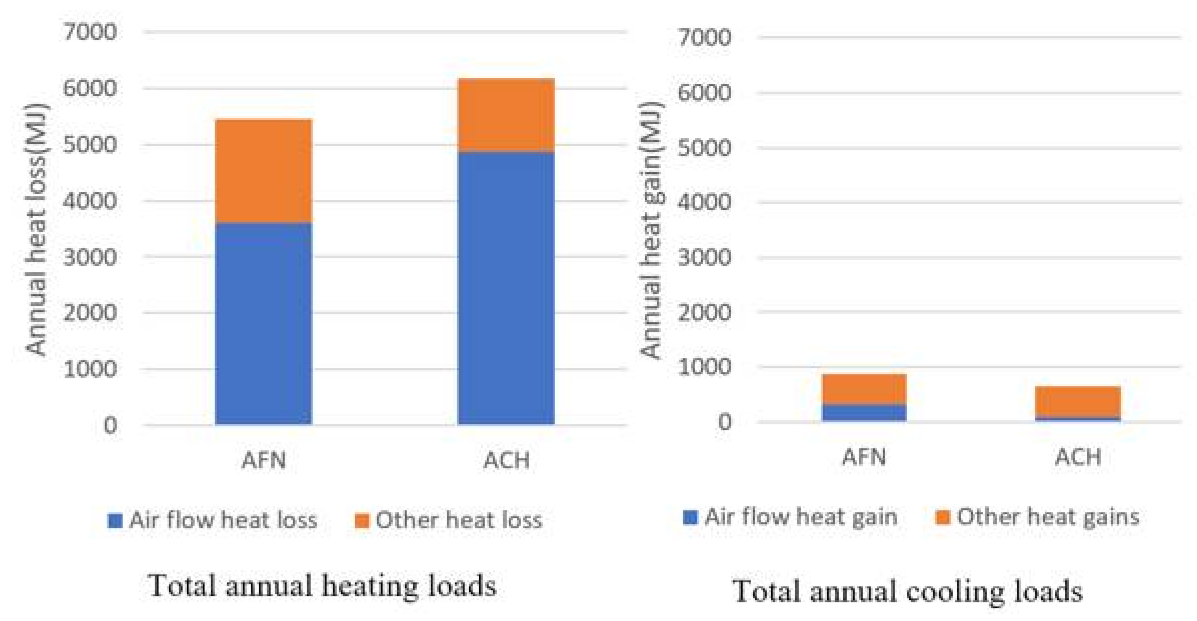
3.1. The Basic Case Study

By using the baseline model that has been calibrated and the model using the ACH and AFN method, analysis was conducted for the coldest day in winter (8 January at 7 a.m.) and the hottest day in summer (1 August at 2 p.m.). The heat gain or heat loss per hour that affects the heating and cooling loads were calculated using both the baseline AFN model and the ACH model. The result is shown in Figure 5. The left part of the figure shows the values that were obtained from the baseline model using the AFN method, while the right side shows the values obtained using the ACH method. Both show the surface convection heat gain that occurs on the inner surface of the wall of the residential area that directly affects both cooling and heating, the heat gained by conduction through the interior window, the Interzone Air Transfer Heat Gain between the balcony and residential area, and the transmitted solar radiation. The model results using the ACH method are similar; however, one significant difference is the inclusion of the heat gained via infiltration instead of the interzone heat gain resulting from the transfer of air between the balcony and the residential area.
Figure 5 illustrates the heating load in the winter season. Since most of the heat transferred through the wall is in the form of heat loss, the sign is negative. On the other hand, in Figure 6, the sign of heat gain is positive, as heat is transferred indoors during the summer. The temperature of the interior surface in the residential area was higher using the ACH method than it was under the baseline model using the AFN method. This is because the discharge air temperature of the ideal load system is higher in the model using the ACH in which heat loss is larger due to infiltration. Thus, the amount of convective heat transfer occurring through the wall is lower in the model using the ACH method. The heat that is transferred via conduction from the balcony to the residential area through the interior window at night is also lower in the ACH model, for the same reason.
The most significant difference between the two models is the heat transfer that results from infiltration. The heat loss due to infiltration in the model using the ACH method was up to 3.7 times higher during the winter season than the heat loss due to air flow between the balcony and residential area of the baseline model using the AFN method during the same period. This difference is most noticeable during the daytime under the influence of solar radiation, while the difference is within 15% during the night when solar radiation is not considered. The heat lost by infiltration in the model using the ACH method was 2000~2700 J/h, which is relatively constant. On the other hand, the heat loss due to air flow between the balcony and the residential area in the baseline model that uses the AFN method was 2000~2400 J/h at night, which is similar to the heat loss due to infiltration in the model using the ACH method, but the value drops to 500 J/h during the day. This is because the temperature of the air in the balcony space increases due to the influence of solar radiation and this air flows into the residential area.
Figure 7 shows a comparison of the heat gain difference between the two models during the cooling design day. The difference between the cooling and heating load in the model using the ACH method and the model using the AFN method is expressed as a percentage. The difference was calculated using the following equation:
Difference = (Value of AFN method − Value of ACH method)/Value of ACH method × 100 (%)
Comparing the difference in heating load between the two models during the heating design day indicated a 180% higher heat loss for the model using the ACH method at peak times than the model using AFN, and a 13% higher heat loss on a daily average. As shown in Figure 8, the cooling design day has a similar cooling load at night. However, the heat gain per hour in the baseline model using the AFN method was 20% higher than that in the model using the ACH method as the balcony air temperature increases due to solar radiation in the daytime. In the case of the ACH method, heat transfer from the balcony to the residential area only occurs via conduction. However, in the case of the AFN method, heat transfer occurs in addition to conduction due to the airflow between the balcony and the residential area. Thus, a higher heat gain takes place in summer and less heat is lost during winter under the model that uses the AFN method.
The annual heat loss and heat gain that affects the annual heating and cooling loads as observed using the AFN method and the ACH method were then compared. The results are shown in Figure 9. The left side of the figure is a comparison of the annual heating load, which is the sum of the annual heat losses due to air flowing between the balcony and the residential area and the sum of the other annual heat losses in the case of the baseline model using the AFN method. The ACH method considers the annual heating load to be the sum of the annual heat losses, which is due to infiltration and the other heat losses. The right side of the figure compares the sum of the heat gain by air flow and the other heat gains when a cooling load occurs.
When a heating load occurs, the heat loss by the air moving between the residential areas in the baseline model using the AFN method is 26% lower than the heat loss via infiltration in the model using the ACH method. In addition, annual heating loads of the baseline model using the AFN method is 12% lower than that using the ACH method.
When a cooling load occurs, the heat gain by air movement between the residential areas of the baseline model using the AFN method is 3.3 times larger than the infiltration heat loss of the model using the ACH method. When the cooling load occurs, the baseline model using the AFN method considers the heat gain due to the inflow of hot air from the balcony, and thus, the annual cooling load of the baseline model using the AFN method is 34% larger than that of the model using ACH.

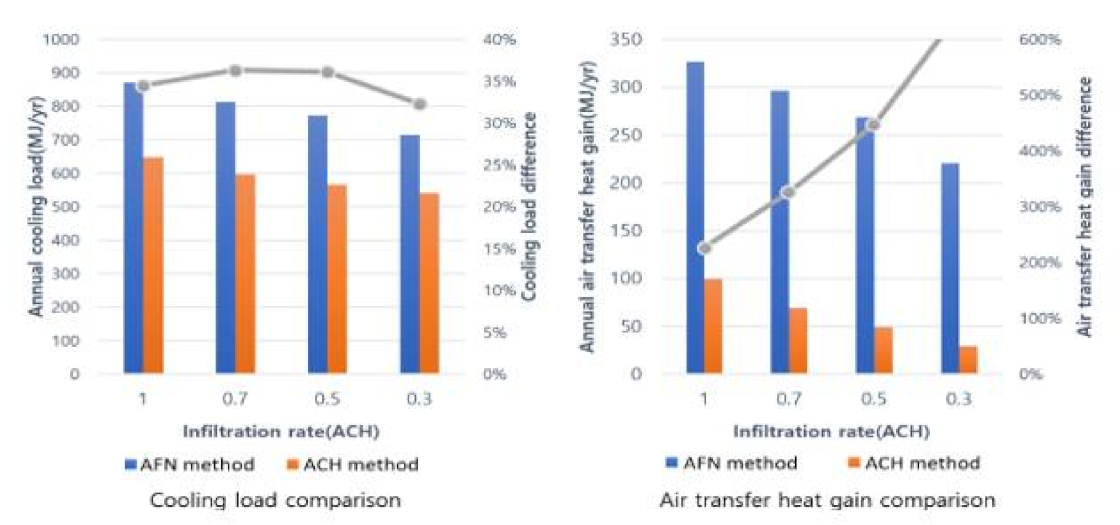
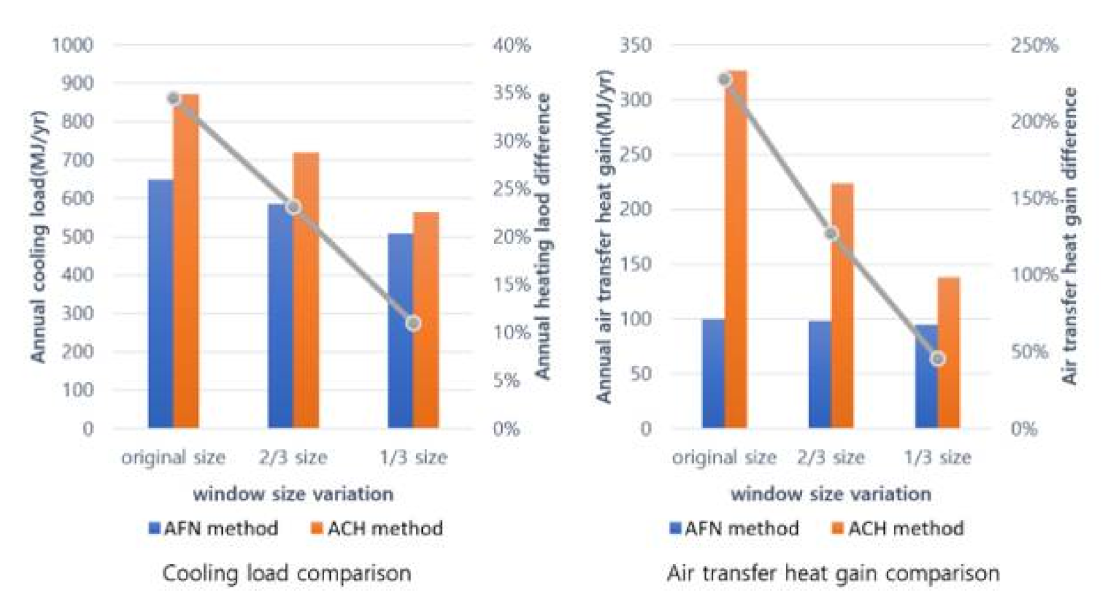
3.2. Parametric Analyses

The above case study examined the difference in the heat gain and heat loss in terms of the cooling and heating load and air flow with both the model using the ACH method and the baseline model using the AFN method under ideal conditions such as a constant wind speed of 2 m/s per h, with the wind blowing from the south, and the amount of air infiltrating the building maintained at 1 ACH. Parametric analysis explores how the results of the basic case study change when the building parameters change.
First, parametric analysis was conducted to discover how the difference in the heat gain and heat loss in terms of the heating and cooling load and the air flow changes when the amount of air infiltrating the building changes. The infiltration is 1.0 ACH in the basic case, which is typical of old residential buildings. However, the infiltration rate drops to 0.2~0.3 ACH in recently built high-quality apartments, meaning that artificial ventilation may be required. In this analysis, changes in the heating and cooling loads in the baseline model using the AFN method and the reference model using the ACH method and changes in the heat gain and loss by infiltration and air flow from the balcony to the residential area were observed while changing the infiltration value from 1.0 to 0.7, 0.5, and 0.3 ACH. The difference was calculated using Equation (1).
Figure 10 compares the calculation results of the model using the AFN method and the model using the ACH method. The right side shows the difference in heat loss that is due to air flow, while the left side shows the calculated difference in the annual heating load. The annual heating load is the sum of the heat lost via air flow and other forms of heat loss.
At an infiltration value ACH of 1.0, the ratio of heat loss in the heating load that is due to air flow in the model using the AFN method is 66%, which is 79% for the model using the ACH method. When the infiltration value ACH is decreased to 0.3, the ratio of heat loss due to outdoor air flow in the heating load decreases to 32% in the model using the AFN method and 48% for the model using the ACH method. However, the difference in heat loss due to air flow between the AFN model and the ACH method increases from 26% to 42%, as can be seen in the right side of Figure 10.
The ratio of the heat loss due to air flow in the heating load therefore decreases as the ACH decreases, and as a result, the effect of heat loss due to infiltration on the overall calculated heating load decreases. However, the difference between the AFN method and the ACH method in the calculated heat loss that is due to air flow increases as the infiltration rate decreases. In terms of the heating load, the difference in the calculated heat loss via air flow that results from the reduced infiltration rates is greater than the effect of decreasing the ratio of heat loss by air flow in the heating load as the infiltration rates decreases. Accordingly, the difference in the annual heating load using the AFN method and the ACH method increases from 12% at 1 ACH to 14% at 0.3 ACH as seen in the left side of the graph in Figure 10.
The same analysis was carried out for the cooling load. The right side of Figure 11 shows the results of the difference in the calculated heat gain according to the air flow using the AFN method and the ACH method, and the left side shows the difference in the calculated annual cooling load. Here, the annual cooling load is the sum of the heat gained from the air flow on the right figure and the other forms of heat gain.
The difference between the model that uses the AFN method and the model using the ACH method in terms of the total cooling load is 30–35% when the infiltration rate is changed from 1.0 to 0.3. However, the difference is even greater when only looking at heat gain via air flow, such as that associated with infiltration. At an infiltration rate of 1 ACH, the difference in the heat gained due to air flow using the AFN model and the ACH model was observed to be 228%. It increased further as the ACH decreased and a difference of more than 600% was observed at an ACH of 0.3.
In terms of the cooling load, the effect of decreasing the heat gain ratio via air flow in the cooling load that results from a reduction in infiltration rates decreases as compared to the effect of the increased difference in the calculated heat gain via air flow in the model using the AFN method and the model using the ACH method. Thus, as shown in the left graph of Figure 11, the effects increase as the infiltration rate decreases and then decrease again. Figure 11 indicates that the difference in the calculated result of the annual cooling load using the AFN method and the ACH method increases to 34% at 1 ACH and 35% at 0.7 ACH, and then decreases to 30% at 0.3 ACH.
The analysis results are as follows. As the infiltration rate decreases, the ratio of the heat loss/gain due to air flow in the load decreases and as a result, the effect of heat loss due to infiltration on the overall calculated heating load decreases. At the same time, the difference between the AFN method and the ACH method in the calculated heat loss/gain is due to air flow increases. The final difference is determined by the magnitude of the effect of the ratio change and the difference change.
The second parametric analysis was carried out to understand the difference in the results obtained according to changes in the size of the exterior window in the balcony. This analysis explores how solar radiation affects the results obtained using the two models. In the analysis, the difference in the amount of heat gain and loss due to the cooling and heating loads in the model using the ACH method and that using AFN method was compared while reducing the size of the exterior window of the balcony by 1/3 of that in the baseline model.
Figure 12 shows how the heating load and related heat loss that results from air flow differ in the model using an ACH method and that using an AFN method when the size of the window is reduced in 1/3 intervals. As the size of the window decreases, the inflow of solar radiation to the balcony decreases, and the temperature inside the balcony decreases accordingly. The difference between the temperature inside the balcony and the outdoor air decreases as the inflow of solar radiation decreases during the heating period. Accordingly, the difference in the effect of air flow in the ACH and AFN models, which was 26% with the original window, decreased to 19% when the window size was reduced to 1/3, as shown in Figure 12.
The rate at which the heating load changes, which was 12% with the original window size, also differs by decreasing to 6% when the size of the window is reduced by 1/3. These results indicate that as both the size of the window and the inflow of solar radiation decrease, the difference in the air temperature between the balcony and that outdoors decreases. The difference that results in the air flow when using ACH and AFN also decreases. Figure 13 illustrates the difference between the cooling load calculated using the ACH method and the heat gain due to the air flow and the cooling load calculated using the AFN method as based on the heat gained via air flow. The reduction in the amount of solar radiation reaching the room as a result of changing the size of the window decreases the difference observed in the effect of air flow between the two models. The original difference of more than 300% with the original window size decreased to less than 50% when the window size was reduced by 1/3.

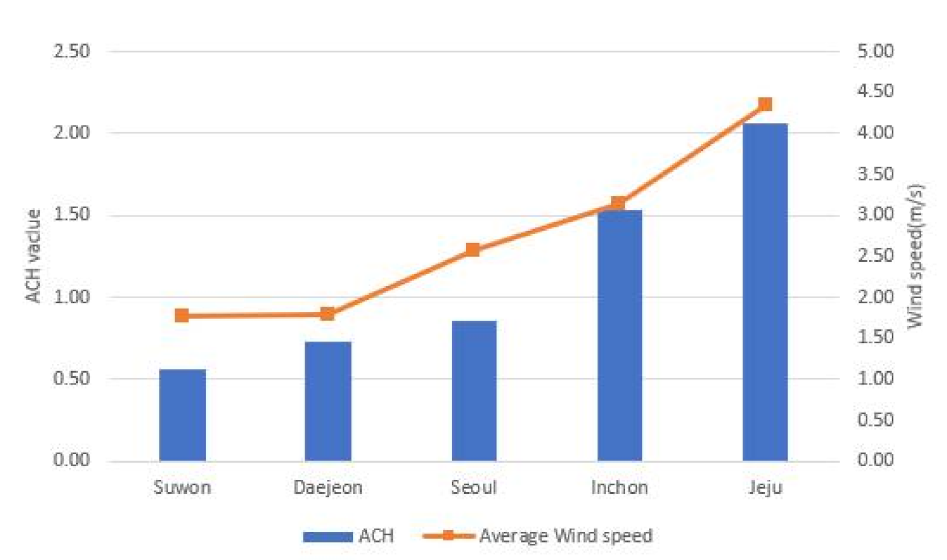
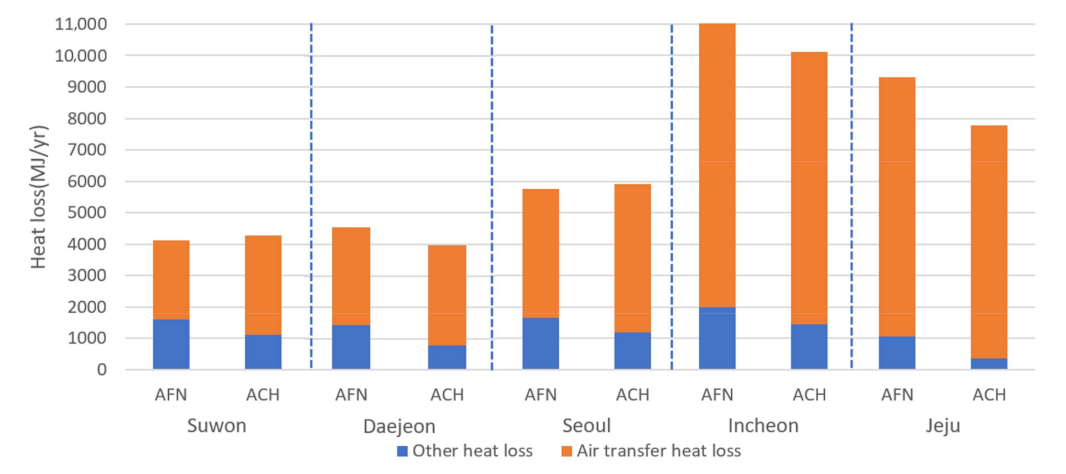
3.3. Case Study Using Actual Weather File

This analysis involves changing the weather conditions while retaining the same modeling conditions and comparing the results gained using the AFN model with those from the ACH model. The data used for this analysis describe the weather conditions in Suwon, where the experiment was conducted; Seoul, which has the largest population in Korea; Daejeon, which is located inland; Incheon, which is located on the coast; and Jeju, where the highest average wind speed occurs in South Korea. Figure 14 shows the annual average wind speed in the five cities and the annual ACH when the weather files of each city are applied to the model using the AFN method. The annual average infiltration rate increases as the average wind speed increases.
After applying the weather file from each city and finding the infiltration performance of each building using the AFN model, this value was applied to the model using the ACH method, and the difference between the two models was compared. The difference in heating load by city was compared first. The comparison of the AFN model and the ACH model in Figure 15 was carried out by dividing the heat loss into that due to air flow such as infiltration, which is a component of the heating load, the heat transferred from the cavity space of the balcony, and other forms of heat loss. The difference in the calculated city-specific load using the ACH method and the AFN method and the ratio of heat loss as a result of the air flow between the balcony and residential area to the heating load in the model using the AFN method are compared in the table below. In this table, the difference between the heating load and the cooling load is the ratio of the difference between the calculation made by AFN and ACH for the heating load and cooling load that was calculated using the ACH method in Figure 15.
As shown in Table 1, the absolute value of the difference in heating load increases or decreases depending on how much heat is lost via air flow between the balcony and the residential area with the AFN method. No heat loss occurs as a result of air flowing between the balcony and the residential area when the ACH method is used. This is a major cause of the difference in the results of the calculation made using the two models.
As the ACH value increases, the heating load increases. However, in the case of Jeju, the average temperature is higher than in other inland cities as the climate in this city is almost subtropical. The average temperature over 30 years of climate data in Suwon, Seoul, Daejeon, and Incheon is approximately 11–12 °C, while in Jeju it is 15.5 °C, which is more than 3 °C higher. Thus, the heating load is smaller than Incheon although the value of ACH exceeds 2.

4. Discussion

The difference between the heating and cooling load calculated with ACH and AFN as a result of the heat gain and heat loss due to air flow was examined according to the changing size of the window and infiltration rates. When the ACH method is used, it is assumed that the outdoor air directly flows into the residential area and only the heat is transferred from the balcony to the residential area by conduction through the interior window. However, air directly flows into the residential area from the balcony when using the AFN method. Therefore, the greater the difference is between the air temperature inside the balcony and the outdoor air temperature, and the greater the air flows from the balcony to the residential area, the greater the heating and cooling load difference between the model using the AFN method compared with that using the ACH method. As a result, if the solar transmission increases as the window size increases or there is a heating element inside the balcony, the difference in load calculation between the model using the AFN method and the model using ACH gradually increases.
Using the AFN method, the air flowing from the cavity space to the residential area is determined by the air mass flow coefficient, the air mass flow exponent of the building crack, the pressure difference between the outdoor and balcony cavity space, and the pressure difference between the balcony cavity space and residential area. This pressure difference is caused by the wind speed and direction of the outdoor wind, the stack effect, and the operation of the HVAC equipment inside the building. Therefore, when the AFN method is applied to an actual building, it should be applied considering not only the wind speed, but also the height of the room and whether the air conditioner is operating.
When designing the experiment, the same infiltration rate of air was assumed to be flowing indoors through the balcony throughout the year in order to find the worst-case scenario between the model using the ACH method and the model using the AFN method. However, the analysis indicated that there is little difference between the method using ACH and the method using AFN when there is no solar radiation and that the difference increases as the solar radiation increases. In other words, the differences are not so obvious when the wind blows at a constant speed throughout the year, but are dominant when the wind does not blow during the night and is stronger alongside the occurrence of sunlight during the day. Therefore, there may be larger differences between actual cases and the model using the ACH method compared with those obtained in the results of these simulations, which are associated with the direction the building faces, the location of the building, and the wind patterns during the day and at night.
The building has a heating-dominant energy consumption pattern, and the amount of the cooling load is small compared to the total annual load. However, when calculating the size of the cooling system, caution should be taken in using energy simulation to calculate the air conditioner capacity since the difference may be more than 30% in a building depending on whether ACH or AFN is used.

5. Conclusions

This study compares the results of using a model with the air changes per hour (referred to as the ACH method) and a model using the air flow network (referred to as the AFN method) to calculate the cooling and heating load of a building and to identify the causes of the differences observed.
In the basic case study, the difference in the heat transfer distribution of the model in the interior space of the test bed between the baseline model using the AFN method and the model using the ACH method was investigated. The most significant difference between the two models is the heat transfer that results from infiltration. The heat loss due to infiltration in the model using the ACH method was up to 3.7 times higher than the heat loss due to air flow between the balcony and residential area of the baseline model using the AFN method during the heating design day. The heat loss and gain difference due to infiltration occurs greatly when there is solar insolation in both cooling and heating design days.
In the parameter analysis, the effect of solar radiation and infiltration rate on the difference between the ACH method and the AFN method was investigated.
As the infiltration rate decreases, the ratio of the heat loss/gain due to air flow in the load decreases and as a result, the effect of heat loss due to infiltration on the overall calculated heating load decreases. As the infiltration rate decreases, the difference between the AFN method and the ACH method in the calculated heat loss/gain that is due to air flow increases. The total difference is determined by considering the effects of both decrease and increase.
When there is sunlight during the day, the temperature difference between the balcony and the outside occurs. The result of a parametric analysis shows that the greater the difference is between the air temperature inside the balcony and the outdoor air temperature, and the greater the air flows from the balcony to the residential area, the greater the heating and cooling load difference between the model using the AFN method and that using the ACH method. The result shows that the difference occurs mainly during the day.
In order to know the results of applying actual weather files rather than a virtual case, five domestic cities in South Korea were selected and analyzed. In the case study using the actual weather files, it was observed that the wind direction, wind speed and the solar radiation are major causes for the difference in the results of the calculation made using the AFN method and the ACH method.
Therefore, the differences between the two models will be large in the case of buildings in countries and regions where the wind speed is strong, solar radiation is strong, and the wind is directed from the balcony during the day.

Author Contributions

Conceptualization, J.M.; methodology, J.M. and H.J.; software, J.M.; validation, Y.A. and H.J.; formal analysis, J.M.; investigation, H.J.; resources, Y.A.; data curation, J.M.; writing—original draft preparation, Y.A.; writing—review and editing, J.M.; visualization, H.J.; supervision, J.M.; project administration, J.M.; funding acquisition, Y.A. All authors have read and agreed to the published version of the manuscript.

Funding

This work was funded by the Korea Institute of Energy Technology Evaluation and Planning (KETEP) and the Ministry of Trade, Industry & Energy (MOTIE) (No. 20172010000370). This work was funded by the National Research Foundation of Korea (NRF) (No. 2015R1A5A1037548).

Institutional Review Board Statement

Not applicable.

Informed Consent Statement

Informed consent was obtained from all subjects involved in the study.

Data Availability Statement

The data presented in this study are available on request from the corresponding author. The data are not publicly available due to the data security maintenance of Sun&Light.

Acknowledgments

This work was supported by the Korea Institute of Energy Technology Eval-uation and Planning (KETEP) and the Ministry of Trade, Industry & Energy (MOTIE) of the Re-public of Korea (No. 20172010000370). This work was supported by the National Research Foun-dation of Korea (NRF) grant funded by the Korea government (MSIT) (No. 2015R1A5A1037548).

Conflicts of Interest

The authors declare no conflict of interest.

References

  1. No, S.-T. A Case Study on Seasonal Building Thermal Load Analysis according to Apartment Balcony Extension using Building Energy Simulation Tools. J. Korean Inst. Archit. Sustain. Environ. Build. Syst. 2012, 6, 32–37. [Google Scholar]
  2. Hyun, J.-H.; Choi, M.-H.; Kim, J.-Y.; Park, H.-S. Energy Consumption on Balcony Remodeling Type in an Apartment House. In Proceedings of the SAREK Conference; The Society of Air-Conditioning and Refrigerating Engineers of Korea: Seoul, Korea, 2008; pp. 1406–1411. [Google Scholar]
  3. Lee, Y.; Kim, C. Evaluation of Energy Efficiency According to Altering Balcony Area into Living Area in Apartment. In Proceedings of the KIEAE Winter Summer Conference, Jeju Island, Korea, 21 October 2013; pp. 114–115. [Google Scholar]
  4. Kim, S.-W.; Jung, S.-H.; Lim, J.-H.; Kim, K.-H.; Kim, B.-S. A Comparison Analysis of Case about Balcony Remodeling Considering Energy Efficiency. J. Archit. Inst. Korea Plan. Des. 2006, 22, 313–320. [Google Scholar]
  5. No, S.-T.; Jeong, J.-W. A Study on Comparison of Heating Load by EnergyPlus and Web-based Energy Performance Assessment Tool in an Apartment Housing. J. Archit. Inst. Korea Plan. Des. 2011, 27, 245–252. [Google Scholar]
  6. Seo, J.-M.; Choi, Y.-J.; Song, D.; Chang, H.-J.; Kim, S.-J. Effect of the Balcony Space on Thermal Environment and Heating/Cooling Load in an Apartment House. Korea J. Air-Cond. Refrig. Eng. 2007, 19, 364–371. [Google Scholar]
  7. Yang, Q.; Li, N.; Chen, Y. Energy saving potential and environmental benefit analysis of application of balcony for residence in the hot summer and cold winter area of China. Sustain. Energy Technol. Assess. 2021, 43, 100972. [Google Scholar]
  8. Clarke, J.; Johnstone, C.; Kim, J.; Kokogiannakis, G.; Strachan, P.; Woo, K.-H.; Kang, B.-S. Study of the energy performance of Korean apartment buildings with alternative balcony configurations. In Proceedings of the 10th World Renewable Energy Congress, Glasgow, Scotland, 19–25 July 2008. [Google Scholar]
  9. Hamza, N. Double versus single skin facades in hot arid areas. Energy Build. 2008, 40, 240–248. [Google Scholar] [CrossRef]
  10. Chan, A.; Chow, T.T.; Fong, K.; Lin, Z. Investigation on energy performance of double skin façade in Hong Kong. Energy Build. 2009, 41, 1135–1142. [Google Scholar] [CrossRef]
  11. Gratia, E.; De Herde, A. Optimal operation of a south double-skin facade. Energy Build. 2004, 36, 41–60. [Google Scholar] [CrossRef]
  12. Gratia, E.; De Herde, A. Are energy consumptions decreased with the addition of a double-skin? Energy Build. 2007, 39, 605–619. [Google Scholar] [CrossRef]
  13. Anđelković, A.S.; Mujan, I.; Dakić, S. Experimental validation of a EnergyPlus model: Application of a multi-storey naturally ventilated double skin façade. Energy Build. 2016, 118, 27–36. [Google Scholar] [CrossRef]
  14. Joe, J.; Choi, W.; Kwon, H.; Huh, J.-h. Load characteristics and operation strategies of building integrated with multi-story double skin facade. Energy Build. 2013, 60, 185–198. [Google Scholar] [CrossRef]
  15. Kim, D.-W.; Park, C.-S. Difficulties and limitations in performance simulation of a double skin façade with EnergyPlus. Energy Build. 2011, 43, 3635–3645. [Google Scholar] [CrossRef]
  16. Hilliaho, K.; Lahdensivu, J.; Vinha, J. Glazed space thermal simulation with IDA-ICE 4.61 software—Suitability analysis with case study. Energy Build. 2015, 89, 132–141. [Google Scholar] [CrossRef]
  17. Hilliaho, K.; Mäkitalo, E.; Lahdensivu, J. Energy saving potential of glazed space: Sensitivity analysis. Energy Build. 2015, 99, 87–97. [Google Scholar] [CrossRef]
  18. Mun, J.; Lee, J.; Kim, M. Estimation of Infiltration Rate (ACH Natural) Using Blower Door Test and Simulation. Energies 2021, 14, 912. [Google Scholar] [CrossRef]
  19. Lozinsky, C.H.; Touchie, M.F. The limitations of multi-zone infiltration algorithms in whole building energy simulation engines. In Proceedings of the 10th Conference of IBPSA-Canada (eSim 2018), Montréal, QC, Canada, 9–10 May 2018. [Google Scholar]
  20. U.S. Department of Energy. EnergyPlus Version 8.9.0 Documentation Engineering Reference; U.S. Department of Energy: Washington, DC, USA, 2020.
Figure 1. Side view and floor plan of the test bed.
Energies 14 03955 g001
Figure 2. Front view and section of the envelope.
Energies 14 03955 g002
Figure 3. Hybrid air cleaner system and its operating conditions during the experiment.
Energies 14 03955 g003
Figure 4. Air movement route in the AFN model and in ACH model.
Energies 14 03955 g004
Figure 5. Types of heat transfer on heating design day.
Energies 14 03955 g005
Figure 6. Types of heat transfer on cooling design day.
Energies 14 03955 g006
Figure 7. Comparison of the results of the AFN model and ACH model for a heating design day.
Energies 14 03955 g007
Figure 8. Comparison of the results of the AFN model and the ACH model for a cooling design day.
Energies 14 03955 g008
Figure 9. Total annual heating and cooling loads.
Energies 14 03955 g009
Figure 10. Comparison of the AFN model and ACH model when used to describe annual heating load and air transfer heat loss in parametric analysis 1.
Energies 14 03955 g010
Figure 11. Comparison of the AFN model and the ACH model when used to describe annual cooling load and air transfer heat gain in parametric analysis 1.
Energies 14 03955 g011
Figure 12. Comparison of the AFN model and ACH model for annual heating load and air transfer heat loss in parametric analysis 2.
Energies 14 03955 g012
Figure 13. Comparison of the AFN model and the ACH model for annual cooling load and heat gained by air transfer in parametric analysis 2.
Energies 14 03955 g013
Figure 14. Annual average wind speed and infiltration rate calculated with the AFN method using weather data from several cities.
Energies 14 03955 g014
Figure 15. Comparison of the annual heating load the heat lost via transfer as calculated with the AFN model and the ACH model using weather data from several cities.
Energies 14 03955 g015
Table 1. Difference in the results obtained with the AFN model and the ACH model for several cities.
Heating Load
Difference
Interzone Air
Transfer Heat
Loss Rate
Difference in
Heating Load
Cooling Load
Difference
Interzone Air
Transfer Heat
Gain Rate
Difference in
Cooling Load
Suwon4%10%−24%24%
Daejeon−14%23%−20%19%
Seoul3%9%−5%21%
Inchon−12%22%−27%27%
Jeju−20%16%−29%21%
Publisher’s Note: MDPI stays neutral with regard to jurisdictional claims in published maps and institutional affiliations.

