Article

BioLPG for Clean Cooking in Sub-Saharan Africa: Present and Future Feasibility of Technologies, Feedstocks, Enabling Conditions and Financing

1
The Global LPG Partnership, New York, NY 10065, USA
2
Centre for Environment and Sustainability, University of Surrey, Guildford GU27XH, UK
3
Department of Science, Technology, Engineering & Public Policy, University College London, London WC1E 6BT, UK
4
The Brew-Hammond Energy Centre, Kwame Nkrumah University of Science and Technology, Kumasi AK-039-5028, Ghana
5
Gas Technology Institute, Des Plaines, IL 60018, USA
6
Centre for Environmental Policy, Imperial College, London SW7 1NE, UK
7
Stockholm Environment Institute, Africa Centre, World Agroforestry Centre, Nairobi 00100, Kenya
8
Department of Public Health, Policy and Systems, University of Liverpool, Liverpool L69 3BX, UK
*
Author to whom correspondence should be addressed.
Energies 2021, 14(13), 3916; https://doi.org/10.3390/en14133916
Submission received: 25 May 2021 / Revised: 18 June 2021 / Accepted: 25 June 2021 / Published: 30 June 2021

Abstract

:
Energy supply for clean cooking is a priority for Sub-Saharan Africa (SSA). Liquefied petroleum gas (LPG, i.e., propane or butane or a mixture of both) is an economically efficient, cooking energy solution used by over 2.5 billion people worldwide and scaled up in numerous low- and middle-income countries (LMICs). Investigation of the technical, policy, economic and physical requirements of producing LPG from renewable feedstocks (bioLPG) finds feasibility at scale in Africa. Biogas and syngas from the circular economic repurposing of municipal solid waste and agricultural waste can be used in two groundbreaking new chemical processes (Cool LPG or Integrated Hydropyrolysis and Hydroconversion (IH2)) to selectively produce bioLPG. Evidence about the nature and scale potential of bioLPG presented in this study justifies further investment in the development of bioLPG as a fuel that can make a major contribution toward enabling an SSA green economy and universal energy access. Techno-economic assessments of five potential projects from Ghana, Kenya and Rwanda illustrate what might be possible. BioLPG technology is in the early days of development, so normal technology piloting and de-risking need to be undertaken. However, fully developed bioLPG production could greatly reduce the public and private sector investment required to significantly increase SSA clean cooking capacity.

1. Introduction

Modern energy cooking services (MECS), the ability to cook efficiently, cleanly, conveniently, reliably, safely and affordably [1], are now regarded as an urgent human development priority. Globally, 4 billion people lack MECS, according to latest estimates [1]. Around 900 million people in Sub-Saharan Africa (SSA) cook with traditional solid fuels, such as firewood, charcoal and animal manure, and suffer 490,000 deaths per year directly attributable to smoke and pollution from ‘dirty’ cooking fuels, and the number grows every year [2].
SSA governments and the international development community have focused on what MECS solutions can be provided at scale as soon as possible [1,3], and are consistent with global ambitions towards a net-zero carbon economy.
A plethora of technology, business model and policy interventions are in early stages of evaluation, but leading global organizations are focusing particularly on two classes of proven clean cooking solutions: electricity and clean fuels in both liquid and gaseous forms (e.g., LPG, bioethanol, biogas) [4,5,6]. Of these clean fuel choices, LPG is now attracting much focus as a high priority, tenable and financeable solution for the next ten years (and perhaps longer) in an effort to achieve Sustainable Energy Goal 7 (SDG7) on universal energy access [1,4,7,8].
Access to LPG (propane, butane or a mixture of the two) is quickly implementable at scale, as demonstrated by recent large-scale national efforts in India [9] and Indonesia [10]. LPG scale-up can take advantage of proven technical, safety, policy and regulatory best practices, as well as well-established market, business and financing models, successfully implemented in high income and low and middle-income countries (LMICs) [11]. LPG is used as a clean cooking fuel by 2.5 billion people already [12], representing 44% of total global LPG demand [13]. Nonetheless, global supply of LPG remains ample and sufficient to meet the projected global demand for 2030 and following years. As of 2020, the SSA region is showing a large increase in LPG demand in Kenya and Nigeria and a diverse set of smaller markets [13].

1.1. How LPG Is Produced and How It Could Be Produced Renewably

Though almost all LPG supply presently comes from fossil fuel operations of the global oil and gas industry, there now exists the possibility that LPG could be produced at scale on an economically viable basis, from renewable feedstocks widely available in SSA countries [14]. Such renewably sourced LPG may be most easily referred to as bioLPG or green LPG. BioLPG is chemically identical to presently marketed fossil LPG [15]. To date, bioLPG production has occurred as a minor co-product of liquid biofuel production from hydroconversion of vegetable oils and animal fats (HVO) in the US and Europe [15,16]. However, new technical developments described in this paper (e.g., Cool LPG) offer the prospect of producing bioLPG, in an economically feasible manner at scale, from municipal solid waste (MSW) and agricultural residues, both of which are available in more than sufficient quantities across SSA. For example, UNEP projects 244 million tonnes per year of MSW produced in Africa by 2025, growing from 125 million tonnes per year in 2012 [17].
BioLPG for clean cooking presents many advantages: (a) at point of use, its emissions are the same low level as those of fossil LPG, its chemical equivalent, and would be protective to health; (b) it would be completely compatible with existing LPG distribution and user infrastructure [18]; (c) its adoption in LMICs would reduce deforestation pressures from firewood and charcoal production and use; (d) compared to business-as-usual use of traditional solid fuels, its emissions profile is significantly more climate friendly due to full renewability, even more so than fossil-derived LPG, which also has an important climate protective role with respect to its negligible black carbon emissions and limited CO2 emissions due to high stove efficiencies [19,20,21]; and (e) it would be a circular economic use of inevitable arisings from municipal solid waste management and agricultural activities.
In terms of relevance to evolving, high priority global climate change mitigation needs, net-zero carbon transition strategies that decarbonize existing energy pathways in a financially sustainable manner have considerable benefits. In the evolution towards a circular economy, economically viable production of renewably sourced bioLPG would also be a route to supply climate friendly fuel to LPG distribution and user ecosystems which already exist in almost every country and can be scaled up. Proven best practices in policies, regulations, regulatory enforcement, technical standards, safety, and market/business structures are in daily use worldwide and can be emulated. Investments in LPG infrastructure and consumer equipment are in place and can be expanded quickly [9,10,22]. Furthermore, bioLPG production in SSA LPG consuming countries would reduce use of foreign exchange for LPG imports. All these reasons make bioLPG consistent with the principles of a Just Transition [23], because bioLPG enables African national desires to scale-up LPG use to become supportive of the global urgency to transition to a green economy while achieving African desires to achieve clean cooking using LPG.

1.2. Aims and Significance of This Paper

The research community, the international development community and the private sector to-date have not focused on the potential of bioLPG (particularly to supply butane, a major part of SSA LPG demand) in a developing country context.
This study addresses the following two important questions not articulated by previous research: (1) Is it technically possible to produce LPG from renewable resources such as MSW and agricultural residues (bioLPG) at scale in SSA? (2) Is bioLPG production in developing countries economically feasible and implementable? In response to these framing questions, the paper presents a comprehensive methodology, and uses appropriate data and models, to evaluate bioLPG potential, according to the steps below.
First, this paper (a) screens SAA countries for the national LPG sector intentionality that a country must present in order for scoping of bioLPG project potential to have a positive result, and then (b) screens countries for adequacy of their enabling environments, to identify a short list of countries where an initial scoping of possible projects might best be focused. The six countries which emerge from the country screening process are Cameroon, Ghana, Kenya, Rwanda, Senegal and Tanzania. From those six countries, Ghana, Kenya and Rwanda emerged as the countries that best meet enabling environment sufficiency.
Second, this paper assesses those three short-listed countries through the multiple lenses of key criteria that must be considered and coordinated: (a) technical processes; (b) feedstocks and their sufficient availability; (c) costs of construction and operation; and (d) financial feasibility considerations and financing sources. Based on those analyses, the paper then identifies a recommended priority list of five projects which merit detailed examination. Those five projects are located in Ghana, Kenya and Rwanda, and contemplate both MSW and agricultural residues as feedstocks.
Third, this paper presents initial analyses of the projected technical and economic performance of the five selected projects, and consideration of financing options.
Fourth, the paper offers recommendations on further research that can accelerate and strengthen bioLPG feasibility and justify implementation at scale.

2. Materials and Methods

2.1. Country Screening and Project Identification

Triage Process to Identify Focus Countries and Candidate bioLPG Projects

The paper focuses only on those SSA countries offering the critical mass of starting conditions justifying detailed analysis of bioLPG project potential. An objective, data-based triage process has been undertaken to enable identification of countries which present satisfactory initial conditions which comply with the criteria outlined below:
  • First triage: National intentionality and action to develop the LPG sector. Evidence of (a) national need for clean cooking, (b) stated intentions to scale up the national LPG sectors, and (c) planning and implementation steps to accomplish LPG sector scale-up. Application of these screens to SSA (see Table 1) identified six countries as candidates for deeper investigation of bioLPG project potential: Cameroon, Ghana, Kenya, Rwanda, Senegal and Tanzania.
  • Second triage: Enabling environment and capability of political system. Government commitment and support are of the utmost importance in order to induce the financing and implementation of an infrastructure system for biofuels. The literature is replete with emphasis on the importance and primacy of state policies and institutions. In Europe, studies note that the main barriers to renewable energy production in agriculture are frequent changes in policies, complicated legislatures, and a general perception of unpredictable national policy instruments [29,30].
In Africa, Kemausuor et al. [31] identified the lack of regulatory policies and incentives as the main reasons for insufficient progress in the deployment of commercial biogas plants. Realization of the benefits of biofuels at minimum requires a high-level commitment to increase access to alternative modern cooking energy, a renewable energy policy and a commitment to solid waste management that is also linked to national climate change mitigation and adaptation action plans. A review of these requirements against the six countries that emerged from Triage 1 demonstrates that some countries meet these threshold conditions more fully than others. For instance, although renewable energy is an important part of Cameroon’s plan to increase energy security, the lack of a proactive renewable energy policy limits progress in this area [32]. In Senegal, the legal framework that governs the solid waste management sector is inadequate and the lack of clarity regarding the specific laws that govern the sector creates an institutional environment that is difficult to navigate [33]. In Tanzania, there is currently no comprehensive national LPG plan (with defined key projects or schedules of targets) integrated into the national development strategy [34]. Within the bioenergy sector, the establishment of an enabling environment is often a challenge because the policies and regulations needed to stimulate sector development are distributed across numerous policy areas such as waste handling, energy and agriculture, which results in a complex policy landscape that is difficult to coordinate [29]. Inter-sector coordination of ministerial activities must be facilitated and ensured by a high-level political commitment that sets out a clear vision within interacting sectors (e.g., land use, waste, agriculture, environment, finance, urban management). Such political commitment, often required at the level of the Head of Government, must convince financiers and investors that it will be stable enough through changes in government over the required life of investments in the sector. Stability and enforceability of law are paramount considerations. Three of the six countries passing Triage 1, Ghana, Kenya and Rwanda, not only met the minimum requirements, but were also able to exceed those minimum requirements in their current statuses of having enabling policy and regulatory environments sufficient to support the development of bioLPG projects.
  • Third triage: Selection of technical process options. Choice of technical options required simultaneous and interactive consideration of process feedstock needs and availability of suitable feedstocks in adequate quantity. The technical options and their triaging are described in more detail in Section 2.2.
  • Fourth triage: Feedstock selection and identification of project possibilities. Scanning of feedstock potential (viable quantities, siting, and notional economics of MSW or agricultural waste) was conducted in order to identify promising project types in Ghana, Kenya and Rwanda; this final triage yielded the results and five project choices analysed in detail in Section 2.3.

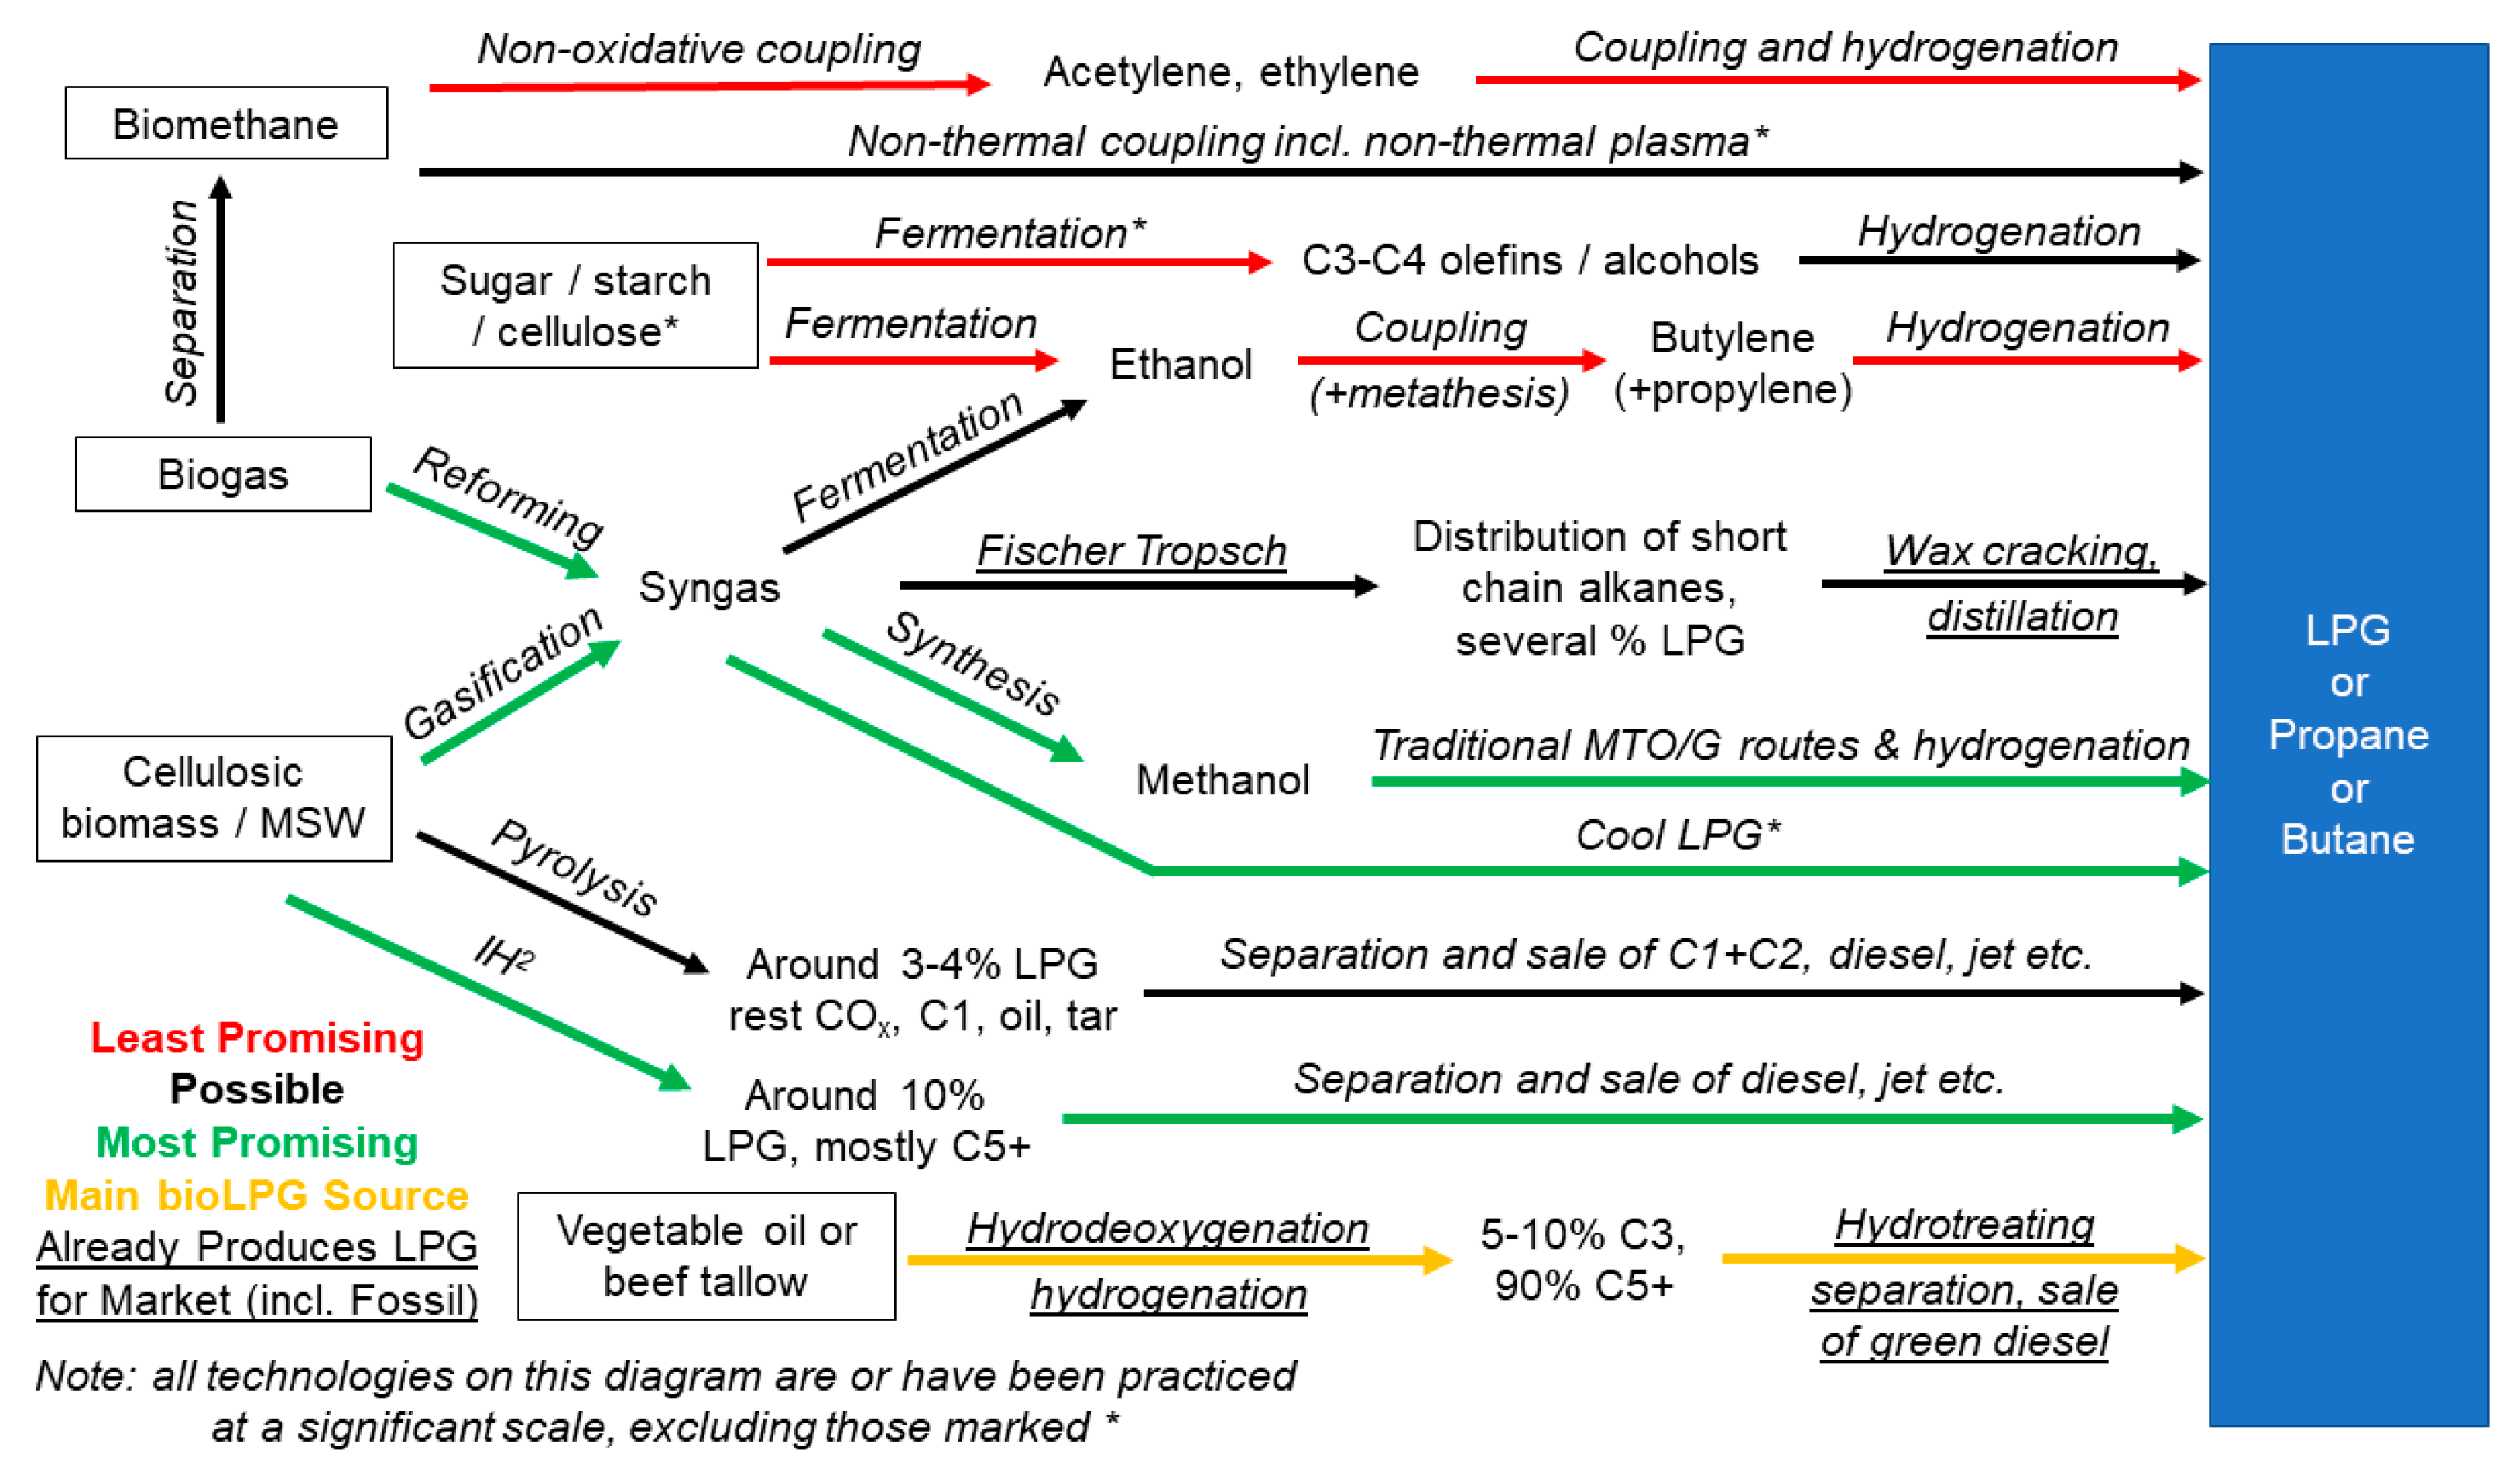
2.2. Triaging Technical Pathways to bioLPG Production

There are several main families of routes for bioLPG production, summarized in Figure 1. Categorisation is not always distinct, due to the variety of methods and feedstocks that can produce the same chemical intermediates and the variety of ways a given intermediate can be transformed into LPG. Process terminology follows standard usages.
Here, the technologies are categorised at a high level by common technological approaches or common chemical intermediates to chemically transforming organic feed material into precursors for LPG or directly into LPG. Figure 1 presents a map of choices. The categories are: (1) Fermentation: saccharides, lignocellulose or syngas to fuels or chemicals; (2) Hydrolysis and hydrodeoxygenation of triglycerides; (3) Direct thermochemical conversion of MSW; and (4) Waste to biogas and biogas conversion.
The criteria detailing why some routes are more promising than others are fully discussed in GLPGP 2020 [14]. The criteria include: (i) Chemistry established, viable thermodynamics; (ii) Feasible operating conditions (incl. available feedstock); (iii) Production of LPG versus other valuable products; (iv) Complexity (incl. number of unit operations); (v) Competing pathways (side reactions, contamination risks, degradation, coking); and (vi) Estimated time to market. Pathways shown in Figure 1 are listed as most or least promising on the basis of this ranking. The leading candidates per this scoring are AD + Cool LPG and MSW IH2, both in terms of their overall scores and their ability to produce high amounts of LPG from feedstocks that are adequately available in the triaged focus countries (see Section 2.3).

2.2.1. Fermentation

Fermentation of saccharides is a very widely practiced technology to produce ethanol biofuel from crops such as corn and sugarcane, but requires dedicated agricultural space for growing fuel crops, since saccharides are not waste products. Waste biomass, such as widely available lignocellulosic matter, can be fermented into ethanol with current technology but at relatively high expense [35]. Lowering the cost of lignocellulosic bioethanol technology is already a major target across the globe for the production of bioethanol fuel. Notable alternative approaches include bioconversion of syngas (the product of gasification of organic materials) to ethanol. However, even though technology for converting ethanol into LPG is available (via ethanol coupling to butadiene or ethanol dehydration to ethylene followed by coupling and metathesis), the market value of the ethanol or olefin intermediates may be higher than that of the LPG produced. Furthermore, at present, the only significant sources of ethanol for fuel purposes are dedicated fuel crops.
Fermentation technology exists to directly produce longer chain alcohols, which could be deoxygenated to LPG, but the same cost and realizable sales value challenges that apply to bioethanol also apply to longer chain alcohols [36].

2.2.2. Hydrolysis and Hydrodeoxygenation of Triglycerides

Conversion of triglycerides (fats, oils, tallow) to renewable diesel (HVO) is currently the only technology family that produces, as a secondary co-product, quantities of bioLPG commercially. However, considering that a low product fraction of LPG (10% by volume) is inherent to these processes, it is unlikely that this route will deliver significant quantities of bioLPG anywhere. Much larger volumes of triglyceride feedstock would need to become available, as well as assurance of economic viability for the renewable diesel produced as the major output of the processes.

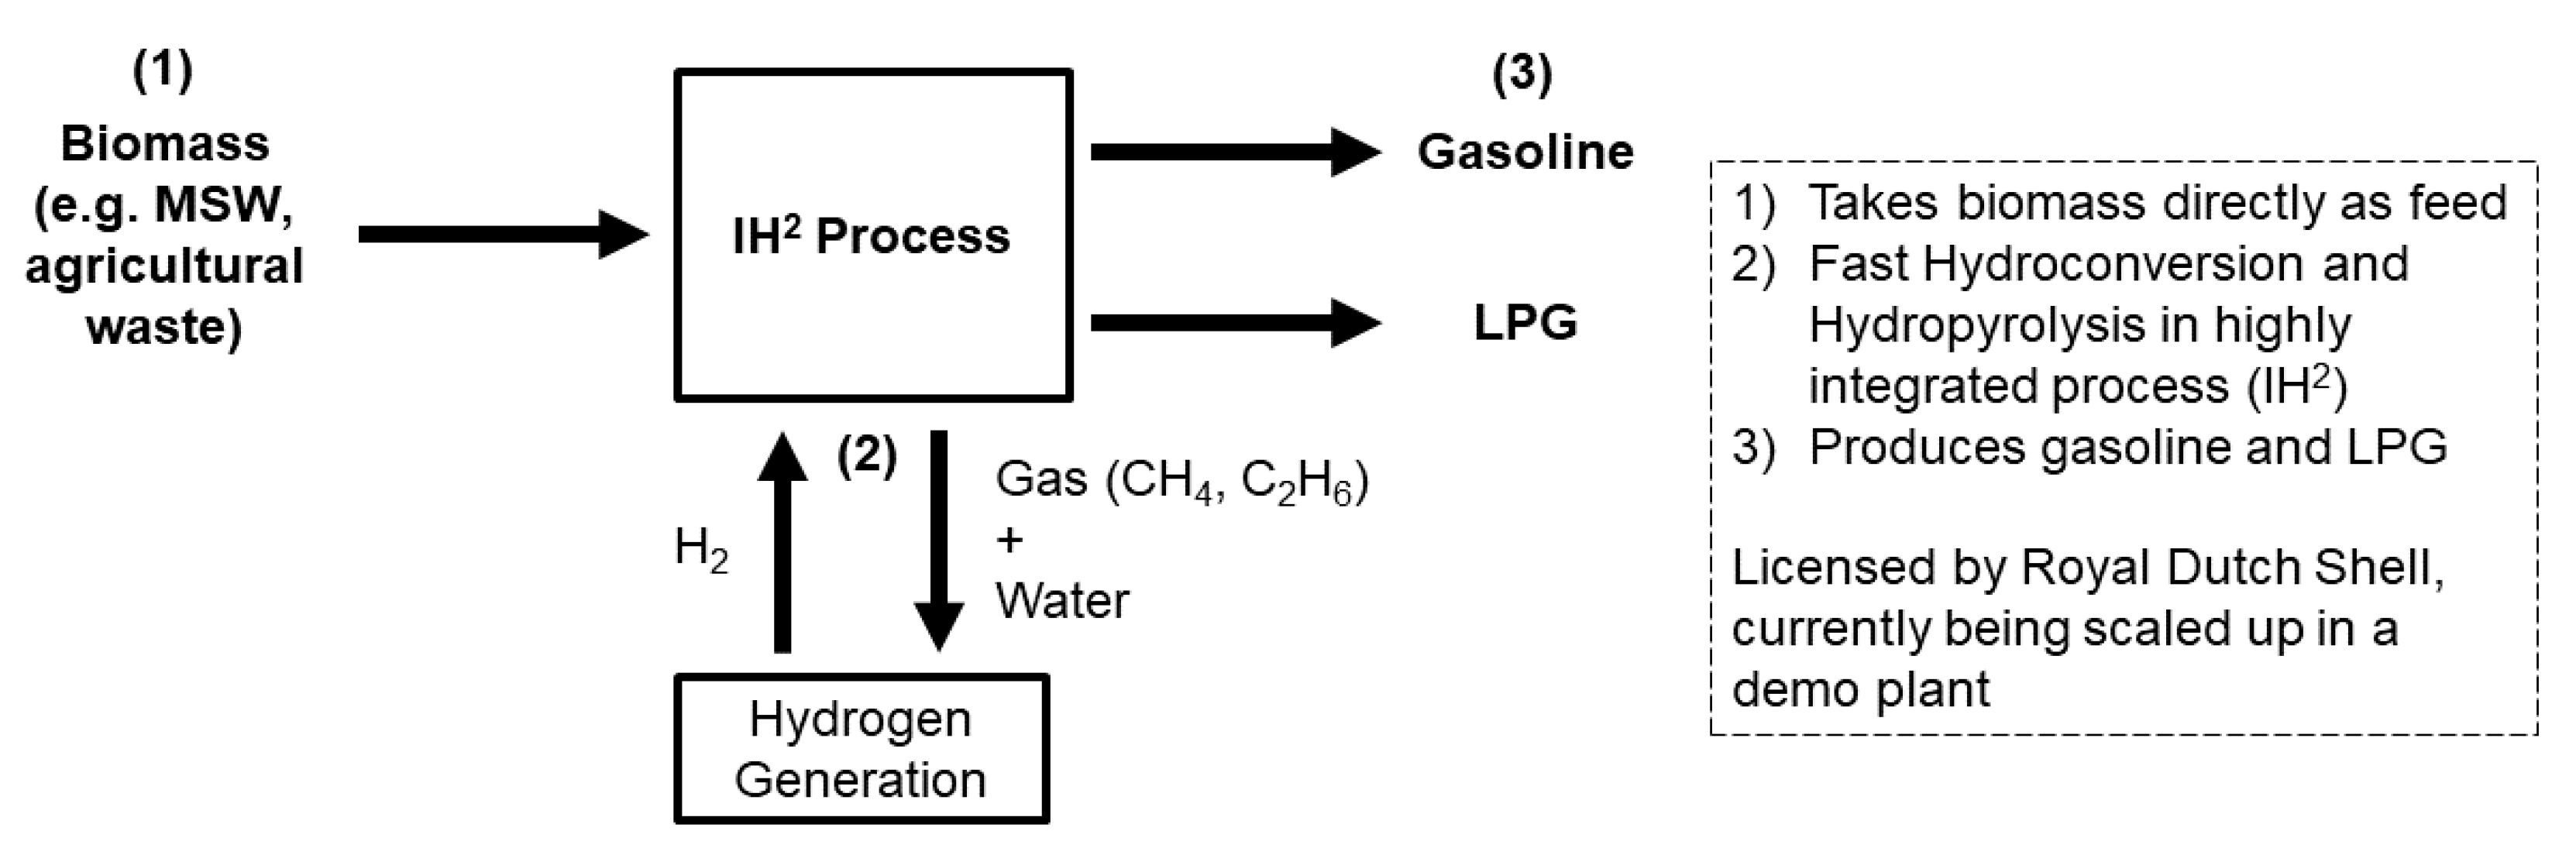
2.2.3. Direct Thermochemical Conversion of MSW

While MSW can be converted to syngas, for example by gasification to feed a syngas to an LPG plant, several conversion technologies for going directly from MSW to fuel are being developed or already exist. Pyrolysis in general does not produce much LPG, although the IH2 biomass to liquid fuels process being developed by Shell is an exception because it has been shown to produce up to 10% of LPG in the process. It is possible that IH2 could be modified to increase the yield of LPG from MSW (see Figure 2), but no such findings have been announced to date. Economically viable, small-scale IH2 plants would also be valuable, if and when developed.

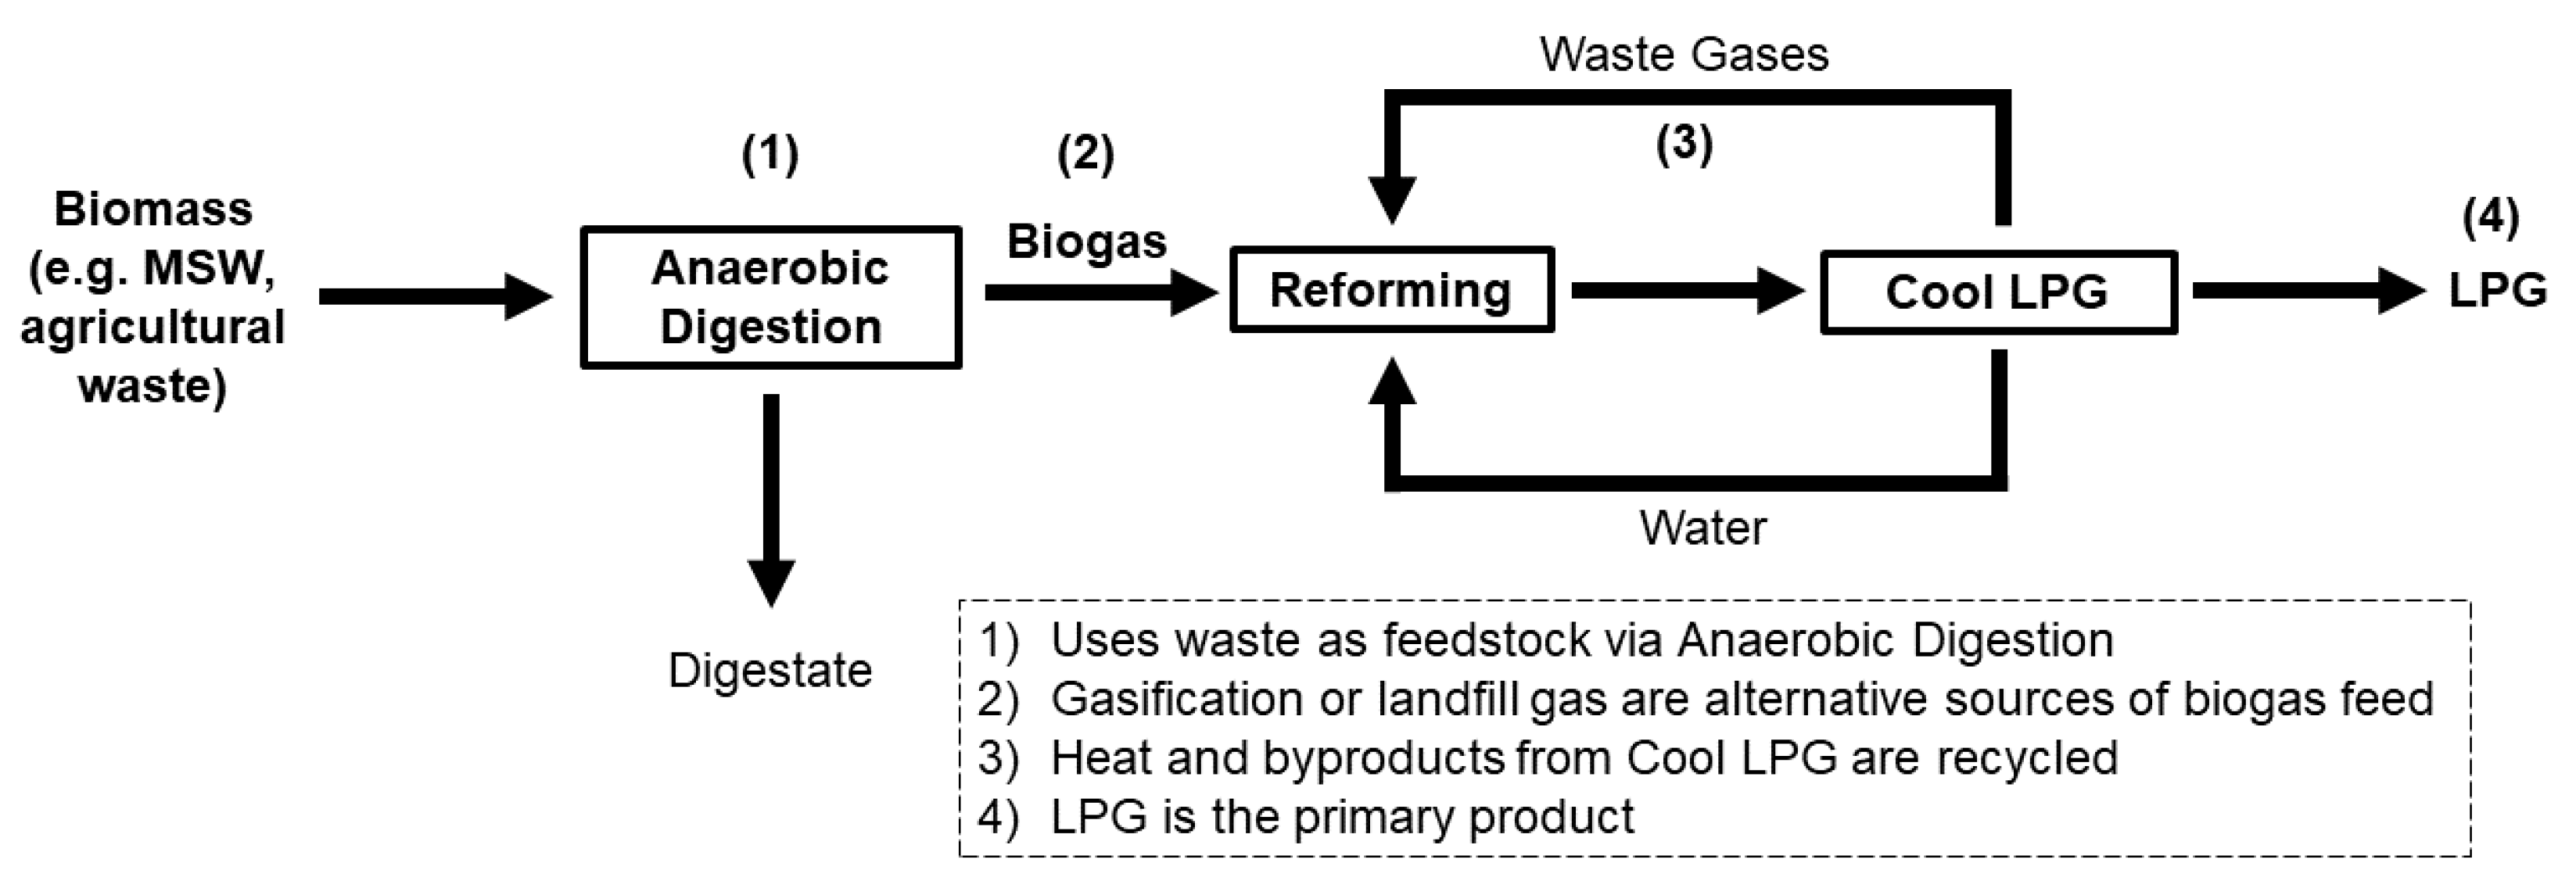
2.2.4. Waste to Biogas and Biogas Conversion

Biogas production by anaerobic digestion (AD) and landfill capture is also widely practiced across the globe with relatively mature technology. The methane in biogas can be separated out and reformed to higher chain length alkanes, via thermal or nonthermal routes, but selective activation of the methane C-H bond is extremely challenging. Thermal methane coupling is mostly being developed to add value to waste gases, whereas nonthermal methane coupling (such as DBD plasma technology) is expected to have competitive economics on smaller scales if and when it reaches higher stages of development. Biogas can also be reformed to produce syngas, either after methane purification or using newer dry or bi reforming technology, and LPG can be made from syngas via a variety of routes. Fischer Tropsch technology produces a small quantity of LPG by-product, although the propane component is typically recycled with the goal of producing heavier liquid fuels. Selectively producing propane and butane and economically scaling down are two challenges facing bioLPG production by a Fischer Tropsch approach. Methanol-based routes to liquid fuels and products in the C3/C4 range are also industrially performed, although they do not generally aim to produce LPG and in many cases this approach is performed at very large scales [37]. Cool LPG is a process under development at the Gas Technology Institute (GTI) based on a methanol intermediate with the direct aim of LPG production using a scalable integrated process [37] (see Figure 3).

2.3. Availability of Appropriate Feedstocks in Triaged Countries

Selection of feasible chemical process pathways was detailed in Section 2.2 above, using economic, policy and physical availability criteria. Consideration of LPG production using fermentation routes was ruled out for economic reasons and on grounds of incompatibility with evolving land use policies in most countries. Consideration of LPG production using hydrolysis/hydrodeoxygenation routes was ruled out due to the low production volumes of propane produced per ton of feedstock (propane is a minor co-product of the processes), absence of butane production and raw feedstock insufficiency.
The feedstock requirements for the production of bioLPG at scale by thermochemical conversion of MSW and waste to biogas/biogas conversion to LPG were found to be acceptable from a policy point of view and possible to obtain widely at scale with acceptable economics. Relevant feedstock types and reference plant quantity needs in the three focus countries are summarised in Table 2.

2.3.1. Feedstock Evaluation Criteria

Potential feedstocks from agriculture and agro-processing (both crop and livestock related waste arisings) are evaluated by the following criteria: (a) agricultural potential by country and crop, e.g., scale of production and processing operations; commercial/plantation productions vs. small holder growing, (b) access to sufficient feedstock at centralised points, without the need for developing extensive feedstock collection systems, (c) estimated cost of feedstock (where it is sold), (d) potential competition for resources, where feedstock may be utilised locally or earmarked for future projects, (e) sustainability issues associated with particular crop wastes, and (f) supportive policy mechanisms for agriculture and energy.
Urban wastes (MSW, sewage and sludges from wastewater treatment) are evaluated according to the following criteria: (a) existing management systems for MSW (e.g., degree of waste management at landfill sites or dumps; pre-sorting of waste or requirement for waste sorting as a pre-process to bioLPG production), (b) existing infrastructure for managing urban waste, (c) level of investment required to develop infrastructure to bring urban waste to a centralised point for conversion to bioLPG, (d) the organic or biodegradable fraction of the waste (i.e., organic matter fraction, or food waste content), (e) the cost of feedstock, and (f) supportive policy mechanisms for waste management and energy provision.
In industrialized countries, minimization of landfilling and value recovery through material recycling and energy-from-waste are often priorities, frequently supported by separation of waste at source, by households and businesses. In low-income countries mixed waste collection is typical and 93% of waste is dumped in simple landfills [38]. For both MSW and agricultural sources, the selection of feedstock for the production of bioLPG must consider production points and points of distribution for the bioLPG. Rural environments can present relatively wide dispersal of bioLPG feedstock and bioLPG user populations, thus requiring increased feedstock collection and LPG distribution costs. These economic factors suggested the importance of siting a bioLPG point of production in adequate proximity to both feedstock resources and bioLPG customers, i.e., closer to urban communities or centralized aggregation points for agricultural residues.

2.3.2. Results of Feedstock Analyses for Ghana, Kenya and Rwanda

The focus for project identification was placed on Ghana, Kenya and Rwanda, and the feedstocks available which can support the Cool LPG and IH2 processes (see Section 2.3 for reasons why other processes were not considered). Table 3 summarises the feedstocks which were reviewed based on the feedstock evaluation criteria (Section 2.3.1).
Analysis of feedstock types, their locations, quantities potentially available, and logistics resulted in the definition of five projects for detailed analysis: (1) Kenya (Thika district) agricultural waste to bioLPG via the Cool LPG process; (2) Ghana MSW to bioLPG via the IH2 process; (3) Ghana MSW to bioLPG via the Cool LPG process; (4) Rwanda MSW to bioLPG via the IH2 process; (5) Rwanda MSW to bioLPG via the Cool LPG process.

2.4. The ‘Enabling Environment’ in Ghana, Kenya and Rwanda

At the macro level, the triaged countries at the focus of this analysis (Ghana, Kenya and Rwanda) demonstrate a strong commitment to relevant international agreements and goals, including the Paris Agreement, the Africa Vision 2063, and the UNSDGs. They express a commitment to ensure access to modern and environmentally friendly energy for all. They also have expressed a strong commitment to reduce greenhouse gases (GHGs) emission, increase access to clean energy, create opportunities to increase investment in renewable energies, and improve waste management (e.g., [51,52,53,54]). They have also been actively mainstreaming their nationally determined contributions (NDCs) into national development plans and sectoral policies to ensure realisation. For instance, in Ghana, a notable increase in the net emissions from waste has led to a commitment to mitigating actions [52]. Similarly, in Rwanda, the updated NDC offers a strong case and an elaborated plan for waste-to-energy (WtE) projects as its waste management strategy [54]. In Kenya, the Energy Act (2019) outlines their national policy intention to facilitate the development of bioenergy (biofuel and biogas) and to collaborate with municipal authorities to make WtE projects economically feasible [55]. Ghana’s Draft National Energy Policy (2020) also recognises the WtE potential of agricultural residues and agro-based industries [56].
To attract private sector capital to complement public sector capital, energy policies must also have the characteristics that nourish market-based and investor-oriented solutions such as green funds and de-risking programmes. Some countries have taken measures to integrate policy frameworks that combine direct policies with more systemic ones, such as feed-in tariffs. For instance, both Rwanda (National Energy Strategy) and Kenya (Energy Act 2019) have developed policies that aim at a systemic transition towards modern, clean energy sources. These policies form part of more extensive policy frameworks that take into account the cross-cutting requirements of renewable energy and address economic and socio-ecological dimensions [57]. Rwanda’s National Energy Strategy includes long-term strategies such as support for research and development on renewables and recognises its cross-pollinating capacities in setting up capacity-building programmes. This more comprehensive, policy integration approach, however, is not the case for all countries in SSA and their relevant sectors. Although the energy sector is often adequately structured to attract investment, other sectors, particularly waste management, tend to be fragmented and incoherent. Most SSA countries do not have a reliable system in place for waste management. Often, environmental policy is weak, and there are no clear policies on the use of renewable energy from waste [17]. Even in Kenya, one study notes that the sector suffers from a lack of government enforcement of existing regulations and duplication of responsibilities [58].
Coordination underpins policy coherence and plays an essential role in creating an enabling environment. The risks associated with an uncoordinated approach include Balkanized and uncoordinated policies, perverse incentives, inefficient use of finance, competing narratives, and public distrust [59,60]. WtE transition literature identifies poor inter-ministerial coordination as a major hindrance to private sector involvement and contribution [61]. Thus, some governments are taking steps to ensure inter-agencies and cross-sectoral coordination. For instance, Rwanda has high-level authorities that are mandated to work closely with multiple government agencies and facilitate coordination among the stakeholders, including the private sector [62]. The Kenya Climate Change Act (2016) [63] mandates establishment of a National Climate Change Council that the President chairs, with cabinet secretaries representing the environment, economic planning, treasury, and energy ministries. The Act also requires representation on the Council from civil society and the private sector.

3. Results

3.1. Cost Estimates and Financial Feasibility Considerations for the Identified bioLPG Plant Projects

This section presents (a) Techno-Economic Assessment (TEA) estimates of capital and operating costs for various bioLPG production plant sizes; (b) feedstock cost estimations and (c) the economic/financial modelling and finance sourcing strategies for the five pilot project possibilities in Ghana, Kenya and Rwanda identified by the triage process set forth in Section 2.1 Many of the model input variables are subject to market changes. The results presented in this paper were based on data gathered in mid-2020. However, readers are encouraged to source current data and insert them into their version of the model methodology, in order to create current, country and project specific projections.

3.1.1. General Framework for Cost Estimation

BioLPG production from biogas or syngas is in its early days, so construction costs and operating costs of the reference size plants can presently only be indicated using accepted estimation techniques. However, several factors should be noted: (a) the conceptual process flow diagrams of the Cool LPG and IH2 processes delineate stages of the process which are well-known technology up to the final LPG-producing reactor, thus making the overall plant construction estimates likely to be quite accurate, and (b) the non-feedstock operating cost estimates, including the costs related to the innovative catalysts used in the final conversion steps of both processes, are based on published data for similar processes and are therefore not likely to have huge inaccuracy. Therefore, the order of magnitude of the projected costs presented in this analysis is very likely correct. However, detailed testing and scale-up is required to arrive at firm and precise cost knowledge. The feedstock costs, involving sourcing of wastes and preparation of feedstock, are assessed as a separate element of operating cost, and are highly dependent on local conditions.
The two processes selected for cost analysis were Cool LPG (the LPG-focused process variant of the Cool Gas family of reforming technologies) and IH2, which both have the two unique advantages of (a) producing high proportions of LPG from an economically efficient reforming route and (b) being highly suitable for processing the feed-gas-producing potential of the MSW and agro-waste widely available in SSA in quantity and existing in an as yet unexploited status. Even though reference is made to countries of identified projects, capital and operating costs are generic to the processes and not project-specific or country-specific. These costs are defined and estimated in Section 3.1.2. Feedstock costs will be country and site/project specific, and are defined and estimated in Section 3.1.3. Details of the sources of cost estimation methods can be found in the Supplementary Materials.

3.1.2. Capital and Operating Costs (Not Including Feedstock) of IH2 and Cool LPG Plants in Ghana or Rwanda

The projected capital and operating costs for IH2 and Cool LPG plants of three different sizes (expressed in Kilo Tonnes per Annum (ktpa)) are summarized in Table 4 and Table 5, with feedstock costs excluded. Categories of operating costs listed in the tables below include annual expenses such as labour, electrical power and maintenance.
Additional capital expenditure (CapEx) savings can be anticipated for the Cool LPG process, by comparing capital investment experiences of existing methanol production plants, which are technologically similar to Cool LPG. CapEx for typical small methanol plants are in the range of US$ 19–30 million (25 ktpa), US$ 8–12 million (10 ktpa) and US$ 4–6 million (5 ktpa)—between 50–65% lower than the costs for Cool LPG estimated here [64]. The CapEx estimates for these methanol plants are significantly lower because of the economic benefits of modular construction technology used to facilitate small plant construction. Modular technology allows construction and preliminary testing of a plant in a centralized location, and then transportation of the plant in one or several sections to the end-use site.
The CapEx projections in Table 5 do not incorporate an adjustment factor reflecting the probable lower cost resulting from using integrated modular technology. The real cost of a modular small-scale plant of this type could be expected to be around 65% of the scaled plant costs shown in Table 5 [65]. Therefore, Cool LPG CapEx (but not the AD plant CapEx) is adjusted downward by this factor in the case studies shown in Table 6.

3.1.3. MSW for IH2 or Cool LPG in Ghana and Rwanda

The IH2 process can utilize a wide range of feedstocks. However, given the necessary large scale of processing plant, the analysis has focused on MSW, representing a stream of organic materials typically available at scale and throughout the year. Initial review demonstrated that major cities in Ghana (Accra, Kumasi, Tamale) and Rwanda (Kigali) produce sufficient MSW to support an IH2 plant. MSW can also be a useful feedstock for Cool LPG, with the digestible fraction used to produce biogas via AD. In this paper, the analysis of MSW feedstock costs for the two processes differs only in assumptions about the separation step, because a narrower fraction of the waste is needed for AD.
The quantity of organic materials recoverable per day was calculated from records of total mixed waste delivered to landfill sites serving major urban centres. multiplied by the percentage of the organics fraction typical for those locations, based on waste characterization studies. For example, the Tamale Metropolitan Area is the largest city in northern Ghana, with an estimated population of 950,000 people. The Tamale Landfill receives about 500 t waste per day, with an organic fraction of 58.6% [43]. Waste composition does not seem to vary significantly: Miezah and colleagues (2015) report on several surveys made in Kumasi, Ghana within the wet and dry seasons that did not show any trend in variation of the composition and quantity of MSW. Kigali, the capital city of Rwanda, has a population of approximately 1.2 million people, currently serviced by one landfill site, an open-air dumpsite at Nduba opened in 2012. Around 1900 t of waste are generated in Kigali per day, with between 400 and 800 t of unsorted MSW delivered to Nduba [66,67]. The delivered MSW is high in organic content (food and green waste account for 70%). For MSW, the raw feedstock cost is termed a “gate fee” or “tipping fee”. This often represents a payment made by the local waste authority to a provider of waste management services, usually to cover the costs of treating the waste, whether for landfill disposal or value recovery [68]. However, internationally, gate fees vary widely as they can be used as policy instruments to incentivize desired practices. Where the gate fee is the waste management operators’ main source of income, they might typically be paid a gate fee reflecting the expected cost per tonne of operations. Where the operator is recovering significant material or energy value from the waste, the local waste authority may seek to charge for the waste, seeing it instead as a valuable resource. The analyses for both Ghana and Rwanda explore a range of gate fee values, from US$ −10 to +10/t. MSW is typically collected by the local waste authority, at their expense, from local sites across a city in small-medium sized lorries, which then deliver it to a waste transfer station located adjacent to the city. Data were obtained for Ghana for onward transport of waste from the transfer station to the treatment site, in large 30 tonne haulage trucks, estimated to cost $6/t (for the 72 km return journey) (waste management company, pers comm).
The appropriate organic waste fraction will need to be separated out and processed for input to the bioLPG plant: for IH2 this is simply all organic material; for input to AD for Cool LPG, only the biodegradable fraction is used. Material Recovery Facility (MRF) is the generic term for the sorting, processing and recycling stage of waste management, with “dirty” MRF the term for an MRF handling unsorted MSW [69]. MRFs range from low-technology systems mainly using manual hand-picking to high technology facilities with multiple automated stages, sensing and extracting individual material types. The costs of waste sorting have been estimated based on analysis in the international literature. Pressley et al. [70] developed a process model to represent both clean and dirty MRFs, including purchase and maintenance of equipment, labour, energy, and the costs associated with land procurement and building construction. A simple dirty MRF is estimated to cost $23.6/t. Once separated out, the organic materials may need some pre-processing. For IH2, the material is assumed to be shredded. Stapf et al. [71] estimate the preparation costs to produce a secondary fuel range from 5.00 to 15.52 €/t. No pre-processing is assumed for the biodegradable waste going to AD [71].

3.1.4. Agro-Residues for Cool LPG in Kenya

The Cool LPG process is modelled for this paper as using biogas, derived through AD from biodegradable agricultural residues. The Kenyan Government seeks to establish six agro-processing hubs across the country [72]. One is planned for Thika, a sub-county approximately 42 km from Nairobi. A comparatively large quantity of biodegradable organics is available in the region, from food waste, pig slurry, residues from food production, and also from the organic fractions of MSW.
A particular opportunity was identified as an ‘anchor’ supplier: a large pineapple processing facility owned by Del Monte Kenya Limited (Del Monte) which processes 1500 t of pineapple per day. The total agricultural wastes are estimated to be 800,000 tpa [73], with the pineapple processing plant producing total solid wastes of 260,000 tpa. In addition, twelve flower farms produce flower waste of almost 22,000 tpa [74] and coffee processing residues amount to 8000 tpa of pulp [75].
The total organic waste available for an AD plant from agro-sources in Thika is estimated at 302,525 tpa, with little seasonal variation, due to effective irrigation and use of greenhouses for flowers. Pineapple waste from the Del Monte processing plant, the flower farms, and the coffee estates currently has no costs attached to it, based on existing evidence in the literature. However, farmers and agro-processing plants may levy a small fee once they realise there is a value associated with the waste. A shadow price of approximately $14/t has been suggested [76].
To capitalize on the Del Monte site as an anchor supplier, the AD plant is assumed to be located close to the pineapple processing plant and other waste could be transported there: a collection radius of approximately 15–20 km would be required. Del Monte feedstock is assumed to be transported up to 2 km. The rest of the feedstock would be transported an average of 10 km. Organic waste transportation costs are estimated at $0.28/t-km (not including labour costs) [77].
Feedstock processing may be necessary, to prepare this mixed set of materials into an appropriate feed for the AD plant. However, this just involves mixing the various feedstock elements together to ensure the right consistency and C:N ratio and may also involve the addition of water. The feedstock material would also be screened for contaminants, such as plastic and grits at this stage. As discussed above, some elements of feedstock cost, as seen by the receiving bioLPG plant, are heavily influenced by decisions of the agro-processors or waste authorities. Alternative feedstock cost assumptions are a necessary part of scenario analysis for overall investment analysis and are summarised in Table 6.

3.2. Candidate Project Financial Models and Their Results

Each pilot project has been subjected to economic and financial modelling to determine potential returns to prospective funding sources (Funders). Table 6 presents a modelling of capital expenditures and operating expenditure costs, for the five defined projects in Ghana, Kenya and Rwanda. The key assumptions used in the model are as follows:
  • A bioLPG plant capacity of 10,000 tpa is modelled for AD + Cool LPG. A bioLPG plant capacity of 25,000 tpa (the preferred size for IH2′ economies of scale) is modelled for IH2.
  • The capital cost of the 10,000 tpa AD + Cool LPG plant is projected at US$ 32 million, which is the US$ 40 million capital cost for a 10,000 tpa plant presented in Table 5, with the US$ 24 million Cool LPG component adjusted downward by the 65% adjustment factor described in Section 3.1.2. The capital cost of the 25,000 tpa IH2 plant is projected at US$ 188 million, as presented in Table 4, Capacity 1.
  • The waste input is 270 ktpa for the AD + Cool LPG plants (see Table 5, Capacity 2—Annual MSW input required). The waste input is 167 ktpa for the IH2 plant (see Table 4, Capacity 1—Annual MSW input required).
  • The imported fossil LPG prices against which bioLPG must compete are analysed for LPG delivered in bulk to filling plants (a) located in/near Nairobi, Kenya, US$ 779/tonne; (b) in/near Accra, Ghana, US$ 796/tonne; and (c) in/near Kigali, Rwanda, US$ 903/tonne (higher fossil LPG logistics costs due to Rwanda being landlocked). These costs (as of mid 2020) includes, (i) for Kenya and Rwanda, the average historical Saudi Aramco Contract Price for butane and, (ii) for Ghana, the average historical ex-refinery and import parity price for LPG, ocean transportation, terminal and handling charges at the port, land transport; miscellaneous costs, duties and levies.
  • Gasoline is the main product produced by the IH2 process and gasoline revenue is assumed at US$ 800/tonne.
  • Gating/tipping fees might be received or be paid for MSW feedstock. Table 6 shows results from modelling gating fees ranging from receipt of US$ 10/tonne to payment of US$ 10/tonne.
  • A conservative capital structure with 35% bank/commercial debt @ a 10% interest rate (sovereign debt information on Bloomberg + risk premium), 40% concessional debt from multilateral financial institutions (MFIs) and development banks @ 8% (conservative, based on conversations with DFIs, such as USDFC (formerly OPIC), FMO, and Swedfund using LIBOR + 400–600 basis point premium, depending on country risks and project risks), and 25% equity @ a 20% required internal rate of return (IRR). The blended interest rate is 8.93%, and the blended cost of capital is 11.7%.
  • An exit value of five times earnings before interest, tax, depreciation and amortization (EBITDA) was used to reflect the value of the bioLPG plant’s income generating capacity in outer years.
  • Borrowings starting in the first year, with only interest paid in the first year, and then principal and interest starting at the end of the second year.
All five projects offer acceptable IRRs in the Base Case when the bioLPG is priced US$ 30–50/tonne below the forecasted fossil LPG market price in the country. All five Best Cases project significantly improved and attractive IRRs for AD + Cool LPG projects (rankings #1, #2 and #3), because of their much higher sensitivity to improvements in feedstock cost (due to tipping fee income) as compared to the IH2 projects. The IH2 cases are only economically interesting at larger scale (e.g., bioLPG output of 25,000 tpa).
The economic returns over the 12-year projection periods demonstrate that the projects can comfortably service blended debt in the 10-year to 15-year windows, while generating acceptable IRRs for equity in the ‘Base Case’ scenarios and attractive IRRs (as much as 35% IRR) in the ‘Best Case’ scenarios. The four most important variables that drive financial performance are the cost of the plant, the bioLPG sales price, the cost of the feedstocks, and the tipping fee.

3.3. Financing Issues and Projected LPG Supply Infrastructure and Fuel Costs

Below are key issues and findings regarding scope and availability of finance, as of mid 2020:
(a)
The capacity of local commercial financial institutions to lend is often constrained by national regulatory limits, and when faced with attractive local, lower risk investment alternatives (such as government securities). Risk mitigation assistance then becomes critical to induce local capital to flow.
(b)
The consensus need of potential major local funders (Ghana Infrastructure Fund, the Development Bank of Rwanda, Stanbic, Ecobank, Kenya Commercial Bank, and Databank in Ghana, Kenya, and Rwanda) was for development finance institutions (DFIs) to assist in various forms: grants, technical assistance (TA) for capacity building, investment capital (debt and equity), first-loss guarantees, investment insurance and other risk mitigation facilities.
(c)
The mobilization of international blended financing can be used to “crowd in” meaningful amounts of local funding (OECD: Blended Finance Funds and Facilities), as detailed in LPG Master Plans developed for Kenya, Rwanda, and Ghana [26,27,28]. The specific focus and needs of funding sources must be identified and targeted [78,79].
(d)
DFIs are often the most important early money and risk mitigation sources because they are willing to accept less certainty than the private sector due to their development mandates and offer longer tenors (up to 20 years). Additionally, through their TA, guarantees and first-loss protection, DFIs often enhance the expected economic performance and de-risk investments.
(e)
There is a wide range of potential public sector financial support for LPG projects. These include development/aid agencies (e.g., FCDO/UKAID, USAID, SIDA) for grants and TA; DFIs (e.g., FMO, IFC, KfW, PROPARCO, Swedfund, and USDFC) for capital and risk products; and development banks (e.g., AfDB and local development banks) for capital and risk products.
(f)
Leading DFIs (AfDB, FMO, IFC, Swedfund, and USDFC) have indicated preliminary interest in funding bio-related LPG value chains and LPG-related infrastructure.
(g)
Based on all the above, it is concluded that there is financial institutional interest and capability to explore the funding of Cool LPG projects in Ghana, Kenya and Rwanda at a commercial scale, assuming adequate evidence from well-conducted project feasibility studies.
The cost and finance findings show that bioLPG could be robustly competitive to fossil LPG if economic variables presented in Table 6 fall in forecasted ranges. This is important because it means that further investment in infrastructure for the LPG supply chain and for enabling consumers to use LPG is an excellent use of public and private funding capacity that is likely to be available. Supply chain capacity and user equipment would be able to take advantage of the current and forecast surplus of conventional LPG and then transition to large-scale use of bioLPG as it might become available toward the SDG 7 2030 target.

Indicative Estimates of Capital Expenditures (CapEx) Required to Create Physical LPG Capability for an Additional 500 Million New Users in Sub-Saharan Africa

It is worth noting the relatively modest scale of CapEx required to create LPG user capability (excluding fuel) for incremental, large numbers of the SSA population. The CapEx needed to scale up LPG supply and demand in SSA were modelled using comprehensive data from national LPG sector studies and plans for four countries across West, East and Central SSA (Ghana, Kenya, Rwanda and Cameroon) [25,26,27,28]. The indicative summary data are presented in Table 7.
The industry CapEx includes all critical domestic LPG supply chain assets needed to serve national LPG demand: LPG cylinders, cylinder filling plants, bulk storage, cylinder depots, and bulk and cylinder transportation. The industry CapEx estimates exclude country-specific investments related to the production of LPG (primary oil and gas production, processing and product storage) or import of LPG (import terminals and associated import terminal primary storage). In countries that require it, LPG import infrastructure investment (i.e., import terminals) would add up to approximately 10% to the total industry CapEx need. Industry CapEx provides the investment required to serve the household market as well as commercial, institutional and industrial LPG users as demand expands in those market segments.
The consumer CapEx is the investment needed for households to become capable of using LPG. It is the per new user allocation of the cost of supplying an average size household with an LPG double-burner stove, a hose for connecting the stove to a LPG cylinder and a pressure regulator that enables consistent, precise control over the LPG flame. The assumption on household size is an average of 4.2 persons based on the countries studied. For more detail on the assumptions underpinning the results presented in Table 7, please refer to Supplementary Table S1.
Based on the Table 7 data regarding the four study countries, total CapEx required to provide LPG to 500 million new SSA users is estimated to be in the range of US$ 18.2 billion to 26.4 billion, assuming an average household size of 4.2 and a primary focus on urban/peri-urban areas (see Supplementary Table S1). The total CapEx estimate comprises US$ 13.8 to 18.9 billion incremental capital expenditure by industry (supply-side) and US$ 4.4 to 7.5 billion incremental capital expenditure by households (demand-side).
As another approach to calculating clean cooking financing requirements by 2030, it should be noted that ESMAP 2020 estimates the required CapEx and Fuel investment for achieving Tier 4 clean cooking for 263 million SSA households through 2030 at US$ 452 billion, which can be extrapolated to US$ 206 billion for 120 million SSA households [1].
Although other SSA countries will differ in their national circumstances, the range of projected investment needs in the four countries whose data were used for Table 7 is narrow enough and low enough to be useful in justifying serious consideration of LPG sector development in order to accelerate efforts to achieve SDG 7. It also helps explain why other countries in South Asia and Latin America have been able to achieve substantial scale in implementation of LPG for clean cooking [9,10,80].

4. Discussion

BioLPG produced domestically by low and middle-income countries is potentially an important element in harmonizing urgent health, climate, clean cooking, and environmental agendas in countries that currently rely heavily on polluting solid cooking fuels. Furthermore, many developing countries have expressed desire for LPG sector development assistance. The prospect of bioLPG at scale could reduce tensions around climate justice and national sovereignty arising from development partners’ concerns about fossil-derived LPG.
The linking of bioLPG to feedstock from waste management adds an element of complexity to its development. Two projects (a waste handling project and a bioLPG production project) must be synchronized in planning, contractual connection and financing, as well as provision of an adequate enabling environment from the government. However, there are many examples of successful linkage between waste handling and energy plants, with financial value of energy recovery providing the impetus, but leading to a wider set of social and environmental benefits. The urgent need for modern waste handling in rapidly growing SSA cities creates an incentive for using the energy content of the waste [67]. Although discussion of the highest and best use of energy recoverable from MSW and agricultural wastes was not the main focus of this paper, an initial analysis of data from recent waste to energy (WtE) projects in China and Saudi Arabia fully described in the GLPGP 2020 report [14], shows that biogas produced from waste handling systems provides cooking energy to more households when converted into LPG than when converted into electricity.
The technical options for bioLPG production have been presented and considered in tandem with the feedstock possibilities. The needed enabling environment conditions have been outlined in relation to the realities of project development and viability. The construction scope and costs, and operating costs, have been detailed. All these elements are relatively stable in their characteristics. What is most volatile and difficult to present in reliable and stable detail are the availability, amount, conditions and sources of finance for the projects presented or any other project. Finance conditions can be very volatile.
This paper describes analytical methodologies, enabling criteria and non-site-specific technical and economic elements that can be the basis for preparing any SSA country to consider, plan and implement bioLPG capability that could serve growing national LPG needs. The countries (and projects in those countries), which were examined in detail in this paper, were selected because of their potential to successfully develop bioLPG faster. A first generation of successful projects would produce learnings from which other countries in the African continent and elsewhere could benefit.

Next Phases of bioLPG Development

This paper bridges the world of research and the world of practice and implementation. Its conclusions are robust enough to warrant provision of adequate funding to carry out the next phases of bioLPG development. The next phases are a standard series of steps that should be carried out to de-risk and progress a new industrial technology towards deployment:
  • Fund next steps of technical process development and refinement, which is a general need and not site-specific.
  • Fund and carry out detailed feasibility studies for bioLPG demonstration plants in carefully selected sites.
  • Finance and build demonstration bioLPG plants, incorporate learnings into commercialization planning.
  • Develop and put into service commercially viable bioLPG plants across SSA.
Additional research activities whose results could markedly shorten time to plan, finance, build and commission bioLPG projects in SAA, should be focused to achieve:
  • Stimulation of SSA governments to explore bioLPG as a solution, with coordination across relevant ministries and agencies and complementary stimulation of TA funding.
  • Stimulation of international development organizations and funding sources to support bioLPG as a solution and to engage with SSA governments to assess and develop bioLPG production capacity and related feedstock projects.
  • Stimulation of finance institutions to build human capacity and decision-maker interest in serving a bioLPG project market and reducing risk premiums included in finance pricing.
  • Stimulation of planning and funding of urban MSW capacity, as feedstock for bioLPG.

5. Conclusions

This paper accomplishes three overarching, important goals: (1) It details the key elements of technical feasibility to produce bioLPG from renewable resources such as MSW and agricultural residues at scale in SSA and, as a collateral benefit, to valorise rapidly increasing MSW production in Africa. (2) It provides a comprehensive methodology to assess bioLPG project feasibility in SSA, presenting detailed techno-economic assessments of five candidate pilot projects across countries in East and West Africa. (3) It provides sufficient initial confidence in the bioLPG proposition to justify the grant of further funds for carrying out detailed feasibility studies and subsequent construction of demonstration plans that can lead to full bioLPG commercialization in SSA.
Taken as a whole, the findings of this study should function as a foundation methodology and justification for development of bioLPG project feasibility studies in SSA countries, leading towards the possibility in the medium-term (before 2030) of bioLPG becoming a major contributor towards the provision of MECS in SSA and achievement of SDG 7 clean cooking objectives.
The attractiveness of quickly moving on development of bioLPG for serving clean cooking needs is heightened by the possibility that increased emphasis on, and investment in, LPG could reduce by as much as an order of magnitude the amount of investment and use of public sector funds necessary to create clean cooking for a substantial portion of SSA households before 2030. LPG and bioLPG can make a very significant contribution to the global community’s ambition to achieve universal energy access, including its key element of clean cooking.

Supplementary Materials

The following additional sections are online at https://www.mdpi.com/article/10.3390/en14133916/s1: (i) Methodology and assumptions for the TEA capital and operating cost estimates and Table S1: Country-level data on Industry CapEx and Consumer CapEx required to create physical LPG capability in Sub-Saharan Africa.

Author Contributions

K.C.C. and E.P. designed the study and secured the funding. K.C.C., E.P., and M.L. wrote the paper with contributions from all co-authors. P.L. and T.M. led the technical pathway analysis. M.J.B., O.M., F.K., and R.D.-C. led the feedstock analysis. M.T. wrote the policy section. P.L. and M.L. developed the cost estimates for the bioLPG plant and feedstock preparation. J.H., D.S., and A.W.E. conducted the financial analysis. R.J.M. and Y.M. contributed to data interpretation. All authors have read and agreed to the published version of the manuscript.

Funding

This work was supported by the Modern Energy Cooking Solutions (MECS) programme, funded by UK Aid (GB-GOV-1-300123). The authors further acknowledge the support of the CLEAN-Air (Africa) Global Health Research Group in dissemination and publication. CLEAN-Air (Africa) is funded by the National Institute for Health Research (NIHR) (ref: 17/63/155) using UK aid from the UK government to support global health research. The views expressed in this publication are those of the authors and not necessarily those of the UK-Aid or NIHR or the UK Department of Health and Social Care.

Data Availability Statement

The data is contained within the article and Supplementary Materials. Further detail is available in the reference report: GLPGP, 2020. Assessing Potential for BioLPG Production and Use within the Cooking Energy Sector in Africa. Available online: https://www.ccacoalition.org/en/resources/assessing-potential-biolpg-production-and-use-within-cooking-energy-sector-africa (accessed on 29 June 2021).

Acknowledgments

Authors would like to thank the following individuals for their contribution to the work: James Seaba, Sekar Darujati, Ron Stanis, Renzo Bee.

Conflicts of Interest

The authors declare no conflict of interest. Patrick Littlewood and Terry Marker are senior researchers at the Gas Technology Institute (GTI) and had no impact on interpretation of the data. GTI is the non-profit gas research institution established by the merger of the US government and industry gas research institutes.

References

  1. ESMAP. The State of Access to Modern Energy Cooking Services. Available online: https://www.worldbank.org/en/topic/energy/publication/the-state-of-access-to-modern-energy-cooking-services (accessed on 19 May 2021).
  2. IEA. World Energy Outlook 2020-Analysis. Available online: https://www.iea.org/reports/world-energy-outlook-2020 (accessed on 19 May 2021).
  3. Van Leeuwen, R.; Evans, A. Hyseni Increasing the Use of Liquefied Petroleum Gas in Cooking in Developing Countries. Available online: https://openknowledge.worldbank.org/handle/10986/26569 (accessed on 19 May 2021).
  4. IEA. SDG7: Data and Projections-Analysis-IEA. Available online: https://www.iea.org/reports/sdg7-data-and-projections (accessed on 19 May 2021).
  5. Puzzolo, E.; Zerriffi, H.; Carter, E.; Stokes, H. Supply Considerations for Scaling Up Clean Cooking Fuels for Household Energy in Low- and Middle-Income Countries-Puzzolo-2019-GeoHealth-Wiley Online Library. Available online: https://agupubs.onlinelibrary.wiley.com/doi/full/10.1029/2019GH000208 (accessed on 19 May 2021).
  6. WHO. Burning Opportunity: Clean Household Energy for Health, Sustainable Development, and Wellbeing of Women and Children. Available online: http://www.who.int/airpollution/publications/burning-opportunities/en/ (accessed on 19 May 2021).
  7. Puzzolo, E.; Cloke, J.; Evans, A.; Pope, D. National Scaling Up of LPG to Achieve SDG 7: Implications for Policy, Implementation, Public Health and Environment. Available online: https://www.mecs.org.uk/wp-content/uploads/2020/2002/MECS-LPG-Briefing-Paper_Jan-2020.pdf (accessed on 19 May 2021).
  8. WLPGA; GLPGP. Sustainable Development Goals: Contributions of LPG. Paris and New York: World LP Gas Association and Global LPG Partnership. Available online: https://www.wlpga.org/wp-content/uploads/2019/02/Sustainable-Development-Goals-Contributions-of-LPG.pdf (accessed on 19 May 2021).
  9. Mani, S.; Jain, A.; Tripathi, S.; Gould, C.F. The drivers of sustained use of liquified petroleum gas in India. Nat. Energy 2020, 5, 450–457. [Google Scholar] [CrossRef]
  10. Thoday, K.; Benjamin, P.; Gan, M.; Puzzolo, E. The Mega Conversion Program from kerosene to LPG in Indonesia: Lessons learned and recommendations for future clean cooking energy expansion. Energy Sustain. Dev. 2018, 46, 71–81. [Google Scholar] [CrossRef]
  11. WLPGA. Guidelines for Good Safety Practices in the LPG Industry. Available online: https://online.fliphtml5.com/addge/mysq/#p=1 (accessed on 19 May 2021).
  12. IEA. Energy Access Outlook: From Poverty to Prosperity WEO-2017 Special Report. Available online: https://www.iea.org/reports/energy-access-outlook-2017 (accessed on 19 May 2021).
  13. WLPGA. Statistical Review of Global LPG 2020; World LP Gas Association: Paris, France, 2020. [Google Scholar]
  14. GLPGP. Assessing Potential for BioLPG Production and Use within the Cooking Energy Sector in Africa. Available online: https://www.ccacoalition.org/en/resources/assessing-potential-biolpg-production-and-use-within-cooking-energy-sector-africa (accessed on 19 May 2021).
  15. Johnson, E. Process Technologies and Projects for BioLPG. Energies 2019, 12, 250. [Google Scholar] [CrossRef] [Green Version]
  16. WLPGA. The Role of LPG & bioLPG in Europe; World LP Gas Association: Paris, France, 2019. [Google Scholar]
  17. UNEP. Africa Waste Management Outlook. Available online: https://wedocs.unep.org/bitstream/handle/20.500.11822/25514/Africa_WMO.pdf (accessed on 19 May 2021).
  18. DECC. RHI Evidence Report: Biopropane for Grid Injection; Department of Energy and Climate Change: London, UK, 2014.
  19. Goldemberg, J.; Martinez-Gomez, J.; Sagar, A.; Smith, K. Household Air Pollution, Health, and Climate Change-Clearing the Air. Available online: http://www.kirkrsmith.org/publications/2018/1/2/household-air-pollution-health-and-climate-change-clearing-the-air (accessed on 19 May 2021).
  20. Kypridemos, C.; Puzzolo, E.; Aamaas, B.; Hyseni, L.; Shupler, M.; Aunan, K. Pope Daniel Health and Climate Impacts of Scaling Adoption of Liquefied Petroleum Gas (LPG) for Clean Household Cooking in Cameroon: A Modeling Study. Environ. Health Perspect. 2020, 128, 047001. [Google Scholar] [CrossRef] [Green Version]
  21. Singh, D.; Pachauri, S.; Zerriffi, H. Environmental payoffs of LPG cooking in India. Environ. Res. Lett. 2017, 12, 115003. [Google Scholar] [CrossRef] [Green Version]
  22. Bruce, N.; de Cuevas, R.A.; Cooper, J.; Enonchong, B.; Ronzi, S.; Puzzolo, E.; MBatchou, B.; Pope, D. The Government-led initiative for LPG scale-up in Cameroon: Programme development and initial evaluation. Energy Sustain. Dev. 2018, 46, 103–110. [Google Scholar] [CrossRef]
  23. Climate Justice Alliance. Just Transition—A Framework for Change. Available online: https://climatejusticealliance.org/just-transition/ (accessed on 20 May 2021).
  24. Gustafsson, M.; Anderberg, S. Dimensions and characteristics of biogas policies—Modelling the European policy landscape. Renew. Sustain. Energy Rev. 2021, 135, 110200. [Google Scholar] [CrossRef]
  25. Torrijos, M. State of Development of Biogas Production in Europe. Procedia Environ. Sci. 2016, 35, 881–889. [Google Scholar] [CrossRef]
  26. WHO. WHO Household Energy Database. Available online: https://www.who.int/data/gho/data/indicators/indicator-details/GHO/gho-phe-primary-reliance-on-clean-fuels-and-technologies-proportion (accessed on 20 May 2021).
  27. GLPGP. National Feasibility Study: LPG for Clean Cooking in Cameroon. Available online: http://glpgp.org/country-feasibility-and-investment-reports (accessed on 19 May 2021).
  28. GLPGP. National Feasibility Study: LPG for Clean Cooking in Ghana. Available online: http://glpgp.org/country-feasibility-and-investment-reports (accessed on 19 May 2021).
  29. GLPGP. National Feasibility Study: LPG for Clean Cooking in Kenya. Available online: http://glpgp.org/country-feasibility-and-investment-reports (accessed on 19 May 2021).
  30. GLPGP; MININFRA. National Feasibility Study: LPG for Clean Cooking in Rwanda; Global LPG Partnership: New York, NY, USA, 2021. [Google Scholar]
  31. Kemausuor, F.; Adaramola, M.S.; Morken, J. A Review of Commercial Biogas Systems and Lessons for Africa. Energies 2018, 11, 2984. [Google Scholar] [CrossRef] [Green Version]
  32. Kidmo, D.K.; Deli, K.; Bogno, B. Status of renewable energy in Cameroon. Renew. Energy Environ. Sustain. 2021, 6, 2. [Google Scholar] [CrossRef]
  33. Faye, C.M.; Mbera, B.; Kaberia, C.; Deng, C. Solid Waste Management and Risks to Health in Urban Africa: A Study of Dakar City, Senegal. Available online: https://www.urbanark.org/solid-waste-management-and-risks-health-urban-africa-study-dakar-city-senegal (accessed on 19 May 2021).
  34. Multiconsult, N. Final Report Study on the Potential of Increased Use of LPG for Cooking in Developing Countries. Available online: https://www.multiconsultgroup.com/assets/LPG-for-Cooking-in-Developing-Countries_Report-by-Multiconsult.pdf (accessed on 19 May 2021).
  35. Rosales-Calderon, O.; Arantes, V. A review on commercial-scale high-value products that can be produced alongside cellulosic ethanol. Biotechnol. Biofuels 2019, 12, 240. [Google Scholar] [CrossRef] [Green Version]
  36. Pandey, A.; Larroche, C.; Ricke, S.C. Biofuels: Alternative Feedstocks and Conversion Processes; Academic Press: Cambridge, MA, USA, 2011; ISBN 978-0-12-385099-7. [Google Scholar]
  37. GTI. Expert Analysis of the Concept of Synthetic and/or Bio-LPG. Available online: https://propane.com/wp-content/uploads/2020/01/15866_PERC_BioPropane.pdf (accessed on 20 May 2021).
  38. Kaza, S.; Yao, L.; Bhada-Tata, P.; Van Woerden, F. What a Waste 2.0: A Global Snapshot of Solid Waste Management to 2050; Urban Development; The World Bank: Washington, DC, USA, 2018; ISBN 978-1-4648-1329-0. [Google Scholar]
  39. Arthur, R.; Baidoo, M.F.; Antwi, E. Biogas as a potential renewable energy source: A Ghanaian case study. Renew. Energy 2011, 36, 1510–1516. [Google Scholar] [CrossRef]
  40. Kemausuor, F.; Kamp, A.; Thomsen, S.T.; Bensah, E.C.; Østergård, H. Assessment of biomass residue availability and bioenergy yields in Ghana. Resour. Conserv. Recycl. 2014, 86, 28–37. [Google Scholar] [CrossRef]
  41. Nelson, N.; Darkwa, J.; Calautit, J.; Worall, M.; Mokaya, R.; Adjei, E.; Kemausuor, F.; Ahiekpor, J. Potential of Bioenergy in Rural Ghana. Sustainability 2021, 13, 381. [Google Scholar] [CrossRef]
  42. Arthur, R.; Baidoo, M.F.; Brew-Hammond, A.; Bensah, E.C. Biogas generation from sewage in four public universities in Ghana: A solution to potential health risk. Biomass Bioenergy 2011, 35, 3086–3093. [Google Scholar] [CrossRef]
  43. Miezah, K.; Obiri-Danso, K.; Kádár, Z.; Fei-Baffoe, B.; Mensah, M.Y. Municipal solid waste characterization and quantification as a measure towards effective waste management in Ghana. Waste Manag. 2015, 46, 15–27. [Google Scholar] [CrossRef] [Green Version]
  44. Mohammed, M.; Egyir, I.S.; Donkor, A.K.; Amoah, P.; Nyarko, S.; Boateng, K.K.; Ziwu, C. Feasibility study for biogas integration into waste treatment plants in Ghana. Egypt. J. Pet. 2017, 26, 695–703. [Google Scholar] [CrossRef] [Green Version]
  45. UNEP. Sustainability of Sugarcane Bagasse Briquettes and Charcoal Value Chains in Kenya: Results and Recommendations from Implementation of the Global Bioenergy Partnership (GBEP) Indicators. Available online: https://wedocs.unep.org/bitstream/handle/20.500.11822/31122/GBEPKs.pdf?sequence=1&isAllowed=y (accessed on 19 May 2021).
  46. Mugodo, K.; Magama, P.P.; Dhavu, K. Biogas Production Potential from Agricultural and Agro-Processing Waste in South Africa. Waste Biomass Valorization 2017, 8, 2383–2392. [Google Scholar] [CrossRef]
  47. Fischer, E.; Schmidt, T.; Hora, S.; Giersdorf, J.; Stinner, W.; Scholwin, F. Agro-industrial biogas in Kenya, Potentials, Estimates for Tariffs, Policy and Business Recommendations. Available online: http://digicollection.org/eebea/documents/s20341en/s20341en.pdf (accessed on 19 May 2021).
  48. MINICOM. Industrial Master Plan for the AgroProcessing Subsector (2014–2020). Available online: https://rwandatrade.rw/media/2014-20%20MINICOM%20Agro-Processing%20Industrial%20Masterplan.pdf (accessed on 19 May 2021).
  49. Alice, U.; Ming, Y.; Nestor, U.; Donath, N.; Narcisse, N. Liquid Wastes Treatment and Disposal in Rwanda. J. Pollut. Eff. Control 2017, 5, 1–5. [Google Scholar]
  50. MININFRA. National Sanitation Policy. Available online: https://www.rura.rw/fileadmin/Documents/Water/Laws/NATIONAL_SANITATION_POLICY__DECEMBER_2016.pdf (accessed on 19 May 2021).
  51. Government of Ghana. Ghana’s Intended Nationally Determined Contribution (INDC) and Accompanying Explanatory Note. Accra, Ghana. 2015. Available online: https://www4.unfccc.int/sites/ndcstaging/PublishedDocuments/Ghana%20First/GH_INDC_2392015.pdf (accessed on 28 June 2021).
  52. Government of Ghana. Mainstreaming Climate Change and Green Economy Sustainable Development Goals (SDGs) into the Development Plans of MMDAs. Accra, Ghana. 2017. Available online: https://www.un-page.org/files/public/mainstreaming_climate_change_and_green_economy.pdf (accessed on 28 June 2021).
  53. Republic of Kenya. Kenya’s First National Determined Contributions (Updated Version). Available online: https://www4.unfccc.int/sites/ndcstaging/PublishedDocuments/Kenya%20First/Kenya%27s%20First%20%20NDC%20(updated%20version).pdf (accessed on 19 May 2021).
  54. Republic of Rwanda. Updated Nationally Determined Contribution. Available online: https://www4.unfccc.int/sites/ndcstaging/PublishedDocuments/Rwanda%20First/Rwanda_Updated_NDC_May_2020.pdf (accessed on 19 May 2021).
  55. Republic of Kenya. The Energy Act. Available online: https://kplc.co.ke/img/full/o8wccHsFPaZ3_ENERGY%20ACT%202019.pdf (accessed on 19 May 2021).
  56. Government of Ghana. National Energy Policy (Draft). Available online: Ttp://www.energycom.gov.gh/files/snep/MAIN%20REPORT%20final%20PD.pdf (accessed on 19 May 2021).
  57. Müller, F.; Claar, S.; Neumann, M.; Elsner, C. Is green a Pan-African colour? Mapping African renewable energy policies and transitions in 34 countries. Energy Res. Soc. Sci. 2020, 68, 101551. [Google Scholar] [CrossRef]
  58. Haregu, T.N.; Ziraba, A.K.; Aboderin, I.; Amugsi, D.; Muindi, K.; Mberu, B. An assessment of the evolution of Kenya’s solid waste management policies and their implementation in Nairobi and Mombasa: Analysis of policies and practices. Environ. Urban. 2017, 29, 515–532. [Google Scholar] [CrossRef] [Green Version]
  59. Aparcana, S. Approaches to formalization of the informal waste sector into municipal solid waste management systems in low- and middle-income countries: Review of barriers and success factors. Waste Manag. 2017, 61, 593–607. [Google Scholar] [CrossRef] [Green Version]
  60. Bello, I.; Ismail, M.; Kabbashi, N. Solid Waste Management in Africa: A Review. Int. J. Waste Resour. 2016, 6, 2. [Google Scholar]
  61. Kamp, L.M.; Bermúdez Forn, E. Ethiopia׳s emerging domestic biogas sector: Current status, bottlenecks and drivers. Renew. Sustain. Energy Rev. 2016, 60, 475–488. [Google Scholar] [CrossRef] [Green Version]
  62. African Development Bank. Private Sector Development Policy of the African Development Bank Group. Available online: https://www.afdb.org/sites/default/files/documents/policy-documents/private_sector_development_policy_of_the_afdb_group.pdf (accessed on 20 May 2021).
  63. Republic of Kenya. The Climate Change Act. Available online: http://kenyalaw.org/kl/fileadmin/pdfdownloads/Acts/ClimateChangeActNo11of2016.pdf (accessed on 20 May 2021).
  64. ADI Analytics Natural Gas Utilization via Small-Scale Methanol Technologies. Available online: http://www.sgicc.org/uploads/8/4/3/1/8431164/bftp_methanol_white_paper_vf.pdf (accessed on 23 May 2021).
  65. Stokes Consulting Group The Economics of Methanol Production in Nigeria Based on Large Low-Cost Gas Resources. Available online: https://www.projectgaia.com/documents/The%20Economics%20of%20Methanol%20Production%20in%20Nigeria%20Based%20on%20Large%20Low-Cost%20Gas.pdf (accessed on 23 May 2021).
  66. Rajasheker, A.; Bowers, A.; Gatoni, A.S. Assessing Waste Management Services in Kigali. Available online: https://www.theigc.org/wp-content/uploads/2019/11/Rajashekar-et-al-2019-paper.pdf (accessed on 19 May 2021).
  67. Kabera, T.; Wilson, D.C.; Nishimwe, H. Benchmarking performance of solid waste management and recycling systems in East Africa: Comparing Kigali Rwanda with other major cities. Waste Manag. Res. 2019, 37, 58–72. [Google Scholar] [CrossRef] [Green Version]
  68. Hogg, D. Costs for Municipal Waste Management in the EU. Available online: http://projects.mcrit.com/ceara/attachments/article/154/cost%20for%20municipal%20waste%20management%20UE.pdf (accessed on 19 May 2021).
  69. Wheeler, P.A.; Rome, L. Waste Pre-Treatment: A Review. UK Gov Environment Agency. Available online: https://assets.publishing.service.gov.uk/government/uploads/system/uploads/attachment_data/file/290316/sp1-344-tr-e-e.pdf (accessed on 19 May 2021).
  70. Pressley, P.N.; Levis, J.W.; Damgaard, A.; Barlaz, M.A.; DeCarolis, J.F. Analysis of material recovery facilities for use in life-cycle assessment. Waste Manag. 2015, 35, 307–317. [Google Scholar] [CrossRef] [PubMed] [Green Version]
  71. Stapf, D.; Ceceri, G.; Johansson, I.; Whitty, K. Biomass Pre-Treatment for Bioenergy—Case Study 3: Pretreatment of Municipal Solid Waste (MSW) for Gasification. Available online: https://www.ieabioenergy.com/blog/publications/biomass-pre-treatment-for-bioenergy-case-study-3-pretreatment-of-municipal-solid-waste-msw-for-gasification/ (accessed on 19 May 2021).
  72. Kenya News Agency. Government to Establish Agro-Processing Hubs. Available online: https://www.kenyanews.go.ke/government-to-establish-agro-processing-hubs/ (accessed on 19 May 2021).
  73. Nielsen, C.F. Briquetting Solution for Agricultural Waste in Africa. Available online: https://cfnielsen.com/tapping-the-untapped/ (accessed on 19 May 2021).
  74. GIZ. Kenyan Flower Industry—Potential for Renewable Energy. Available online: https://www.german-energy-solutions.de/GES/Redaktion/DE/Publikationen/Marktanalysen/2015/studie_2015_subsector-flower-industry-kenya.pdf?__blob=publicationFile&v=6 (accessed on 19 May 2021).
  75. Kanyiri, G.; Waswa, F. Enhancing benefits from biomass wastes within small-medium scale coffee processing factories in Kiambu County, Kenya. Afr. J. Environ. Sci. Technol. 2017, 11, 198–206. [Google Scholar]
  76. Kioko, P.; Strathmore University, Nairobi, Kenya. Pineapple waste fraction from Delmonte Limited Kenya. Personal communication, 2020. [Google Scholar]
  77. Rajuai, C.; Naitex Developers LTD, Nairobi, Kenya. Transport data. Personal communication, 2020. [Google Scholar]
  78. Basile, I.; Dutra, J. Blended Finance Funds and Facilities: 2018 Survey Results; OECD Development Co-operation Working Papers; OECD Publishing: Paris, France, 2019. [Google Scholar]
  79. Convergence. The State of Blended Finance 2019–Convergence Resources. Available online: https://www.convergence.finance/resource/13VZmRUtiK96hqAvUPk4rt/view (accessed on 19 May 2021).
  80. Troncoso, K.; Soares da Silva, A. LPG fuel subsidies in Latin America and the use of solid fuels to cook. Energy Policy 2017, 107, 188–196. [Google Scholar] [CrossRef]
Figure 1. Main bioLPG production routes.
Energies 14 03916 g001
Figure 2. High level IH2 LPG process flow.
Energies 14 03916 g002
Figure 3. High level Cool LPG process flow.
Energies 14 03916 g003
Table 1. Screening and selection of SSA focus countries.
Country NameHas Major Clean Cooking Fuel Need 1Has 2030 Target for LPG Penetration 2Has LPG Master Plan or Plan-in-Process 3
Angola X
BeninX
Burkina FasoXX
BurundiX
Cabo Verde X
CameroonXXX
Central African RepublicX
ChadX
Congo, Dem. Rep.X
Congo, Rep.X
Cote d’IvoireXX
DjiboutiX
Egypt, Arab Rep.
Equatorial GuineaX
EritreaX
Eswatini
EthiopiaX
Gabon X
Gambia, TheX
GhanaXXX
GuineaX
Guinea-BissauXX
KenyaXXX
LesothoX
LiberiaXX
Libya
MadagascarX
MalawiX
MaliXX
Mauritania
Mauritius
Morocco
MozambiqueX
NamibiaX
NigerXX
NigeriaXX
RwandaXXX
Sao Tome and PrincipeX
SenegalXXX
Seychelles
Sierra LeoneX
SomaliaX
South Africa
South SudanX
SudanX
TanzaniaXXX *
TogoX
Tunisia
UgandaX
ZambiaX
ZimbabweX
1 WHO Household Energy Database (2018 data) [24]; “X” indicates country has less than 45% clean fuel penetration. 2 Van Leeuwen et al. [3] and revisions of Sustainable Energy for All Action Agendas. “X” indicates country has set a specific target for LPG penetration by 2030 or before. 3 Multiple sources [22,25,26,27,28]; “X” indicates country has an LPG-specific national master plan or the equivalent completed or currently in development (petroleum sector master plans that mention LPG were not deemed to qualify). * Tanzania is included in part because it is an integral part of the East African LPG economy and distribution network with Kenya and Rwanda. Tanzania’s LPG planning is at an earlier stage than its neighbours but includes focus on its major refugee populations and their surrounding communities.
Table 2. Types of potential feedstocks in the three focus countries and quantities required for a 10,000 tpa bioLPG reference plant.
Conversion TechnologyFeedstock CharacteristicsPotential FeedstocksVolumes Required for 10,000 tpa bioLPGComments
Catalytic thermo-chemical conversionHeterogeneous organic/biomass feedstock. Single input feedstock could be an option (with improved biochar output) but the process can manage mixed feedstock including mixed MSW.Biomass/MSW~70,000 tpa feedstockBioLPG is a minor volume co-product of the one implemented conversion pathway.
Biogas to bioLPG (biogas/
syngas reforming)
Heterogeneous biomass suitable for Anaerobic Digestion (AD). Mixed biomass compositions can be used but different feedstocks give different yields of biogas. Consistent supply of biomass preferable for consistent running of AD. Desulphurisation of biogas required.By-products of agricultural and livestock industries (field and processing residues); sewage and wastewater; organic fraction of municipal waste~30,000 tpa raw biogas.Equivalent to approx. 160,000–500,000 tpa feedstock input (depending on type (food waste or biosolids such as animal manure)Feedstock assessment carried out for preliminary production of biogas via AD.
Table 3. Feedstocks reviewed for bioLPG production at scale in Ghana, Kenya and Rwanda.
CountryFeedstock PotentialReferences
GhanaAgro-processing residues, field residues and waste from palm oil, fruit, cocoa, maize, rice, millet, sorghum, cowpea, cassava, soybean[39,40,41]
Urban waste (sanitary waste and MSW)[42,43,44]
KenyaAgro-processing residues, field residues and waste from coffee, pineapple, sugarcane refining, cassava, mango, sisal and livestock industries[31,45,46]
MSW[47]
RwandaAgro-processing residues, field residues and waste from coffee, cassava, fruit processing and brewing industries[48]
Urban waste (sanitary and MSW)[49,50]
Table 4. Capital and operating costs of an IH2 plant in Ghana or Rwanda before feedstock considerations.
Capacity 1
(25 ktpa)
Capacity 2
(10 ktpa)
Capacity 3
(5 ktpa)
BioLPG produced (ktpa)25105
Annual MSW input required (ktpa)1676733
Total capital costs (US$ million)18810972
Operating cost (US$ 000/year)13,50371074611
Table 5. Capital and operating costs of a Cool LPG plant in Ghana or Rwanda before feedstock considerations.
Capacity 1
(25 ktpa)
Capacity 2
(10 ktpa)
Capacity 3
(5 ktpa)
BioLPG produced (ktpa)25105
Annual MSW input required (ktpa)676270135
AD plant capital requirement (US$ million)41168
Cool LPG capital requirement * (US$ million)462415
Total capital costs (US$ million)864023
Operating cost (US$ 000/year)393024401680
* Actual capital cost requirements may be lower, as low as 65% of the estimates presented in the table.
Table 6. Financial characteristics of the five bioLPG pilot projects.
Triage Ranking25341
CountryKenyaGhanaGhanaRwandaRwanda
CaseAgro-Residue AD + Cool LPGMSW IH2MSW
AD + Cool LPG
MSW IH2MSW
AD + Cool LPG
BioLPG Plant Capacity (tpa)10,00025,00010,00025,00010,000
BioLPG Plant Capex (US$ millions)321883218832
Waste input (ktpa)270166270166270
BioLPG Price
(US$/tonne)
750750750850850
Fossil LPG Price
(US$/tonne)
779796796903903
Gasoline Price
(US$/tonne)
NA800NA800NA
Best Case (High IRR, tipping fee income)
Tipping Fee
(US$/tonne)
1010101010
IRR (US$ 750/t)29.0%13.2%30.1%
IRR (US$ 850/t) 15.8%34.9%
Base Case
Tipping Fee *00000
(US$/t)
IRR (US$ 750/t)14.0%11.3%15.4%
IRR (US$ 850/t) 12.3%3.5%
Worst Case (Unattractive IRR, tipping fee cost)
Tipping Fee *−7−10−10−10−10
(US$/t)
IRR (US$ 750/t)(negative IRR)7.6%(negative IRR)
IRR (US$ 850/t) 8.6%(negative IRR)
* Tipping fee: cost of waste collection/management/tonne; positive if plant is receiving a fee, negative if the plant is paying a fee; tpa = tonnes per annum; ktpa = kilo tonnes per annum.
Table 7. Industry and consumer capital investment for serving new LPG users (US$).
Per New User
(Based on the 4 Countries Studied)
For 500 Million New Users,
120 Million Households
National AveragesIndustry CapExConsumer CapExTotal CapExIndustry CapExConsumer CapExTotal CapEx
Low$27.6 per new user$8.8 per new user$36.5 per new user$13.8 bn$4.4 bn$18.2 bn
High$37.8 per new user$15.0 per new user$52.8 per new user$18.9 bn$7.5 bn$26.4 bn
Publisher’s Note: MDPI stays neutral with regard to jurisdictional claims in published maps and institutional affiliations.

