Abstract
This paper aims to assess the direct economic impact on the maritime sector from its inclusion in the European Union-Emission Trading System (EU-ETS). The Monitoring, Reporting and Verification (MRV) data are analysed for the estimation of carbon dioxide (CO2) emissions within the European Economic Area (EEA). The economic impact assessment model used is scenario-based, and includes different price incentives, geographical coverage and emission allowances allocation methods. According to our findings, in case the emission allowances are fully auctioned or partially free allocated on the basis of a uniform benchmark, the increased costs would be disproportional among the maritime segments. Such a scheme would penalise Roll-on/Roll-off (RoRo) and Roll-On/Roll-Off/Passenger (RoPax) segments due their high fuel consumption per transport work in relation to oil tankers and bulkers. The establishment of differentiated benchmarks per segment seems to be a prerequisite for the effective inclusion of shipping in the EU-ETS that will reward energy efficient vessels in each segment and avoid competition distortion within the maritime industry.
1. Introduction
Despite its good energy performance in comparison with other modes of transport, shipping’s contribution to global carbon dioxide (CO2) emissions is around 2.2% with overall shipping CO2 emissions predicted to increase by 50–250% by 2050, if no effective mitigation measures are adopted [1]. This has resulted in the adoption and implementation of various initiatives over the years that aim to reverse this trend from actors and stakeholders involved in maritime transport operations, ranging from international and regional institutions (with the cases of International Maritime Organisation (IMO) and the European Union (EU) clearly standing out), port authorities, shipping companies, and major shippers that wish to improve the carbon footprint of their supply chains [2,3]. These initiatives include both technical and operational measures that aim to improve the energy performance of vessels and contribute significantly to the reduction of CO2 emissions, with the mandatory implementation of two of them—the Energy Efficiency Design Index (EEDI) and the Ship Energy Efficiency Management Plan (SEEMP)—for all vessels over 400 gross tonnage since January 2013 [4].
Due to the fact that CO2 emissions from shipping continue to increase, despite the implementation of the various global, regional and local initiatives, in April 2018 the Initial Greenhouse Gas (GHG) Strategy for the reduction of GHG emissions from international shipping was adopted by the IMO; a strategy that calls for urgent action for the abatement of maritime GHG emissions that need to be reduced by at least 50% by 2050, compared to 2008 and phased out entirely in the long run [5]. This IMO strategy consists of short-, mid- and long-term measures that could enable the maritime sector to achieve this ambitious target and align itself with the goals of the Paris Agreement that seek to maintain the global temperature increase in this century to well below 2 °C above pre-industrial levels and limit this increase, even further, to 1.5 °C [6]. Among the long-term measures of the IMO strategy lie the market-based measures (MBMs) that encompass, among others, a global levy on marine bunkers or a global emission trading scheme.
According to the existing literature, market-based measures (MBMs) can encourage and motivate investments in energy efficiency technologies and the deployment of alternative fuels, and, in this sense, contribute to the abatement of greenhouse gas (GHG) emissions from shipping [7,8,9,10,11]. The adoption of a global MBM for the maritime industry, though, is quite complex and time-consuming given the need for consensus and reconciliation of the different interests and approaches among the developing and developed countries in the IMO. In the IMO strategy, MBMs are classified by the Marine Environment Protection Committee (MEPC) as long-term measures, expected to be adopted beyond 2030, mainly due to the associated long-term negotiations among IMO Member States [5].
In the face of the challenges to introduce a global MBM to address GHG emissions from international shipping, regional policies have come along. At European level, the EU Directive 2018/410 [12] highlights the need to take immediate action for the abatement of GHG emissions from shipping either at regional level by EU or globally by the IMO. In late 2019, the European Green Deal was released targeting the climate neutrality in Europe till 2030 [13]. Among other initiatives, the European Commission (EC) proposes the extension of the EU-ETS to cover CO2 emissions from the maritime sector. According to the EC, this extension is planned to be discussed in July 2021 as part of a general review of the EU-ETS [14,15].
This paper aims to assess the potential direct economic impacts on the maritime sector from its inclusion in the EU-ETS and highlight the differentiated impact from such a development on different maritime segments. The data used for the economic impact assessment come from the EU Monitoring, Reporting, Verification (MRV) system that entered into force in 2018 and will most probably serve as the basis for the inclusion of the maritime sector in the EU-ETS [16]. To the best of our knowledge no existing literature has assessed the economic impacts of an emission trading scheme for maritime transport using these data that were reported for the first time in 2019 and this constitutes the main novelty of this paper.
Our economic impact assessment model will be scenario-based, and include different price incentives, geographical scope of the system and emission allowances allocation methods, since the design features of the potential inclusion of maritime transport GHG emissions in the EU-ETS remain unclear for the moment. In this sense, a sensitivity analysis will be used to assess the impact of these design options on different maritime segments. Existing literature focuses on the design characteristics of an emission trading system for shipping and the potential environmental and economic impacts from its implementation on the whole maritime sector; there is, though, limited research on the differentiated impact that such a system could have among different maritime segments, supposing due to lack of data on ships’ average energy efficiency [17]. Given the fundamental technical and operational differences among vessel categories, the economic impact of the inclusion of shipping in the EU-ETS needs to be analysed per maritime segment and it is exactly this gap that our study aims to fill.
The remaining of this paper is structured as follows. First, the concept of MBMs and their potential for the abatement of GHG emissions from the maritime sector is introduced. Existing literature on the inclusion of shipping in the EU-ETS will also be reviewed in Section 2. Section 3 explains the methodology and data that will be used in our analysis. Our results are presented in Section 4 mapping the direct additional costs for each segment and highlighting the importance of certain design options for the effective implementation of this scheme. In the discussion (Section 5), our findings are analysed in relation to the existing literature. Based on these results, our main conclusions are drawn with policy recommendations towards the effective extension of the EU-ETS to include shipping; an extension that needs to take into account the large differentiations among the maritime segments and reward energy-efficient vessels in each category without penalising certain segments and causing competition distortion among different markets.
2. Background
2.1. Market-Based Measures (MBMs) and Abatement of GHG Emissions from Shipping
There is a wide range of climate policy instruments that have been developed over the years for the abatement of GHG emissions from industrial sectors and have come to the forefront of climate regulations under the international climate change conventions, with the Paris Agreement being the latest and most binding agreement under the United Nations Framework Convention on Climate Change [6]. In addition to the traditional ‘command and control’ regulations that set absolute targets on GHG emissions and have been adopted in various industrial sectors, MBMs have also been considered and successfully implemented for addressing environmental and climate challenges [18,19]. Although the objective of both policy instruments is the same, their approach varies widely, with ‘command and control’ regulations setting binding limits to emissions, while MBMs ‘integrate’ the external cost of GHG emissions into the production cost of services and at the same time reward technological innovations and operational advances that reduce energy consumption and GHG emissions [20,21,22]. MBMs include economic mechanisms, such as levies, subsidies, fees, emission trading schemes, and their suitability and successful implementation depends on the particular features of the industrial sector of application [23,24,25,26,27,28].
Due to the global nature of international shipping and the difficulty to allocate GHG emissions among countries, the abatement of maritime GHG emission is not included in any international climate change regime and the IMO is considered as the most appropriate organisation to address this challenge [29,30,31,32]. In this context, technical and operational measures for the abatement of GHG emissions from ships—the Energy Efficiency Design Index (EEDI) and the Ship Energy Efficiency Management Plan (SEEMP)—were added in Annex VI of the International Convention for the Prevention of Pollution from Ships (MARPOL 73/78) in 2011 to include that have become mandatory for all vessels over 400 GT since January 2013 [4]. The Marine Environment Protection Committee (MEPC) of the IMO also proceeded with the introduction of a global data collection system for CO2 emissions from shipping in 2016 that is compulsory for all vessels of 5000 gross tonnage and above and requires them to collect data on the consumption of each type of fuel they use as well as data on their transport work [33].
Besides these ‘command and control’ regulations, the MEPC has also considered the adoption of MBMs that could complement technical and operational measures, provide economic incentives and reward investments in innovative technologies, shift to alternative fuels and energy sources, improved operational energy performance of vessels. Although MBMs had already started being discussed since the First IMO GHG Study in 2000, the lack of consensus among different IMO Members and the complex negotiations have postponed the adoption of a global MBM for the shipping industry that is not yet likely to take place in the near future. In 2010, the MEPC invited IMO Member States to submit their proposals on MBMs that could be introduced in the maritime sector. Ten proposals were submitted that could be grouped into two main categories: emission trading schemes and global levies on marine bunkers [8,34]. A feasibility study and impact assessment of these MBMs was then commissioned by the MEPC to facilitate the process for the introduction of a MBM [35]. Finally, though, there was no progress and the discussion was postponed for the future. Even in the most recent Initial IMO strategy for the reduction of GHG emission from ships, MBMs are among the long-term measures and assumed to be finalised and agreed upon by the MEPC beyond 2030, mainly due to the associated long-term and difficult negotiations among IMO Member States [5].
Global Emission Trading Schemes (ETS), as appropriate MBMs for the abatement of GHG emissions from international shipping, were proposed at MEPC by Norway, UK and France [36]. Under these ETS, a cap on net maritime emissions would be set and all ships over a certain deadweight engaged in global trade would need to surrender emission allowances that correspond to their emissions. The revenues from the auctioned emission allowances would then be used to establish a fund that would promote climate adaptation and mitigation within the maritime sector through research and development of green technologies and technical support to least developed and developing countries for the introduction of these technologies.
The adoption and effectiveness of an ETS for international shipping has been supported by [10,37] due to its potential to reconciliate the principle of the UNFCCC on ‘common but differentiated responsibilities’ among countries [38] and the ‘equal and no more favourable treatment’ principle of the IMO that suggests that all legislations and regulations apply to all ships irrespective of their flag or nationality. By setting a global cap on maritime emissions, all ships would need to surrender adequate allowances for their emissions, which is in line with the IMO principle; the establishment of the fund from these revenues, though, providing assistance to developing countries for climate mitigation and adaptation corresponds to the UNFCCC principle. In addition, there is experience from a number of successful emission trading schemes applied in other sectors that have managed to reduce GHG emissions and air pollutants significantly, such as the Regional Clean Air Incentives Market (RECLAIM) program for the abatement of SOx emissions in California and the EU-ETS [39,40,41].
2.2. Inclusion of Shipping in the EU-ETS
The initial discussion towards the extension of the EU-ETS to include maritime transports can be found 14 years ago, in April 2007, with the EC stating its willingness to include the shipping industry in the EU-ETS, recognising at the same time the practical challenges from such an initiative, especially in relation to the geographical scope and the emission allowances allocation method [39]. A relevant proposal from the EC in 2011 was the result of not including maritime GHG emissions in any international climate agreement under the UNFCCC. Inclusion of shipping in the EU-ETS was also supported by [42] that considered this development as ‘a legally and technically feasible option’, especially in case a global policy on shipping GHG emissions cannot be adopted by the IMO or UNFCCC. In late 2019, the European Green Deal was released targeting the climate neutrality in Europe till 2020 [13]. Among other initiatives, the EC proposes the extension of the EU-ETS to cover CO2 emissions from the maritime sector; an extension that is planned to be discussed in July 2021 as part of a general review of the EU-ETS.
The EU-ETS is a regional MBM that regulates GHG emissions from many industrial sectors located and operating in the countries of the European Economic Area (EEA), namely the forest industry, steel and metal industry, cement and stone, energy sector, refineries and aviation [43]. The EU-ETS sets a cap on total emissions of included sectors that can buy or sell emission allowances according to their ability to surrender the adequate allowances for their operations. Since its entry into force in 2005, the scope and allowances allocation methodology of the EU-ETS have been periodically revised and updated under certain trading periods. Aviation was included in the EU-ETS in 2012 (during the third trading period), as a semi-parallel system, mainly due to the different allocation methodology that is based on transport work (tonne-km) (Directive 2008/101/EC) [44]. During the first phase of the inclusion of aviation in the EU-ETS, 82% of emission allowances were allocated for free, a percentage that has been constantly reducing over the years. Given the similarities of the shipping and aviation sectors, it is reasonable to consider that a similar approach will be followed for the inclusion of shipping in the EU-ETS.
Economic Impact from the Inclusion of Shipping in the EU-ETS
The economic impact on the maritime sector from its inclusion in the EU-ETS is deeply influenced by the design elements of this system—namely its geographical scope, the price of the emission allowances and the allocation methodology. Ref. [45] provided an estimation of the direct costs for the aviation sector from its inclusion in the EU-ETS and concluded that, assuming the constant increase of the allowances prices, airline companies need to develop a long-term sustainability strategy to maintain their competitiveness through investments in clean technologies, including the use of alternative fuels and energy sources. According to [46], the situation is quite similar for the maritime sector, as an ‘open’ ETS, like the EU-ETS, offers flexibility on the choice of technical and operational measures that can improve the energy efficiency of vessels and decrease their energy consumption and at the same time provides the opportunity to ship operators to buy allowances from other sectors. The cost-effectiveness of the different abatement options for the reduction of CO2 emissions from shipping will rationally equal the emission allowance price, as ship operators will seek to minimise the additional cost from CO2 emissions [47,48].
The decisions of ship operators to invest in CO2 abatement technologies and reduce their emissions as a response to the inclusion of shipping in the EU-ETS—and the consequent environmental effectiveness of such a scheme–are also influenced by supplementary parameters other than the allowance price. Ref. [49] provides an evaluation of the effects of a European ETS for the abatement of GHG from shipping and highlights the importance of the geographical scope of such a scheme. The author emphasises the risk of competition distortion from the introduction of a regional ETS for shipping due to the increased operational cost for vessels operating or crossing EU territorial waters and suggests that a European ETS for shipping should include all emissions that arise from voyages to and from the EU ports. This is in line with the findings of [46] that the inclusion of all emissions from vessels traveling to and from the EU ports in a European ETS would increase the environmental effectiveness of the scheme and reduce carbon leakage.
Ref. [50] recently investigated the potential carbon leakage from the inclusion of shipping in the EU-ETS as it consists one of the main potential side effects from the adoption of this scheme. The study supports that carbon leakage will be limited even if total CO2 emissions from all voyages to and from the EU ports are included in the EU-ETS, as the additional costs for ship operators—including extra port costs, extra fuel costs, extra operational costs, remaining CO2 costs—will be minimal compared to the operational costs that an evasion from the EU ports would generate. More specifically, a price of 123 euros per ton of CO2 that equals the extra costs related to the evasion from the EU port calls could lead to potential carbon leakage, but this price is three to four times higher than the current price of CO2 emission allowances in the EU-ETS.
Another important parameter that needs to be considered in relation to extending the EU-ETS to include shipping is the heterogeneity of the maritime industry, composed of maritime segments that present large differentiations at their technical and operational features, the market structure and elasticity of demand. As mentioned by [37], the implementation of an ETS for the abatement of CO2 emissions from shipping will have a differential impact on the various maritime segments due to their distinct characteristics. The high elasticity of demand for short sea shipping services in comparison to deep sea segments, for example, could lead to a modal shift from sea to land-based modes of transport if the transport cost of these services would increase due to the additional cost of CO2 emissions for shipping [51]. The case is completely different for deep sea shipping where, in many cases, there are no alternatives to maritime transport.
Following these assumptions, ref. [17] analysed and quantified the economic impact of an ETS on the container and dry bulk shipping sector and found that the implementation of such a scheme would result in reduced operating speeds for vessels, decreased carrier outputs and less fuel consumed for both the container and dry bulk sectors. The authors pointed out that an ‘open’ ETS, like the EU-ETS, is expected to have a larger impact on the dry bulk sector that will need to surrender more emission allowances to reduce its emissions compared to the containerships and concluded that the adoption of an ETS for the maritime industry is particularly difficult due to the differential impacts on the various segments and the potential competition distortion among different markets.
3. Data and Method
With regards to the inclusion of shipping in the EU-ETS, the data used for the assessment of the direct economic impacts on the maritime sector, which is the aim of this paper, come from the EU MRV database. The MRV database is published on an annual basis by the European Maritime Safety Agency (EMSA) and provides valuable information on CO2 emissions from vessels operating within the EEA, including their fuel consumption, transport work and distance travelled [52]. It includes all ships larger than 5000 gross tonnage, regardless of flag, engaged in intra-EU voyages, incoming voyages from non-EU to EU ports and outgoing voyages from EU to non-EU ports. CO2 emissions of ships while at berth or moving between EU ports are also included in the database that covers about 90% of the shipping emissions in the EU [53]. As defined in the EU regulation 2015/757, certain types of ships are not included in the MRV database, namely dredging vessels, ice-breaking vessels, pipe laying or offshore installation activity vessels, warships, naval auxiliaries, fish-catching or fish-processing ships, wooden ships of a primitive build, ships not propelled by mechanical means or government ships used for non-commercial purposes. This public database was first published on the 1st July 2019 for the year 2018 and will probably form the basis for the inclusion of shipping in the EU-ETS according to European Commission [10,53].
The R package software [54,55] was utilized for the descriptive statistical analysis of the MRV data that provided input to our assessment of the direct costs for each maritime segment from the inclusion of shipping in the EU-ETS. For this study, we analysed the ships’ data for the year 2019 as these are the most recent data available in July 2020 (Supplementary Materials). The analysis is restricted to seven maritime segments, whose CO2 emissions account for 82% of the total emissions reported in the MRV system, namely containerships, oil tankers, bulkers, RoPax vessels, chemical tankers, general cargo carriers and RoRo vessels. This restriction is done mainly due to the fact that we will assess the direct costs for each maritime segment separately and included segments are the main contributors of CO2 emissions from shipping at EU level.
To the best of our knowledge no existing literature has assessed the economic impacts of an ETS for maritime transport using the MRV data that were reported for the first time in 2019 and this constitutes the main novelty of this paper in addition to the assessment of direct costs per maritime segment and not the shipping industry as a whole. Existing literature focuses on the design characteristics of an ETS for shipping and the potential environmental and economic impacts from its implementation on the whole maritime sector; there is, though, limited research on the differentiated impact that such a scheme could have among different maritime segments, supposing due to lack of data on ships’ average energy efficiency [17,37,51]. Given the fundamental technical and operational differences among vessel categories, the economic impact of the inclusion of shipping in the EU-ETS needs to be analysed per maritime segment and it is exactly this gap that our study aims to fill.
Our economic impact assessment model will be scenario-based, and include different price incentives, geographical scope of the system and emission allowances allocation methods, as the design features of the potential inclusion of maritime transport GHG emissions in the EU-ETS remain unclear for the moment. In this regard, a sensitivity analysis will be used to assess the impact of these design options on different maritime segments. According to [56], sensitivity analysis is ‘the study of how the uncertainty in the output of a model (numerical or otherwise) can be apportioned to different sources of uncertainty in the model input’ and, in our study, will assist at the identification of factors and parameters that play a significant role for the effective inclusion of shipping in the EU-ETS. More specifically, the sensitivity analysis will determine how independent variables (price incentives, geographical scope of the system and emission allowances allocation methods) of the inclusion of shipping in the EU-ETS can have an impact on the dependent variable (direct costs for the maritime sector). It will show how impactful different price incentives, geographical scope of the system and emission allowances allocation methods are to cost increases for the shipping industry and how sensitive these costs are to different scenarios.
4. Results
4.1. Analysis of the MRV Data
The statistical analysis of the MRV data provided valuable insight on the energy efficiency and CO2 emissions per maritime segment included in the database and focused on three main parameters: (a) CO2 emissions per maritime segment for all incoming voyages from non-EU to EU ports and outgoing voyages from EU to non-EU ports, (b) CO2 emissions per segment only for internal EU voyages and (c) CO2 emissions per transport work for each segment.
The input from the analysis of these data will serve as a basis for our sensitivity analysis on the direct costs from the inclusion of shipping in the EU-ETS on each maritime segment. The data on CO2 emissions per maritime segment for all incoming voyages from non-EU to EU ports and outgoing voyages from EU to non-EU ports will highlight the segments that are the main contributors of shipping CO2 emissions. The comparison of this data to CO2 emissions per segment only for internal EU voyages will assist in the identification of the segments that are most likely to be affected by a regional MBM, such as the EU-ETS. Finally, assuming that allowances allocation methodology for the maritime sector will be similar to aviation and based on transport work (tonne-km), the data on the CO2 emissions per transport work for each segment will be used for the setting of the benchmark on the basis of a percentage of emission allowances which will be allocated for free, at least at the initial phase of the scheme, following the example of aviation.
Figure 1 presents CO2 emissions per maritime segment under different scenarios concerning the geographical scope of the scheme based on the descriptive statistical analysis of the MRV data with the use of the R software. The three scenarios were chosen on the basis of the different geographical scopes considered by the EC in its communication, released in 2020, concerning the available policy options to achieve Europe’s 2030 climate ambition on climate neutrality [57], and they include emissions from (a) all incoming voyages from non-EU to EU ports and outgoing voyages from EU to non-EU ports (total emissions), (b) all internal EU voyages and 50% of incoming voyages from non-EU to EU ports and outgoing voyages from EU to non-EU ports (emissions within EEA and 50% of the remaining emissions) and (c) only internal EU voyages (emissions within EEA). The geographical scope consists a particularly important parameter for the amount of CO2 emissions from deep sea segments (containerships, oil tankers, bulkers, general cargo carriers), while CO2 emissions are more or less the same for short sea shipping segments (RoRo and RoPax vessels), irrespective of the geographical scope of the system. While containerships, oil tankers and bulkers are the three main polluting maritime segments when all incoming voyages from non-EU to EU ports and outgoing voyages from EU to non-EU ports are considered, RoPax vessels turn out to be the main polluting sector for only internal EU voyages.
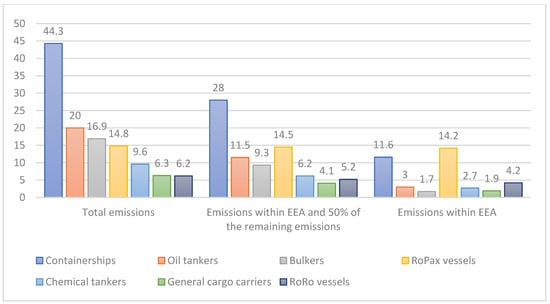
Figure 1.
CO2 emissions per maritime segment (Mtonnes). Source: Created by the authors.
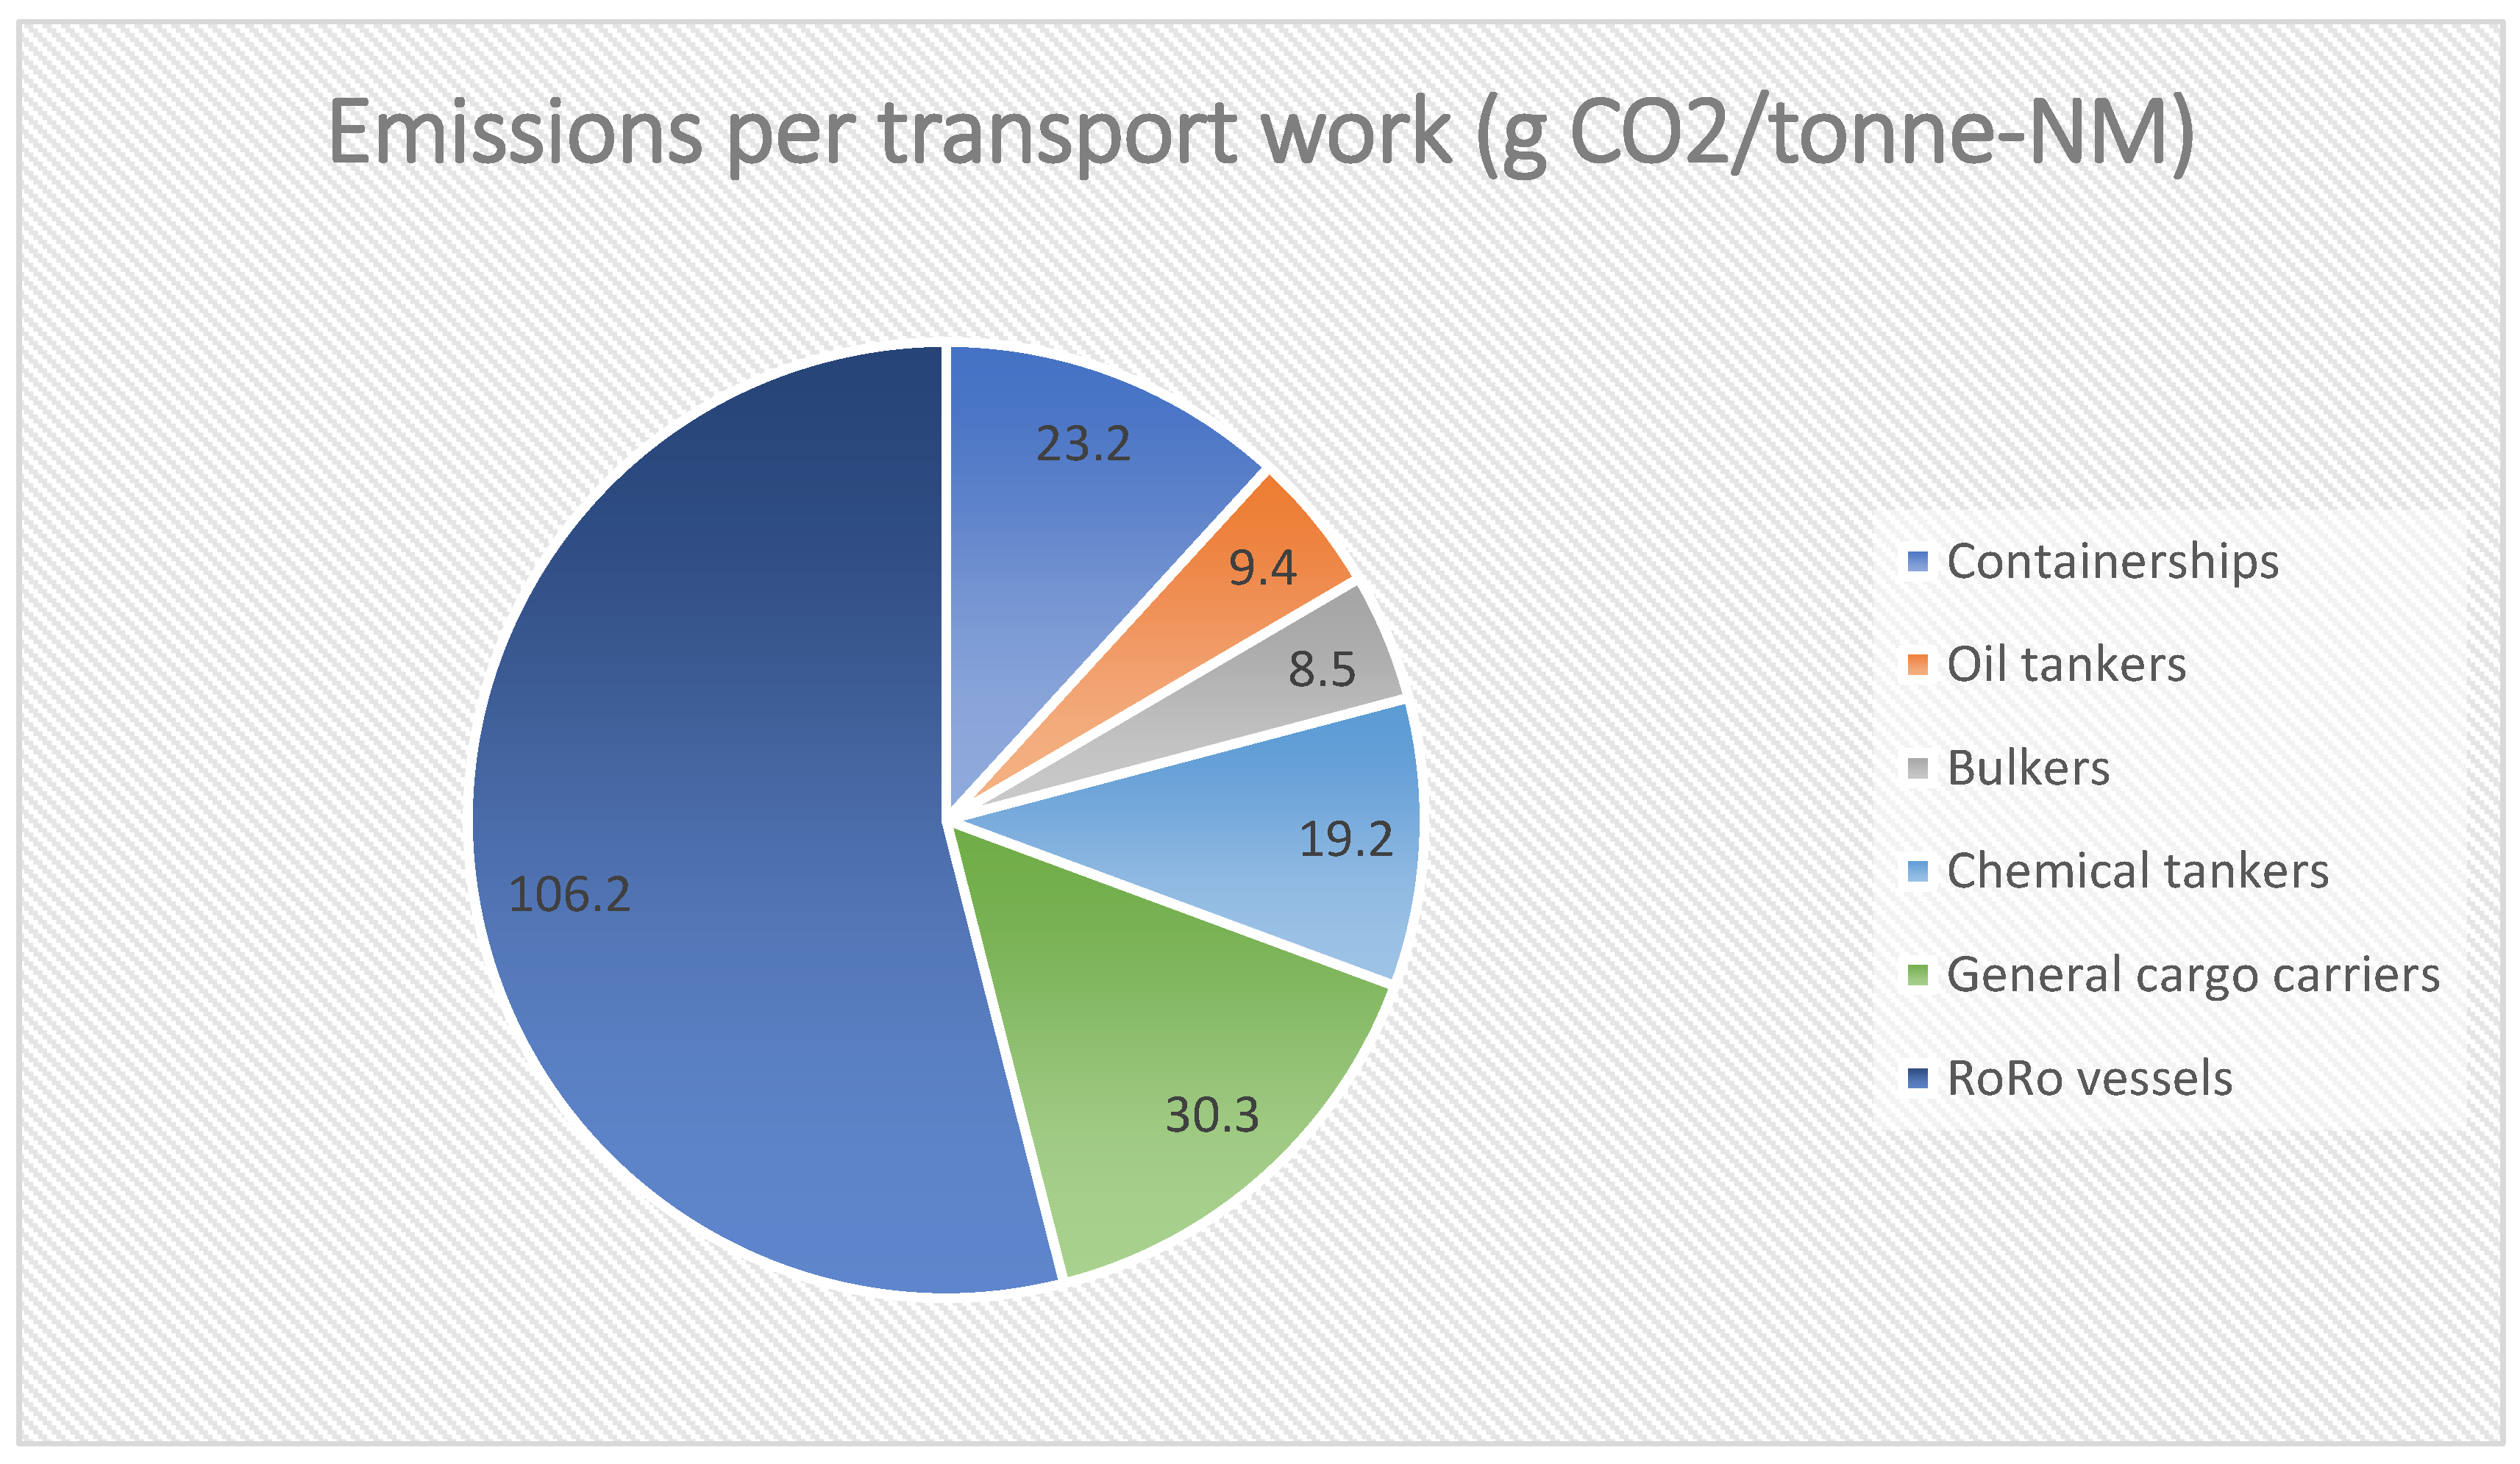
Coming to the CO2 emissions per transport work for each maritime segment that will potentially form the basis for the benchmark for the free allocation of a certain percentage of emission allowances, the results from the analysis of the MRV data are presented in Figure 2. It is worthwhile to mention here that during the statistical analysis, a number of outliers (including extreme values and mistakes) on CO2 emissions per transport work were detected for all maritime segments. These outliers were removed from the dataset with the use of the percentiles technique in the R software, as they consisted of both impossible and unlikely data and no sound conclusions could be drawn without their removal (Supplementary Materials). According to our findings, bulkers are the most energy efficient segment, emitting 8.5 gCO2/tonne-NM, followed by oil tankers, containerships and general cargo carriers. As expected, CO2 emissions per transport work are particularly high for the RoRo shipping segment, accounting for 106.2 gCO2/tonne-NM, due to the low load factor of this sector [58,59].
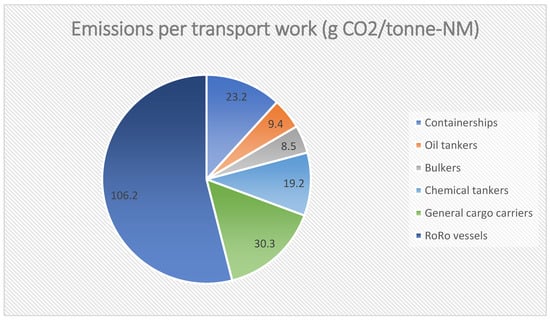
Figure 2.
CO2 emissions per transport work (gCO2/tonne-NM). Source: Created by the authors.
4.2. Economic Impact Assessment for Different Maritime Segments
The case of including shipping in the EU-ETS is similar to aviation, with the emission allocation methodology based on transport work, but much more complicated, given the technical and operational differences among maritime segments. The economic impact from the inclusion of shipping in the EU-ETS varies largely depending on the geographical scope of the system, the price of emission allowances and the percentage of allowances free-allocated to each maritime segment. Given the fact that up to now, there is no official proposal on how the inclusion of shipping in the EU-ETS will be realised, different design options and policy scenarios are analysed in our assessment of potential economic impacts on different maritime segments. These assumptions concern the geographical scope of the system, the price of emission allowances and the allowances allocation methodology based on the existing literature.
- Geographical scope of the system. Include (a) only internal EU voyages, (b) all incoming voyages from non-EU to EU ports and outgoing voyages from EU to non-EU ports, (c) all internal EU voyages and 50% of incoming voyages from non-EU to EU ports and outgoing voyages from EU to non-EU ports. All three assumptions are made on the basis of the different geographical scopes considered by the European Commission in its communication, released in 2020, concerning the available policy options to achieve Europe’s 2030 climate ambition on climate neutrality [57].
- Price of emission allowance units. The price of emission allowances has been around EUR 25 during the year 2019 with a sharp drop to 15 EUR on 23 March 2020 due to the Coronavirus crisis and has come up to 35 EUR on 9 January 2021. Given the target of the European Green Deal for net zero emissions in the EU before 2050, the emission allowances price can be expected to increase till 2050 reaching or approaching the cost of carbon capture and storage, somewhere between EUR 60 and 90 per tonne [60]. In this study, we assume two different scenarios of emission allowance price: 35 and 70, considering the short-term horizon of the inclusion of shipping in the EU-ETS.
- Emission allowances allocation method. Two scenarios are analysed in relation to the allocation of emission allowances: (a) full auctioning (100%) and (b) auctioning of 15% of the allowances with 85% free-allocated. The assumptions are based on the previous experience with the inclusion of aviation in the EU-ETS; during the first phase of this inclusion, 82% of the allowances for the aviation sector were free-allocated. Considering, also, the need for urgent action to achieve climate neutrality in Europe and the call of the EC for reduced free-allocated allowances in the EU-ETS, we assume 85% of emission allowances for the maritime sector to be allocated for free during the first phase of this scheme.
The additional cost of emission allowances (C) is a function of the amount of emissions included in the EU-ETS (e), the price of the allowances (p) and the amount of free-allocated emissions allowances (q):
where Cs is the additional cost of emission allowances (expressed in MEUR) with s representing the different maritime segments, ei is the amount of emissions included in the scheme (expressed in Mtonnes) with i ranging from all incoming and outgoing voyages from/to an EU port to only intra-EU voyages, qj is the amount of free-allocated emissions (expressed in Mtonnes) with j ranging from 0 to 85% of emission allowances free-allocated and py is the price of allowances (expressed in EUR) with y ranging from 35 to 70.
Cs = (ei − qj)*py
Our initial assessment of the direct economic impact on the maritime sector from its inclusion in the EU-ETS is provided in Table 1, considering the various scenario options and assuming no abatement measures are taken. The overall emissions from shipping, included in the EU MRV system, for the year 2019 accounted for 145 Mtonne CO2, while one third of these emissions (48 Mtonne CO2) came from intra-European voyages. As can be seen in Table 1, the additional economic cost varies widely depending on the amount of emission allowances that will be included in the EU-ETS, the percentage of allowances that will be free-allocated and the price of the allowances. The additional cost ranges from around 5 to 10.1 billion EUR, in case of full-auctioning and assuming the inclusion of all incoming and outgoing voyages from/to an EU port (Scenario A). If only emissions from intra-European voyages are included in the scheme (Scenario B), the total cost for the maritime sector lies between 1.7 to 3.4 billion EUR, depending on the allowance price (from 35 to 70 EUR).

Table 1.
Cost increase for maritime sector assuming 100% auctioning, expressed in MEUR.
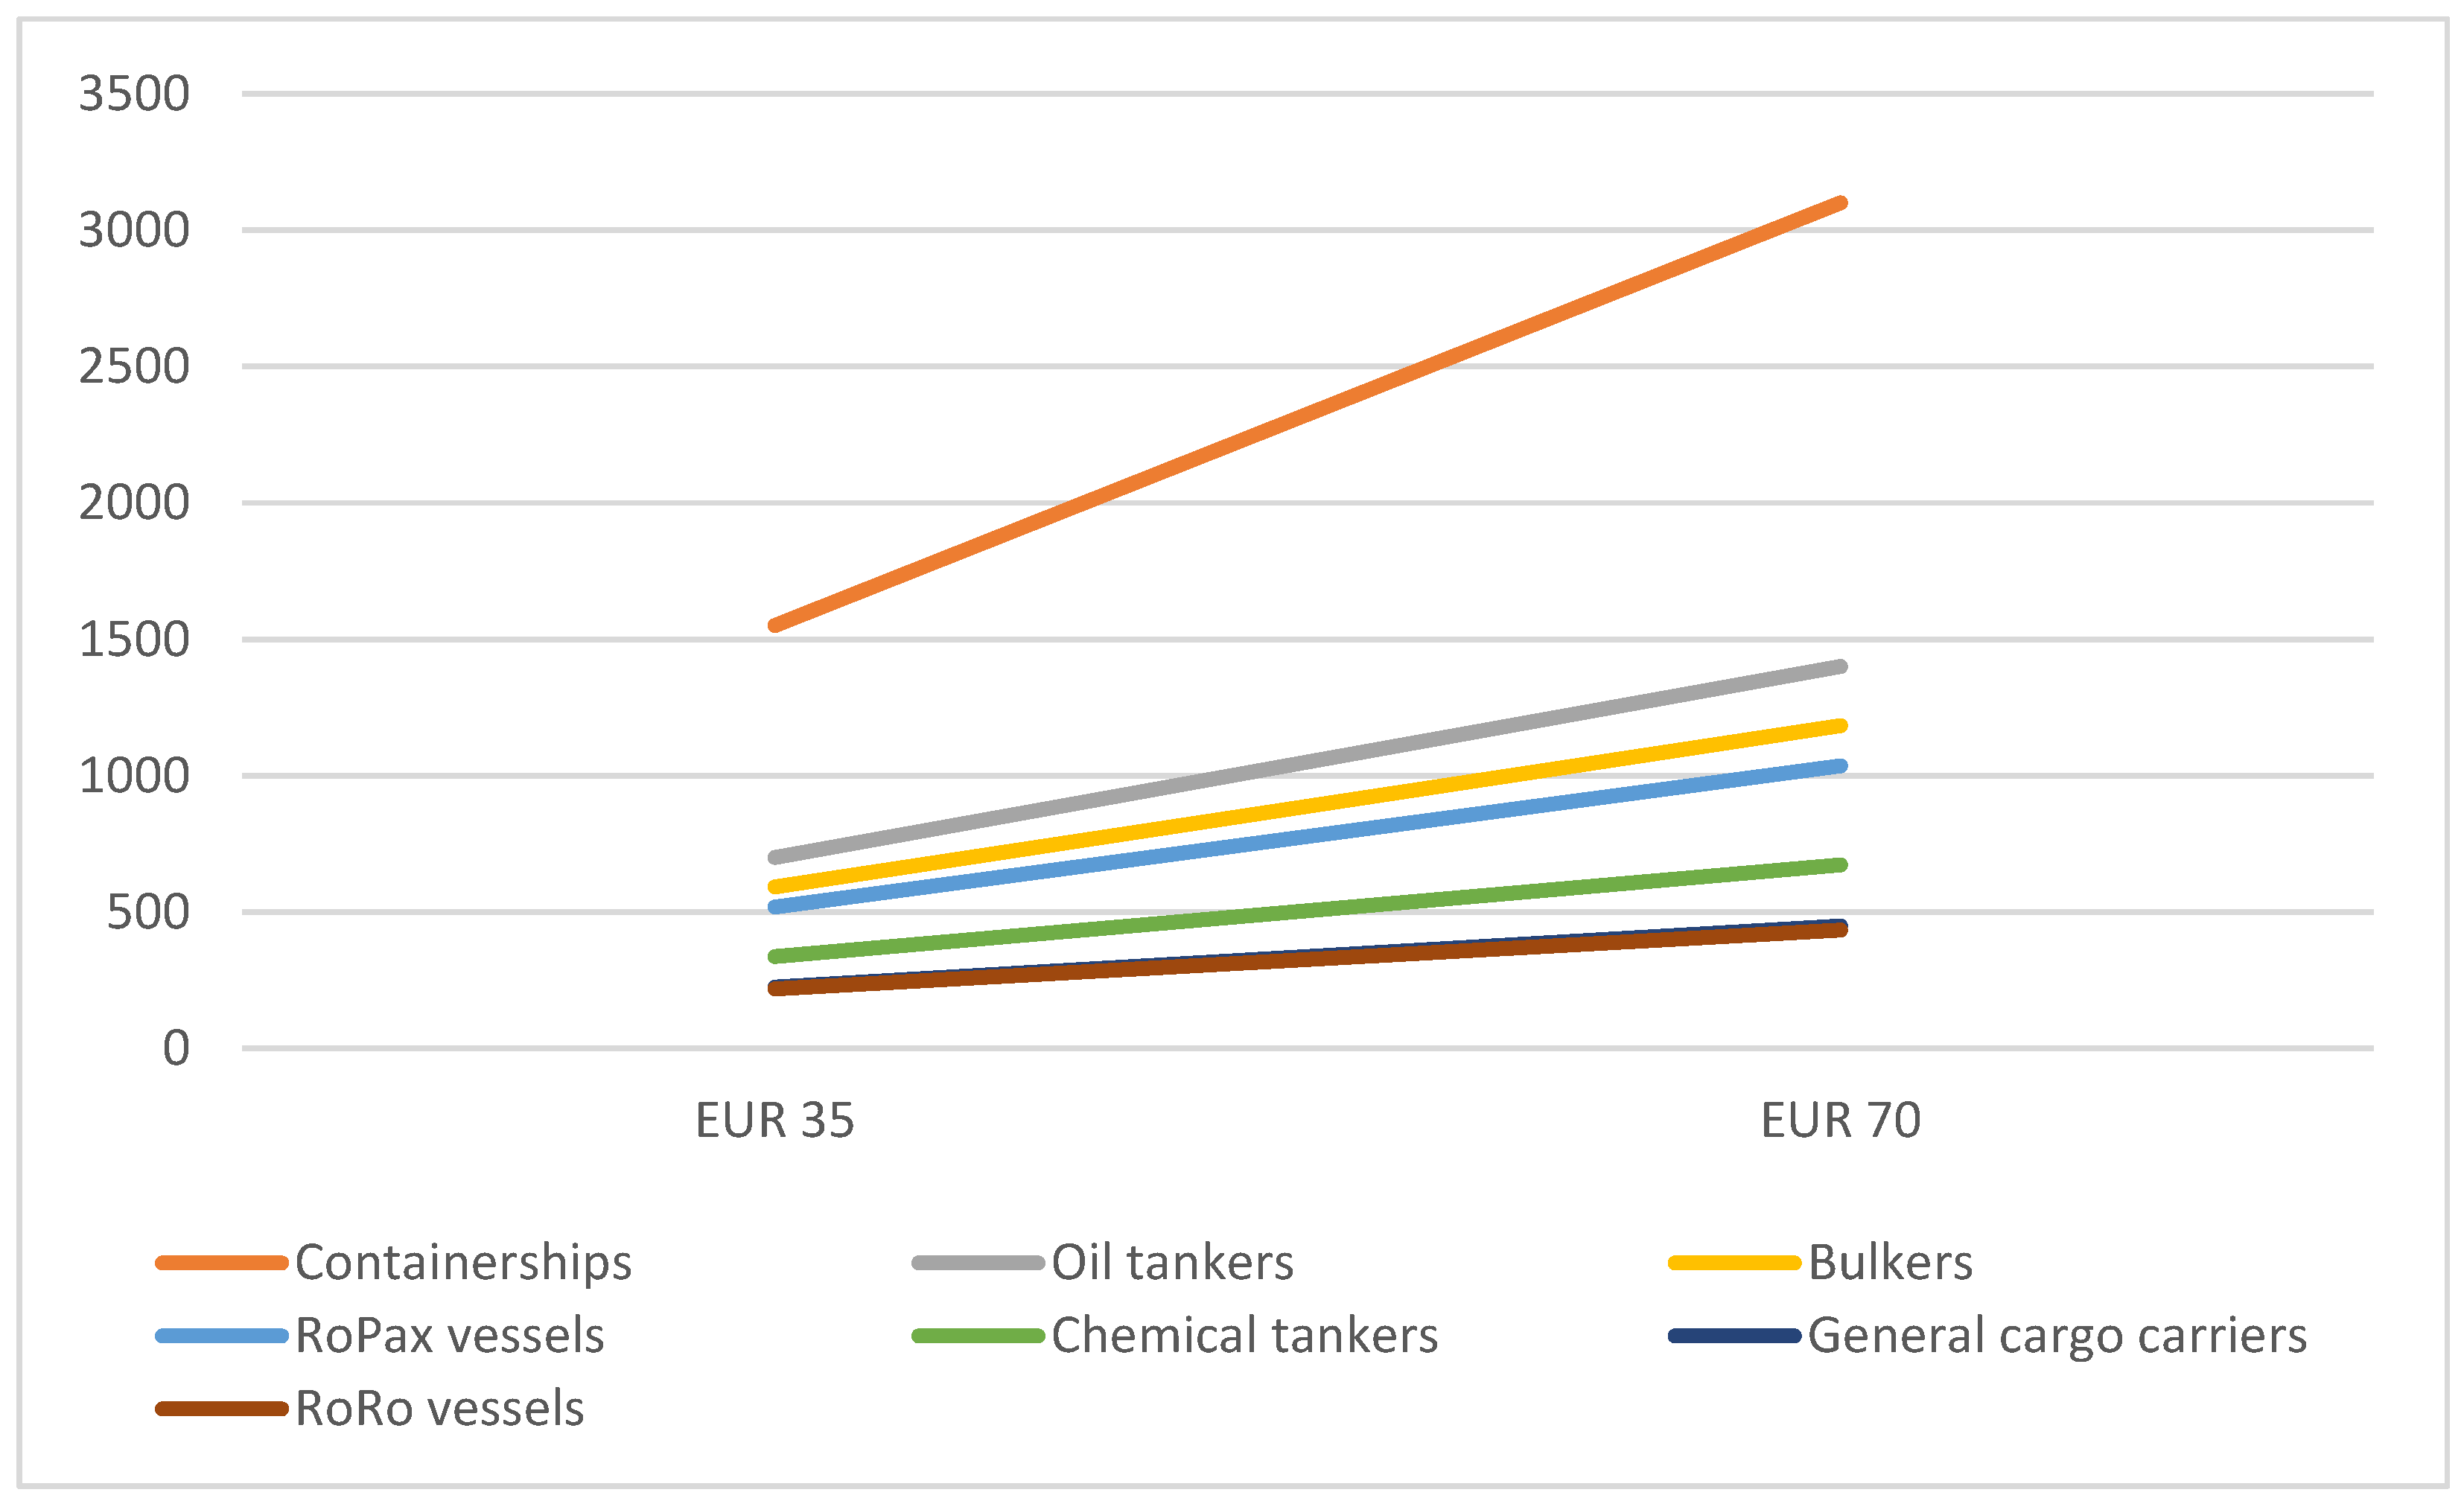
The cost increase for the maritime sector from its inclusion in the EU-ETS differs widely among the various maritime segments depending on the geographical scope of the scheme and the allowances allocation method. Assuming that all allowances are auctioned and CO2 emissions from all incoming and outgoing voyages from/to an EU port are included, the container sector seems to be mostly affected by the additional CO2 cost (with a cost increase ranging from 1.5 to 3.1 billion euros, according to the allowance unit price, which is expected due to the increased CO2 emissions from this sector). Oil tankers and bulkers are the second and third sectors most affected by the additional CO2 cost, RoPax vessels come at the fourth place, while RoRo vessels and general cargo carriers are the least affected sectors, with a cost increase of less than half billion euros even in the case of an allowance unit price of EUR70 (Figure 3).

Figure 3.
Cost increase per maritime segment assuming the inclusion of all incoming and outgoing voyages from/to an EU port, expressed in MEUR (full auctioning). Source: Created by the authors.
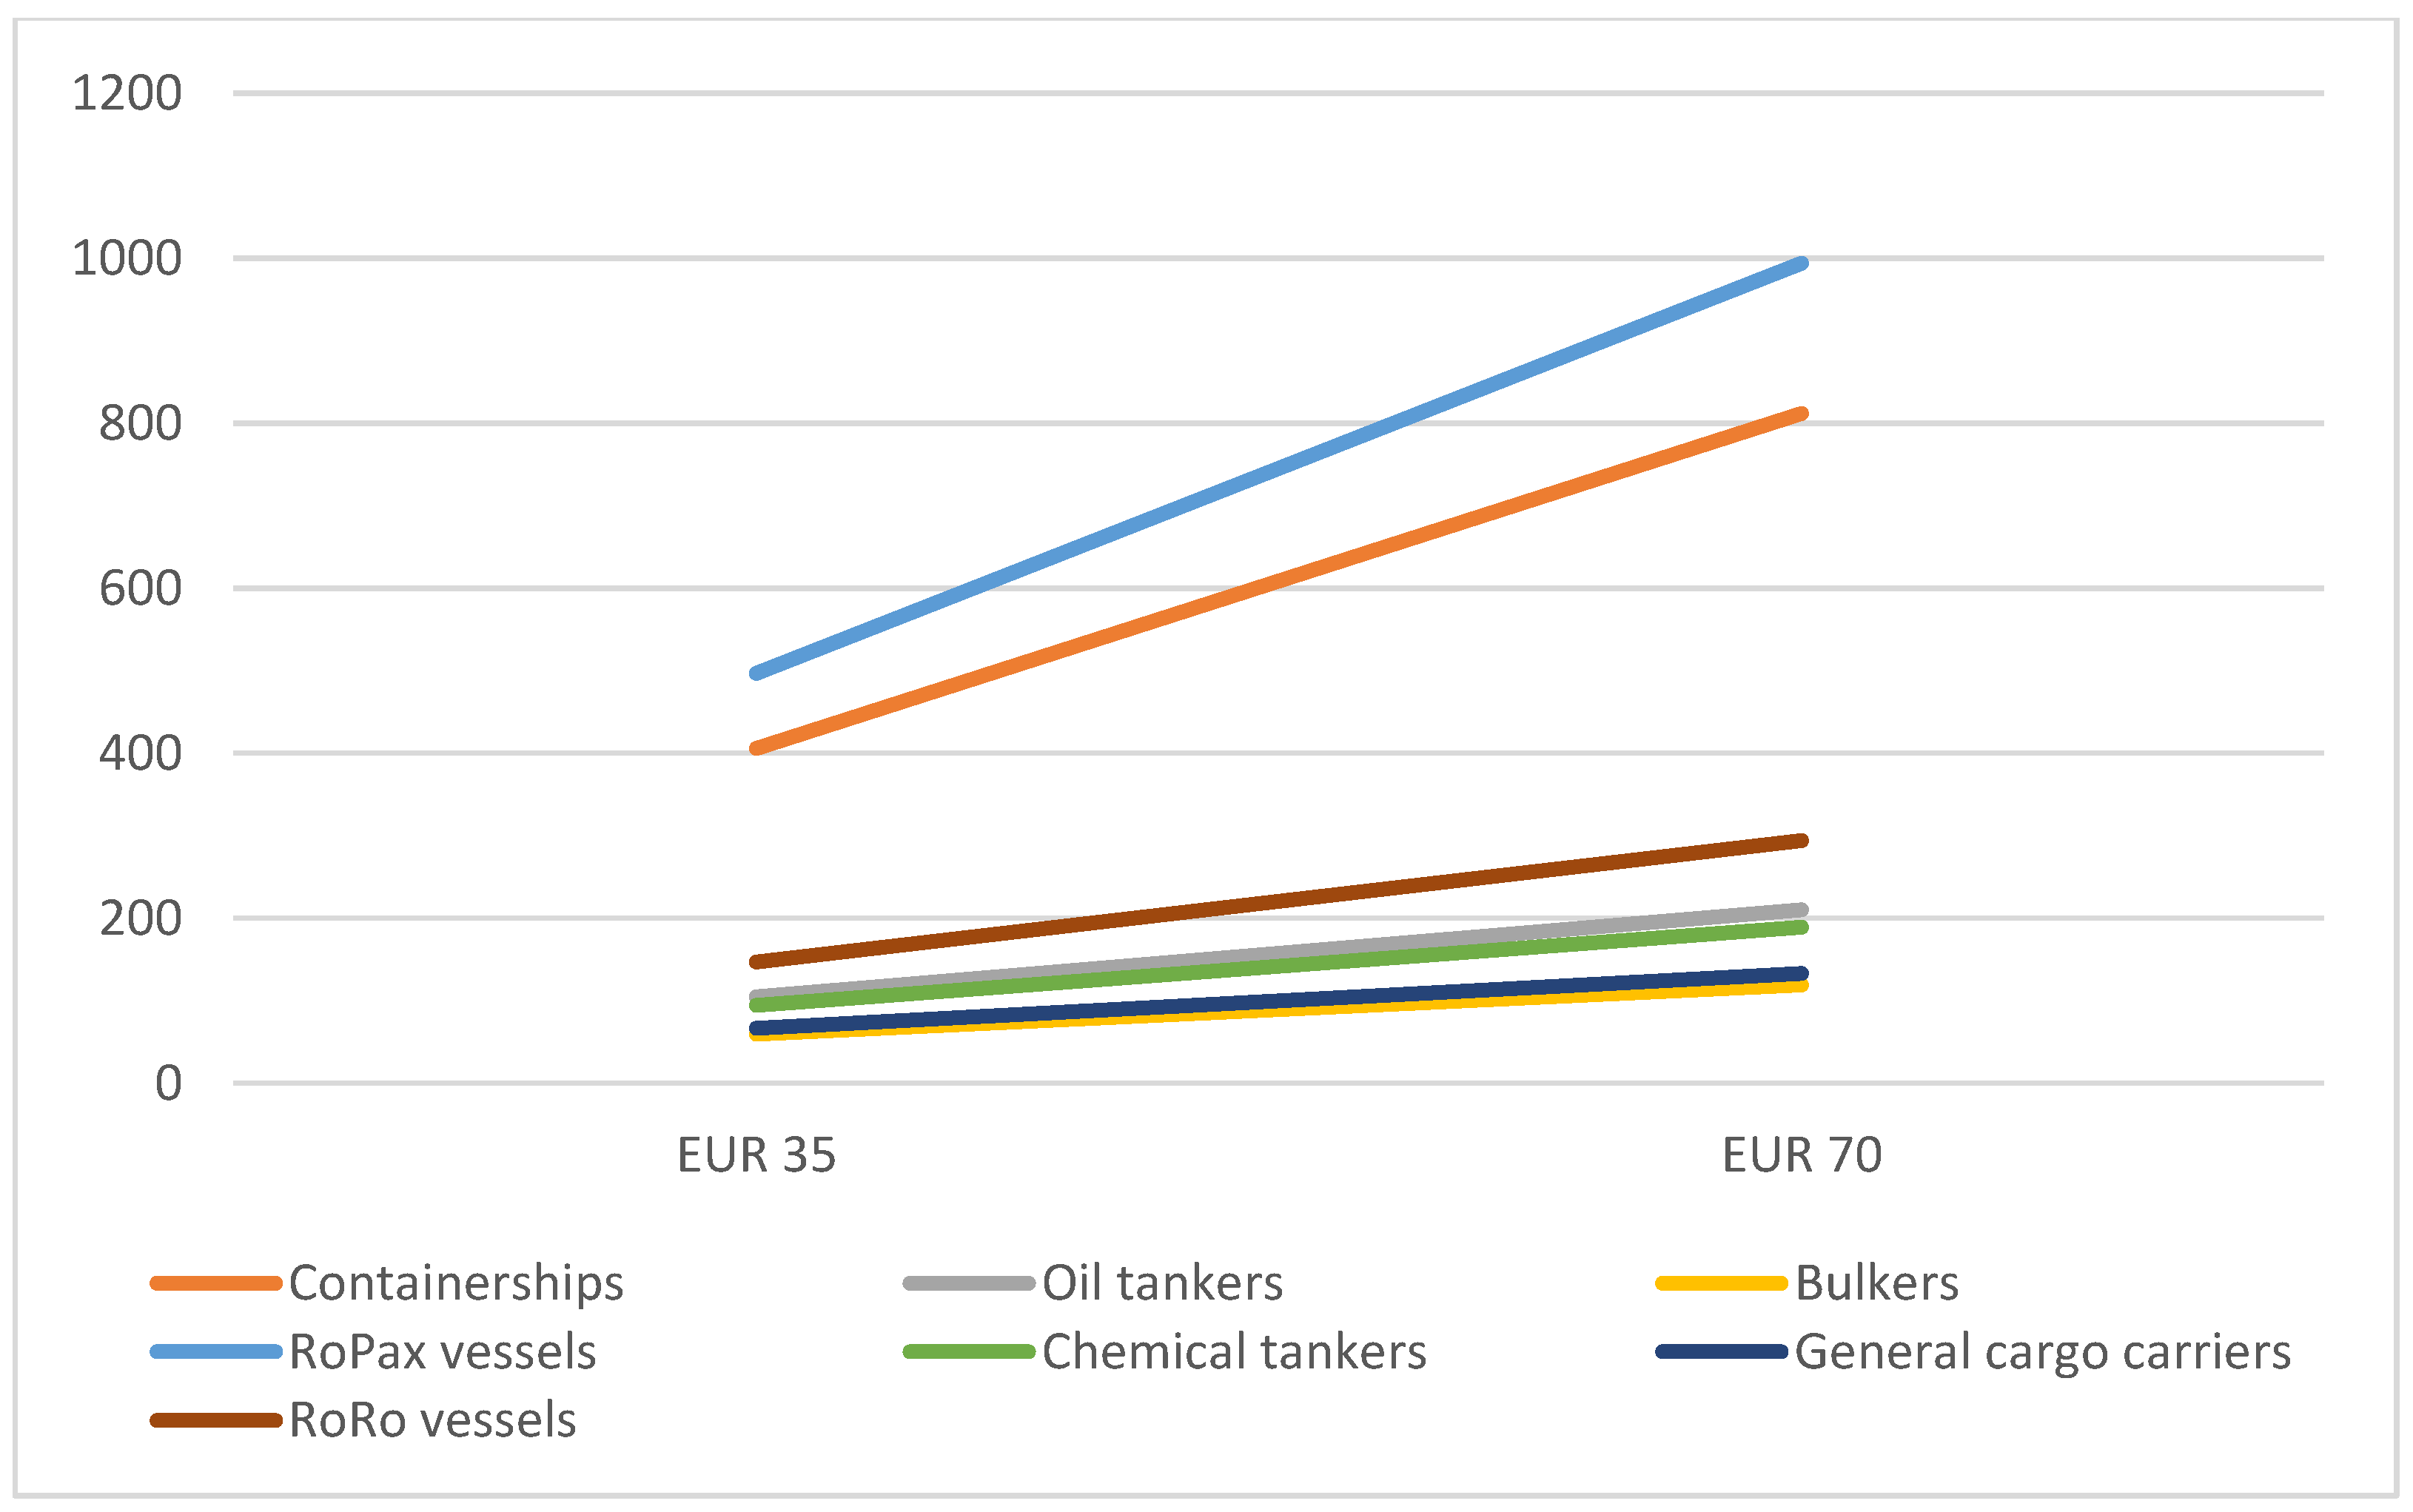
The economic impact from the inclusion of shipping in the EU-ETS remains similar if we assume the inclusion of all internal EU voyages and 50% of incoming and outgoing voyages from/to an EU port. The cost increase is by far the highest for the container sector, with the RoPax vessels coming in second place and facing a cost increase that ranges from 507 million to 1 billion euros (Figure 4). The situation is completely different assuming the inclusion of only intra EU voyages in the EU-ETS due to the larger impact on the short sea segments, the RoRo and RoPax vessels. The RoPax segment is the most affected sector in this scenario with a cost increase that reaches up to 994 million euros in relation to the containerships that face a cost increase of up to 812 million euros. RoRo vessels come at the third place with a cost increase that ranges from 147 to 294 million euros (Figure 5). The CO2 emissions and the consequent cost increase for the RoRo and RoPax sectors are not influenced by the geographical scope of the scheme as they operate within the EEA in contrast to the deep sea segments that are engaged in distant voyages and operations within the EEA consist only the first/last leg of their voyage.
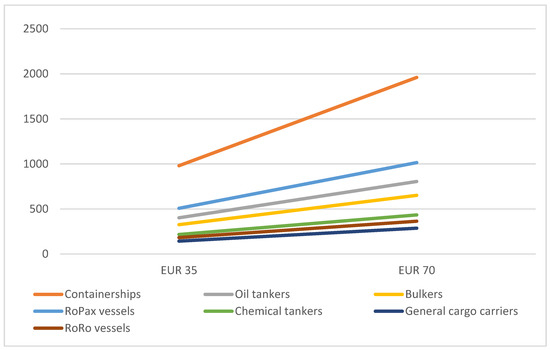
Figure 4.
Cost increase per maritime segment assuming the inclusion of all internal EU voyages and 50% of incoming and outgoing voyages from/to an EU port, expressed in MEUR. Source: Created by the authors.
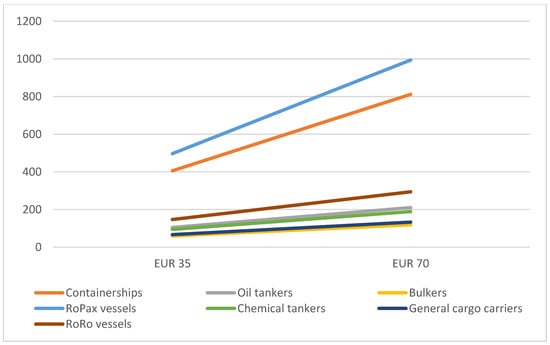
Figure 5.
Cost increase per maritime segment assuming the inclusion of only internal EU voyages, expressed in MEUR. Source: Created by the authors.
The allowances allocation method is another crucial parameter that determines the cost increase from the inclusion of shipping in the EU-ETS for the different segments. Assuming that 15% of the allowances are auctioned and the remaining are allocated for free in the initial phase of the scheme (as is the current case for aviation), the cost increase for the maritime industry and the different segments will be calculated on the basis of a benchmark that depends on the CO2 emissions per transport work (ton-NM). Following the example of aviation, the benchmark equals to the total amount of free allowances divided by the sum of transport work. In our scenario, free-allocated allowances account for 85% of total CO2 emissions:
where b is the benchmark (expressed in Mtonnes/ton-NM), ei is the amount of emissions included in the scheme (expressed in Mtonnes) with i ranging from all incoming and outgoing voyages from/to an EU port to only intra-EU voyages and t is the transport work (expressed in ton-NM).
b = (85%*ei)/t
Coming to:
Cs = (ei − qj)*py
In case of full-auctioning:
qj = 0 and Cs = ei*py
In case of free-allocating 85% of emission allowances:
qj = b*t and Cs = (ei − (b*t))*py
This benchmark will potentially differ among segments to avoid competition distortion as certain vessel types (e.g., bulkers) are more energy efficient than others (e.g., RoRo vessels) due to their technical and operational characteristics. The energy efficiency of the vessels is also influenced by their size as smaller vessels are usually less energy efficient than larger ones, but our analysis is limited to maritime segments.
In case a uniform benchmark is set for all vessels under the MRV scope for the free allocation of 85% of the emission allowances, the impact on the various segments will differ widely (Table 2). The bulkers and oil tankers would be favoured with a surplus of 8.8 and 7.5 million ton free-allocated emissions respectively, while RoRo shipping would be penalised with only 0.8 million tonne emissions free-allocated in total. The establishment of differentiated benchmarks for each segment seems the most effective allocation method that will reward the most energy efficient vessels in each category and promote investments in the maritime sector. While the uniform benchmark equals to the total amount of free allowances for the whole maritime sector divided by the sum of transport work, the differentiated benchmarks per segment are calculated considering the percentage of free-allocated allowances and the transport work of each segment. In our scenario, differentiated benchmarks are calculated:
where bs is the benchmark for each segment (expressed in Mtonnes/ton-NM) with s representing bulkers, containerships, oil tankers, chemical tankers, RoRo vessels and general cargo carriers, es,i is the amount of emissions included in the scheme (expressed in Mtonnes) with s representing the various segments and i ranging from all incoming and outgoing voyages from/to an EU port to only intra-EU voyages and ts is the transport work per segment (expressed in ton-NM).
bs = (85%*es,i)/ts
Table 2.
CO2 emissions free-allocated on the basis of a uniform/differentiated benchmarks for all maritime segments (Mtonnes).
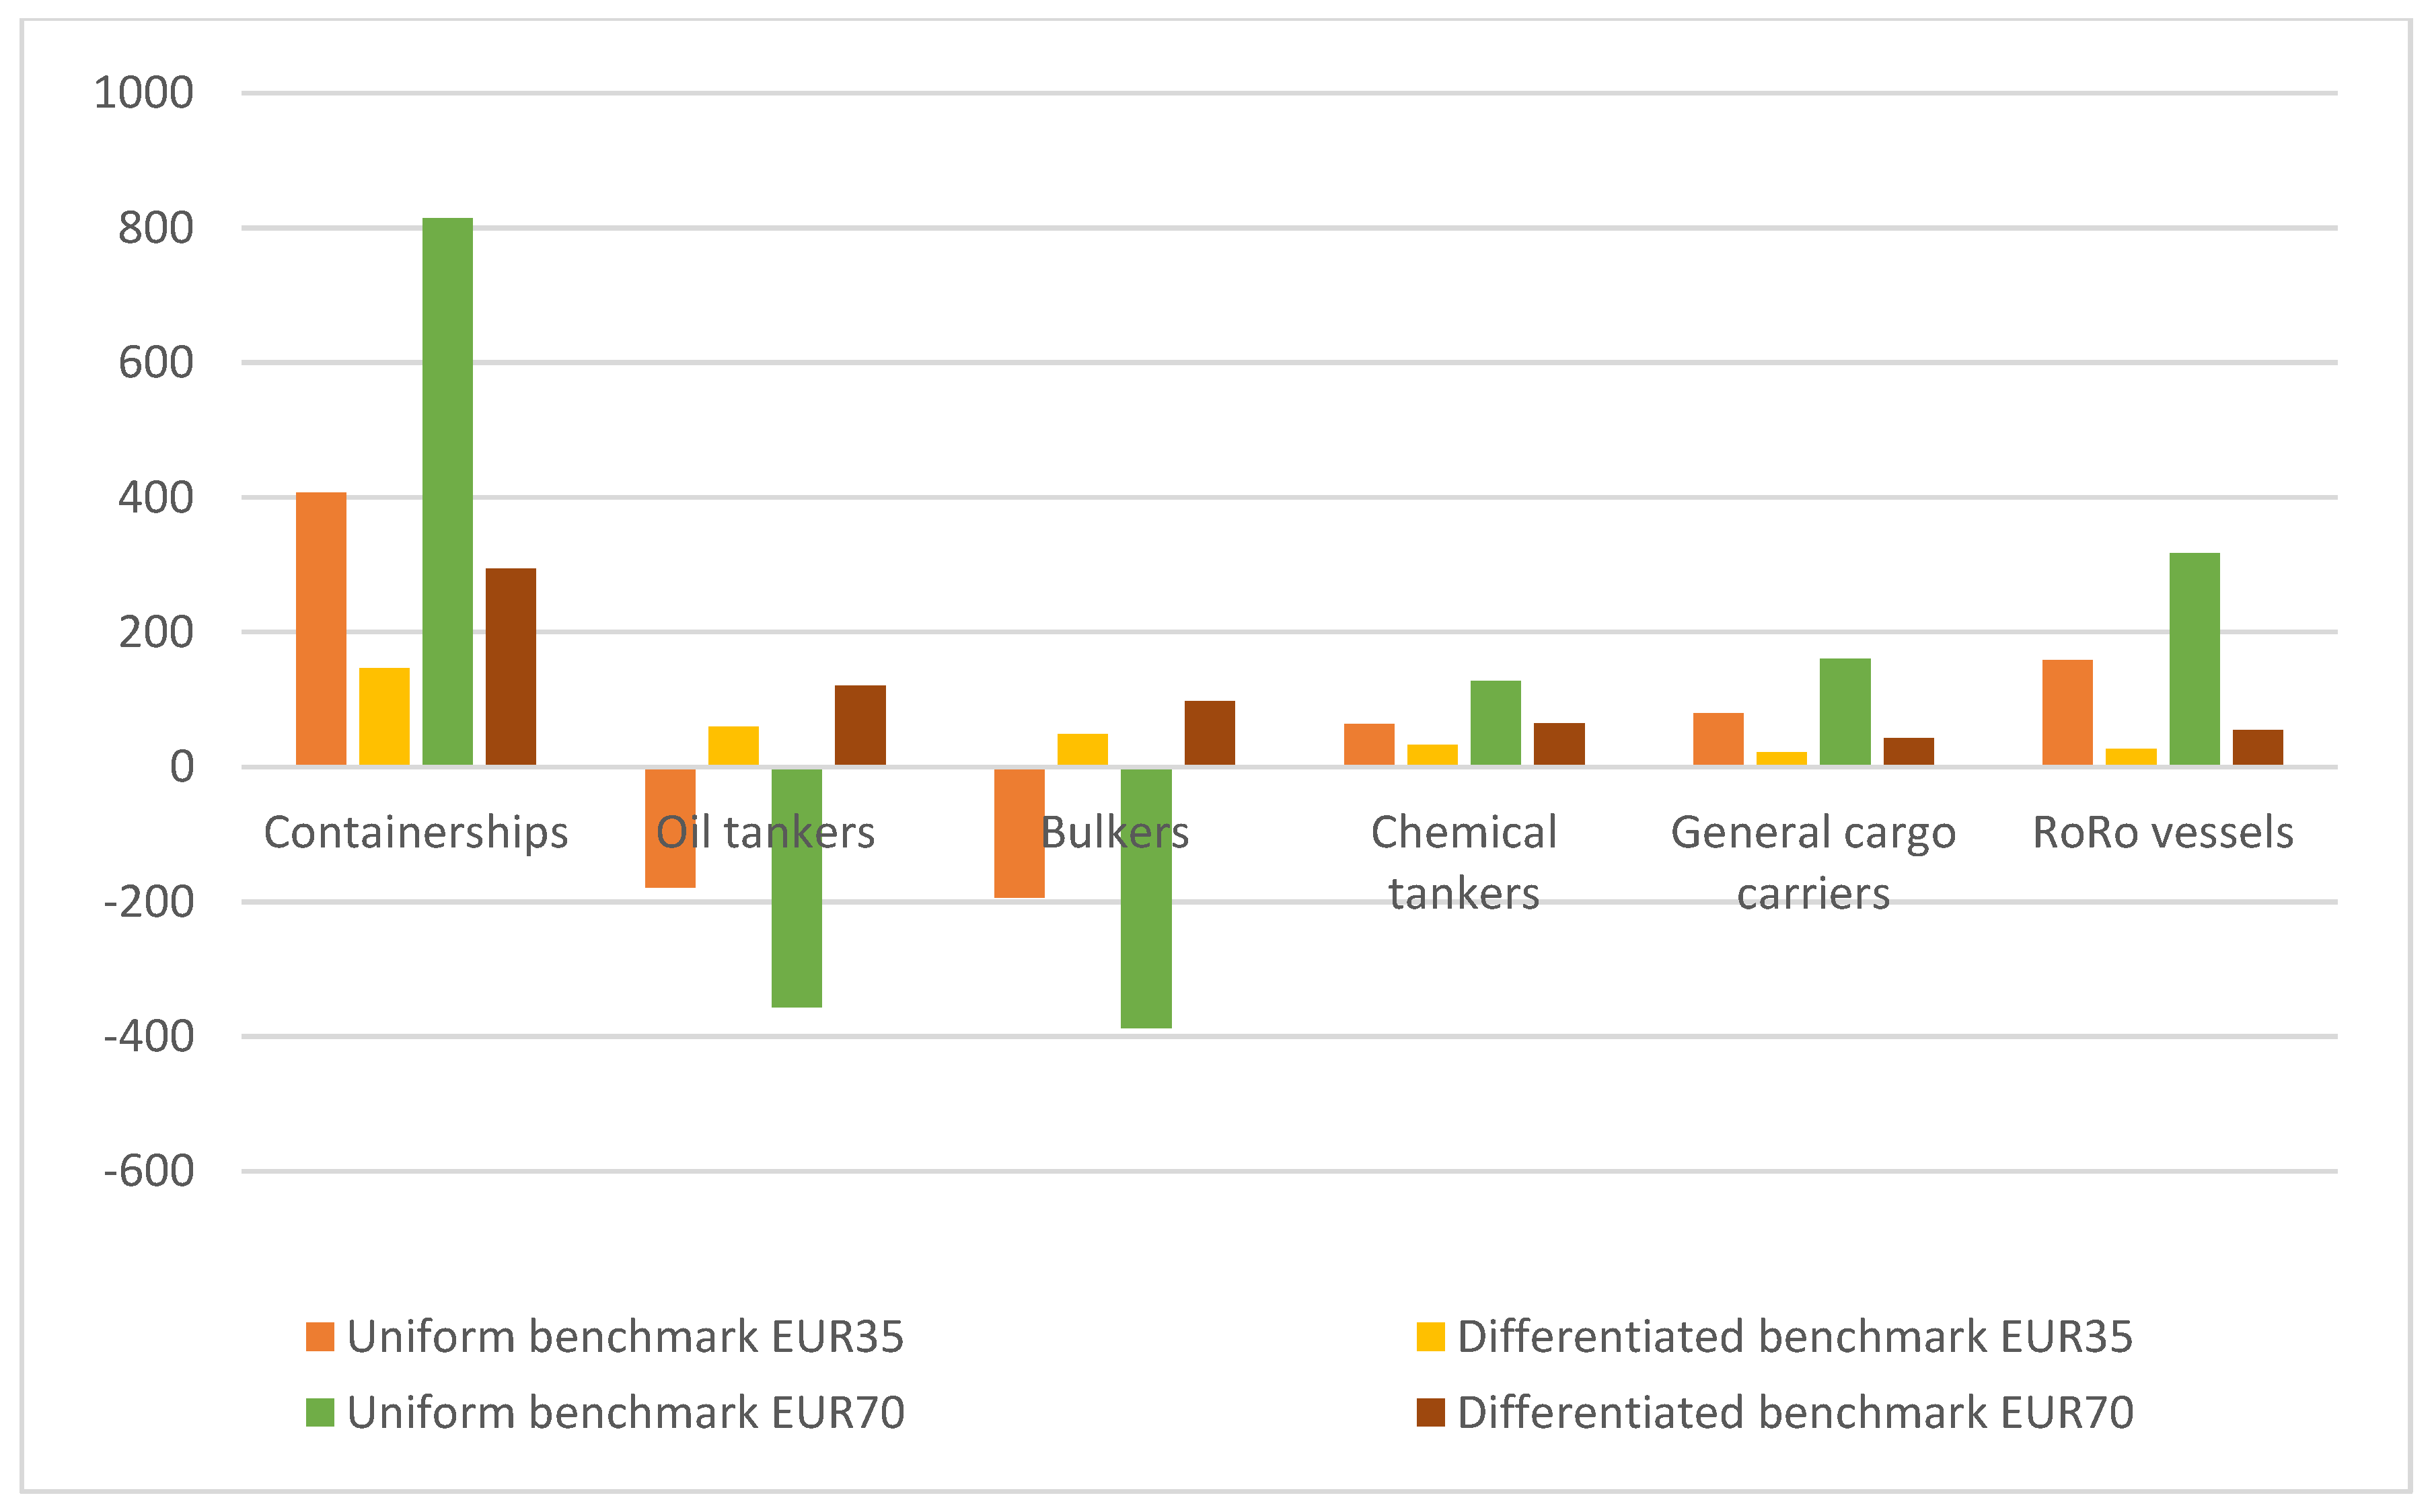
Assuming that 15% of allowances are auctioned and the remaining were allocated for free based on a uniform or differentiated benchmark for each segment, the direct costs for the included maritime sector would range from around EUR 761 million to 1.52 billion if all incoming and outgoing voyages from/to an EU port are included in the scheme. The cost increase for each segment, though, depends largely on the established benchmark (Figure 6). A uniform benchmark would be extremely beneficial for bulkers and oil tankers that would not face any cost increase; in contrast a surplus of emission allowances would be allocated to both sector (ranging from 248 to 497 million euros for the bulk sector and 262 to 525 million euros for tankers) corresponding to the increased energy efficiency of the segment in comparison to the others. In contrast, the cost increase would penalise less energy efficient segments, like RoRo vessels and general cargo carriers. RoRo vessels would face a cost increase up to 364 million euros although the total CO2 emissions from their operations are by far lower than containerships, oil tankers and bulkers. In case differentiated benchmarks for each maritime segment were set on the basis of their CO2 emissions per transport work, the most energy efficient vessels per segment would be rewarded avoiding competition distortion among segments. The economic impact per maritime segment, assuming the free allocation of 85% of allowances on the basis of a uniform or differentiated benchmark for each segment, would be similar if all internal EU voyages and 50% of incoming and outgoing voyages from/to an EU port are included in the scheme (Figure 7).
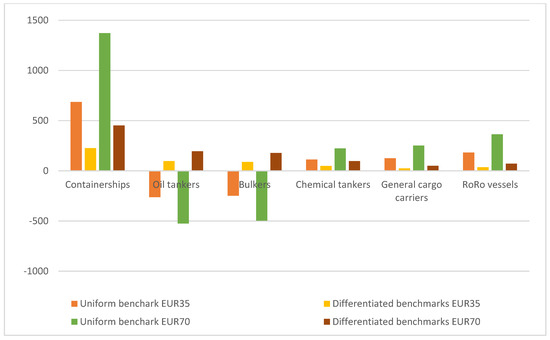
Figure 6.
Cost increase per maritime segment assuming a uniform/differentiated benchmark and the inclusion of all incoming and outgoing voyages from/to an EU port, expressed in MEUR. Source: Created by the authors.
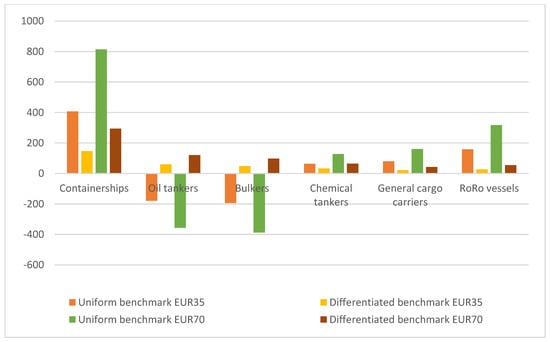
Figure 7.
Cost increase per maritime segment assuming a uniform/differentiated benchmark and the inclusion of all internal EU voyages and 50% of incoming and outgoing voyages from/to an EU port, expressed in MEUR. Source: Created by the authors.
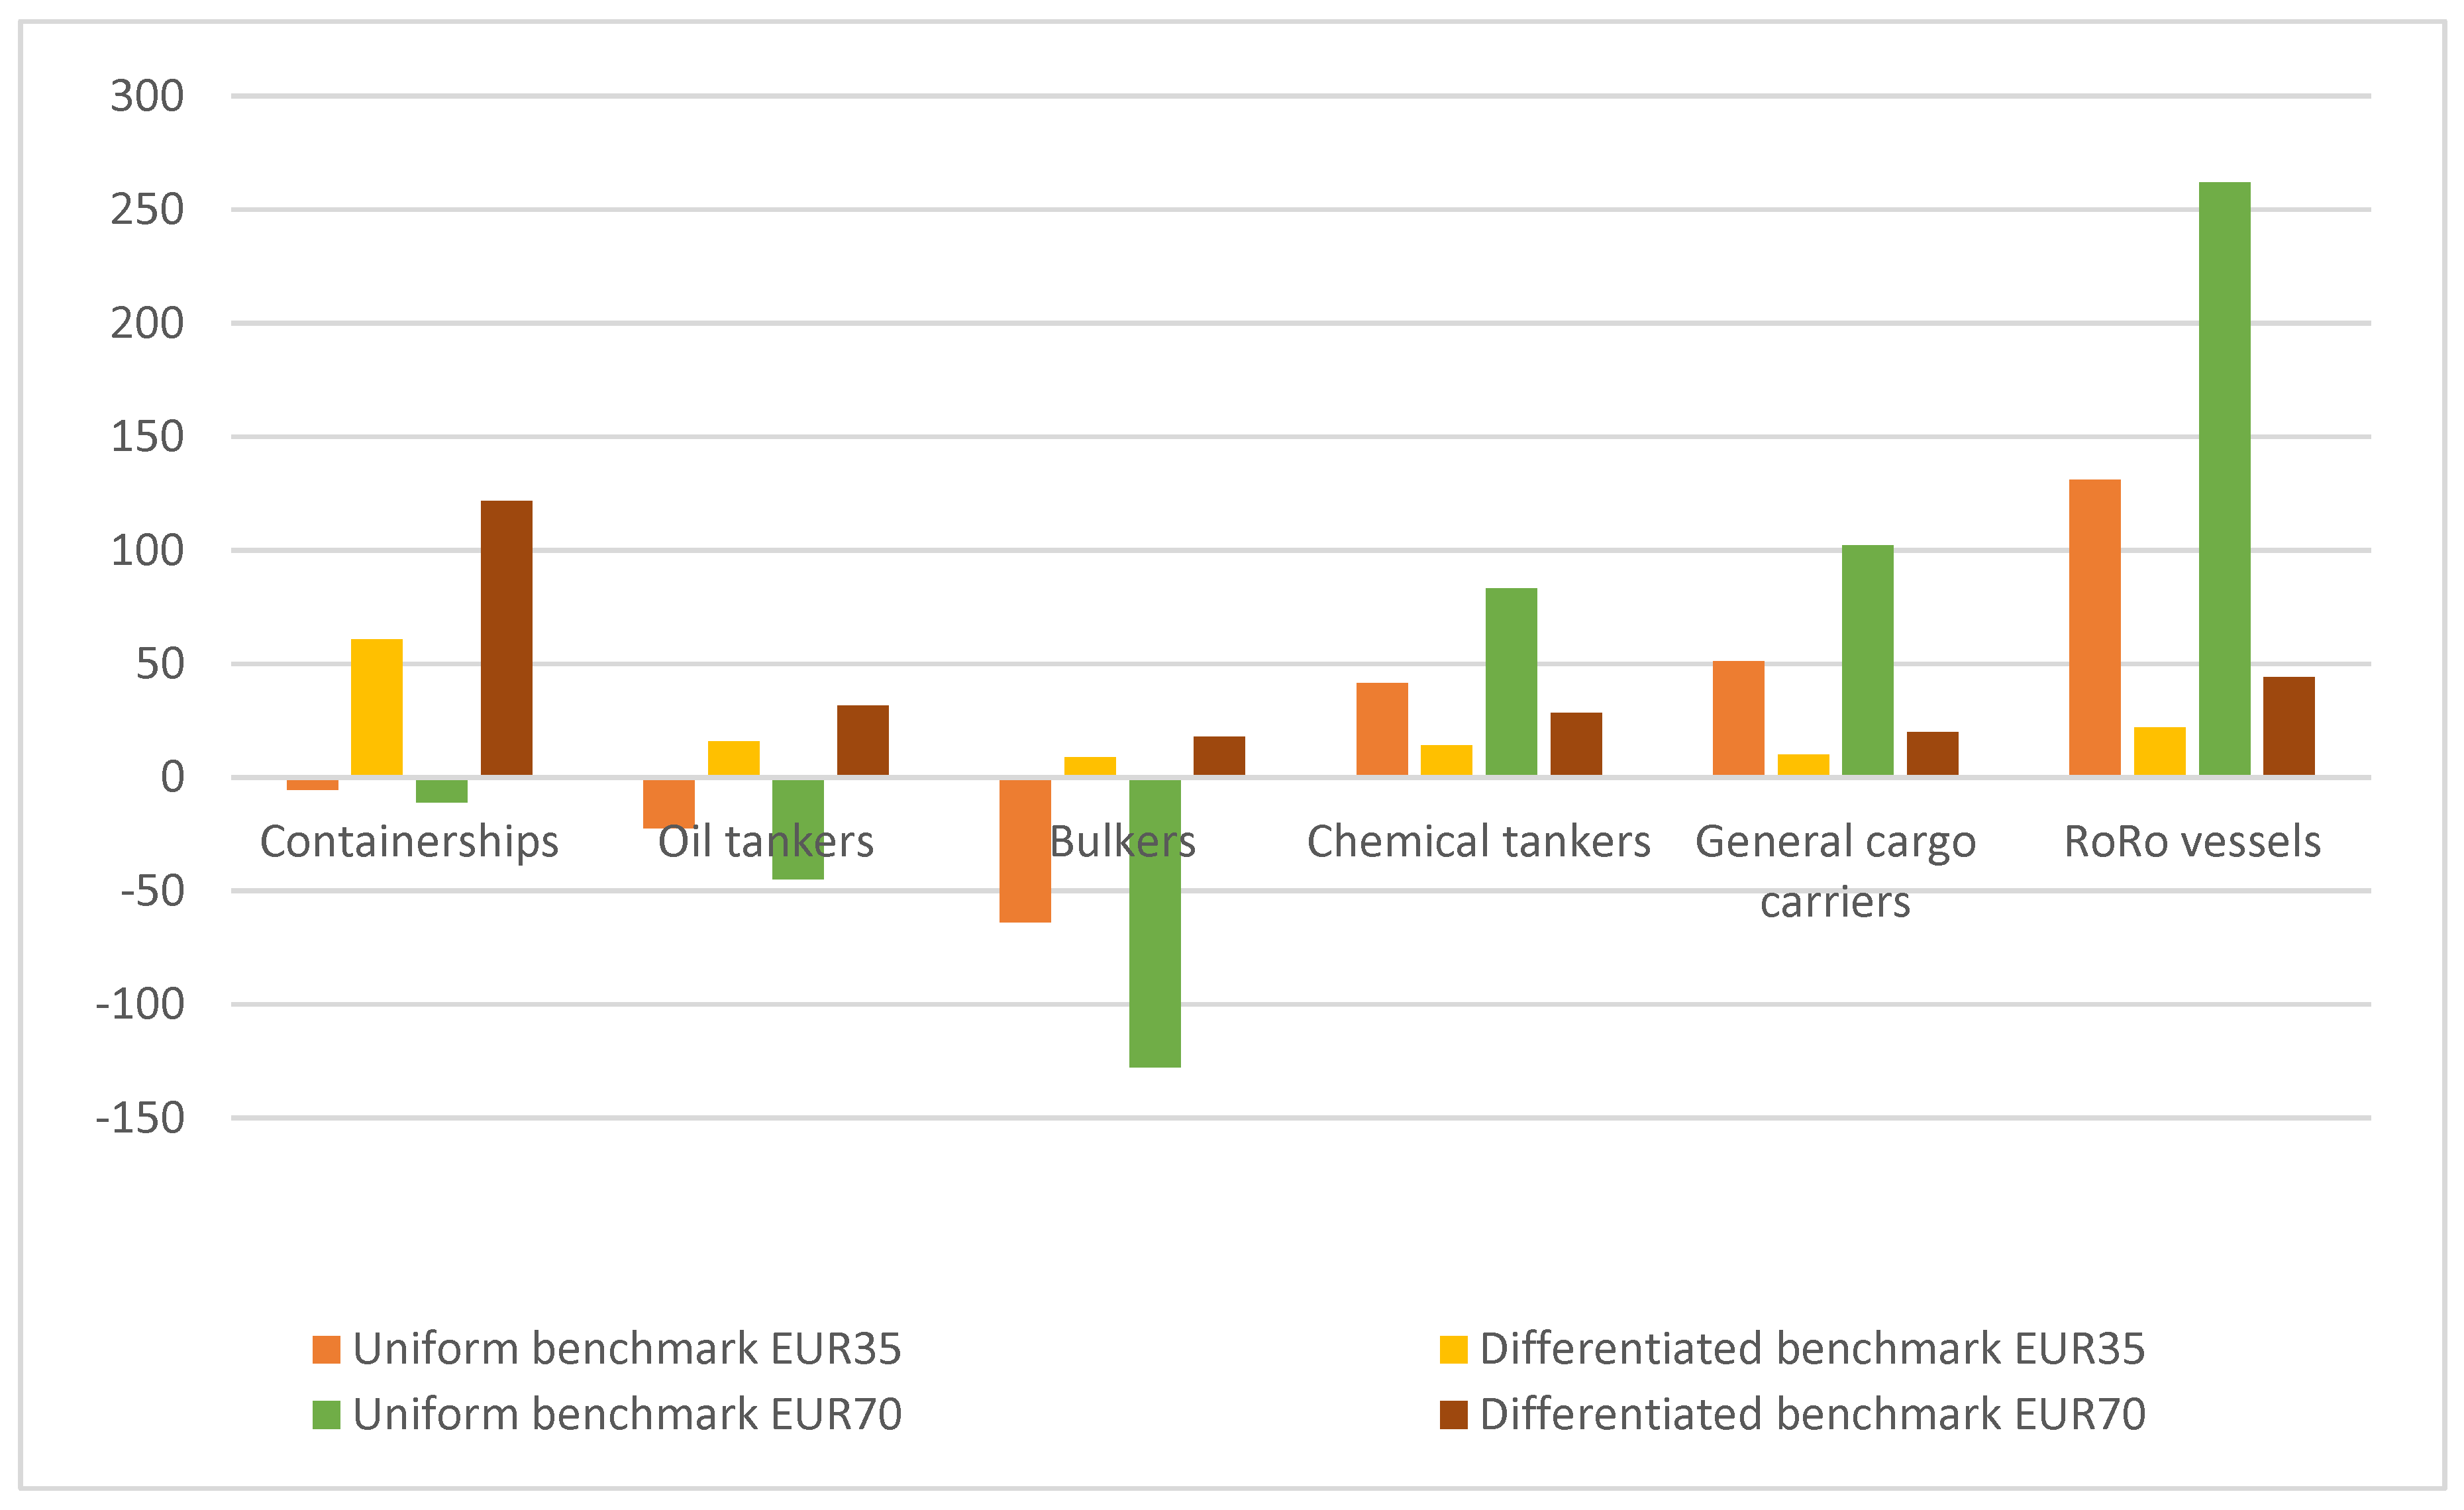
In case only intra EU voyages are included in the EU-ETS and 85% of emission allowances were free-allocated on the basis of a uniform benchmark, the cost increase for the deep sea segments (containerships, oil tankers and bunkers) would be negative as surplus allowances would be allocated in these segments in relation to their transport work. The surplus allowances for containerships would range from 5 to 11 million euros, for oil tankers from 22 to 45 million euros, while bulkers would acquire the larger amount of surplus allowances that would reach up to 128 million euros. The economic impact from the establishment of a uniform benchmark would remain, though, extremely high for the RoRo segment that would face a cost increase up to 262 million euros (Figure 8).
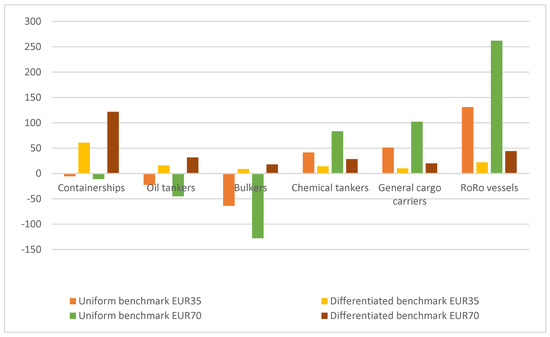
Figure 8.
Cost increase per maritime segment assuming a uniform/differentiated benchmark and the inclusion of only internal EU voyages, expressed in MEUR. Source: Created by the authors.
Our results suggest that shipping companies will be directly affected from the inclusion of shipping in the EU-ETS, as their operational costs will increase by the additional CO2 cost in terms of acquiring adequate emission allowances for their operations. As Faber et al. (2009) [46] suggest, the additional cost of emission allowances will incentivise investments in clean technologies and fuels, only when the shipping companies cannot pass on this cost to the shippers; when the demand exceeds the supply of shipping services and freight rates are not determined by the marginal operational costs of the shipping companies, but the marginal benefits of the shippers. In the opposite case, the increased freight rates due to the additional CO2 cost can affect the demand for shipping services, especially the short sea shipping segments that face competition from other transport modes and have high elasticity of demand.
5. Discussion
The proposal from the European Commission to extend the EU-ETS to include shipping has been the result of not including maritime GHG emissions in any international climate agreement under the UNFCCC, neither reaching an agreement for adopting a MBM for the reduction of GHG emissions at global level. As suggested by Winebrake and Corbett [27], the suitability and successful implementation of any economic mechanism, in our case an emission trading scheme, depends on the particular features of the industrial sector of application. The suitability of an ETS for international shipping has been supported by Shi and Miola et al. [10,37]. They both argued that such a scheme would enable the reconciliation of the UNFCCC ‘common but differentiated responsibilities’ principle and the IMO ‘equal and no more favourable treatment’ principle, as all ships would need to surrender adequate allowances for their emissions, but at the same time the revenues would be channeled through an established fund to developing countries for climate mitigation and adaptation.
The practical challenges for the extension of the EU-ETS to include the shipping industry identified by Kågeson et al. [39], especially in relation to the geographical scope and the emission allowances allocation method, are verified in our study, especially if the heterogeneity of the maritime sector is taken into account. The importance of the geographical scope of a European ETS for the abatement of GHG from shipping highlighted by Hermeling et al. [49] is consistent with our findings. A European ETS for shipping should include all emissions that arise from voyages to and from the EU ports to minimise the risk of carbon leakage, and consequently, increase the environmental effectiveness of the scheme, as already supported by Faber et al. [46]. Our findings suggest that the geographical scope consists a particularly important parameter for deep sea segments (containerships, oil tankers, bulkers, chemical tankers, general cargo carriers), while the economic impact is more or less the same for short sea shipping segments (RoRo and RoPax vessels) irrespective of the geographical scope of the system. This finding is consistent with the fact that the RoRo and RoPax sectors mostly operate within the EEA in contrast to the deep sea segments that are engaged in distant voyages and operations within the EEA consist only the first/last leg of their voyage.
The findings of Wang et al. [17] and Miola et al. [37] that the implementation of a ETS for the abatement of maritime CO2 emissions will have differential impact on the various maritime segments due to their particular characteristics are supported from our results. The less energy-efficient maritime segments (such as RoRo and RoPax) would be penalised in contrast to bulk shipping that would be favoured should a uniform benchmark for the free-allocation of emissions allowances was introduced. As an effective climate policy for the abatement of CO2 emissions from the maritime sector should reward energy efficient shipping operations taking into account the technical and operational features of the various segments, differentiated benchmarks should be established for each segment to ensure their equal treatment and avoid competition distortion among them. Under such a scheme, the shipping companies would have additional incentives to improve their energy efficiency and invest in green technologies to equal the additional cost of emission allowances as suggested by Eide et al. [61]. Given that the EU aims to achieve climate neutrality in Europe till 2050 and assuming a constant increase of the allowances prices, a long-term sustainability strategy needs to be adopted by the shipping companies to enhance their competitiveness following the paradigm of aviation, as suggested by Meleo et al. [45].
6. Conclusions
Throughout this study, we attempted to assess the potential direct costs for the maritime sector from its inclusion in the EU-ETS and highlight the differentiated impact from such a development on different maritime segments by evaluating the impact of different design options. A descriptive statistical analysis of the MRV database was conducted for the estimation of total and average CO2 emissions per maritime segment within the EEA, as this database will probably consist the basis for the inclusion of shipping in the EU-ETS. A sensitivity analysis was employed to analyse the economic impact on the maritime sector under different scenarios in relation to the geographical scope of the scheme, the emission allowance price and the allowances allocation methodology.
According to our findings, in case the emission allowances were fully auctioned or partially free allocated on the basis of a uniform benchmark, the increased costs would be disproportional among the maritime segments. Such a scheme would penalise RoRo and RoPax segments due their high fuel consumption per transport work as the allowances would be allocated in relation to fuel type and consumption. Another implication for these segments comes from their high elasticity of demand and their competition with other transport modes; increased freight rates for these segments could result in a modal shift from sea to land-based modes of transport. The establishment of differentiated benchmarks for the allocation of emission allowances per segment seems to be a prerequisite for the effective inclusion of shipping in the EU-ETS that will reward energy efficient vessels in each segment and avoid competition distortion within the maritime industry. Under such a scenario, the ship operators would have additional incentives to invest in energy-efficient technical and operational measures and alternative or renewable fuels due to the potential generated profits from their surplus emission allowances.
Given the fact that the discussion of the European Commission (EC) on the extension of the EU-ETS to cover CO2 emissions from the maritime sector is planned for July 2021 and the design features of the potential inclusion of maritime transport GHG emissions in the EU-ETS remain unclear for the moment, our results bring valuable insights on the impact of different design options on the shipping sector as a whole, but also on different maritime segments. In this way, our findings can provide significant inputs to relevant policy-makers and contribute to the upcoming decision-making process. Price incentive, geographical scope of the system and emission allowances allocation method are parameters identified to play a significant role for the effective inclusion of shipping in the EU-ETS, being, at the same time, impactful to cost increases for the maritime industry.
A major limitation of this research is that it does not take into account the size of the vessels that is another determinant factor of their energy efficiency irrespective of their vessel category. Larger vessels are more energy efficient than smaller ones and the adoption of a uniform benchmark for the free allocation of emission allowances would penalize smaller vessels in favour of the larger ones in all segments.
Future research needs to be conducted in relation to the potential response of the maritime stakeholders to the additional cost from the inclusion of shipping in the EU-ETS. Qualitative analysis including in-depth interviews with shipping companies could provide additional input and shed light on the practices and overall strategies of individual maritime actors to respond to this challenge and manage the upcoming effects. Another parameter that needs to be further investigated is the potential for a modal shift from short sea shipping to land-based modes of transport due to the increased transport cost of these services from the inclusion of the CO2 emissions cost. Short sea shipping segments have high elasticity of demand and face strong competition from other transport modes and the modal split implications from their increased cost needs to be further examined, as this would lead to undesirable effects in relation to the overall EU transport strategies.
Supplementary Materials
The R code file used for the statistical analysis of the MRV database can be found here https://github.com/athasim/mrv_data_eu_ETS_shipping.
Author Contributions
Conceptualization, A.C., D.D. and A.I.Ö.; methodology, A.C.; validation, D.D. and A.I.Ö.; data curation, A.C.; writing—original draft preparation, A.C.; writing—review and editing, A.C., D.D., A.I.Ö. and P.G.M.; visualization, A.C., D.D., A.I.Ö. and P.G.M.; supervision, A.I.Ö. and D.D. All authors have read and agreed to the published version of the manuscript.
Funding
This research was funded by the Swedish Transport Administration (Trafikverket) and is part of the ‘EU Emission Trading System—impacts of including maritime transports’ project (grant number TRV 2020/25878).
Institutional Review Board Statement
Not applicable.
Informed Consent Statement
Not applicable.
Data Availability Statement
Publicly available datasets were analyzed in this study. This data can be found here: https://mrv.emsa.europa.eu/api/public-emission-report/reporting-period-document/binary/2019 (accessed on 10 October 2020).
Acknowledgments
This work was supported by the Swedish Transport Administration (Trafikverket). We would like to thank Athanasios Simoulis, researcher at Lund University, for his valuable input at the statistical analysis of the MRV database. The authors are grateful to three anonymous referees for very helpful feedback on an earlier version of the paper.
Conflicts of Interest
The authors declare no conflict of interest. The funders had no role in the design of the study; in the collection, analyses, or interpretation of data; in the writing of the manuscript, or in the decision to publish the results.
References
- Smith, T.; Jalkanen, J.; Anderson, B.; Corbett, J.; Faber, J.; Hanayama, S.; O’Keefe, E.; Parker, S.; Johansson, L.; Aldous, L. Third IMO GHG Study 2014; International Maritime Organization (IMO): London, UK, 2014. [Google Scholar]
- Ölçer, A.I.; Kitada, M.; Dalaklis, D.; Ballini, F. (Eds.) Trends and Challenges in Maritime Energy Management; WMU Studies in Maritime Affairs; Springer International Publishing: Cham, Switzerland, 2018; ISBN 978-3-319-74575-6. [Google Scholar]
- Christodoulou, A. Maritime Environmental Performance Indices: Useful Tools for Evaluating Transport Supplier Environmental Performance? In Proceedings of the 27th International Conference on Urban and Maritime Transport and the Environment, Rome, Italy, 19 November 2019; pp. 187–198. [Google Scholar]
- Mepc, R. 2016 Guidelines for the Development of a Ship Energy Efficiency Management Plan (SEEMP); International Maritime Organization (IMO): London, UK, 2012; Volume 2. [Google Scholar]
- Mepc, I.R. 304 Initial IMO Strategy on Reduction of GHG Emissions from Ships; MEPC: London, UK, 2018. [Google Scholar]
- UNFCCC. Adoption of the Paris Agreement’, fccc/cp/2015/L 9; UNFCCC: New York, NY, USA, 2015; Volume 9. [Google Scholar]
- Psaraftis, H.N. Market-Based Measures for Greenhouse Gas Emissions from Ships: A Review. WMU J. Marit. Aff. 2012, 11, 211–232. [Google Scholar] [CrossRef] [Green Version]
- Nikolakaki, G. Economic Incentives for Maritime Shipping Relating to Climate Protection. WMU J. Marit. Aff. 2013, 12, 17–39. [Google Scholar] [CrossRef] [Green Version]
- Bouman, E.A.; Lindstad, E.; Rialland, A.I.; Strømman, A.H. State-of-the-Art Technologies, Measures, and Potential for Reducing GHG Emissions from Shipping—A Review. Transp. Res. Part Transp. Environ. 2017, 52, 408–421. [Google Scholar] [CrossRef]
- Shi, Y. Reducing Greenhouse Gas Emissions from International Shipping: Is It Time to Consider Market-Based Measures? Mar. Policy 2016, 64, 123–134. [Google Scholar] [CrossRef]
- Kosmas, V.; Acciaro, M. Bunker Levy Schemes for Greenhouse Gas (GHG) Emission Reduction in International Shipping. Transp. Res. Part Transp. Environ. 2017, 57, 195–206. [Google Scholar] [CrossRef]
- European Parliament. Directive (EU) 2018/410 of the European Parliament and of the Council of 14 March 2018 Amending Directive 2003/87. EC Enhance Cost Eff. Emiss. Reduct. Low-Carbon Invest. 2018, L76, 3–27. [Google Scholar]
- Economic and Financial Crimes Commission. The European Green Deal; 2019. Available online: https://ec.europa.eu/info/sites/default/files/european-green-deal-communication_en.pdf (accessed on 8 February 2021).
- Egenhofer, C.; Marcu, A.; Georgiev, A. Reviewing the EU ETS Review? CEPS Task Force Rep. 2012, 2012, 37. [Google Scholar]
- Perino, G.; Willner, M. EU-ETS Phase IV: Allowance Prices, Design Choices and the Market Stability Reserve. Clim. Policy 2017, 17, 936–946. [Google Scholar] [CrossRef]
- Sachweh, C.; Larkin, J.; Winkel, R.; Deman, J.; McEwen, B.; Peddie-Burch, C.; Turtle, G.; Williams, K. Maritime Transport Greenhouse Gas Data Collection and Management: MRV Procedures; 2014. Available online: https://ec.europa.eu/clima/sites/clima/files/transport/shipping/docs/maritime_mrav_report_en.pdf (accessed on 8 March 2021).
- Wang, K.; Fu, X.; Luo, M. Modeling the Impacts of Alternative Emission Trading Schemes on International Shipping. Transp. Res. Part Policy Pract. 2015, 77, 35–49. [Google Scholar] [CrossRef] [Green Version]
- Meckling, J.; Hepburn, C. Economic Instruments for Climate Change. Handb. Glob. Clim. Environ. Policy 2013, 468–485. [Google Scholar]
- Mendes, L.M.; Santos, G. Using Economic Instruments to Address Emissions from Air Transport in the European Union. Environ. Plan. A 2008, 40, 189–209. [Google Scholar] [CrossRef]
- Stewart, R.B. Models for Environmental Regulation: Central Planning versus Market-Based Approaches. BC Envtl. Aff. Rev. 1991, 19, 547. [Google Scholar]
- Stavins, R.N. Experience with market-based environmental policy instruments. In Handbook of Environmental Economics; Elsevier: Amsterdam, The Netherlands, 2003; Volume 1, pp. 355–435. ISBN 1574-0099. [Google Scholar]
- Tuladhar, S.D.; Mankowski, S.; Bernstein, P. Interaction Effects of Market-Based and Command-and-Control Policies. Energy J. 2014, 35. [Google Scholar] [CrossRef]
- Tietenberg, T.H. Economic Instruments for Environmental Regulation. Oxf. Rev. Econ. Policy 1990, 6, 17–33. [Google Scholar] [CrossRef]
- Barde, J.-P. Economic Instruments in Environmental Policy: Lessons from the OECD Experience and Their Relevance to Developing Economies; OECD: Paris, France, 1994. [Google Scholar]
- Panaiotov, T. Economic Instruments for Environmental Management and Sustainable Development; UNEP: Nairobi, Kenya, 1994. [Google Scholar]
- Blackman, A.; Harrington, W. The Use of Economic Incentives in Developing Countries: Lessons from International Experience with Industrial Air Pollution. J. Environ. Dev. 2000, 9, 5–44. [Google Scholar] [CrossRef] [Green Version]
- Winebrake, J.J.; Corbett, J.J. Improving the Energy Efficiency and Environmental Performance of Goods Movement. Clim. Transp. Solut. 2010, 13, 145–154. [Google Scholar]
- Christodoulou, A.; Dalaklis, D.; Ölcer, A.; Ballini, F. Can Market-Based Measures Stimulate Investments in Green Technologies for the Abatement of GHG Emissions from Shipping? A Review of Proposed Market-Based Measures. Trans. Marit. Sci. 2021, 10. [Google Scholar] [CrossRef]
- Bullock, S.; Mason, J.; Broderick, J.; Larkin, A. Shipping and the Paris Climate Agreement: A Focus on Committed Emissions. BMC Energy 2020, 2, 5. [Google Scholar] [CrossRef]
- Doelle, M.; Chircop, A. Decarbonizing International Shipping: An Appraisal of the IMO’s Initial Strategy. Rev. Eur. Comp. Int. Environ. Law 2019, 28, 268–277. [Google Scholar] [CrossRef]
- Walsh, C.; Lazarou, N.-J.; Traut, M.; Price, J.; Raucci, C.; Sharmina, M.; Agnolucci, P.; Mander, S.; Gilbert, P.; Anderson, K.; et al. Trade and Trade-Offs: Shipping in Changing Climates. Mar. Policy 2019, 106, 103537. [Google Scholar] [CrossRef]
- Christodoulou, A.; Cullinane, K. Potential for, and Drivers of, Private Voluntary Initiatives for the Decarbonisation of Short Sea Shipping: Evidence from a Swedish Ferry Line. Marit. Econ. Logist. 2020. [Google Scholar] [CrossRef]
- Deling, W.; Yuli, C.; Changhai, H.; Liang, C.; Changyue, W. Study on IMO New Requirement: Ship Fuel Oil Consumption Data Collection and Reporting. Am. J. Water Sci. Eng. 2020, 6, 50. [Google Scholar] [CrossRef]
- Lagouvardou, S.; Psaraftis, H.N.; Zis, T. A Literature Survey on Market-Based Measures for the Decarbonization of Shipping. Sustainability 2020, 12, 3953. [Google Scholar] [CrossRef]
- Psaraftis, H.N. Decarbonization of Maritime Transport: To Be or Not to Be? Marit. Econ. Logist. 2018, 1–19. [Google Scholar] [CrossRef]
- Karim, S. Marked-Based Measures for Reduction of GHG Emissions from International Shipping. In Proceedings of the 12th IUCN Academy of Environmental Law Annual Colloquium, Tarragona, Spain, 30 June 2014. [Google Scholar]
- Miola, A.; Marra, M.; Ciuffo, B. Designing a Climate Change Policy for the International Maritime Transport Sector: Market-Based Measures and Technological Options for Global and Regional Policy Actions. Energy Policy 2011, 39, 5490–5498. [Google Scholar] [CrossRef]
- Antrim, L.N. The United Nations Conference on Environment and Development. In The Diplomatic Record 1992–1993; Goodman, A.E., Ed.; Routledge: London, UK, 2019; pp. 189–210. ISBN 978-0-429-31008-9. [Google Scholar]
- Kågeson, P.; Bahlke, C.; Hader, A.; Hübscher, A. Market Based Instruments for Abatement of Emissions from Shipping; Federal Environment Agency: Dessau-Roßlau, Germany, 2008; p. 119. [Google Scholar]
- Christodoulou, A.; Gonzalez-Aregall, M.; Linde, T.; Vierth, I.; Cullinane, K. Targeting the Reduction of Shipping Emissions to Air: A Global Review and Taxonomy of Policies, Incentives and Measures. Marit. Bus. Rev. 2019, 4, 16–30. [Google Scholar] [CrossRef]
- Nikopoulou, Z.; Cullinane, K.; Jensen, A. The Role of a Cap-and-Trade Market in Reducing NOx and SOx Emissions: Prospects and Benefits for Ships within the Northern European ECA. Proc. Inst. Mech. Eng. Part M J. Eng. Marit. Environ. 2013, 227, 136–154. [Google Scholar] [CrossRef]
- Baeuerle, T.; Graichen, J.; Meyer, K.; Seum, S.; Kulessa, M.; Oschinski, M. Integration of Marine Transport into the European Emissions Trading System. Environmental, Economic and Legal Analysis of Different Options; Federal Environment Agency: Dessau-Roßlau, Germany, 2010. [Google Scholar]
- Convery, F.J. Origins and Development of the EU ETS. Environ. Resour. Econ. 2009, 43, 391–412. [Google Scholar] [CrossRef]
- European Parliament. Directive 2008/101/EC of the European Parliament and of the Council of 19 November 2008 Amending Directive 2003/87/EC so as to Include Aviation Activities in the Scheme for Greenhouse Gas Emission Allowance Trading within the Community (Text with EEA Relevance); European Parliament: Brussels, Belgium, 2009. [Google Scholar]
- Meleo, L.; Nava, C.R.; Pozzi, C. Aviation and the Costs of the European Emission Trading Scheme: The Case of Italy. Energy Policy 2016, 88, 138–147. [Google Scholar] [CrossRef]
- Faber, J.; Markowska, A.; Nelissen, D.; Davidson, M.; Eyring, V.; Cionni, I.; Selstad, E.; Kågeson, P.; Lee, D.; Buhaug, Ø.; et al. Technical Support for European Action to Reducing Greenhouse Gas Emissions from International Maritime Transport; CE Delft: Delft, The Netherlands, 2009. [Google Scholar]
- Eide, M.S.; Chryssakis, C.; Endresen, Ø. CO2 Abatement Potential towards 2050 for Shipping, Including Alternative Fuels. Carbon Manag. 2013, 4, 275–289. [Google Scholar] [CrossRef]
- Buhaug, Ø.; Endresen, Ø.C.; Eyring, V.; Faber, J.; Hanayama, S.; Lee, D.S.; Lee, D.; Lindstad, H.; Markowska, A.Z. Second IMO GHG Study 2009. Available online: http://www.imo.org/ (accessed on 9 February 2021).
- Hermeling, C.; Klement, J.H.; Koesler, S.; Köhler, J.; Klement, D. Sailing into a Dilemma: An Economic and Legal Analysis of an EU Trading Scheme for Maritime Emissions. Transp. Res. Part Policy Pract. 2015, 78, 34–53. [Google Scholar] [CrossRef]
- Transport & Environment. Cost-benefit Analysis of policy evasion under a future maritime ETS. 2021. Available online: https://www.transportenvironment.org/sites/te/files/publications/ETS_shipping_study.pdf (accessed on 20 March 2021).
- Faber, J.; Markowska, A.; Eyring, V.; Cionni, I.; Selstad, E. A Global Maritime Emissions Trading System. In Design and Impacts on the Shipping Sector, Countries and Regions; CE Delft: Delft, The Netherlands, 2010. [Google Scholar]
- Real Time Awareness for MRV Data. Available online: https://www.springerprofessional.de/en/real-time-awareness-for-mrv-data/15737302 (accessed on 18 June 2021).
- European Parliament. Regulation (EU) 2015/757 of the European Parliament and of the Council of 29 April 2015 on the Monitoring, Reporting and Verification of Carbon Dioxide Emissions from Maritime Transport, and Amending Directive 2009/16/EC (Text with EEA Relevance); European Parliament: Brussels, Belgium, 2015; Volume 123. [Google Scholar]
- Wickham, H.; Averick, M.; Bryan, J.; Chang, W.; McGowan, L.D.; François, R.; Grolemund, G.; Hayes, A.; Henry, L.; Hester, J.; et al. Welcome to the Tidyverse. J. Open Source Softw. 2019, 4, 1686. [Google Scholar] [CrossRef]
- R Core Team (2020)—European Environment Agency. Available online: https://www.eea.europa.eu/data-and-maps/indicators/oxygen-consuming-substances-in-rivers/r-development-core-team-2006 (accessed on 31 May 2021).
- Saltelli, A. (Ed.) Sensitivity Analysis in Practice: A Guide to Assessing Scientific Models; Wiley: Hoboken, NJ, USA, 2004; ISBN 978-0-470-87093-8. [Google Scholar]
- EUR-Lex—52020DC0562—EN—EUR-Lex. Available online: https://eur-lex.europa.eu/legal-content/EN/TXT/?uri=CELEX:52020DC0562 (accessed on 9 February 2021).
- Christodoulou, A.; Kappelin, H. Determinant Factors for the Development of Maritime Supply Chains: The Case of the Swedish Forest Industry. Case Stud. Transp. Policy 2020, 8, 711–720. [Google Scholar] [CrossRef]
- Christodoulou, A.; Woxenius, J. Sustainable Short Sea Shipping. Sustainability 2019, 11, 2847. [Google Scholar] [CrossRef] [Green Version]
- Naucler, T.; Campbell, W.; Ruijs, J. Carbon Capture and Storage: Assessing the Economics; McKinsey & Company, Climate Change Special Initiative: New York, NY, USA, 2008. [Google Scholar]
- Eide, M.S.; Longva, T.; Hoffmann, P.; Endresen, Ø.; Dalsøren, S.B. Future Cost Scenarios for Reduction of Ship CO2 Emissions. Marit. Policy Manag. 2011, 38, 11–37. [Google Scholar] [CrossRef]


Publisher’s Note: MDPI stays neutral with regard to jurisdictional claims in published maps and institutional affiliations. |
© 2021 by the authors. Licensee MDPI, Basel, Switzerland. This article is an open access article distributed under the terms and conditions of the Creative Commons Attribution (CC BY) license (https://creativecommons.org/licenses/by/4.0/).