1. Introduction
The civil and residential sector is responsible for about 40% of the total final energy consumption and for about 30% of greenhouse gas (GHG) emissions. The major possibilities of reducing the energy consumption lie in non-residential buildings for public use, which are characterized by higher energy intensities (EI) compared to residential ones [
1]. The specific consumption of these buildings is strongly dependent on climate but also on other variables such as the building’s use and the energy systems in place. A lot of scientific contributions have demonstrated this occurrence. In a paper recently published [
2], the authors have shown the significant variability of the energy intensity associated to different public non-residential buildings located in the same city. Comparing the total energy consumption intensity of several large public buildings (such as offices, educational buildings, hotels, shopping malls), the authors evidenced the range of available values from 50 kWh/m
2 per year up to 500 kWh/m
2 per year, and a range from 50 kWh/m
2 up to 200 kWh/m
2 in the case of office and educational buildings. This relevant variability suggests the evidence of an “energy performance gap”, that is due to faults in building design, construction, but, in particular, in the operation stages of the Heating, Ventilation and Air Conditioning (HVAC) systems [
3]. To reduce this problem, improvements both in the building structure and in the energy systems’ management and control are possible [
4], pursued with the aim of energy efficiency enhancement and the integration of renewable energy sources (RES) in the pool of energy systems serving the building. Both these approaches can play a relevant role, as shown in recent papers considering strategic perspectives [
5,
6].
Considering the HVAC system, measures for reducing the energy intensity are correlated both with the systematic use of specific components, like the Heat Pump, and to the optimal control of HVAC systems. Heat pump (HP) systems are considered a strategic technology with which to increase the efficiency of heat generation and the penetration of electricity produced with renewable energy systems in buildings, as was discussed in some recent papers [
7,
8,
9]. Moreover, HPs are considered relevant elements in smart microgrids and nearly Zero Energy Buildings (nZEB), adding flexibility to the system and allowing shifts in energy demand from heat to electricity, as well as from fossil fuels to renewables [
10,
11].
Concerning the problem of management and control, it has been estimated that about 90% of the Heating, Ventilation and Air Conditioning are not operated optimally [
12]. In fact, while the single components are carefully controlled to satisfy the building demands, a supervisory control able to provide the optimal solution has still not been developed on a full-scale [
13]. The development of supervisory control of HVAC systems could lead to the possibility of both reducing the energy consumption and improving occupants’ comfort. Supervisory control could shift the HVAC operation from the simple pursuit of acceptable environmental conditions, considered as constraints as in technical standards, to an accurate consideration of all the targets involved. For example, in [
14], the authors of this paper achieved an improvement of 25% in terms of the occupants’ comfort, while simultaneously reducing the building ideal energy demand up to 30% by optimizing ambient air setpoints in an academic building.
The development of advanced Building Energy Management Systems (BEMS), available thanks to the widespread use of smart metering systems and pieces of equipment able to modulate their output without degrading their performance, is leading buildings into a transition phase in which they can interact with occupants, with other buildings, and with a grid [
15,
16].
Another possibility of obtaining supervisory control is represented by Model Predictive Control (MPC), which is based on the selection of an optimal time sequence of operation [
17,
18,
19,
20]. The advantages that can be obtained with this technology are directly dependent on the test case they are applied to, and especially on the type of control they are compared to. In [
18], the authors provided possible reduction in energy usage between 30% and 80%, while in [
19] the authors provided energy savings up to 75%.
Moreover, the development of supervisory control is paramount when considering the integration of RES in the HVAC system. On one side, it can help to successfully manage the different energy sources of the building and, on the other, it can provide the optimal operation of storages, thanks to evaluations made on future predictions. These elements can both be seen in the operation of electrically driven HP, which have been identified as one of the favored technical solutions, in combination with photovoltaics (PV), to obtain all-electric solutions [
21] and achieve the feature of nearly-Zero Energy Buildings [
22]. In fact, the combination with PVs requires an accurate selection of the energy source favoring renewable electricity when available, to reduce costs and environmental impact connected to the energy use, while the presence of thermal storages requires an accurate prediction of energy demands. Thus, thanks to an advanced control, these machines are expected to become fundamental in future HVAC systems [
23].
The aim of this paper was both to highlight the gap in the current operation of HVACs and to analyze the energy savings that can be achieved in the field of large-scale, non-residential buildings, with a shift from fossil fuel-based technologies to the application of HVAC systems based on a systematic use of HPs. The study focused both on measures which do not require supervisory control and that are already available on the market, but are not sufficiently implemented on the field, such as Demand-Controlled Ventilation (DCV), as in [
24], and on opportunities given from a supervisory control, as an energy-aware control of the heat recovery (HR) equipment or the optimal control of the heat pump and chiller supply water temperature. The methodology was applied to a test case represented by an educational building in Pisa, Italy.
The novelty of this study is that of emphasizing a hierarchy in the importance of the various measures that can be applied to HVAC systems to improve their overall performance in addition to highlighting that the main energy savings can be achieved with the use of low-complexity and at-hand interventions, represented especially by the use of HPs.
2. Energy Intensity of Large-Scale Public Buildings: The Perspectives of the Use of HVAC with HP
In a recent paper [
2], the authors presented a method to evaluate building energy consumption based on an energy use index of different functional sectors in China. The study testified that the average value of buildings for public use is in general quite high, but the relevant spread among similar structures demonstrates how it could be possible to pursue relevant reduction of energy consumption.
Considering the large-scale public buildings, in general, the relevant part of energy consumption is connected to the lighting systems, to the various electricity loads, but in particular, to the operation of the HVAC system, used for maintaining adequate internal conditions inside buildings. HVAC systems, developed in various layouts, involve many components that can be arranged in several ways, obtaining different configurations [
25]. In general, five different processes can be considered to achieve all the air-conditioning services [
26], namely heating, cooling, humidifying, dehumidifying, and ventilation [
27].
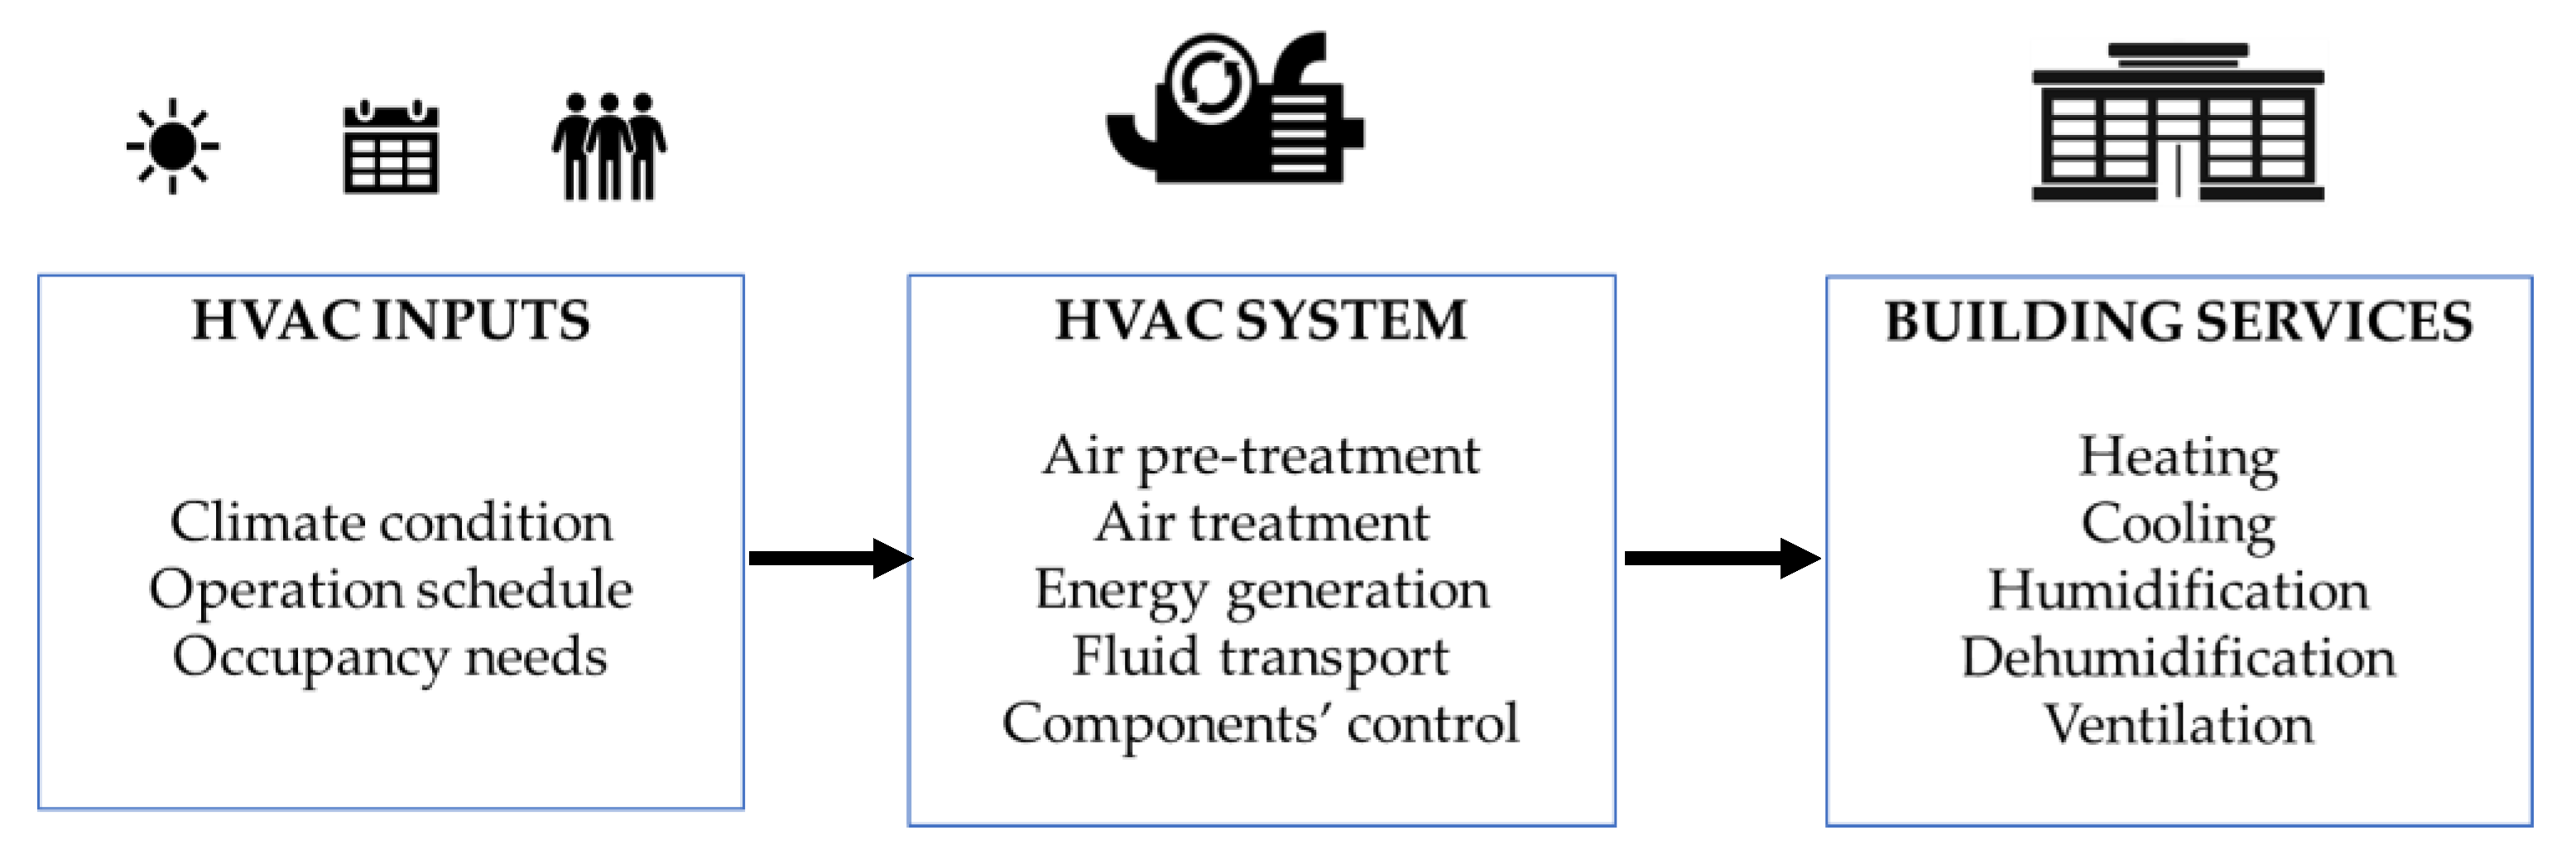
To realize these processes, typical HVAC systems can be thought of as divided in five different sections, shown in
Figure 1, which in turn can be divided in localized and non-localized sections. The pre-treatment, the treatment, and the generation sections belong to the former type, and can therefore be represented showing their interconnections; the transport and the control section belong to the latter type, as they rather represent functional sections.
At the beginning, the incoming air is sent in the pre-treatment section, in which energy recovery measures and mixing with exhaust air are obtained. Later, in the treatment section, air is processed until it reaches the desired supply conditions; then, the generation section is present. The transport and the control section are also present in the HVAC system.
The pre-treatment section is represented by two different elements, in which the interaction between outdoor air and exhaust air occurs: energy recovery and mixing. Energy recovery is recommended by technical standards [
28], with the aim of reducing energy consumption. Many technologies have been developed for this purpose, such as sensible or total energy recovery and active or passive techniques [
29]. Plate heat exchangers, rotary wheels, heat pipes, and run-around loops can be used.
In the treatment section, a series of transformations occur. These transformations can include pre-heating, cooling and dehumidifying, humidifying, and re-heating, and are usually performed by means of coils and humidifiers.
The generation section, which is a relevant part, can be characterized by different devices, such as, in general, a boiler for heating and a chiller for cooling. However, as stated above, electric HP are gaining attention for their improved performance compared to classical generation systems and their possible integration with RES as PV systems. The transport section consists of all the fans, pumps, ducts, dampers, and loops which allow the movement of the fluids present in the plant. The control section consists of all the devices with the function of equipment regulation, namely sensors, controllers, and actuators.
2.1. Heat Pump Potentialities for HVAC Generation Section and Real Operation
One of the main advances regarding the generation section of HVAC systems proposed in the present paper was represented by a systematic use of HPs. The use of this technology is considered today a very efficient way for increasing energy efficiency, but if, and only if, they are properly sized and operated. The HP system performance can be highly reduced under many circumstances, such as high temperature lift, defrost operation, partial loads, and frequent on-off cycles. These conditions often occur when the HP must match variable heating demands in response to the building thermal dynamics.
Considering the coefficient of performance (COP), four different indexes can be defined to take into account and compare the different operational modes of the same HP systems:
, or nominal full-load COP, provided by the HP manufacturer at the reference sources temperature, according with technical standards (e.g., [
30]).
, the full-load performances provided by the manufacturer at the different external and supply temperatures provided by [
30,
31]. The data are marked with the subscript DC and are evaluated at maximum compressor speed.
, or the HP operative part-load COP, experimentally measured or simulated through a validated HP model. This index accounts for both external and supply temperatures, together with the effects of the capacity control.
, or the HP overall system performance, calculated as the ratio between the heat provided to the building by the emission system, , and the electric input used by the HP, . This value considers HP performances and all the thermal losses in the other pieces of equipment (e.g., pipework, thermal inertial storages, or puffers).
The just-mentioned indexes refer to the instantaneous thermal or electrical power exchanged by the HP unit or system. In general, it seems to be particularly interesting to analyze their average value over a reference period,
(e.g., a month, a year, a season). Some of the most common time-integral coefficients of performance are the seasonal coefficient of performance
SCOP and the capacity ratio. The seasonal coefficient of performance,
, is defined as the ratio between the thermal energy output and the electrical energy input of the
HP device (
) over the considered operational time,
.
The capacity ratio, defined as
CR, is a parameter that allows the analysis of the real operation of the
HP unit or system. It can be evaluated according to the delivered heat,
, and the maximum available energy output at nominal full-load power at the given external and supply temperatures over the considered time (off periods included):
According to the above-mentioned technical standards, it is possible to evaluate a penalization factor, , as a function of and its capacity control system, that assumes values in the range between 0 and 1. This penalization factor should be applied to the full-load at the specific external and supply temperatures to obtain the operative part-load .
2.2. HVAC Control System
Due to the high number of elements present in the HVAC system, HVAC control plays a very important role by coordinating the operation of the elements in the different sections, primarily with the aim of satisfying the building demands, but also to do that in an efficient way if a supervisory control is applied [
32].
Three main categories of variables are involved in HVAC control: Firstly, the conditioned space variables; Secondly, the weather and occupancy variables; Finally, the operational variables. The monitored conditioned space variables can be the internal temperature, relative humidity, and pollutants’ concentration, usually represented by carbon dioxide concentration; the monitored weather and occupancy variables can be the external temperature and relative humidity, solar irradiance, and number of occupants; the monitored operational variables can be flow rates, fluid temperatures and pressures, and components’ state. The conditioned space variables represent the objective of control, the operational variables represent the controlled variables, and the weather and occupancy variables represent the disturbances. A detailed consideration of these disturbances can help to determine the operational variables able to satisfy the objective of control at the minimum cost possible.
3. HVAC with HP for Large-Scale Buildings: Modelling of the Real Operation and Optimized Control Strategy
The objective of this analysis was to evaluate the positive effects on the overall energy efficiency of the building that can be obtained by using a HVAC system with HPs and an optimal control of the HVAC system operation through a real-time control of real occupation of the building.
The control practices that were developed represented both the best available techniques and at-hand techniques that have still not been implemented in real systems but that could lead to a significant increase in the building energy efficiency at minimal complexity and cost. The techniques proposed were the demand-controlled ventilation, an energy-aware control of the energy recovery system, and a control of the HP and chiller supply water temperature.
The first measure aimed to introduce the energy perspective when dealing with indoor air quality (IAQ) and works by minimizing outdoor air flow rate when not justified by IAQ requirements. The second measure works by selecting the best configuration for the use of the heat recovery based on an energy-based criterion. It points out the importance of a supervisory control able to select the best working state of some of the components involved based on performance of the overall system. Finally, the third measure works by adapting the operating temperature of the generation section to reduce energy consumption. The above-mentioned measures only represent some of the possibilities that can be obtained with supervisory control. This also highlights the complexity of developing a comprehensive supervisory control. In fact, since the number of components and interactions among them are very high, it is common practice to apply it only to some elements.
All the measures proposed were applied in cascade to a Variable Air Volume (VAV) system, representing the energy savings that can be achieved with an increased complexity of the HVAC control system. Moreover, all the Control Strategies (CS) were compared to a Constant Air Volume (CAV) system to show the improvements that have already been achieved with the implementation of VAV systems. The strategies analyzed are summarized in
Table 1. Strategy CS 1 represents an outdated configuration based on a CAV system; CS 2, considered as a benchmark for its wide spreading, involves the use of a VAV system; CS 3 adds DCV for the outdoor flow rate; CS 4 adds an energy-aware controller for the pre-treatment section to CS 3; CS 5 adds an exact supply water temperature control of the generation section to CS 4.
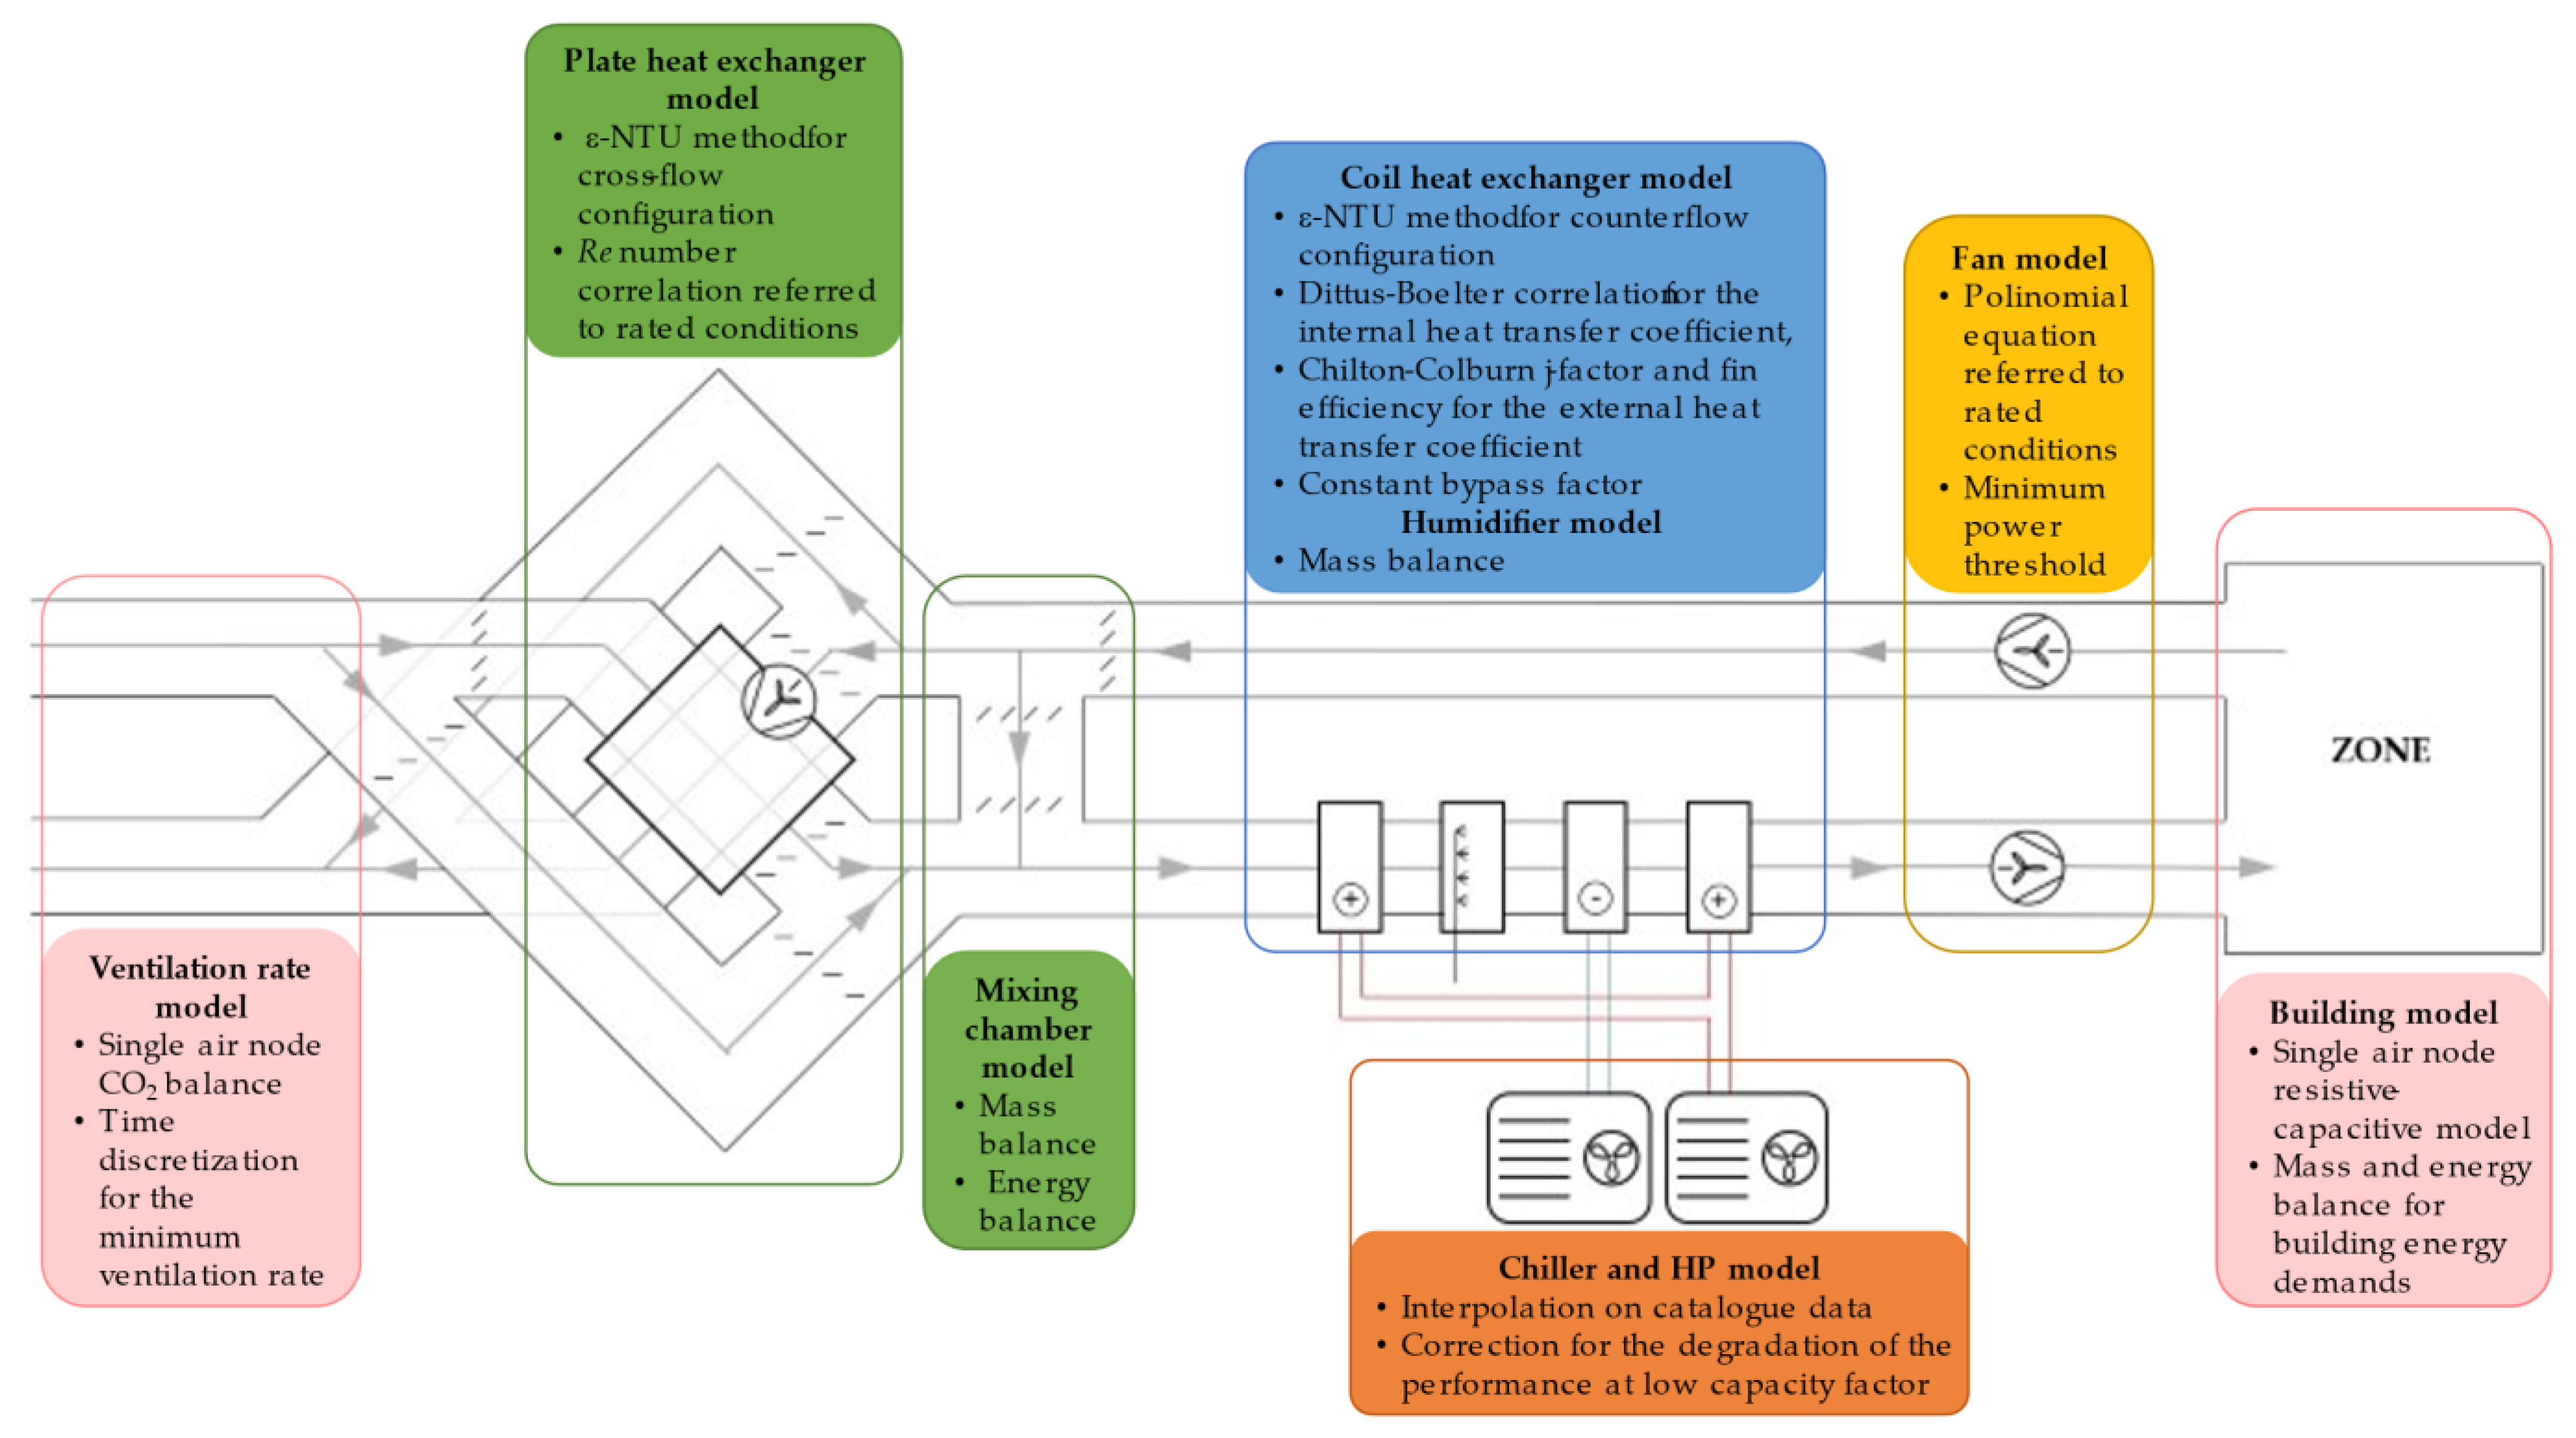
In order to evaluate the real advantages in terms of energy saving obtainable in a specific application, the methodology proposed has been traduced in a mathematical model in which both the building under analysis and the HVAC, with all the components involved, were considered. The simulation was carried out using physically based models [
33]. The components’ models were complex enough to represent the main phenomena involved and catch the interactions between the different pieces of equipment, but quite simple enough to be able to provide insights on the energy savings [
34].
Concerning the HVAC system layout, the analysis was applied to a single zone VAV system, which represented a step forward compared to the more classical CAV systems. The difference is based on the presence of variable speed drive (VSD) fans able to reduce the airflow, when possible, without degrading their performance. The CAV system nominal flow rate is 35,000 m3/h, and the VAV system flow rate can modulate up to 25% of this value.
The pre-treatment section was equipped with a sensible plate heat exchanger with a nominal flow rate of 17,000 m
3/h and a mixing chamber, which can both be bypassed. The treatment section was equipped with a preheat, a cooling and dehumidification, and a reheat coil, all using water as heat transfer fluid along with an adiabatic humidifier. The generation section was equipped with a chiller serving the cooling and dehumidifying coil, and a HP serving the reheat and preheat coils. Both the chiller and the HP considered were air-to-water machines, meaning that they exchanged with outdoor air on the external side and with a water loop on the internal side. The heat pump size was 310 kW with a nominal COP of 3.2, while the chiller size varied for the different CSs and ranged from 96.9 kW to 190 kW. The transport section had variable speed drive motors for the supply and return fans, each with a nominal input power of 15.5 kW. The system performance was evaluated by means of the integration of the HVAC model with a building model. The building energy demand was calculated based on the setpoints suggested from technical standards, namely 20 °C for heating, 26 °C for cooling, and 1000 ppm for carbon dioxide concentration [
35].
5. Application to Specific Test Cases and Evaluation of Energy Saving Potentialities
In this section, the application of the HVAC control strategies described in
Table 1 and defined in the previous sections are evaluated with reference to a specific test case, an educational building. After a short description of the building, the results achieved are shown by analyzing the estimated values of the overall energy consumptions.
5.1. Test Building: Detailed Description and Main Geometrical Data
The building used for testing the proposed methodology and to evaluate the possible energy demand reduction was an academic building located in Pisa (1694 Heating Degree Days), used by the University of Pisa. The considered building had five levels, a total floor surface of about 1560 m2, and a gross volume of approximately 6200 m3, of which about 4540 m3 were occupied by classrooms. A total number of 12 classrooms were present in the building; the sizes ranged from 18–25 seats (3 classrooms), 36–38 seats (3 classrooms), 65–72 places (3 classrooms), 160 places (2 classrooms) to 180 places (1 classroom).
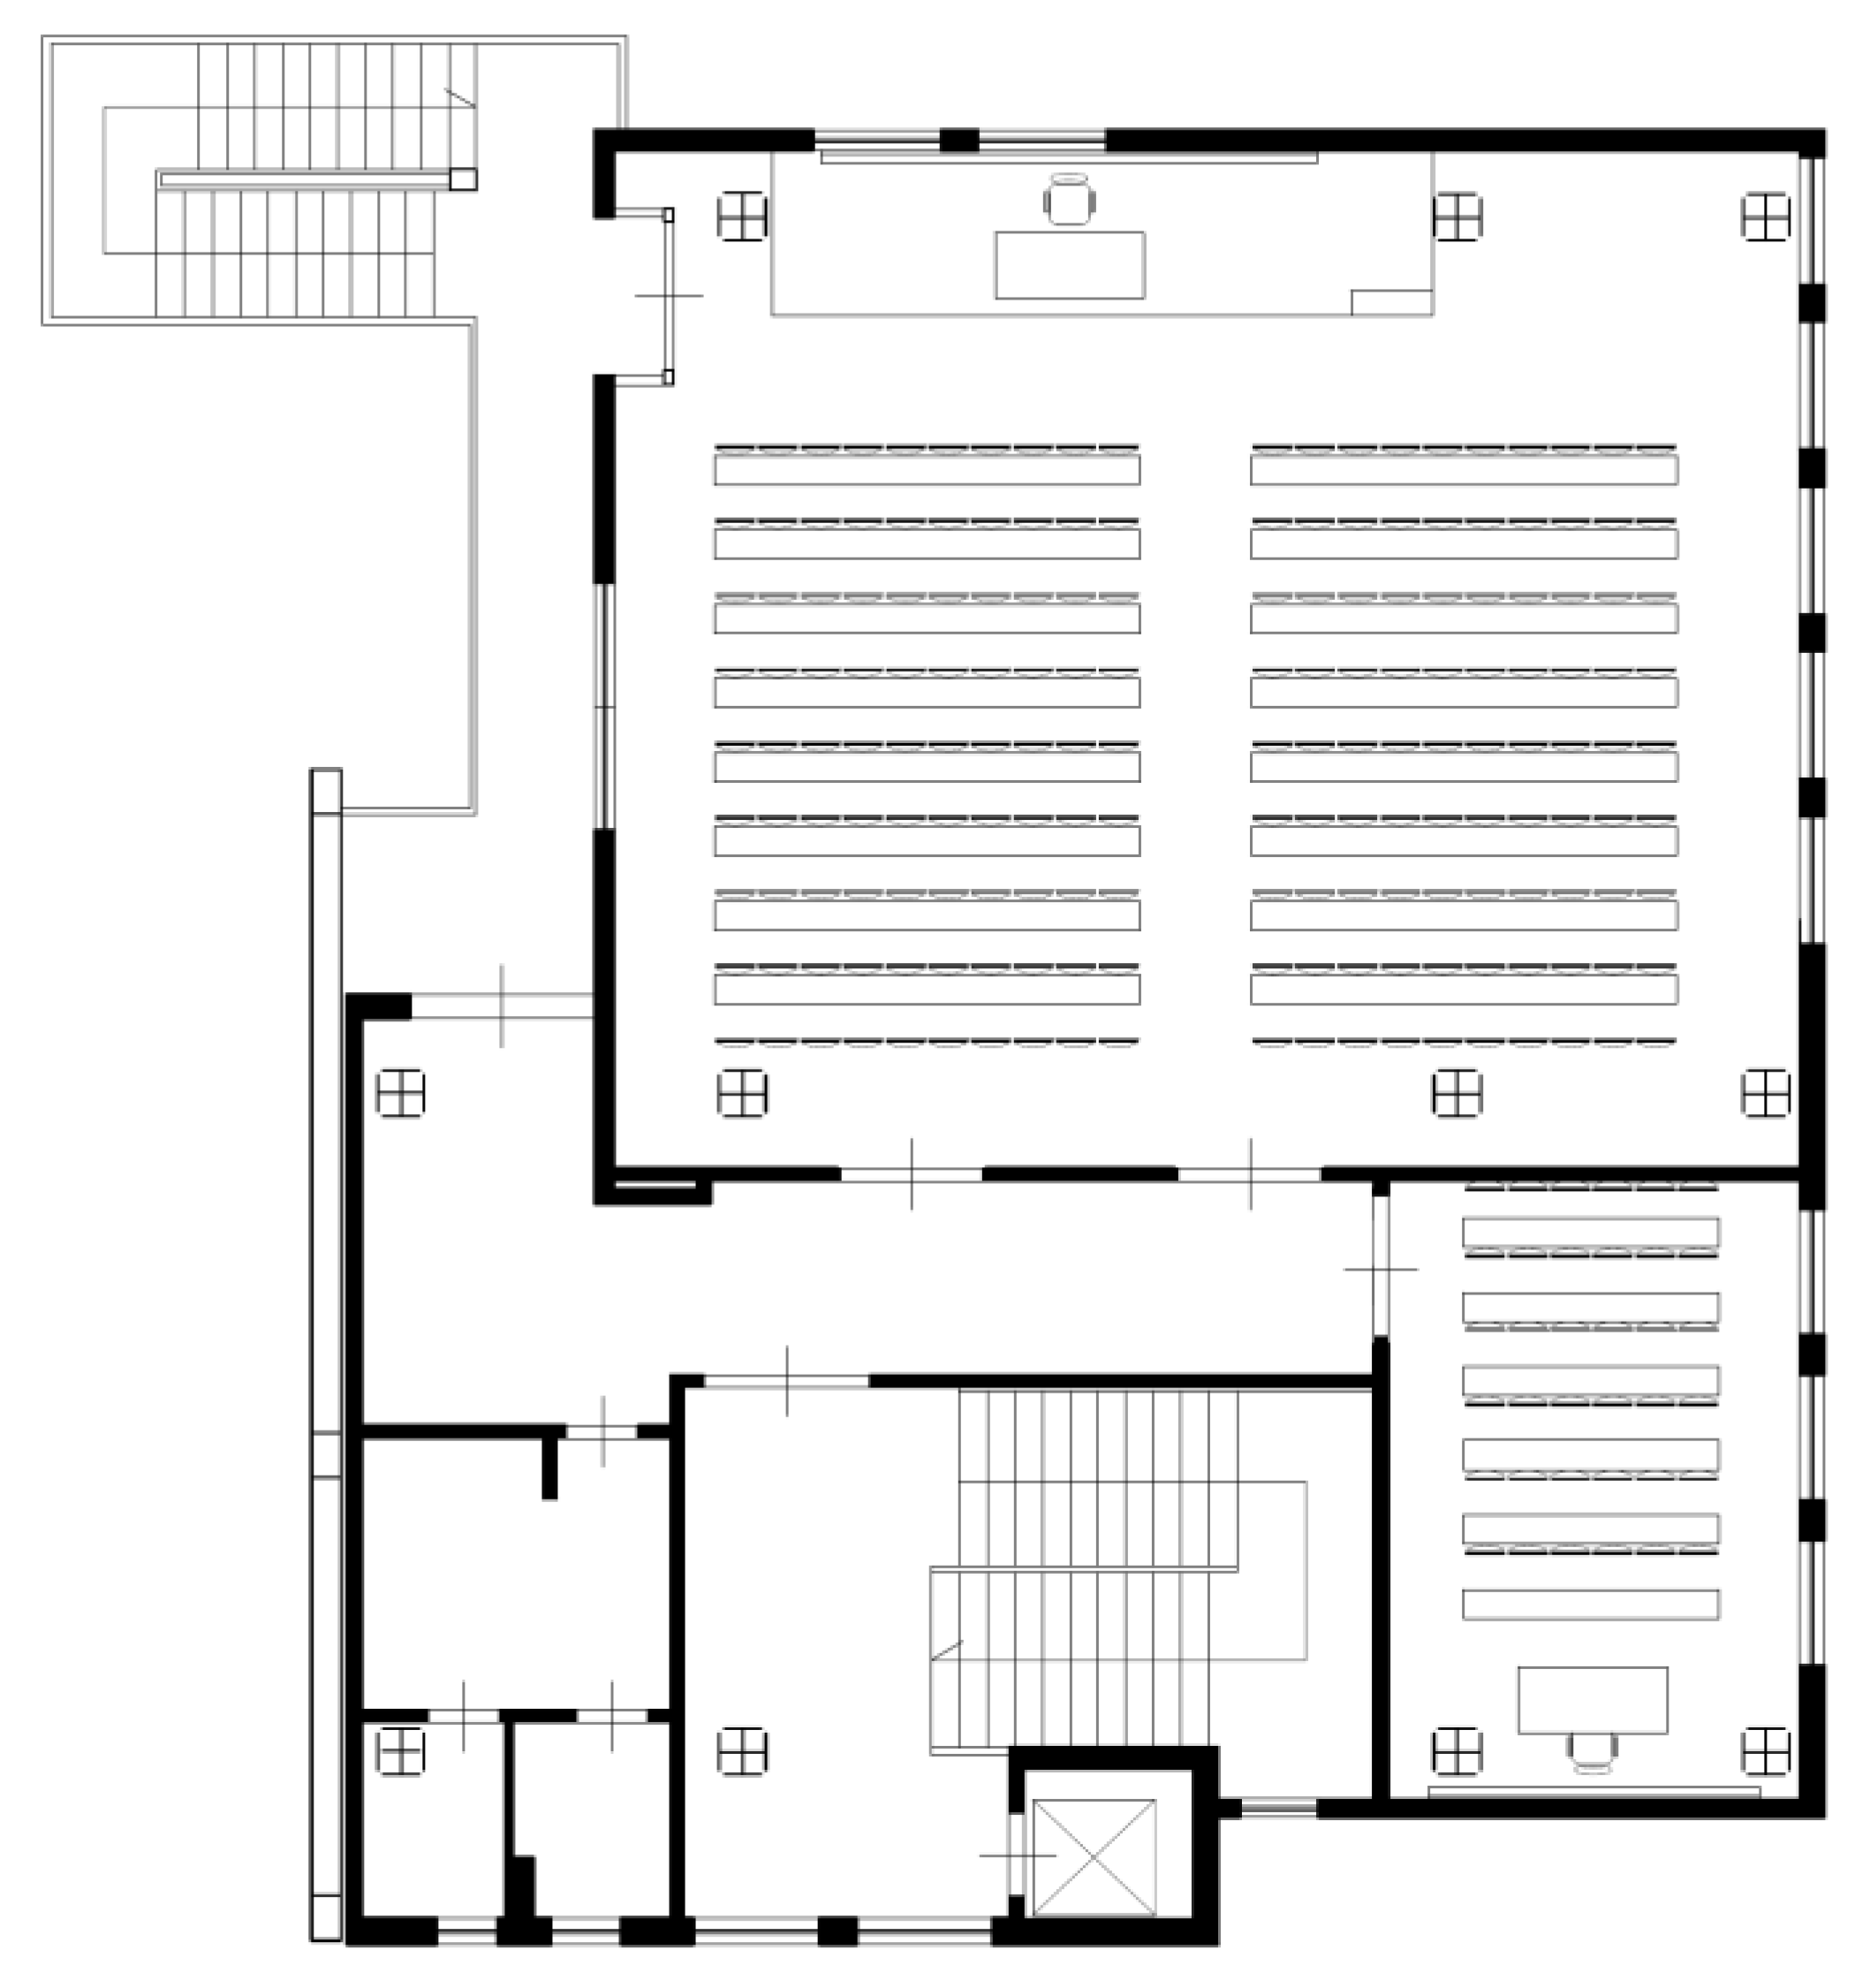
Figure 3 provides the typical layout of one on the five levels, in which two different classrooms can be well identified: one of quite high size and one of the smallest. The external building surface was approximately 2000 m
2 (both opaque and glazed), corresponding to an aspect ratio (surface/volume) of about 0.33 m
−1. The glazed surface represented about 16% of the total surface. The envelope was characterized by stone walls with face bricks and a reinforced concrete structure, which resulted in a total transmittance of about 1.1 m
2K/W, while the windows were double-glazed. At a full occupancy level, the number of students present inside the building was estimated in the number of 878. Concerning the climatic conditions typical of Pisa, which can be derived by common databases available online; for example, in the proposed case, the reference data are presented in
Table 2 and were all derived from a specific database [
41], while solar radiation was obtained from [
42]. Concerning the test case, it has been connected to the typical occupancy level observed before the COVID-19 pandemic experience.
The building was open from 8 a.m. to 8 p.m. during weekdays (Monday to Friday), from 8 a.m. to 1 p.m. on Saturdays, and closed on Sundays. The occupancy of the twelve classrooms was organized in four periods, two trimesters of lessons (March–May and October–December) and three periods of examination (January–February, June–July, and September); these were characterized by different occupancies, with the major ones occurring during the period of lessons. The predicted hourly occupancy was determined, based on the real building schedule, by multiplying classroom capacities, using a reduction coefficient, different for considering period of lessons (1 October to 20 December and 1 March to 30 May) and exams (7 January to 28 February, 1 June to 30 July, and September). The reduction coefficients considered were 0.8 for the period of lessons and 0.5 for the period of examination, respectively. The effective hourly occupancy has been obtained by multiplying the predicted hourly occupancy with a randomization coefficient, obtained by a uniform distribution between 0.5 and 1.
5.2. Overall Energy Saving and Comparison with Fossil Fuel-Based HVAC System
In this subsection, the overall energy saving is presented comparing all the control strategies of the HVAC system obtained considering the five different possibilities described in
Table 2. The comparison with the use of conventional boiler, based on fossil fuel (as natural gas), common in Italy, is evaluated later.
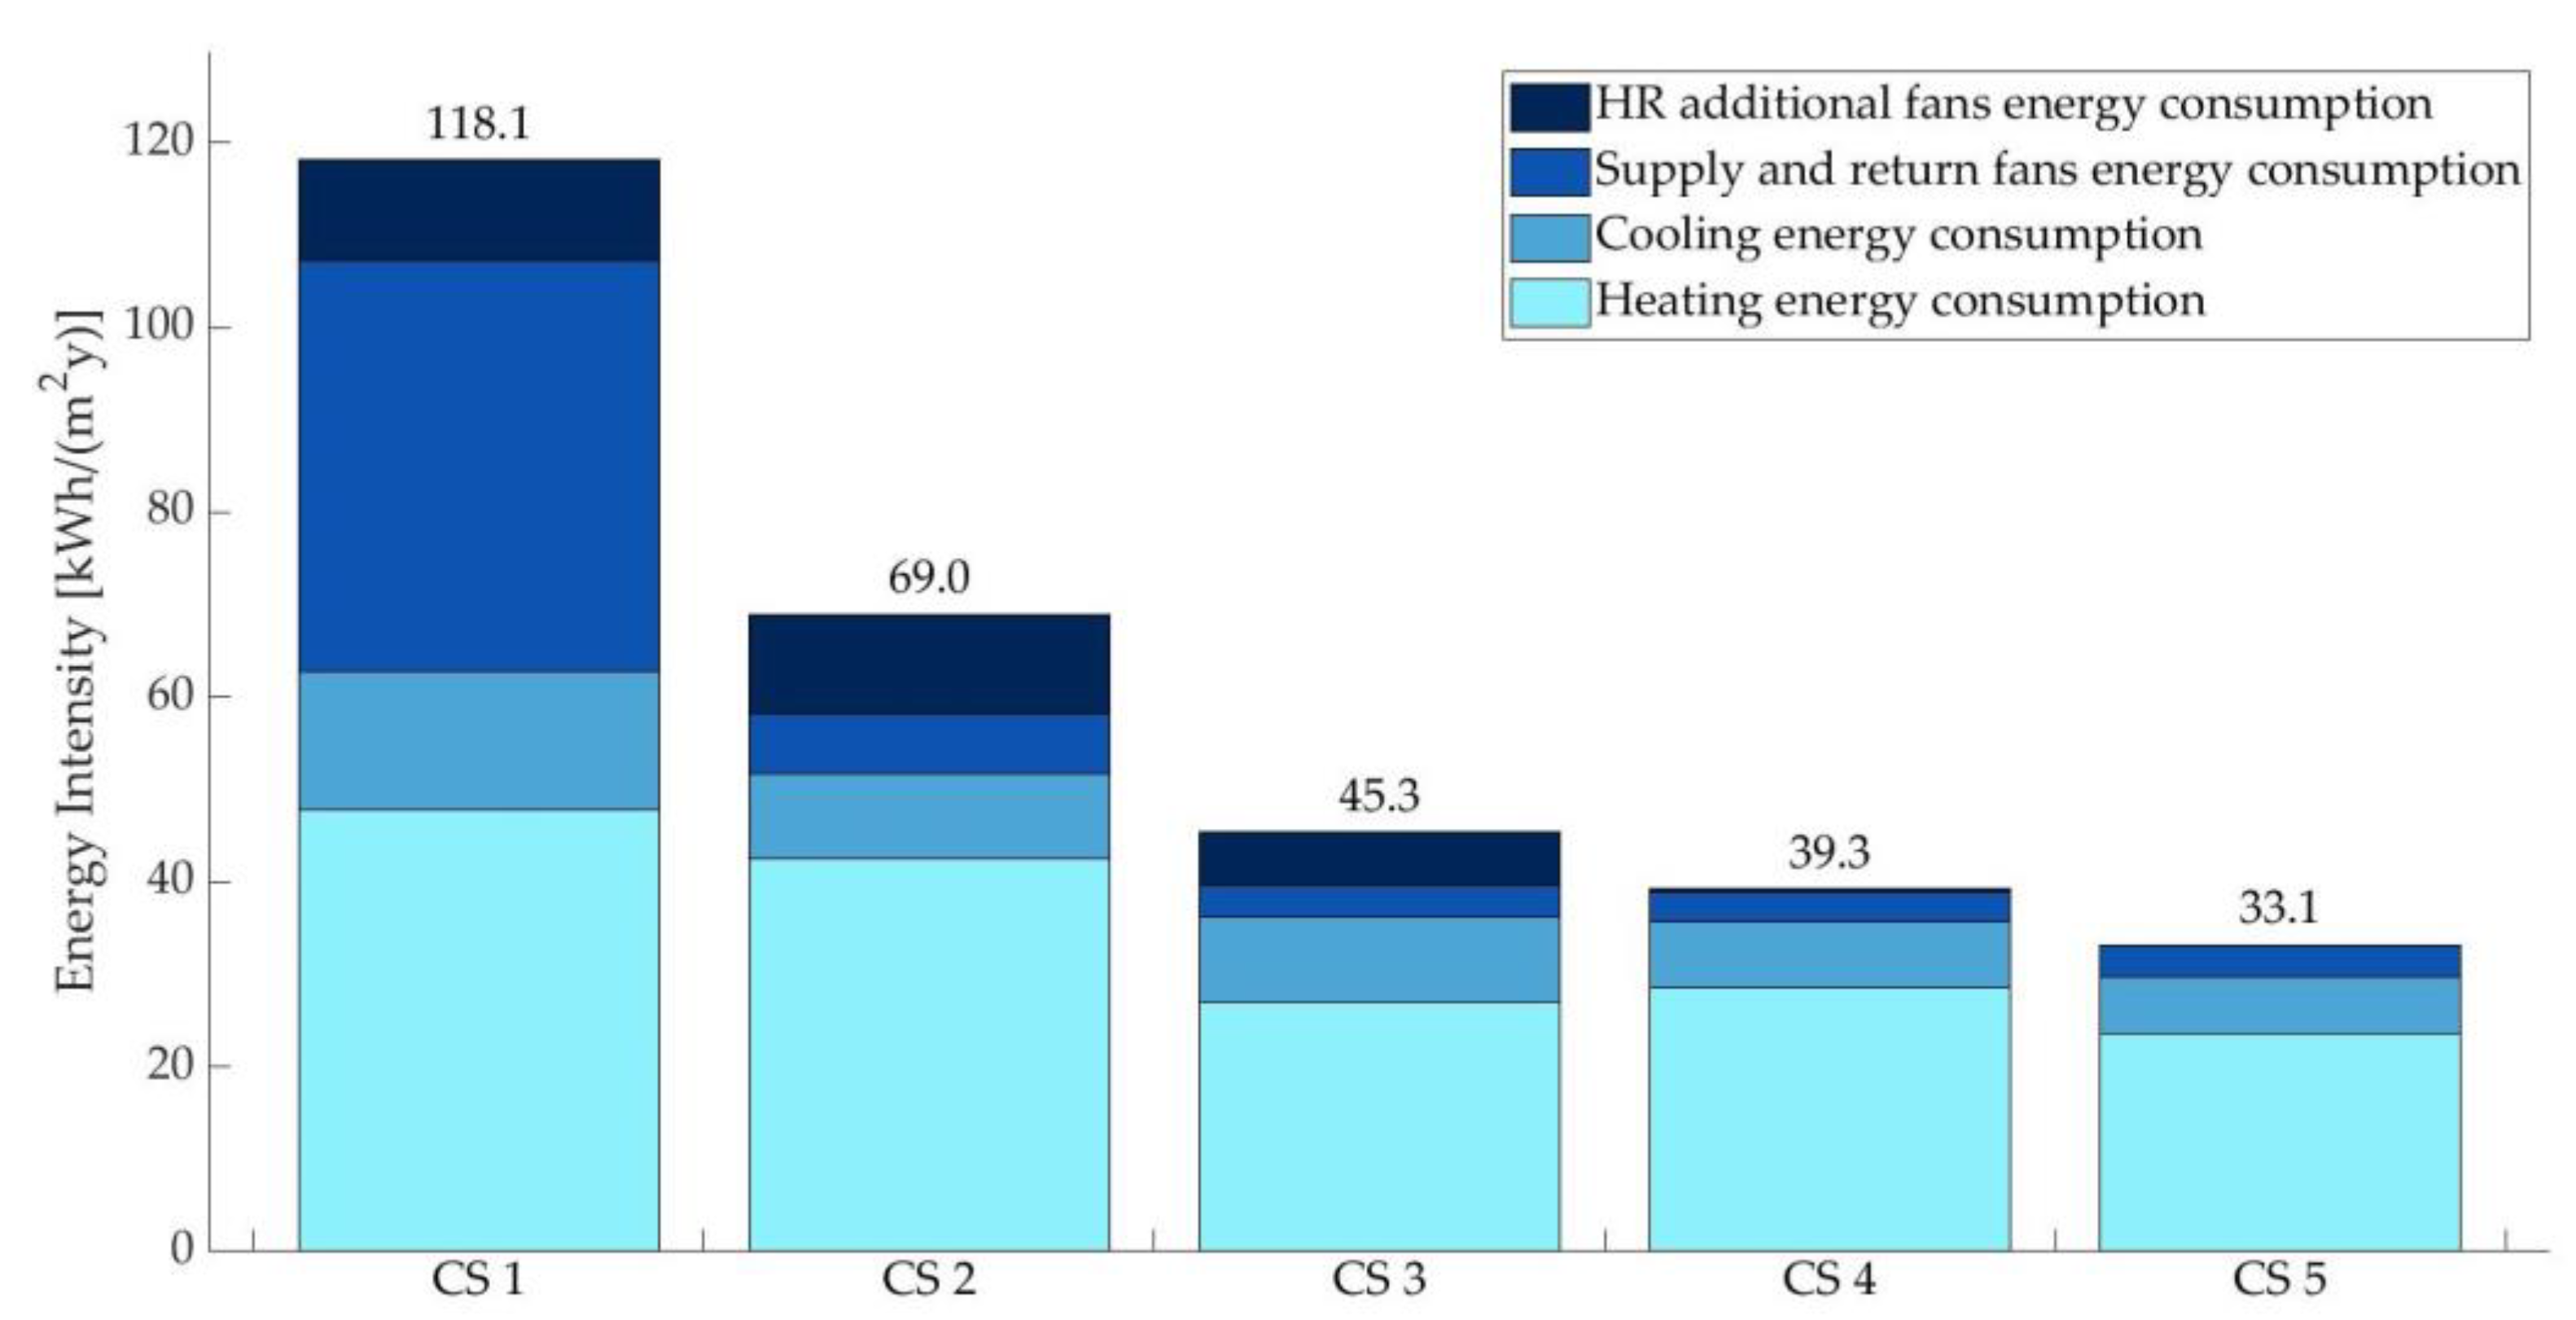
Figure 4 provides the correspondent electric energy intensity referred to in the application of the five different control strategies, moving from the less structured one (CS 1) to the more complex one (CS 5). Considering the first case represented by the control strategy CS 2, it is shown how the energy consumption was significantly reduced by 50%, from 118 to 69 kWh/(m
2y), with respect to the basic one (CS 1), mainly due to the fan energy consumption but also to the heating and cooling energy consumption to a lesser extent. This was due to the reduction of the supply air flow rate when the heating and cooling demand were not the nominal ones. This comparison represents the energy savings achievable thanks to the use of a VAV system instead of a CAV system, a measure already implemented today.
Comparing the effect determined by control strategy CS 3 to CS 2, it is shown how the overall energy consumption can be reduced by up to 35% due to a lower heating energy consumption and fan energy consumption, especially in the HR one. This is due to the reduction of the outside air flow rate when the occupancy is low and thus carbon dioxide concentration can be maintained under the threshold of 1000 ppm with a reduced air flow. This comparison represents the energy savings arising from the implementation of DCV in a VAV system. Comparing CS 4 to CS 3, the overall energy consumption can be reduced by an additional 8%, thanks to a reduction in the HR additional fan and cooling energy consumption, which face a slight increase in the heating energy consumption.
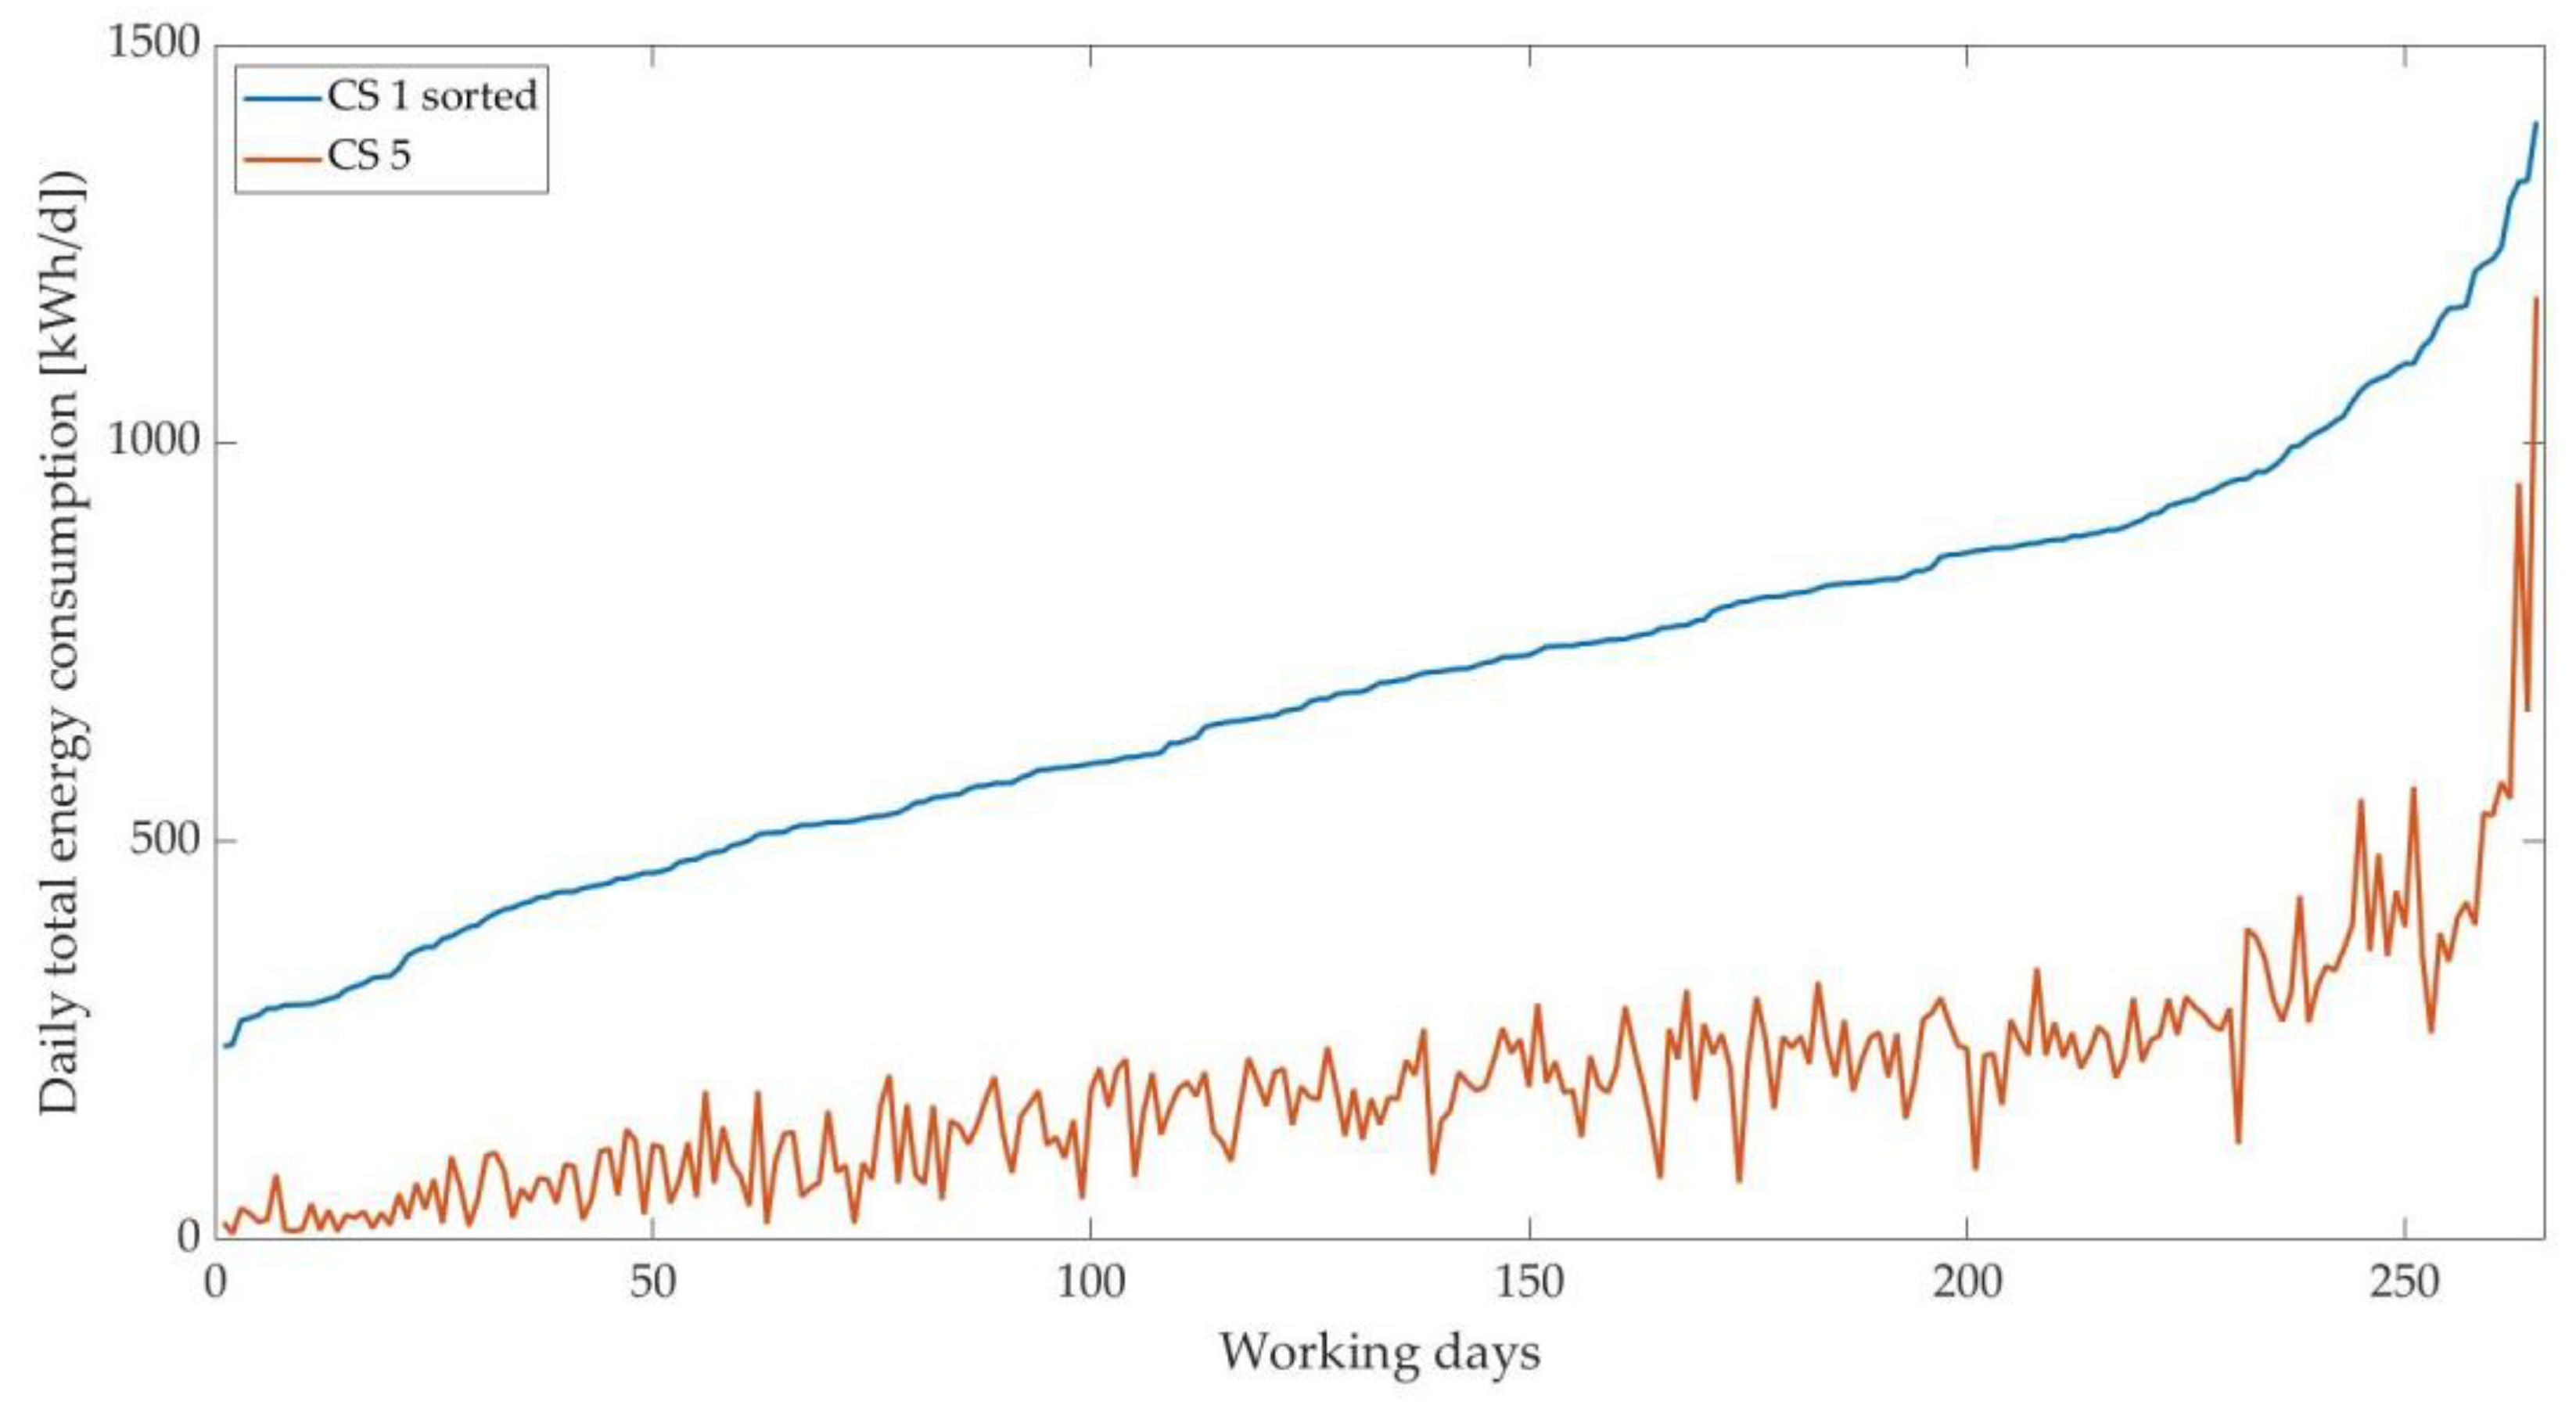
Comparing the two strategies CS 5 and CS 4 involving heat recovery, it is shown how the overall energy consumption can be reduced by another additional 9%, summing up to a total of 52% of energy savings, with respect to option CS 2. This is due to the reduction in the heating and cooling energy consumption for the improved performance of both HP and chiller. The energy saving is clearly evident in the graph of
Figure 5, which shows, for each day of the year, the different electricity consumption for the basic control strategy (CS 1) and for the optimal control strategy (CS 5). The X-axis illustrates the working days, representing the daily total energy consumption for the system using the basic control strategy CS 1. The corresponding daily total energy consumption in the case of the more advanced control strategy, CS 5, resulted in an oscillating trend, because the energy saving is dependent on the meteorological and occupancy-related conditions, and therefore on the variable building energy demand. This graph shows how the improvement is guaranteed throughout all of the HVAC system operational days, highlighting the relevance of the proposed measures.
The implementation of the real occupancy profile of the building can lead to relevant energy savings for the academic building analyzed. In addition, it seems appropriate to underline the importance of shifting from a conventional boiler, using natural gas, to a HP as a generation unit in HVAC, which is highlighted by its use of energy, as reported in
Table 3. For making the comparison with the HP performance, a steam boiler seasonal efficiency of about 0.85 has been obtained by considering the characteristics of the building and the degree days of Pisa: The advantages in terms of energy saving coming from the use of HP, which were in the range of 60% for every CS, are clearly apparent. Moreover, the use renewable energy (e.g., PV power), permits a reduction of the carbon footprint of the building.
All the remarks about energy savings should be further integrated with economic considerations of the operational costs by comparing the use of fossil fuels and of electricity and the investment costs for the different control strategies.
6. Consideration about the Measure of Energy Saving with Reference to the Specific Building and General Perspectives
In this section, the proposed measures are discussed individually, using as reference data those derived from the simulation, to gain insights about the various energy saving strategies and discuss their extensibility to other types of buildings and climates.
6.1. The Beneficial Effect of Demand Controlled Ventilation
One of the most relevant elements of the control strategy that permits relevant reduction of energy consumption is the application of DCV based on the effective occupation of the building. Let us start by analyzing in detail the positive effect of application of DCV, thus comparing, in terms of annual total energy intensity, the two strategies evidenced as CS 3 and CS 2. This measure can be available if the effective number of occupants is controlled, or by means of specific counters based on smart systems like smartphones or other devices, as described in [
16], or by direct measurement of CO
2 concentration and the inclusion of carbon dioxide concentration in the conditioned space monitored variables. This measurement was used to decrease the amount of outside air processed by the HVAC system when indoor air quality can be guaranteed with limited air renewal because of the small number of occupants inside the building. The energy saving achievable with DCV is shown in
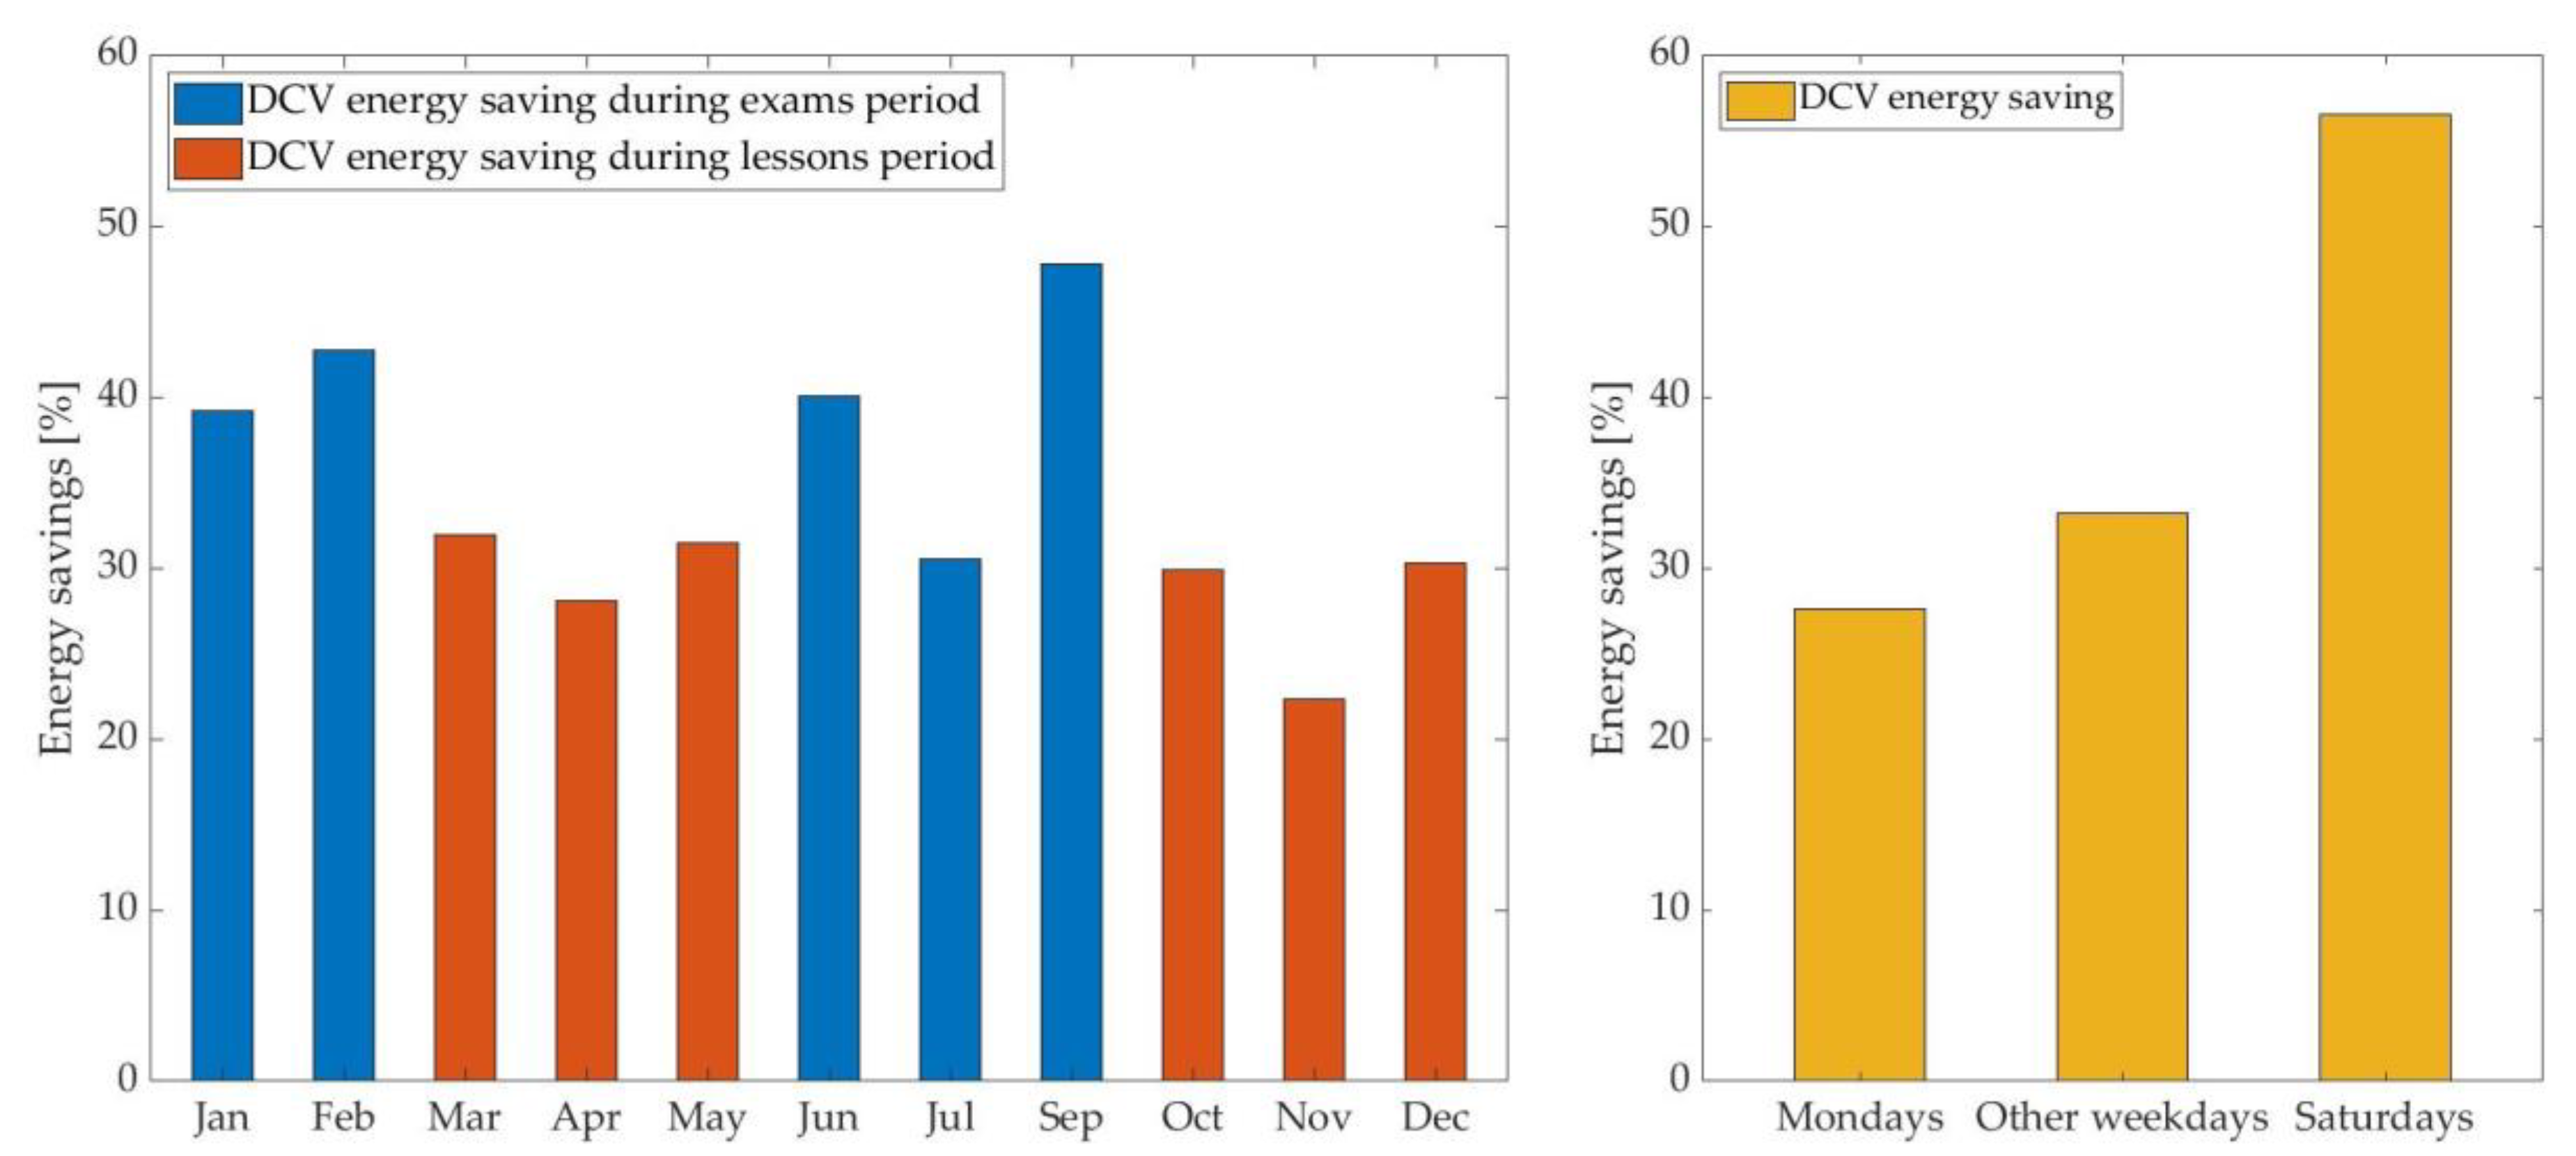
Figure 6 on a monthly and daily horizon. Considering the various months, it is shown how during periods of exams, when the level of occupation was reduced, the energy saving was significant, reaching a maximum value of 48% and a mean value of 40%, while when the building was used for lessons, the energy savings were quite lower, with a maximum value of 32% and a mean value of less than 30%. Higher values of energy savings were obtained in months in which the real occupancy is much smaller than the peak one, because of greater reductions in the air flow rates. Considering the various days of the week, it is evident how energy saving could be almost constant during the weekdays, with a slightly lower (<7%) value on Mondays, and are relevant on Saturdays due to the reduced number of occupants.
In general, according to the relevance of the present analysis, it is possible to affirm that DCV could be more helpful in buildings with long opening hours—academic buildings which are open in the afternoon but also until midnight surely represent a better choice than scholastic ones which are open only in the morning. Event-related buildings such as theaters or sports halls do not represent a good choice, as their use is limited to the hours in which the event takes place. Following from the considerations about
Figure 6, the ideal building should be characterized by a large discrepancy between peak occupancy and real occupation; this must be considered on different time horizons, as for the test case. Based on this consideration, buildings such as supermarkets and shopping centers, besides academic ones, could heavily benefit from the implementation of demand-controlled ventilation, for they have long opening hours, and their occupancy assumes very different values, based on the day of the week but also on periods. Since the simulation has been carried out on a single zone, the balance of carbon dioxide represents an average value on the total volume, which does not consider the different occupancy in each classroom. The energy savings obtained in this study suggest a great convenience of implementing these type of measures, even if they should be adapted and tested for each specific application.
6.2. Considerations about Heat Pump and Chiller Operation
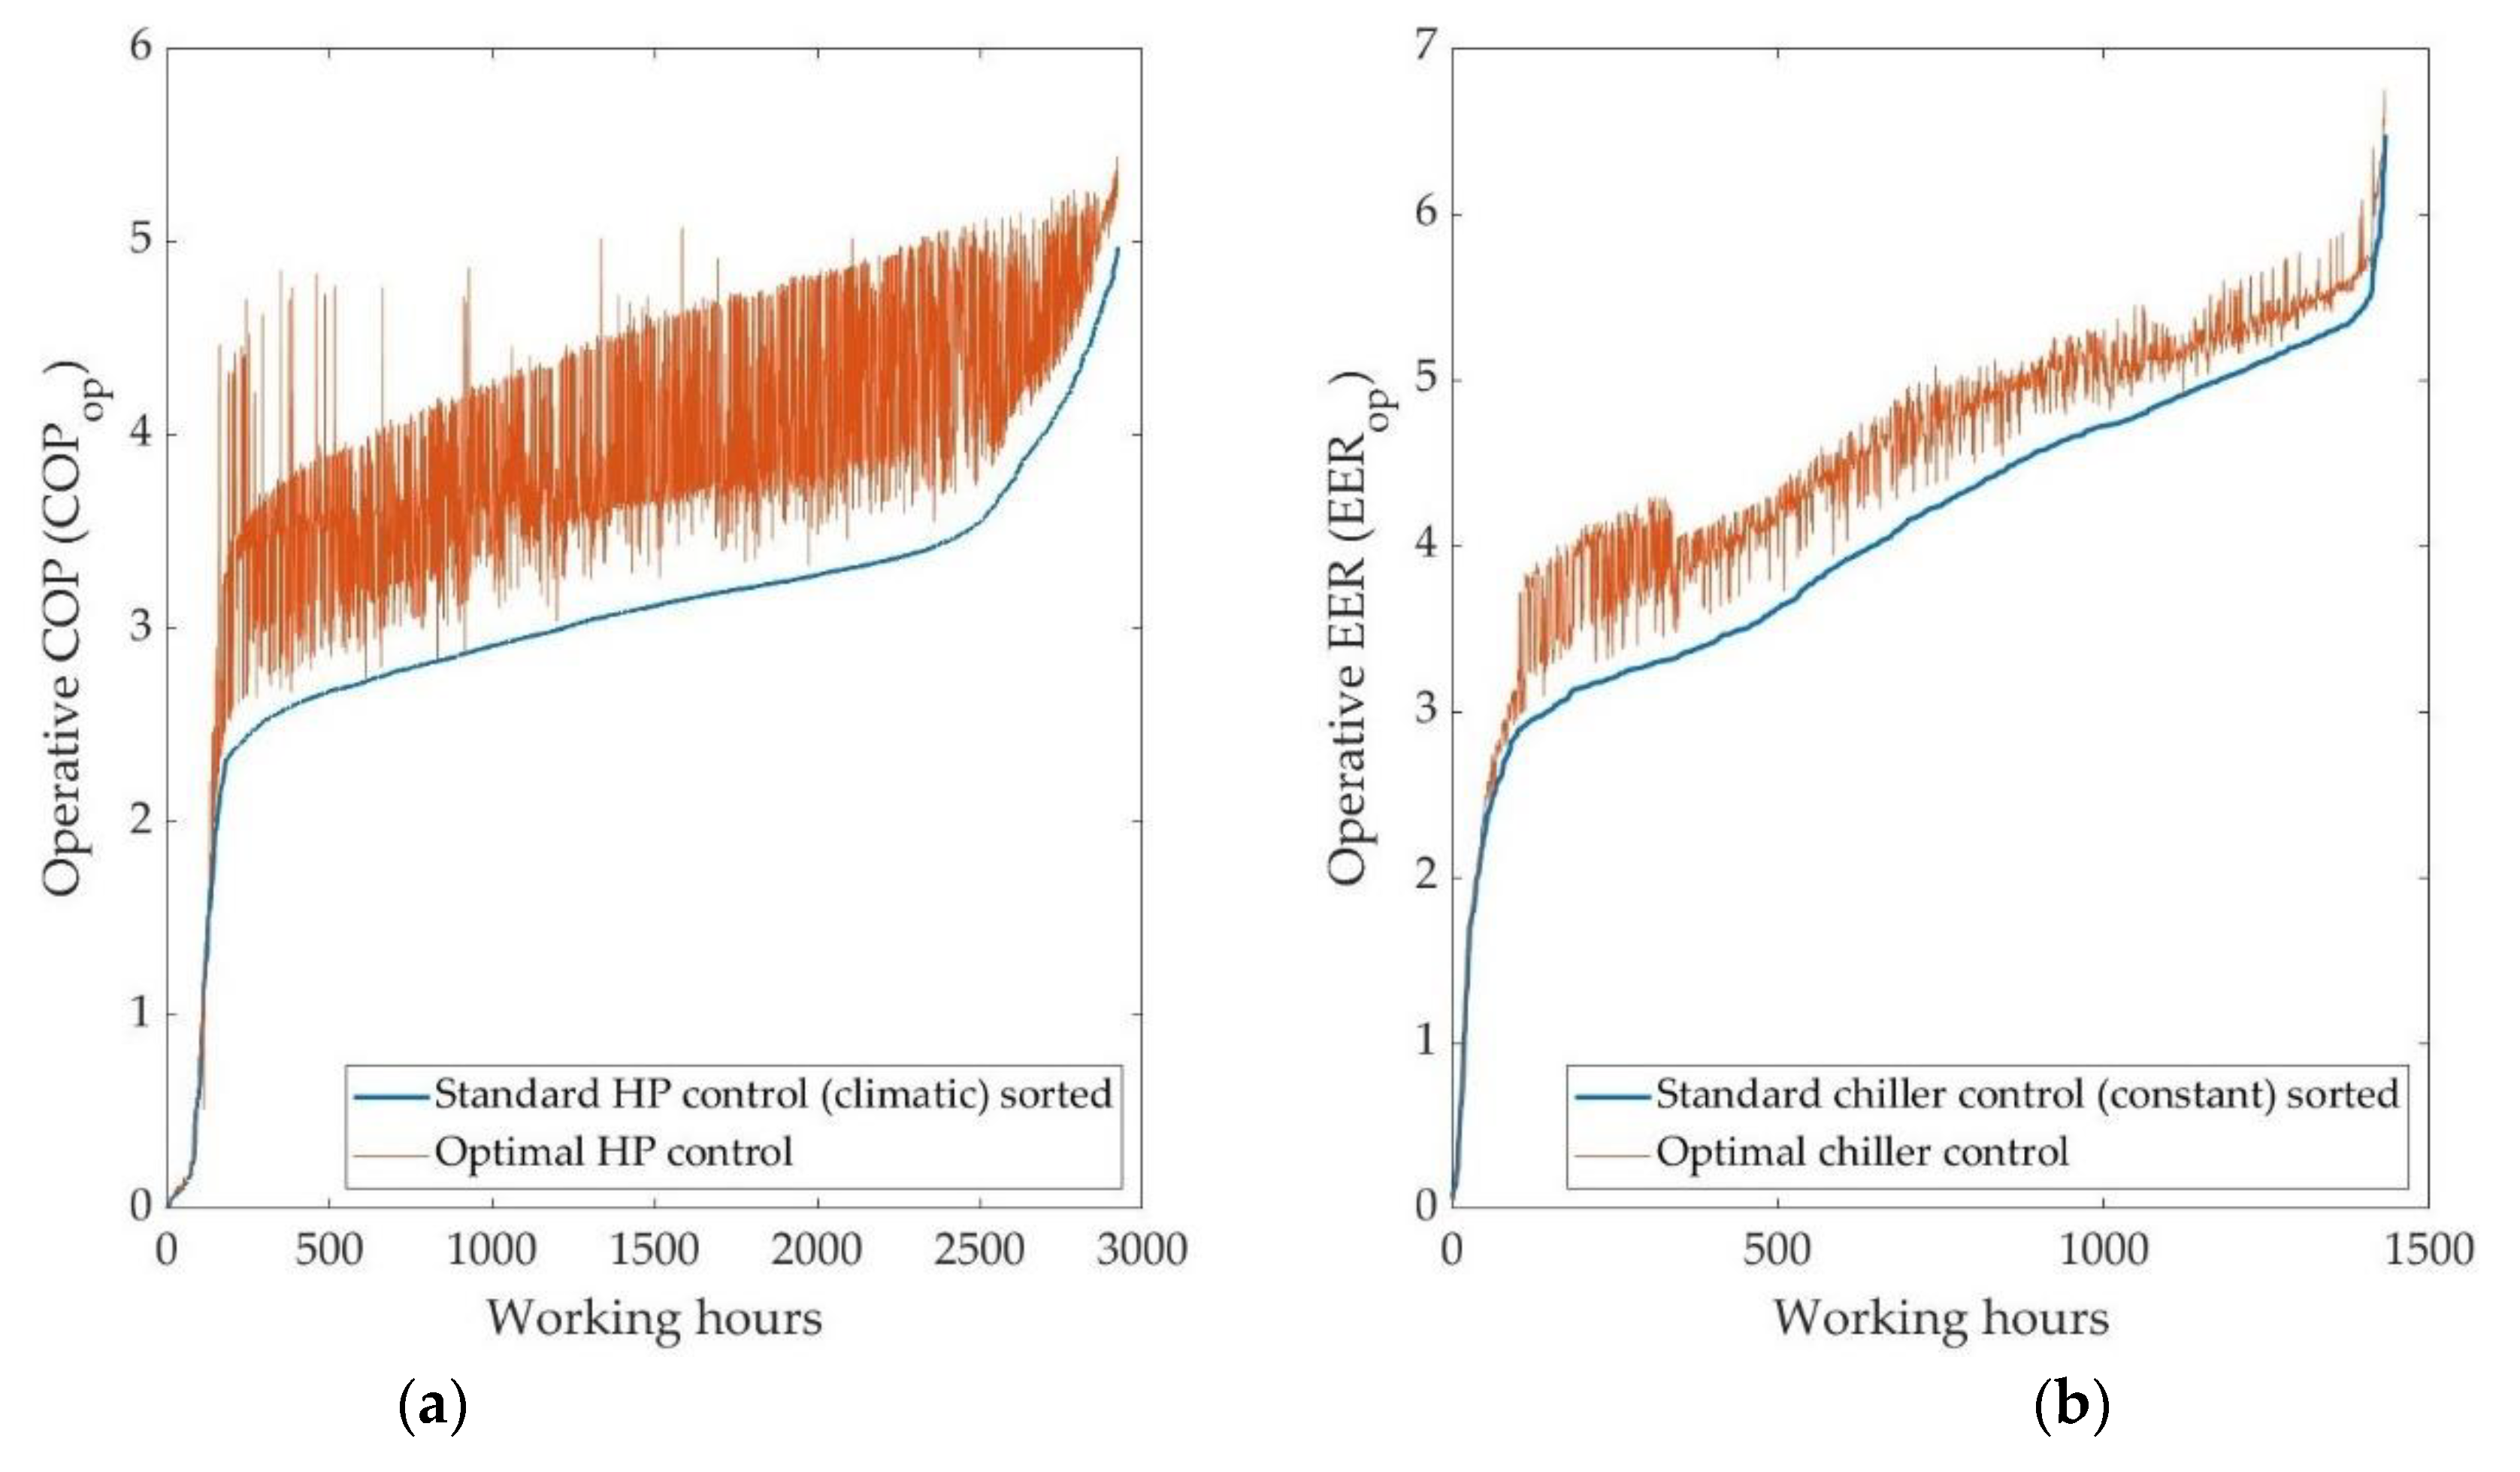
The analysis of this measure regards the comparison between the two control strategies named CS 4 and CS 5. There was an observed decrease in the cooling and heating consumption amount to 13% and 18%, respectively. HP and chiller performances are shown in
Figure 7, sorted in ascending order for CS 4 coefficient of performance and presenting the oscillating trend for CS 5 due to the variability of the energy achievable in the different working hours. For both the components, when the working conditions were more favorable than those provided in the catalogue, e.g., request of reheat temperature lower than external air temperature, they have been adjusted to the ones in which the performance data are provided. In
Figure 7, it is shown how a more dynamic control of both HP (
Figure 7a), referred to the operation in heating mode, and chiller (
Figure 7b), referred to the operation in cooling mode, can lead to improved performances during all the operating hours, including about 3000 h for heating period and about 1400 h for cooling period.
For the chiller, this is because the optimal supply water temperature is always higher than the standard operation one, leading to a smaller temperature difference between the source and the sink, and therefore to a better energy efficiency ratio (EER). Instead, for the HP, the optimal supply water temperature is always lower than classic one, leading to a better COP. The improvements achieved with this solution, but also the overall chiller and HP performances, are strongly dependent on the climatic conditions, so that an extension to other case studies should consider the reference climate of the site.
The proposed optimal supply water temperature control strategy relies upon the exact knowledge of the building energy demand and the possibility of varying the machine’s working condition according to these needs. This has been proposed to overcome the actual standard operation which is blind to this context, and which results in continuous on-offs and performance degradation. However, even with accurate predictive models and advanced components, the working conditions required for following the demand could lead to performance degradation and the measure should therefore be experimentally tested to evaluate the actual performance on the field.
To overcome this problem, a feasible solution could be the integration of thermal storages to adjust the performance at part load, and to eliminate the continuous on-offs which strongly degrade the performance of these machines. The presence of a thermal storage would decouple the demand and the generation, allowing for a more continuous operation, limited to the most favorable hours. Regarding HP operation, the presence of a thermal storage could in fact shift the energy generation during daylight hours, in which the external temperature is closer to the supply water one due to the daily oscillation, leading to better COP. The same applies for the chiller during night hours. However, this would bring the need to produce water at a higher temperature to face the additional heat losses of this system, and requires a specific evaluation.
7. Conclusions
In this study, a set of measures to improve the overall energy performance of HVAC systems used for climatic control of large buildings subjected to variable occupation was proposed and examined. The main idea has been that of analyzing solutions which could be easily implemented without expecting technological improvements in future HVAC system controls, without considering overly-advanced controllers based on predictive and adaptive strategies. The paper has analyzed the energy consumption obtainable when operating HVAC systems with HPs under five different control strategies and different levels of complexity. The application to a specific building located in Pisa with HPs as thermal generators has shown that the electric energy intensity of the building can be reduced by over 60%, from 118 to 45 kWh/(m2y), simply by changing the basic control logic that is based on the peak occupancy (CAV) with a logic that considers the real occupation of the building (DCV). Operating a more structured control, the energy intensity can be reduced even further, reaching a promising level 33 kWh/(m2y), which is about 30% of the energy consumption required without specific attention to the real occupation profile of the building.
Among the various elements considered in the analysis, we can state that the installation of HP has been proven beneficial compared to the use of conventional boilers using fossil fuel. The energy savings achievable with the implementation of heat pumps reached about 60%, showing a great importance of these machines in increasing the energy efficiency. Considering that a reference in terms of primary energy consumption for the building in object is about 270 kWh/m2 per year, calculated for the building energy label prior to the implementation of heat pumps as generation system, even with the simpler control strategy (CS 1), it is evident that the installation of HPs can be highly beneficial for these systems, especially with the increasing share of electric energy from renewables.
Considering the use of HVAC with HPs and the specific effects of the different control strategies, since the achieved energy savings are mainly due to the implementation of DCV, which represents the less advanced of the measures proposed, a certain hierarchy of these approaches is emphasized. In fact, the lack of the energy perspective in dealing with IAQ has been proven to be more critical than considering optimal operation at a supervisory control level. This simple insight should be put at the center of both engineering design and policy actions, because it represents the major weakness in the HVAC control. Since many technologies for the occupants’ monitoring are currently available on the market, ranging from indirect measures by means of carbon dioxide concentration to direct techniques as infrared cameras or personal device counting systems, its large-scale deployment for HVAC control and the consequent significant energy saving are within reach in the next years.


