Article

Assessment of Rooftop Solar Power Generation to Meet Residential Loads in the City of Neom, Saudi Arabia

by
Nasser Alqahtani
1 and
Nazmiye Balta-Ozkan
2,*
1
Saudi Standards, Metrology and Quality Organization, P.O. Box 3437, Riyadh 11471, Saudi Arabia
2
School of Water, Energy and Environment, Cranfield University, Cranfield, Bedfordshire MK43 0AL, UK
*
Author to whom correspondence should be addressed.
Energies 2021, 14(13), 3805; https://doi.org/10.3390/en14133805
Submission received: 28 April 2021 / Revised: 5 June 2021 / Accepted: 11 June 2021 / Published: 24 June 2021
(This article belongs to the Special Issue Accelerating the Adoption of Solar Energy towards a Low-Carbon Future)

Abstract

:
The economic and social development of the Kingdom of Saudi Arabia (KSA) has led to a rapid increase in the consumption of electricity, with the residential sector consuming approximately 50% of total electricity production. The KSA depends largely on non-renewable energy resources, and the government has produced Saudi Vision 2030. This plan aims to lessen the country’s reliance on fossil fuels and reduce associated problems such as air pollution. Saudi Vision 2030 combines renewable energy and new building designs so that, for example, the planned city of Neom will be net zero energy. This study addresses how best to reduce Neom’s reliance on the national grid through rooftop photovoltaic generation in residential buildings. The study develops a techno-economic model of rooftop PV with battery storage suitable for existing residential building types likely to be built in Neom city (villas, traditional houses, and apartments), and assesses the optimal PV size, battery storage capacity, and optimal orientation of the PV panels. The study used HOMER Pro to compute the Net Present Cost, Levelized Cost of Energy, orientation of PV panels, and optimum PV system size. The optimal size of PV system is 14.0 kW for the villa, 11.1 kW for the traditional dwelling, and 10.3 kW for the apartment, each with a single battery of capacity 12 kWh.

1. Introduction

The Saudi Electricity Company (SEC) is responsible for electricity generation in the Kingdom of Saudi Arabia (KSA), with an installed power production capacity that increased from 1141 MW in 1975 to 46 GW in 2010. With an expected peak demand in 2020 of 59 GW, it is predicted that there will be a subsequent 5% to 8% growth in annual demand [1]. Approximately 33% of total daily oil production of the KSA is used for electricity generation [2]. To meet the expected demand, new sources are necessary, and renewable energy including PV power systems are an obvious choice to be considered due to high solar direct normal irradiation (DNI).
In 2018, according to the King Abdullah Petroleum Studies and Research Center, residential, commercial, and government buildings consume about 80% of overall power generation, with residential buildings consuming 50% due to a high cooling demand [3]. The KSA is also one of world’s top ten countries for carbon dioxide (CO2) emissions per head of the population [2]. In response, the KSA government drew up a plan to reduce reliance on oil and gas by diversification of energy supplies. The so-called Saudi Vision 2030 aims to have renewable energy sources capable of producing 9.5 GW of power by 2023 to meet increasing demand. The plan also sets particular targets to meet the goals of sustainable growth including, for example, the design of new net zero energy buildings (NZEB) that produce the energy they consume using local renewable energy sources [4]. The growth of new build urban areas using NZEB would help minimize demands on the grid.
The Renewable Energy Roadmap [5] assessed the required growth in renewables for worldwide from approximately 25% of total energy production in 2015 to about 65% by 2030 and 85% by 2050, to meet decarbonisation targets for the energy sector. The annual rate of increase of 0.7% of renewables achieved over the last five years needs to more than double to attain these targets. Fortunately, the KSA has abundant solar energy to meet this demand.
The development of the city of Neom is part of a major initiative within the KSA government’s Vision 2030. Neom is estimated to have a population of one million over an area of 26,000 km2 in the north west of the KSA. The city aspires to reduce dependence on oil by utilizing renewable energy sources [6,7]. This requires the gathering and analysis of data to assess the scope of roof-top solar photovoltaic (PV) systems to assist Neom to meet an expected shortfall in electricity generation in a cost-effective and environmentally friendly manner. There is a broad literature focusing on the economic feasibility of solar PVs with battery storage to meet domestic loads for on-grid (in Pakistan [8], in Greece [9], in China [10], in Hong Kong [11]) and off-grid locations (in Nigeria [12], in Pakistan [13] and in Greece [14]). For a comprehensive review of recent literature, please see [15]. However, the economics of an integrated solar PV and energy storage system using actual domestic load profiles for the KSA is poorly understood. This paper addresses this gap. It contributes to the literature by revealing an economically viable size of solar PVs and batteries and their orientation characteristics so as to reduce demands from the grid for three dwelling load profiles in KSA. The analysis reveals the importance of an electricity tariff and inflation rates.
The main objectives of this study are to:
  • Investigate the technical and economic viability of rooftop PV systems with battery storage for different types of domestic buildings.
  • Identify the optimum PV panel size and battery capacity to maximize reduction in demand from the grid.
  • Identify the optimum orientation of rooftop PV panels to maximize electricity generation.
This paper contains six sections. Section 2 gives an overview of relevant NZEB, solar rooftop PV systems, and battery storage for residential and commercial buildings. Section 3 discusses the software used for this research. Section 4 presents the simulation results obtained from the software. Section 5 discusses the simulation results and compares them with data obtained from the literature. Section 6 presents conclusions and recommendations for decision makers.

2. Literature Review

Numerous investigations have attempted to identify the most important factors in selection and installation of rooftop PV systems in residential and commercial buildings with the aim of producing a NZEB. This section presents how NZEB can enable the new city growth and discusses the factors that influence economic viability of rooftop solar systems along with an overview of the KSA’s context in terms of energy demands.

2.1. Theoretical Concept of Net Zero Energy Building

2.1.1. Net Zero Energy Building

The authors have described a NZEB as annual average green-house gas emissions total zero [16]. Several nations around the world, including Australia, are currently engaged in collaborative research to advance a Net Zero Energy Solar Building to reduce energy usage and emissions through the use of sensors and smart appliances that have reduced energy costs by approximately 10–30% with a corresponding drop in greenhouse gas emissions [17]. Energy usage can be reduced by between 32–60% cost-effectively by optimising building designs [18].

2.1.2. Building Energy Efficiency

Vision 2030 has strong similarities to the Sustainable Development Goals (SDGs) adopted by the UN General Assembly in 2015, in particular with the preservation of the biosphere and provision of affordable, clean, available, and sustainable energy. This will require significantly increasing the proportion of renewable energy in the international energy mix and doubling the worldwide speed of advance in energy efficiency [5].
A survey by Felimban et al. [2] has suggested that retrofitting domestic buildings could decrease domestic energy usage in the KSA by 37%. Additionally, enhancing a structure’s heat loss performance coupled with hybrid ventilation ground pipes and night radiance cooling could result in an estimated 80% reduction in the summer cooling load in the KSA, and could be achieved by coupling a small chiller unit to a water reservoir [2].

2.2. Economic Viability of Rooftop Solar Energy

2.2.1. Factors Affecting PV Solar Panel Generation

The performance of a PV system depends primarily on solar radiation intensity but is also influenced by ambient air temperature, both depending on geographical location. Factors influencing the solar radiation reaching the PV surface include fog, dust in the atmosphere, dust accumulation on the panel, and moving clouds [19]. Ambient temperature can substantially affect PV energy output, for instance, as the former warms up, the temperature of the cell increases, and the higher the temperature of the cell material the greater its electrical resistance. Rising cell temperature lowers the energy output per PV module [19].
Optimum panel orientation requires correct tilt angle (correct horizontal angle is tilt of zero, and for vertical, tilt of 90°) and azimuth to ensure maximum incident solar radiation on the PV panel [20,21]. Several researchers have investigated optimising angles of tilt and azimuth. Calabrò [22] indicates that panel users often demand precise computations of solar panel slope and orientation to ensure maximum solar intensity incident on fixed solar panels. However, of the total incident solar radiation, an estimated 20% is diffuse and so is present for all angles, giving panels a degree of tolerance to misalignment. Calabrò also notes that extrinsic features including isolation levels and load conditions also impact the solar power provided by PV modules [22].
The primary benefit of tracking systems is the ability to accumulate solar energy for longer durations by following the sun as its position in the sky varies. A solar PV panel, even with a tracking system limited to only east–west movement, recorded a 19–24% higher daily solar energy accumulation compared to a fixed system [22]. Tracking systems with a maximum efficiency of 34% offer significantly more power than non-tracking systems but despite this potential gain, utilisation of solar tracking is not common due to high operation and maintenance costs. Placing solar collectors at a single fixed optimised angle of tilt is found to be generally suitable for most users.
Guo et al. [23] employed the ergodic method to establish optimum tilt and azimuth angles for each month to produce a mathematical model for incident solar radiation in six Chinese cities with varying climatic conditions. They found that incident solar radiation increased until the tilt angle was approximately equal to the city’s latitude, and dropped with further increase in tilt angle. They also found that in all six cities, from the summer onwards into winter, the optimum tilt angle increased and reached a peak in December.
A study conducted by Al Garni et al. [24] investigated south-oriented PV panels ranging from 0° to 85° latitude in 20 locations in 14 countries and found that users could achieve a 98% efficiency level by using the latitude as their panel’s annual optimum tilt. Kaddoura et al. [25], evaluated the optimum orientation of solar modules in the KSA using satellite-based information with an uncertainty level of ±6% to ±12%. They analysed the optimum tilt angles at several Saudi Arabian cities and for Jeddah, located at latitude of 21.5° N, found an optimum tilt angle of 19.28°.
The research input the optimum tilt by latitude into the global climate model, the Gas, Aerosol, Transport, Radiation, General Circulation, Mesoscale, and Ocean Model (GATOR-GCMOM), which can predict likely future conditions when cloud, wind speed, aerosol, and temperature characteristics are likely to differ significantly from the present day. GATOR-GCMOM, as opposed to PVWatts, has a global coverage rather than the latter’s coverage of only those locations close to meteorological stations. PVWatts established 24° as the optimum tilt angle for Riyadh city (latitude 24.7°) [26].

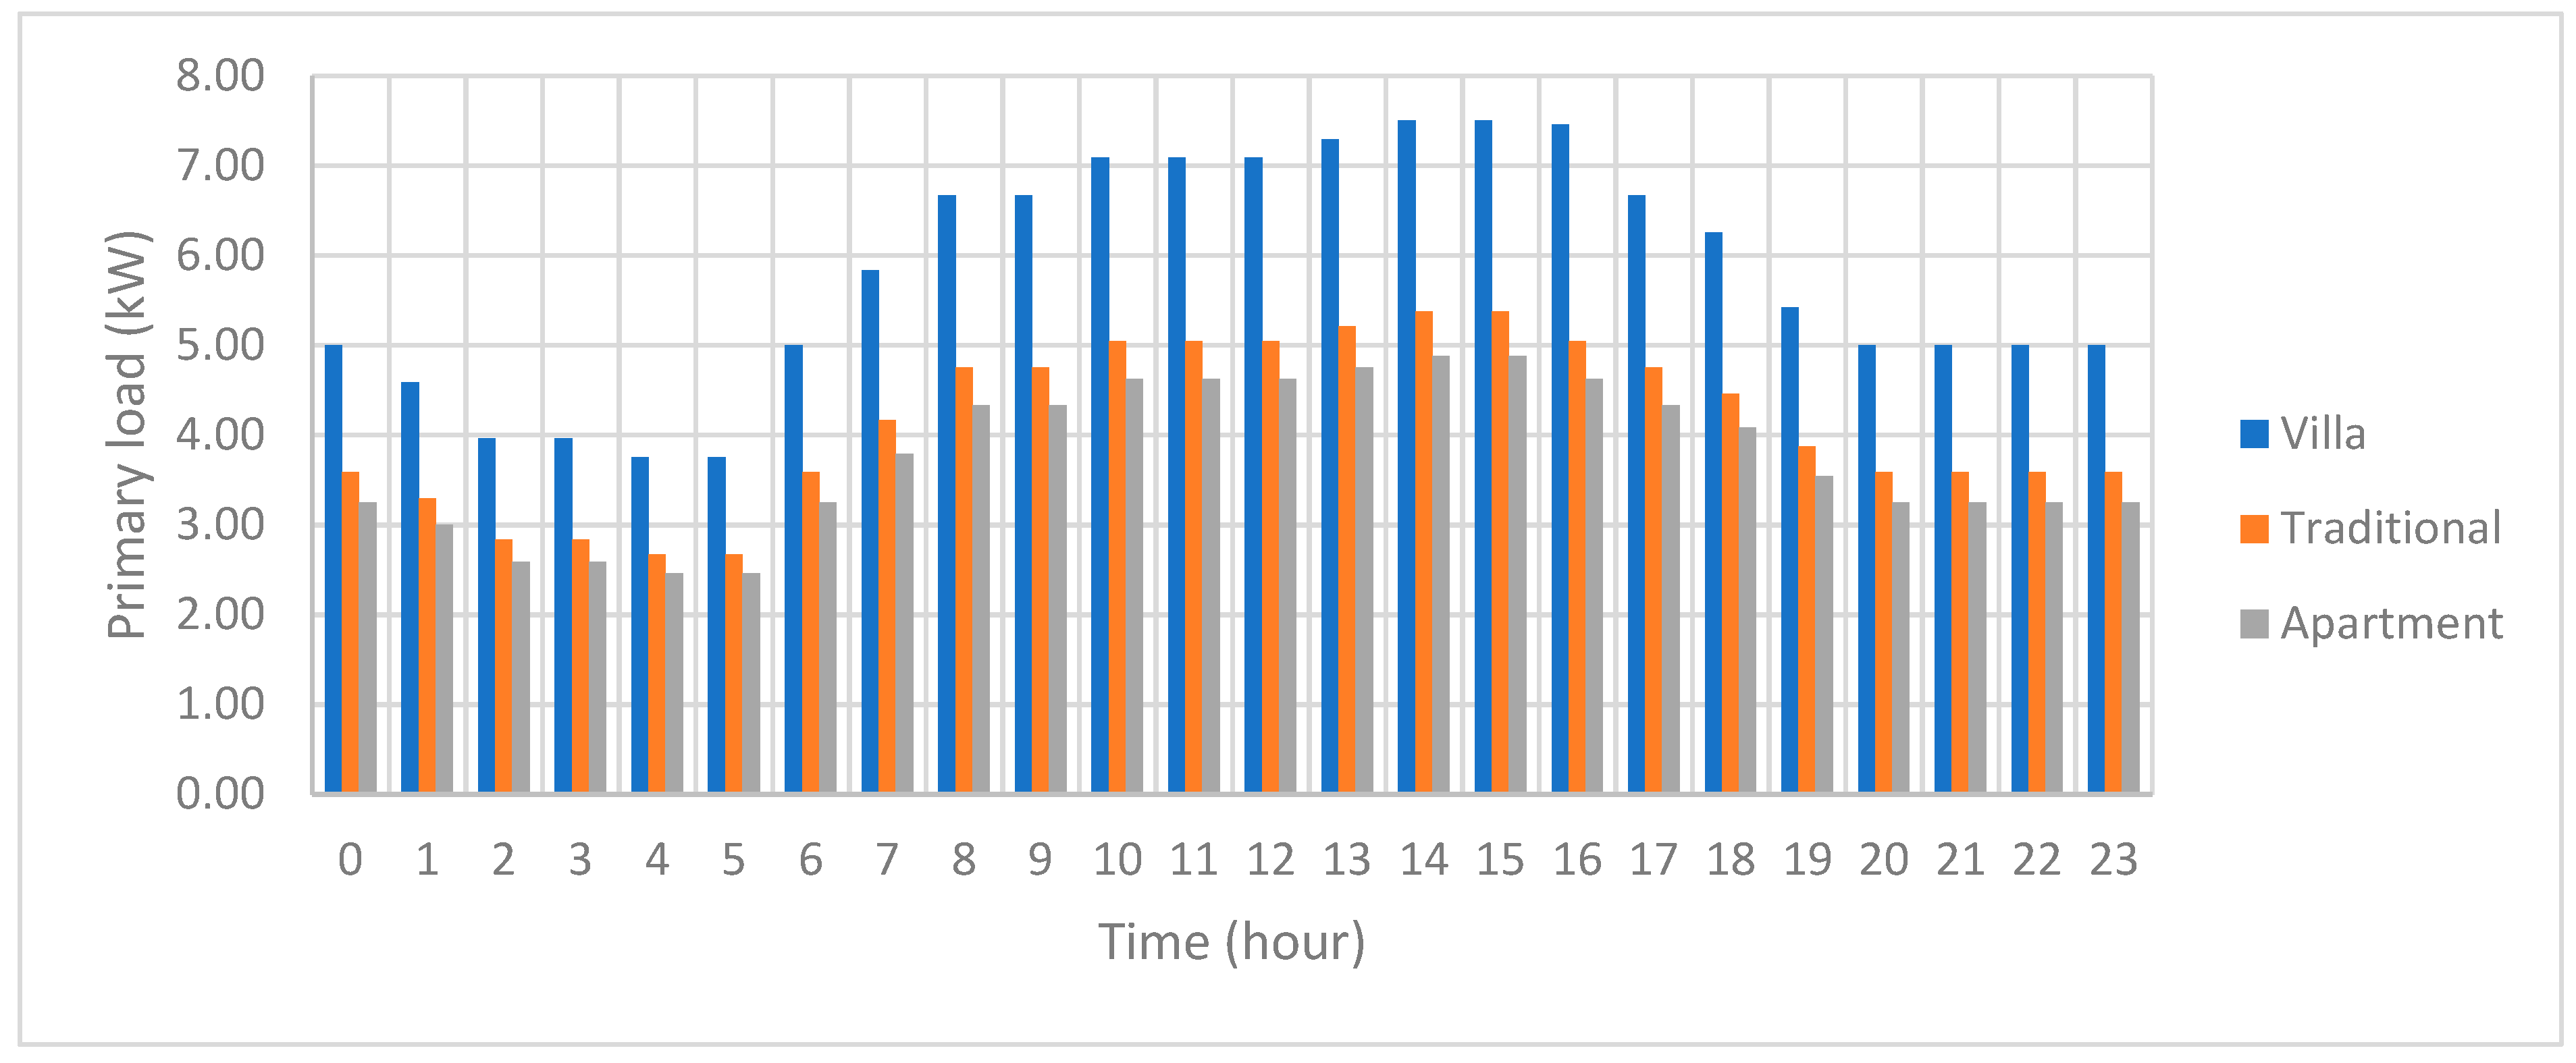
2.2.2. Domestic Load Profile

Knowing power production capacity and having an accurate forecast of the hourly energy demand is critical for efficient electricity production and, possibly, reducing consumption. The hourly and daily average electrical energy consumptions are also vital in determining the design of, say, a domestic energy storage system. Hennings et al. [27] confirmed that having an assured load profile can significantly impact the technical and economic performance of a system if consumers use distinct time series for household loads rather than an average load profile. The step widths need to be short enough to correctly simulate the power peaks of standard household appliances. However, governmental support programs, in terms of determining the retail price of electricity, the price paid for electric power input to the grid, regulation and taxation, will influence the monetary impacts of these programs. Therefore, the shaping of commercially viable PV-battery storage schemes for optimum return on investment should consider fluctuating electricity prices.
The KSA’s electric load has a distinctive characteristic in that it nearly doubles in summer relative to winter. The take-up of renewable energy systems will, therefore, depend on how well it meets summer’s high load demand [19]. Further, Alrawi et al. [28] analyzed how socio-economic and cyclical aspects affect load profiles and established there was a strong relation between device use and occupancy, and between house size and magnitude of the heating, ventilation, and air conditioning (HVAC) load in conditions where there are strong climatic extremes. Residential load profiles are useful in studies of PV integration into low-voltage systems and evaluating the feasibility of PV rooftop-energy storage systems.

2.2.3. Techno-Economic Feasibility of Rooftop Solar PV

The two most common processes that transform solar energy to electrical are photovoltaic and thermodynamic. For both methods, the proportion of solar energy transformed to electricity will fluctuate, and there is an effective cut-off after the sun goes down. In addition, there will be fluctuations in load. The addition of battery storage to PV systems can “blanket” the peak and base loads between sunrise and sunset and help solve this problem [29].
The economic capabilities of rooftop photovoltaics (PVs) has been analysed using levelized cost of energy (LCOE) where the LCOE for a PV system is the typical aggregate cost of constructing and running a system for a specified life, per unit of electricity produced [30]. Mariaud et al. [31] demonstrated distributed energy systems that optimised the capacity of the battery and PV system for commercial buildings, and assessed whether the technological investments were both feasible and economically worthwhile. Hartner et al. [32] found that various criteria including size, price level variance, household electricity consumption, location, solar radiation, and the relationship between PV generation and household load will impact the optimum economic performance of PV systems. Battery storage promotes load shifting where users can retrieve PV-generated electricity stored in batteries during the night, reducing consumption and cost of power purchase from the grid [1,33].
Ellabban and Alassi [34] made an economic assessment and evaluation of PV systems from several perspectives, including PV support policies, metered and feed-in tariff schemes, and profitability analyses. The Net Present Value (NPV), Pay-back Period (PBP), and LCOE calculations were used for assessing the financial efficiency of a 1 MW PV system connected to the grid. From these constructs it was deduced that the LCOE fell 43% below the current price of a kWh in Bahrain.
Shah and Al-Awami [35] determined that the price for a 6 kW PV system within the incentive program cost about $5000 and $1000 for panels and inverter, respectively. A battery with a capacity of 11.6 kWh costs $3400, revealing an approximate cost of 0.053 $/kWh when batteries are assumed to cycle once per day. Of course, to maintain performance and system efficiency, the build-up of surface dust on PV modules which detracts from the performance of PV cells must be removed by regular cleaning and maintenance of PV modules [36].
A previous study by Vimpari and Junnila [30] found three primary challenges to the profitability of rooftop PVs. First, the interactions between excess production, self-consumption, and reimbursement strategy for surplus output have vital roles in the profitability of PV systems. Second, the specific government compensation scheme for network owners and/or critical stakeholders is vital. Third, the chosen approach will determine costs and affect the financial performance and size of the required PV investment. Presently, the LCOE approach emerges as the most utilised method in the calculation of economic performance with the literature suggesting the possibility of other mechanisms such as Discounted Pay-back Period (DPB), NPV, or Internal Rate of Return (IRR) [30]. However, this study identifies LCOE as unsuitable for evaluation of rooftop PV investments because of the three factors affecting profitability of rooftop PV systems mentioned previously.
Shaahid [1] determined 0.215 $/kWh as the cost of producing energy (LCOE, $/kWh) from a hybrid PV-diesel system with battery storage in Yanbu City, KSA. Tsalikis and Martinopoulos [4] established that solar energy systems could satisfy over three quarters of the total energy requirements, and in other situations, close to 100%. Such figures suggest a discounted payback period of less than 6 years with a starting investment of € (10,000–12,250) [4].
Not every part of every roof is fit for solar PVs, and methods for determining useful and available areas have been provided by several previous investigators. One method computes architecturally acceptable areas—areas receiving at least 80% of the highest annual local solar irradiance—including shading, and various physical barriers such as HVAC system hardware. The authors computed the PV capabilities by dividing the available area by the area required to produce 1 kWp, (kWp = electrical power generated under optimum conditions). This value will depend on the efficiency and kind of panel utilised. Presently, crystalline-based solar PV panel varieties have a market share of over 90% [30]. Similarly, the area of a standard panel today is 1.6 m2, and its nominal power ranges between 0.260 and 0.285 kWp per panel. Accordingly, one kWp demands roughly 6 m2 of panel area. Vimpari and Junnila [30] used Equation (1) for computing the nominal power capacity of solar PVs as a function of type of building (PVu):
PVu = f l o o r   a r e a n u m b e r   o f   f l o o r s * ARAu * 1 6   kWp
where u depends on the type of building, either retail, residential, or office. ARAu represents the coefficient of the disposable rooftop area available for PVs. It follows that for a 2 kW solar PV system, the standard minimum installable capacity for residential systems, will need a minimum of 20 m2 of installable space [37]. Hong et al. [37] established that solar PV installations in urban high-rise buildings depend strongly on shadows cast by adjacent buildings reducing the useable rooftop area.
Several factors influence the total yield from PV systems, including ambient temperature, solar irradiance, dust deposition, panel efficiency, aerosols, and inverter performance. However, the primary factors are panel efficiency and irradiance as the influence of the other parameters depends on the site in question [28].

2.3. KSA Context

2.3.1. Building Energy Demand

During summer, the KSA’s climatic conditions substantially increase cooling demand, with significant energy wastage due to the absence of building codes, substandard equipment, and a power-intensive lifestyle. The KSA has one of the world’s greatest per capita energy consumptions, far exceeding industrialized nations. The Gulf Cooperation Council (GCC) countries are attempting to minimize energy consumption, and preserve their natural amenities, by taking steps towards reducing energy subsidies, increasing energy trade via the GCC grid, enhancing the region’s energy efficiency, improving their portion in the energy mix, and moving towards a more sustainable energy future [33].
Asif [3] discovered that fewer than one in six new business structures embraced recommended levels of thermal insulation, despite incurring a financial penalty by not doing so. However, Saudi Arabia’s residential PV power generation capacity currently meets an estimated 30% of the total residential electricity demand [38].
Felimban et al. [2] determined various factors that most affected summer energy consumption in residential buildings in Jeddah city, KSA: thermally, the buildings were poorly designed, and many residents kept indoor temperatures below 24 °C. A government energy efficiency program to set air conditioning (AC) units to 24 °C to reduce electricity consumption has significantly improved residents’ awareness and has reduced energy consumption in residential buildings.
In Saudi Arabia, a traditional home is one that occupies 100% of the land, lacks a fence, and has a minimum of one of its external walls in common with a neighbor. A domicile unit in a villa typically occupies two storeys, so the number of domicile units per storey in a villa is approximately 50%. Apartment blocks in Saudi Arabia, on the other hand, are usually three-storeyed with four to six units per floor. Thus, for example, if an apartment has a floor area of 210 m2 and is part of an apartment bloc which has three storeys, the maximum roof area available for this individual apartment will be 210/3 = 70 m2. In practice, the available area will be less than this because of pre-existing solar water heaters, water tanks, stairs accessing the roof, etc. With large living spaces of approximately 175 m2 and 225 m2, these services, on average, reduce the total disposable roof area by half. For smaller dwelling units of 75 m2 and 125 m2, the available area of roof is only a quarter of the floor area [38,39]. The Corrected Area Row is used in calculating the free roof area for domicile units for all regions of the KSA with disposable roof spaces. Application of the Corrected Area Row reduces the average available roof area per dwelling for apartments and villas by a factor of 2.6 and 2.0, respectively, while that of traditional houses remains unchanged [38,39].
A survey by Alrashed and Asif [39] established that 90% of dwelling in the Eastern province of KSA were traditional houses, villas, and apartments. More than 50% of respondents resided in apartments which normally occupy part of a single floor in a block of several storeys. However, this finding was for the Eastern province and may vary significantly for other regions.

2.3.2. Building Regulations
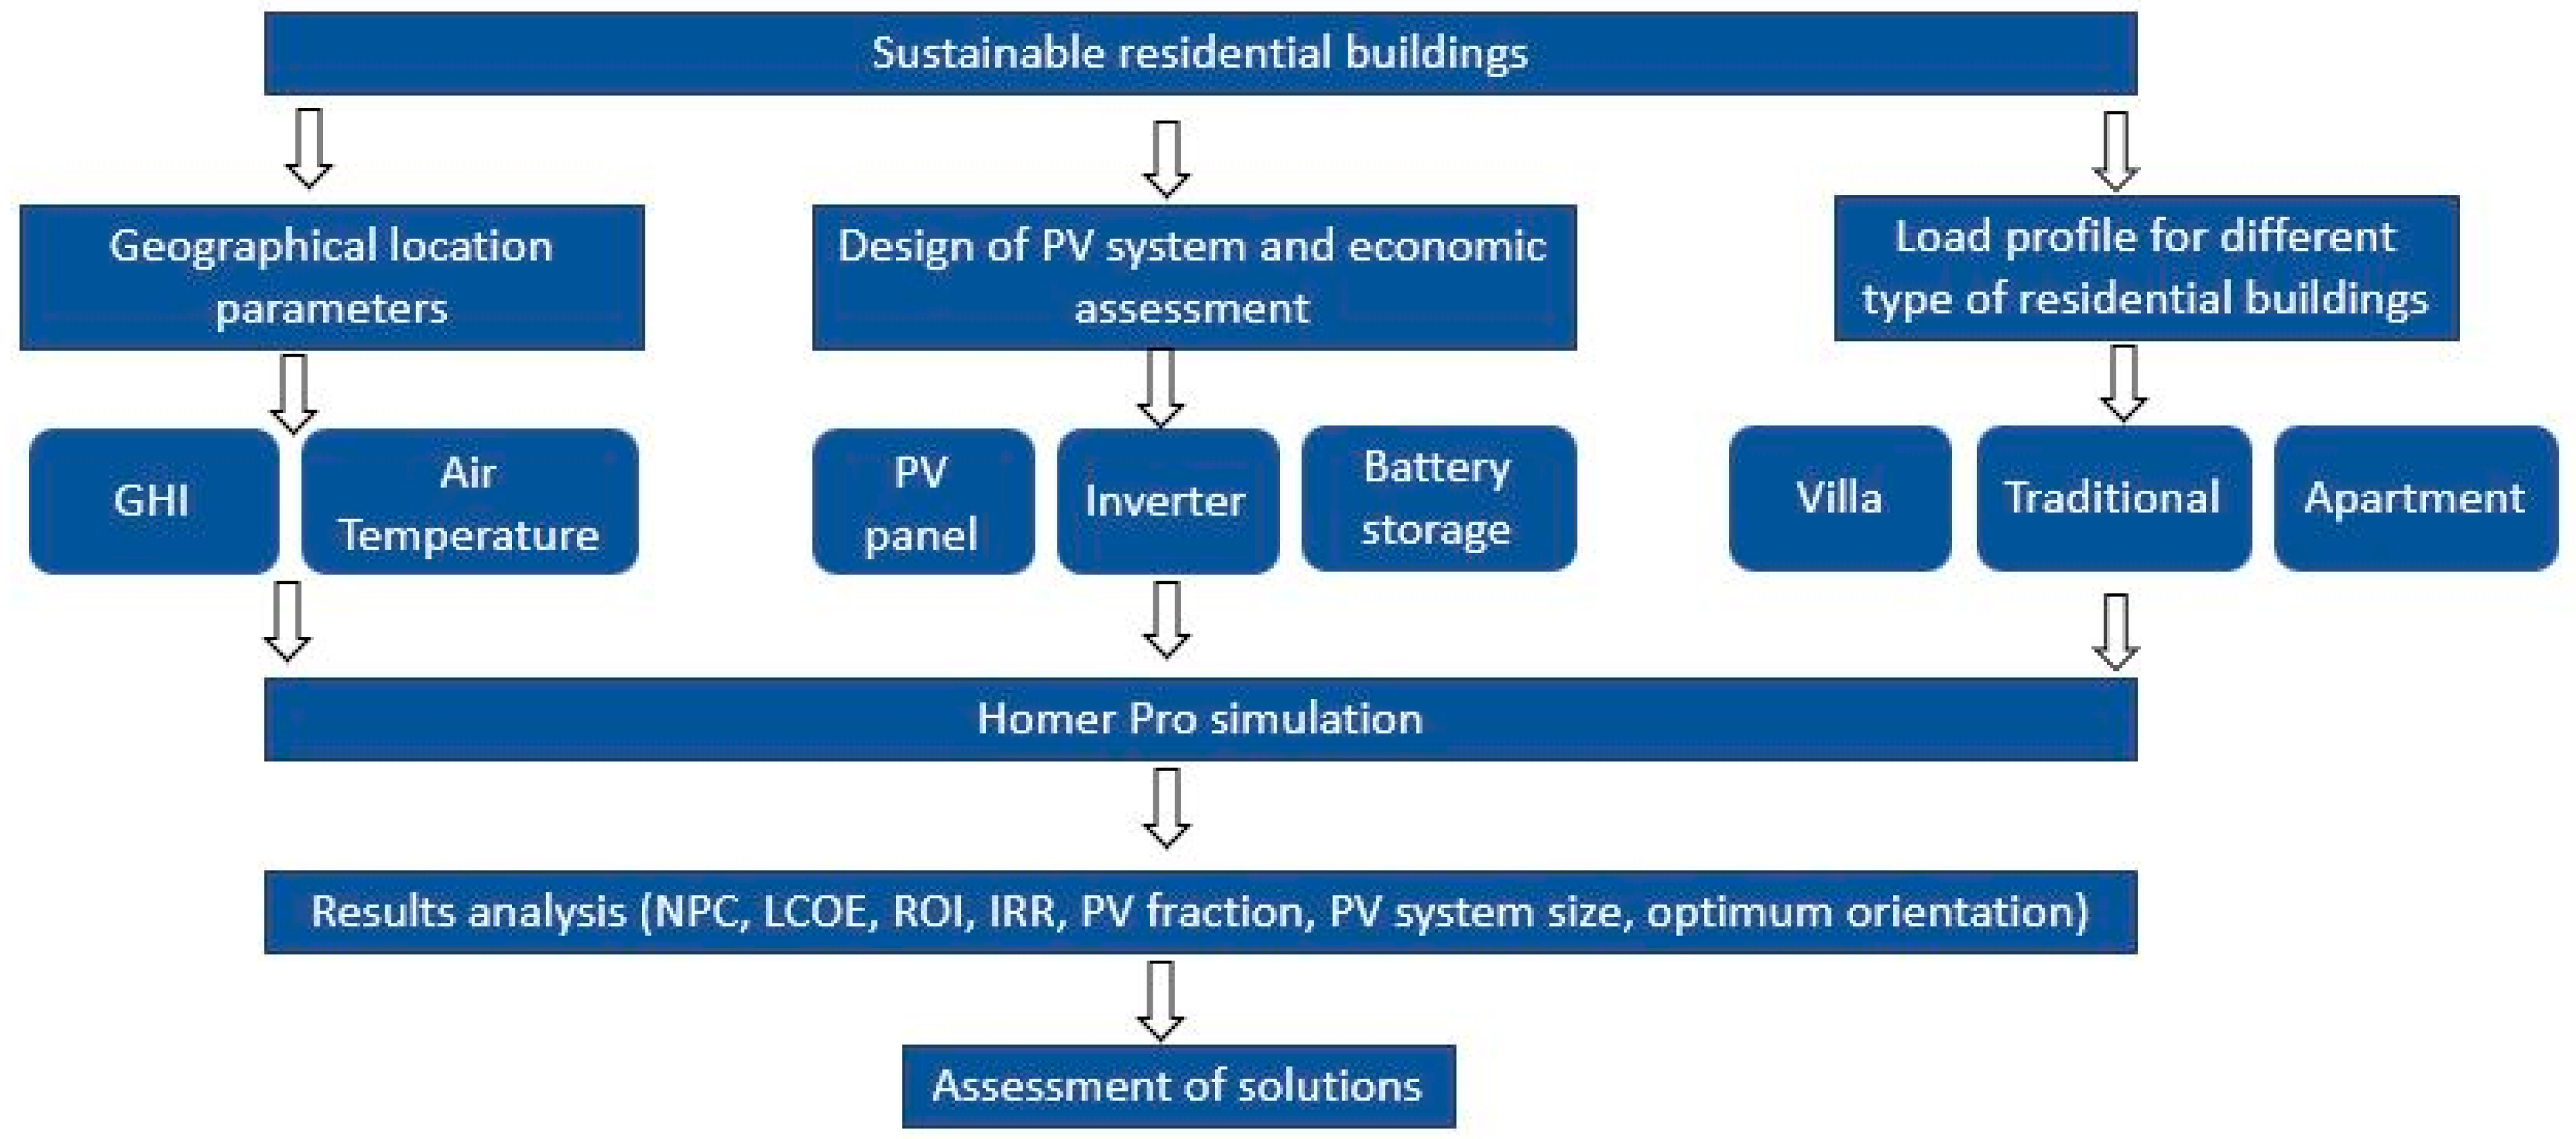
The Saudi Energy Building code was published in 2007 [33]. In 2010, the KSA government made it compulsory that all new housing units have insulated external walls, positively influencing the increased use of thermal insulation in several areas, especially the residential sector [39]. The SEC is responsible for enforcing government standards in new buildings through a visual inspection. If the owners follow the rules, they will connect the electricity to the building.
More recently, Saudi Arabia’s Electricity and Co-Generation Regulatory Authority (ECRA) launched the first system directives to support distribution systems linked to small solar PV systems to organise metering alignment and plan for future technical developments. The guidelines relate to all PV systems 1 kW to 1 MW situated on one site [35].

3. Methodology

The proposed research method was determined based on latest developments in the technical/economic feasibility of rooftop PV solar systems with battery storage to identify the optimum size of the PV system (including battery) and optimal orientation of the PV panels. The focus was on three main categories: topographical location parameters, design of PV system, and load profile for different types of residential building as shown in Figure 1 actual data were input into the HOMER Pro software (3.13.8 Version).
The technical/economic evaluation for the system configurations under consideration is as shown in Figure 1. A sensitivity analysis examined how economic viability and technological efficiency were affected by variations in the inputs. The software contains a list of simulation results based on characterization of technical parameters of the system. However, our focus in this study is to investigate the technical/economic viability of rooftop PV systems with storage, identify the optimum PV panel size and battery capacity to maximize reduction in demand from the grid, and to identify the optimum orientation of rooftop PV panels to maximize electricity generation.

3.1. Homer Pro Software

Based on a review of 19 software packages to size, plan, and assess renewable energy sources (RES), Al Garni and Awasthi [40] determined that the HOMER Pro software, established and validated by NREL, was the easiest and quickest package to use. Version 3.13.8 was used in this project. HOMER is a hybrid software system for designing stand-alone electric power systems and was used here to find the minimum cost design from the available options. A review also was conducted of recent projects using HOMER Pro to analyze the application of PV systems to domestic dwellings to demonstrate the impact of the primary pivotal factors on optimising the system [1,19,24,41].
Given the electrical loads, technical specification, component costs, system controls and constraints and available renewable resources (i.e., solar radiation), HOMER designs an optimum power system to meet the required loads. HOMER utilises life cycle valuation to grade the systems. The process also automatically executes a sensitivity evaluation of the design according to the primary parameters, including availability of resources and the prices of components [40].

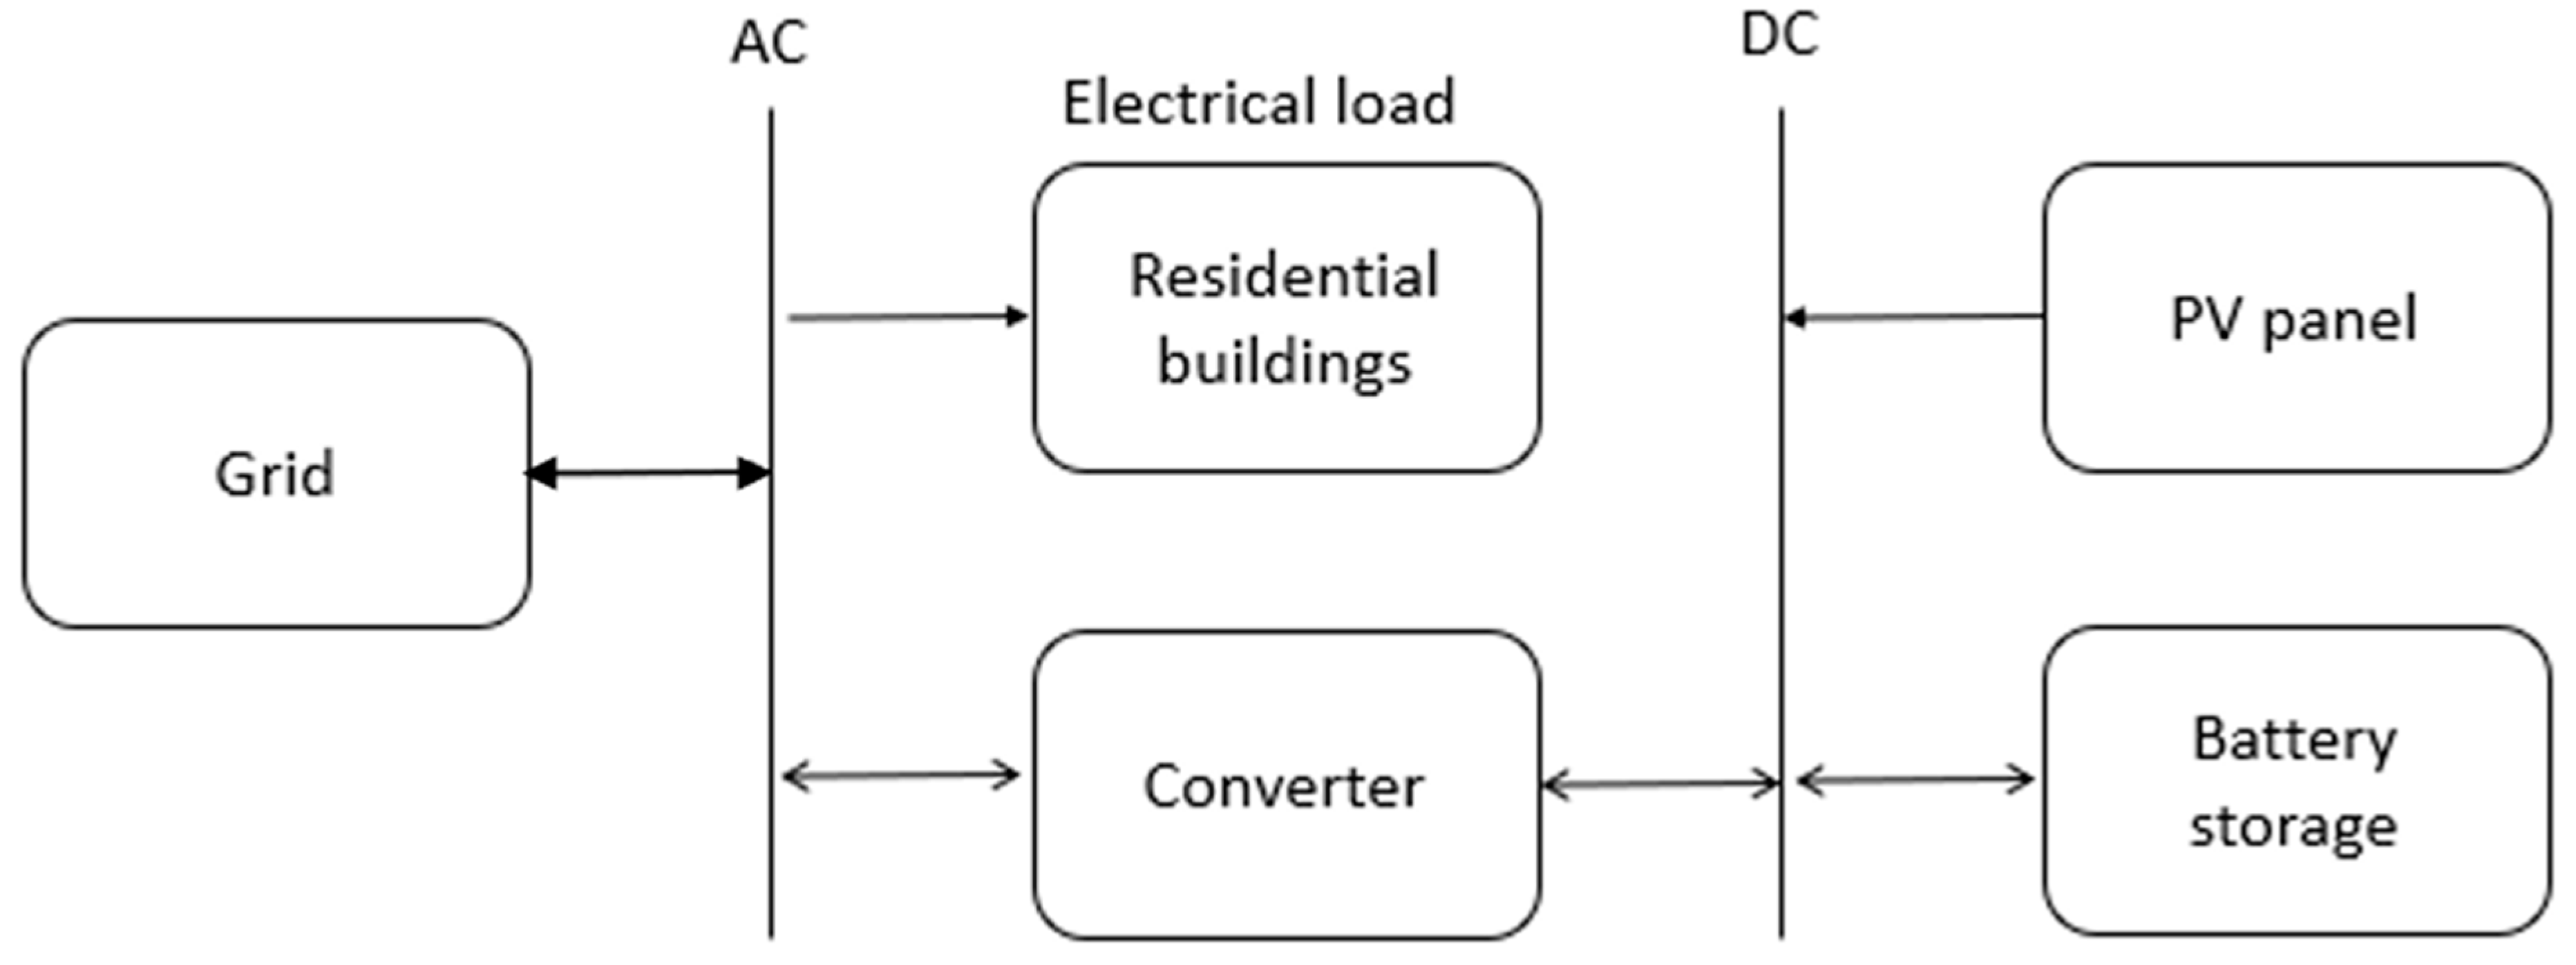
3.2. Design of Solar PV System

3.2.1. System Configuration

The configuration of the Integrated Energy System (IES) in the HOMER Pro software has two buses, an AC bus and a DC bus. The grid links to an AC bus and the PV panel and battery storage link to a DC bus. Between them (see Figure 2), there is an electrical load, a residential building, a villa, traditional house or apartment, connected to the grid and also connected to the PV and battery storage system through a converter.

3.2.2. PV Orientation and Battery Storage

Two parameters, azimuth and tilt angle, determine the PV array orientation. With HOMER, zero azimuth is due south, with positive values facing west. This study considers only the fixed-tilt or fixed-slope system, which maintains the PV array at a tilt or slope substantially equal to the latitude to maximize annual production of PV energy. For fixed-azimuth systems, the azimuth angle is fixed at 0° in the northern hemisphere and 180° in the southern. When HOMER Pro assessed PV system output, it took the tilt angle as the latitude of Neom city and the PV output was simulated for a range of tilt angles from 19° to 30°, in increments of 1 degree.
The battery is assumed to be ideal and, using the Idealized Storage model, the power and energy can be sized independently. This model assumes the discharge is flat and the supply voltage remains more-or-less constant throughout the discharge cycle. All that is required is to input the nominal capacity (usually ampere-hours) and HOMER will use that value as the actual storage capacity.
Hartner et al. [32] found that the optimum size of PV systems is affected by the difference between the variable components, retail prices including grid-related costs, taxes, payments to finance support schemes for renewables, and the price of the feed-in tariff.

3.3. KSA Load Profile and Type of Data

This research assesses the household load profile and total energy consumption by each of the three types of residential building, villa—on two floors, traditional—on one floor, and apartment, which is located in a building with two floors each containing four apartments. Rooftop areas by different types of houses are as shown in Table 1 according to the Housing Statistics Bulletin for 2019 [42].
This study is based on actual KSA household load profiles for the different types of residential dwellings in 2018 in hourly time steps as provided by SEC (Personal Communication, 30 June 2020). The peak load demand for all residential houses is in July due to high ambient temperatures and general reliance on air conditioning. Electricity demand increases significantly from 6 a.m. till 3 p.m. when it reaches its peak. Then, the electricity demand for all housing types decreases to reach its lowest level at 5 am, as illustrated in Figure 3.
The available rooftop area is an average area, excluding the staircase of 15–20 m2 (data provided by Ministry of Housing, Personal Communication, 23 July 2020). There are several other factors affecting available rooftop area such as water tanks, AC units, etc., but at, the moment, data on the space occupied is unavailable. Therefore, this study took into consideration only the staircase footprint area and assumed, following Dondariya et al. [43], that it requires approximately 10 m2 to install a 1 kW PV system.

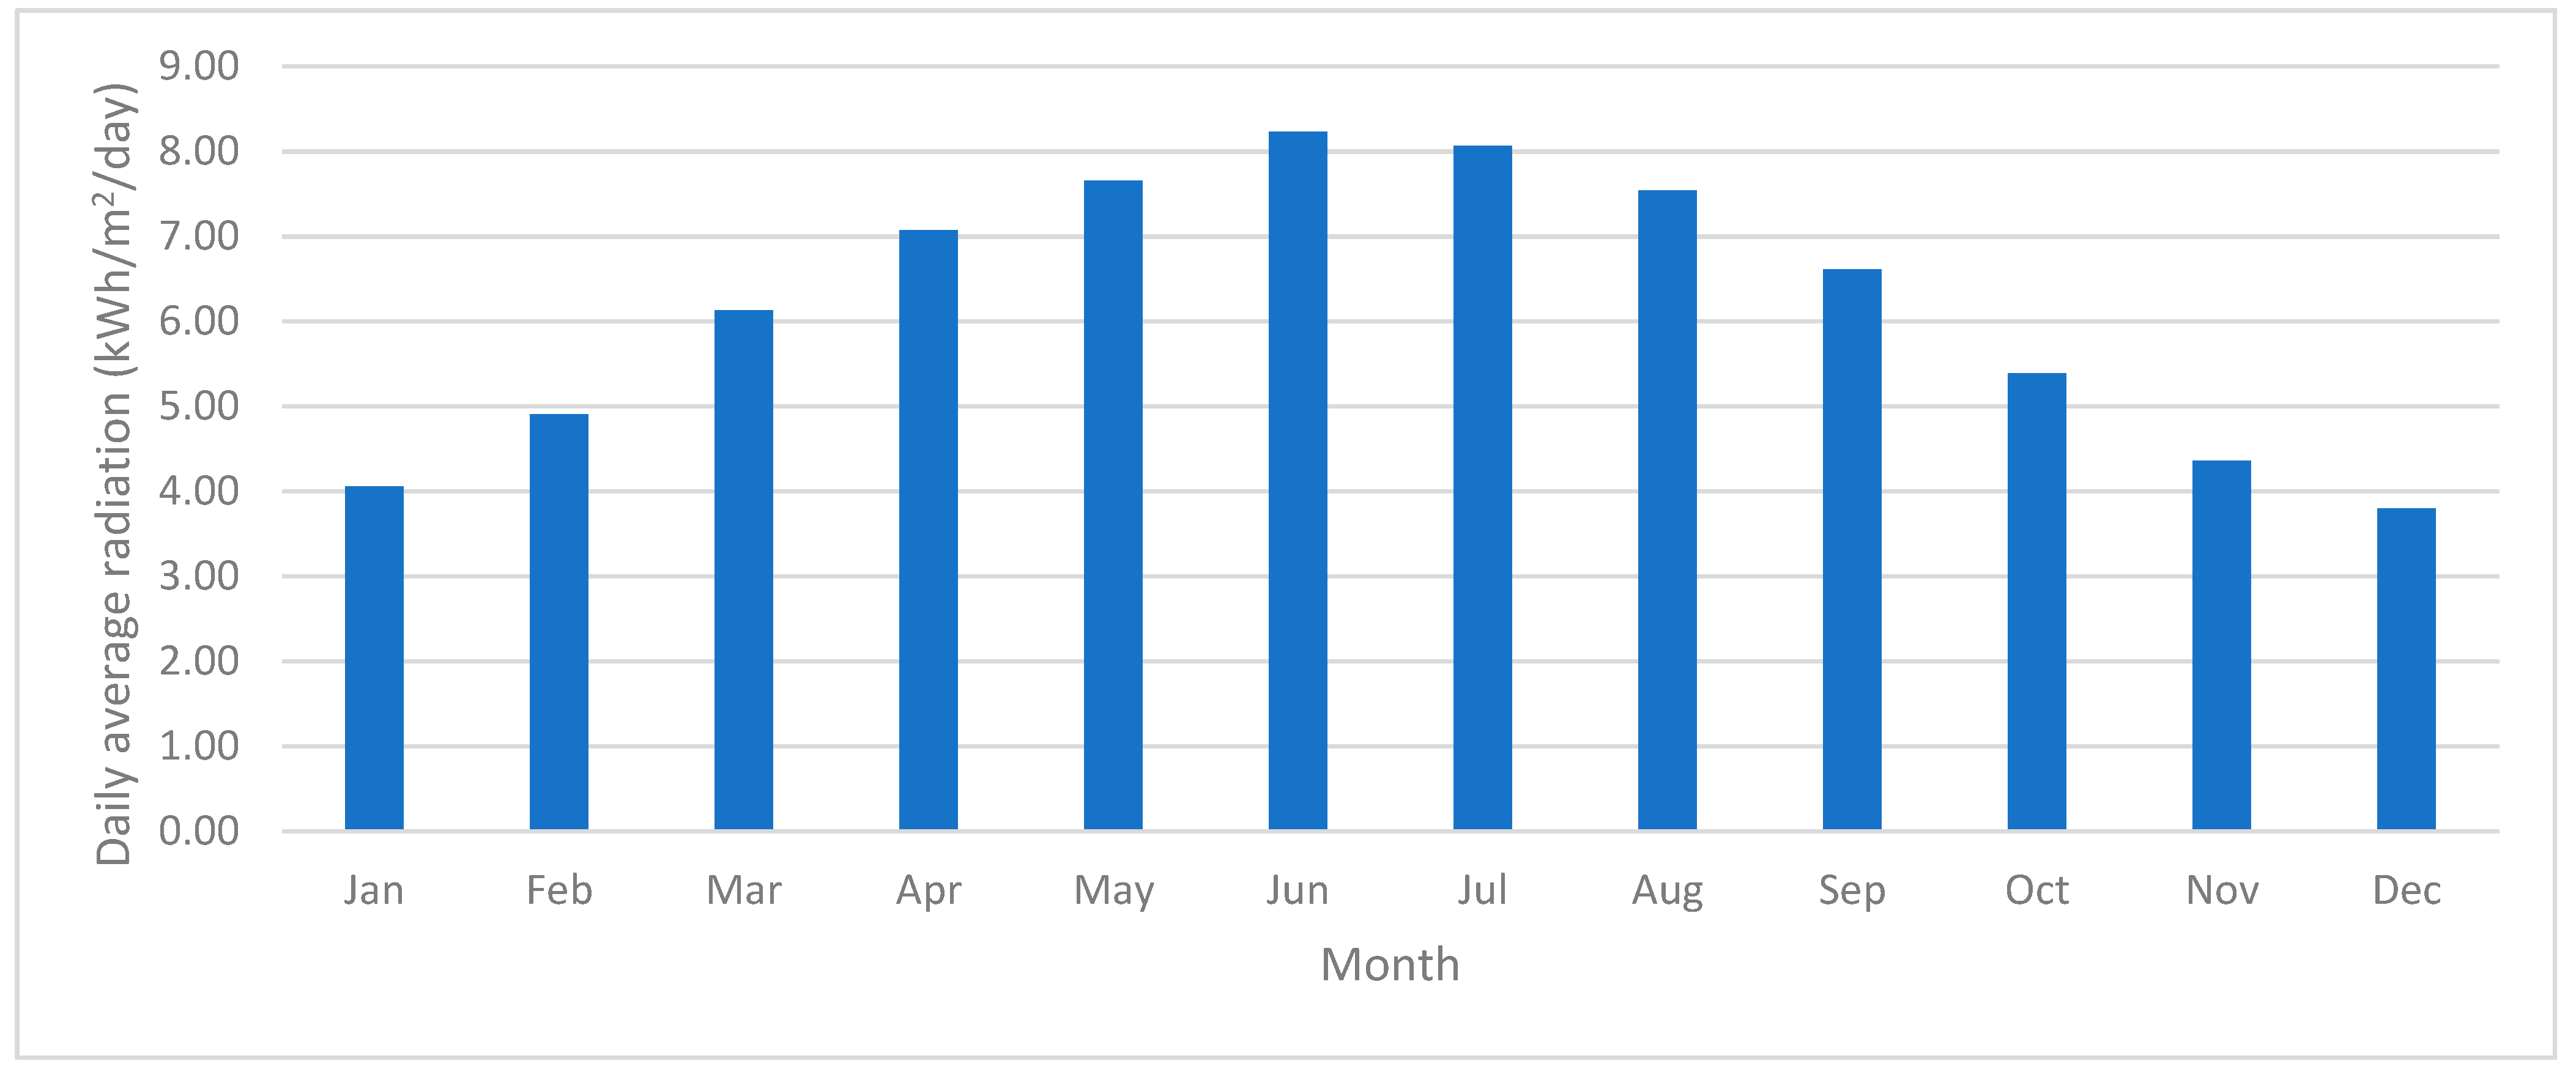
3.4. Geographical Location Parameters

3.4.1. Global Horizontal Irradiance (GHI)

This study used data provided by NASA Surface Meteorology and Solar Energy [44], stating that the solar irradiation fluctuated between 3.93 and 8.17 kWh/m2/day, with a yearly mean solar irradiation of 6.14 kWh/m2/day, see Figure 4.

3.4.2. Air Temperature

Figure 5 presents Neom city’s monthly average day-time air temperature as collected by NASA, obtained from the General Authority of Meteorology and Environmental Protection for the period 2009 to 2019 (Personal Communication, 15 June 2020). The maximum temperature for 2019 was 32.4 °C in July, though the temperature usually remains over 30 °C during the period extending from May to September. The ambient temperature profile will be a factor when determining PV efficiency, because HOMER Pro computes the output power of the PV array taking into consideration the temperature of the cell. In this study, HOMER Pro was updated to use the NASA data.

3.5. Economic Parameters

The Net Present Cost (NPC) and LCOE are the primary economic parameters used to classify various system arrangements. NPC computes the current discount rate required for installing and operating the entire system over the lifetime of the project, less the current earnings, as indicated in Equation (2).
NPC = C a n n C R F   ( i , N p r o j )
where:
  • Cann: the annualized cost.
  • i: the annual real discount rate (%).
  • Nproj: project lifetime (year).
  • CRF (i, Nproj): capital recovery factor.
The LCOE determines the mean cost per annum of the electrical energy produced by the system, as indicated in Equation (3)
LCOE = C a n n E s e r v e d
where:
  • Eserved: total electrical load served (kWh/year).
ROI is the yearly cost savings relative to the initial investment and is equal to the average yearly difference in nominal cash flows over the project lifetime divided by the difference in capital cost. HOMER Pro calculates the return on investment (ROI) using Equation (4):
ROI = i = 0 R   p r o j C i , r e f     C i R p r o j ( C c a p     C c a p , r e f )
where:
  • Ci,ref = nominal annual cash flow for base (grid) system,
  • Ci = nominal annual cash flow for IES,
  • Rproj = project lifetime (year),
  • Ccap = capital cost of the IES, and
  • Ccap,ref = capital cost of the base (grid) system.
IRR is the discount rate at which the base case and IES have the same NPC. HOMER Pro computes the IRR by determining the discount rate that makes the present value of the difference of the two cash flow sequences equal to zero. Payback is an indication of how long it would take to recover the difference in investment costs between the base system and the IES. The discount payback period is more reliable when seeking to determine the profitability of a project.
The economic data used in the simulations are listed in Table 2. The more important parameters for sizing of PV systems are the average hourly load profile data, GHI, and ambient temperature data. HOMER Pro then estimated the system size. The lifetime of this project was to be 25 years. The selected PV module was mono-crystalline silicone with a nominal power rating 0.345 kWp with a lifetime of 25 years. The capital cost of the PV system was estimated using the IRENA [45] costs database published in 2020 and validated by quotations collected from Saudi suppliers. For battery storage, it used “SonnenBatterie” lithium ion with 12 kWh capacity and 10-year lifetime, selected because of the built-in battery inverter and battery management system.
Relevant financial factors such as likely inflation and discount rates in the KSA were acquired from SAMA [49], with inflation rate 1% and discount rate 2.25%.

4. Results

4.1. Economic Analysis

The investigation of economic feasibility of an electricity supply grid, solar panels and battery storage (IES) includes NPC, LCOE, ROI, IRR, and DPBP. Broadly, NPC and LCOE are good cost comparison indicators for solar rooftop PV systems with battery storage and ROI, IRR and DPBP are used to measure their financial profitability which might vary by different dwelling types.
The cost of electricity in the KSA is relatively cheap due to government subsidy. The current tariff for electricity is divided into two segments; the base tariff is $0.06 per kWh for the first 6000 kWh and $0.09 per kWh thereafter (see Table 2). This study explores the application of new tariff rates across all three types of residential units within the IES to make the PV system economically viable. Table 3 presents the results of the economic parameters for electricity tariffs of $0.06, $0.07, $0.08, and $0.09 per kWh. The assumption is that in all three types of new energy efficient dwellings, the consumption is likely to be less than 6000 kWh per month so, under present arrangements, they would pay at a tariff of $0.06 per kWh. Obviously, as the tariff increases NPC, LCOE, ROI, IRR will increase, and DPBP will decrease. Therefore, clearly, there needs to be a balance in which the price for IES is close to the current price but the tariff will generate a profit.
For all three dwellings considered, an electricity tariff of 0.06 $/kWh is not appropriate as it produces a negative NPC. This means that when the investment period comes to an end, future value of revenues from investment will be negative; that is, investors would lose money, and not make a profit.
For investors, of course, 0.09 $/kWh is the preferred tariff because it gives the highest positive NPC values of $13,669, $8585, and $7153 for the villa, traditional house, and apartment respectively. This level of tariff offers a promising opportunity for homeowners because the future value of the investments will be an additional revenue. The LCOE is highest for the 0.09 $/kWh tariff, but not substantially higher than, for example, 0.08 $/kWh. The difference has little impact on financial outcomes from the investment view.
The 0.09 $/kWh tariff also gives the highest ROI of 3.6%, 2.9%, and 2.6% and the highest IRR, 5.7%, 4.7%, and 4.3% respectively for the villa, traditional house, and apartment. Another advantage associated with the 0.09 $/kWh tariff is that it gives the lowest DPBP. Both the IRR and ROI for 0.09 $/kWh tariff are higher than those of other tariff options. An investment is considered feasible when it has a high ROI and a high IRR. The cumulative sum of ROI and IRR for 0.09 $/kWh tariff option is higher than those of the other tariffs. In terms of DPBP, the 0.09 $/kWh tariff has a shortest period of operation before the initial investment is repaid.
0.06 $/kWh is not recommended because its DPBP exceeds the project lifetime; thus it would not be possible to regain the initial investment after the duration of its life.
When comparing the 0.09 $/kWh tariff for the villa, traditional house, and apartment, it is seen that investment in the villa will be the most profitable due to its high NPC compared with the NPC values for the traditional house and the apartment. Similarly, the 0.09 $/kWh tariff for the villa gives a higher ROI compared with that of the traditional house and the apartment. As expected, the 0.09 $/kWh tariff for the villa is the most advantageous of all the investment options.
Comparison showed that the highest electricity tariffs were the best options for investors for all three residential dwellings in the IES. However, 0.09 $/kWh would be most beneficial to investors. Therefore, the tariff to be recommended would be between 0.07–0.08 $/kWh, and we use 0.08 $/kWh in the rest of the analysis.

4.2. Technical Analysis

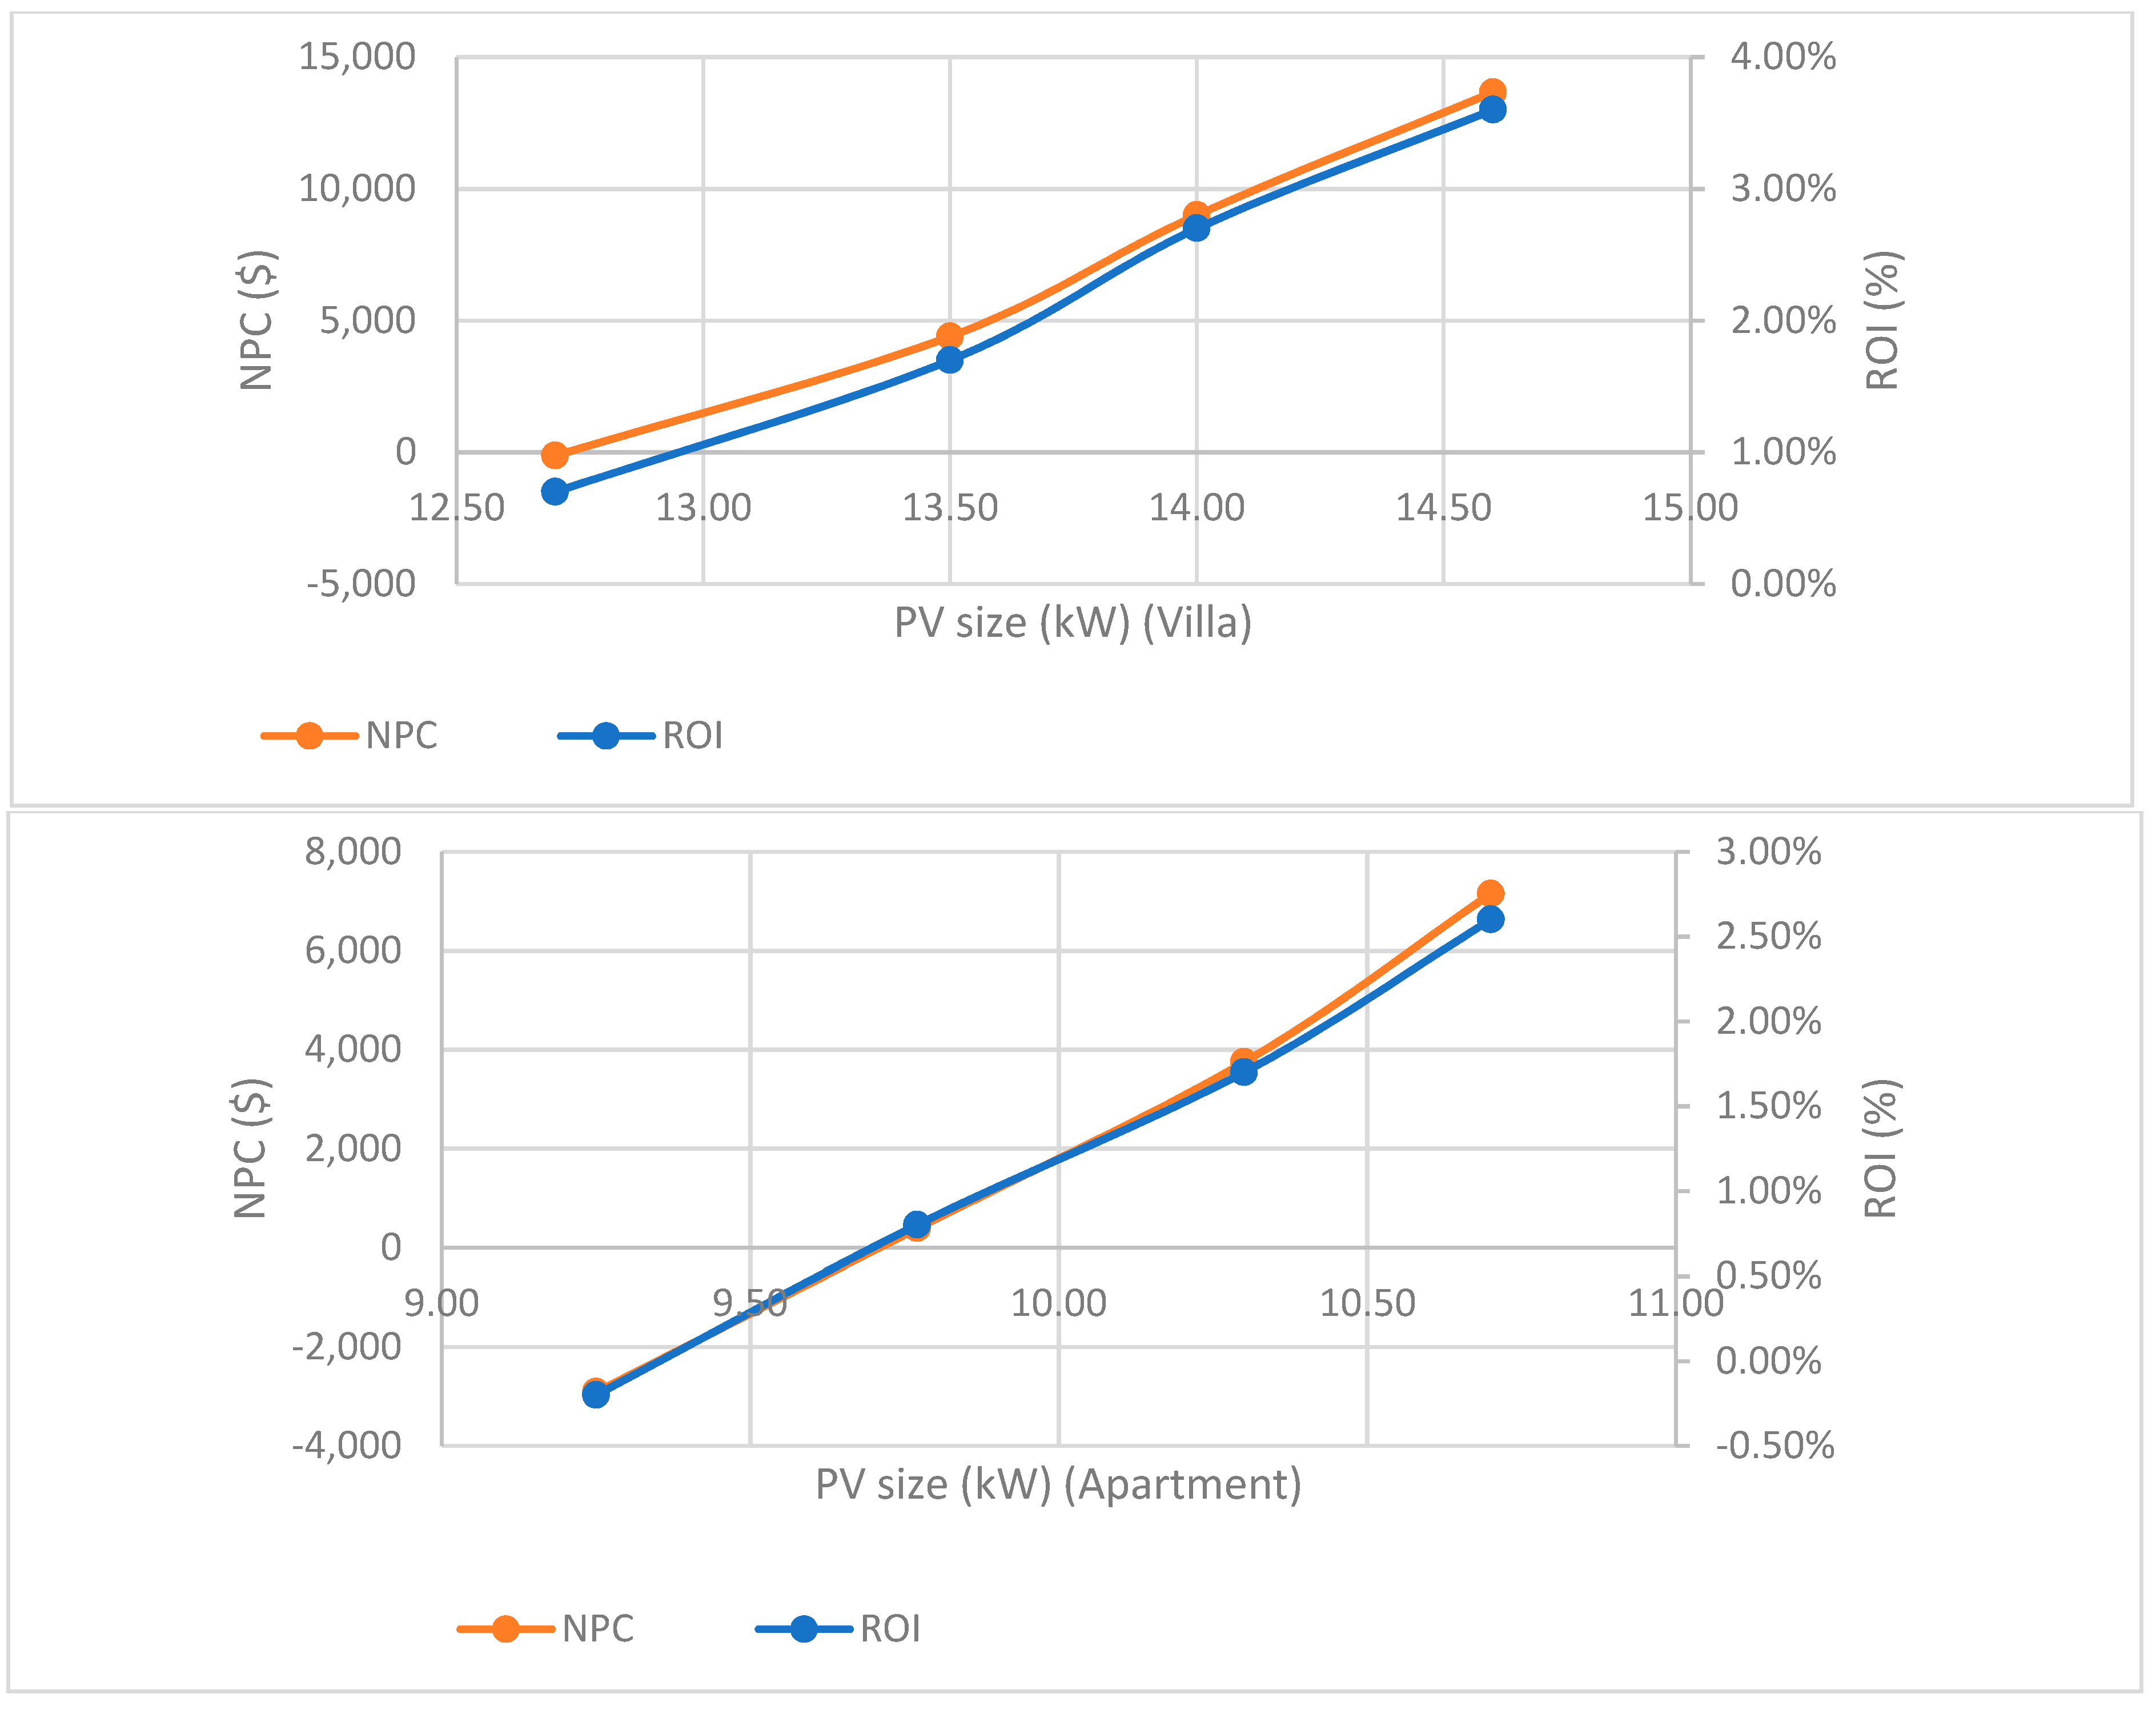
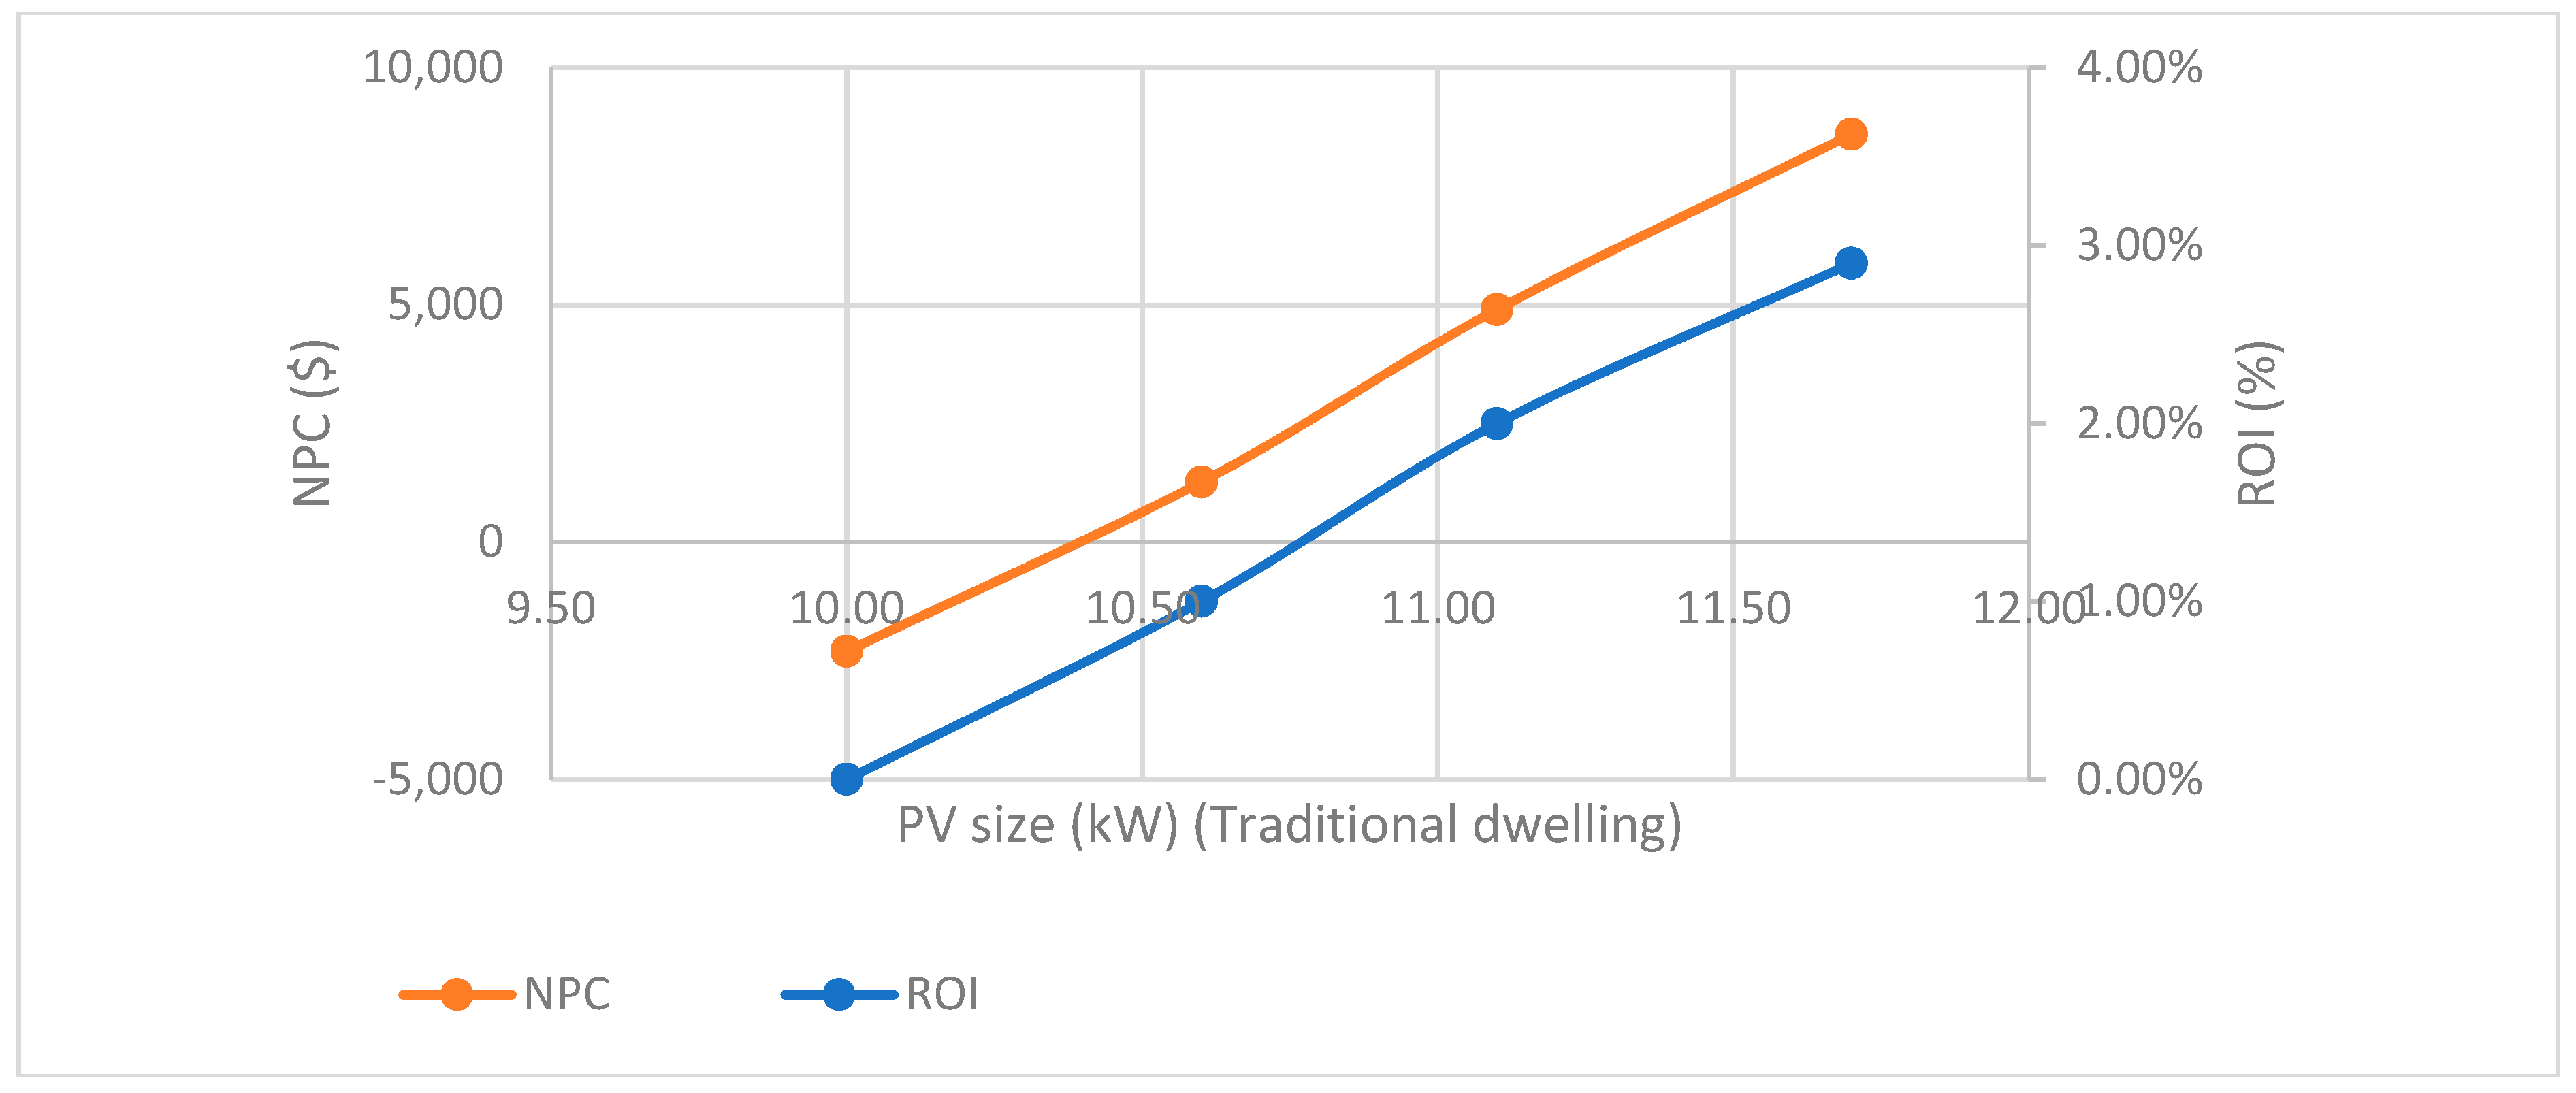
4.2.1. Optimum PV System Size and Battery Storage Capacity

The optimal size of a solar rooftop PV system with battery storage in Neom city is estimated for each dwelling type, with the goal of minimising the total cost of the energy system over the lifetime of the technology including capital cost and price of electricity and taking into account the available roof area. The optimal simulated systems for the villa, traditional house, and apartment were 14.0 kW and 11.10 kW and 10.30 kW respectively (see Table 4). However, the storage capacity for all three types of residential buildings was determined to be a battery with a capacity of 12 kWh, due to bulk purchase of a single type reducing capital and replacement costs to $4800 and $7936 respectively. Our analysis reveals that depending on the price of grid power, it is possible to reduce energy bills by installing solar panels and batteries as peak demand periods from 12:00 to 16:00 (due to air conditioning) coincide with high solar outputs. The savings from offsetting demands from grid recovers solar PV and battery installation cost if tariffs are higher than 0.08 $/kWh.
Table 4 shows that the NPC, assuming a tariff of 0.08 $/kWh for a villa is $9006, is higher than for a traditional house or apartment, due to the larger size of the PV system. The comparison of NPC and ROI with different sizes of PV for villa, traditional house, and apartment are also shown illustrated in Figure 6.
We see the NPC is positive for PV capacities of greater than 12.7 kW for the villa, 10.6 kW for the traditional dwelling, and 9.8 kW for the apartment. The net earnings from electricity cost saving are initially lower than the investment for small PV systems which produce a negative NPC. The ROI is above zero for PVs of greater than 12.5 kW for the villa, 10.6 kW for the traditional house, and 9.8 kW for the apartment.

4.2.2. Assessment of PV Orientation

We have investigated how total solar energy output varies for different tilt angles. Of different tilt angles from 19° to 30°, the maximum PV output for all three types of residential dwellings was achieved for 28°, which is the latitude of Neom city, and facing south. While the PV output increased as the tilt angle increased from 19° to 28°, it declined as tilt angle increased further.

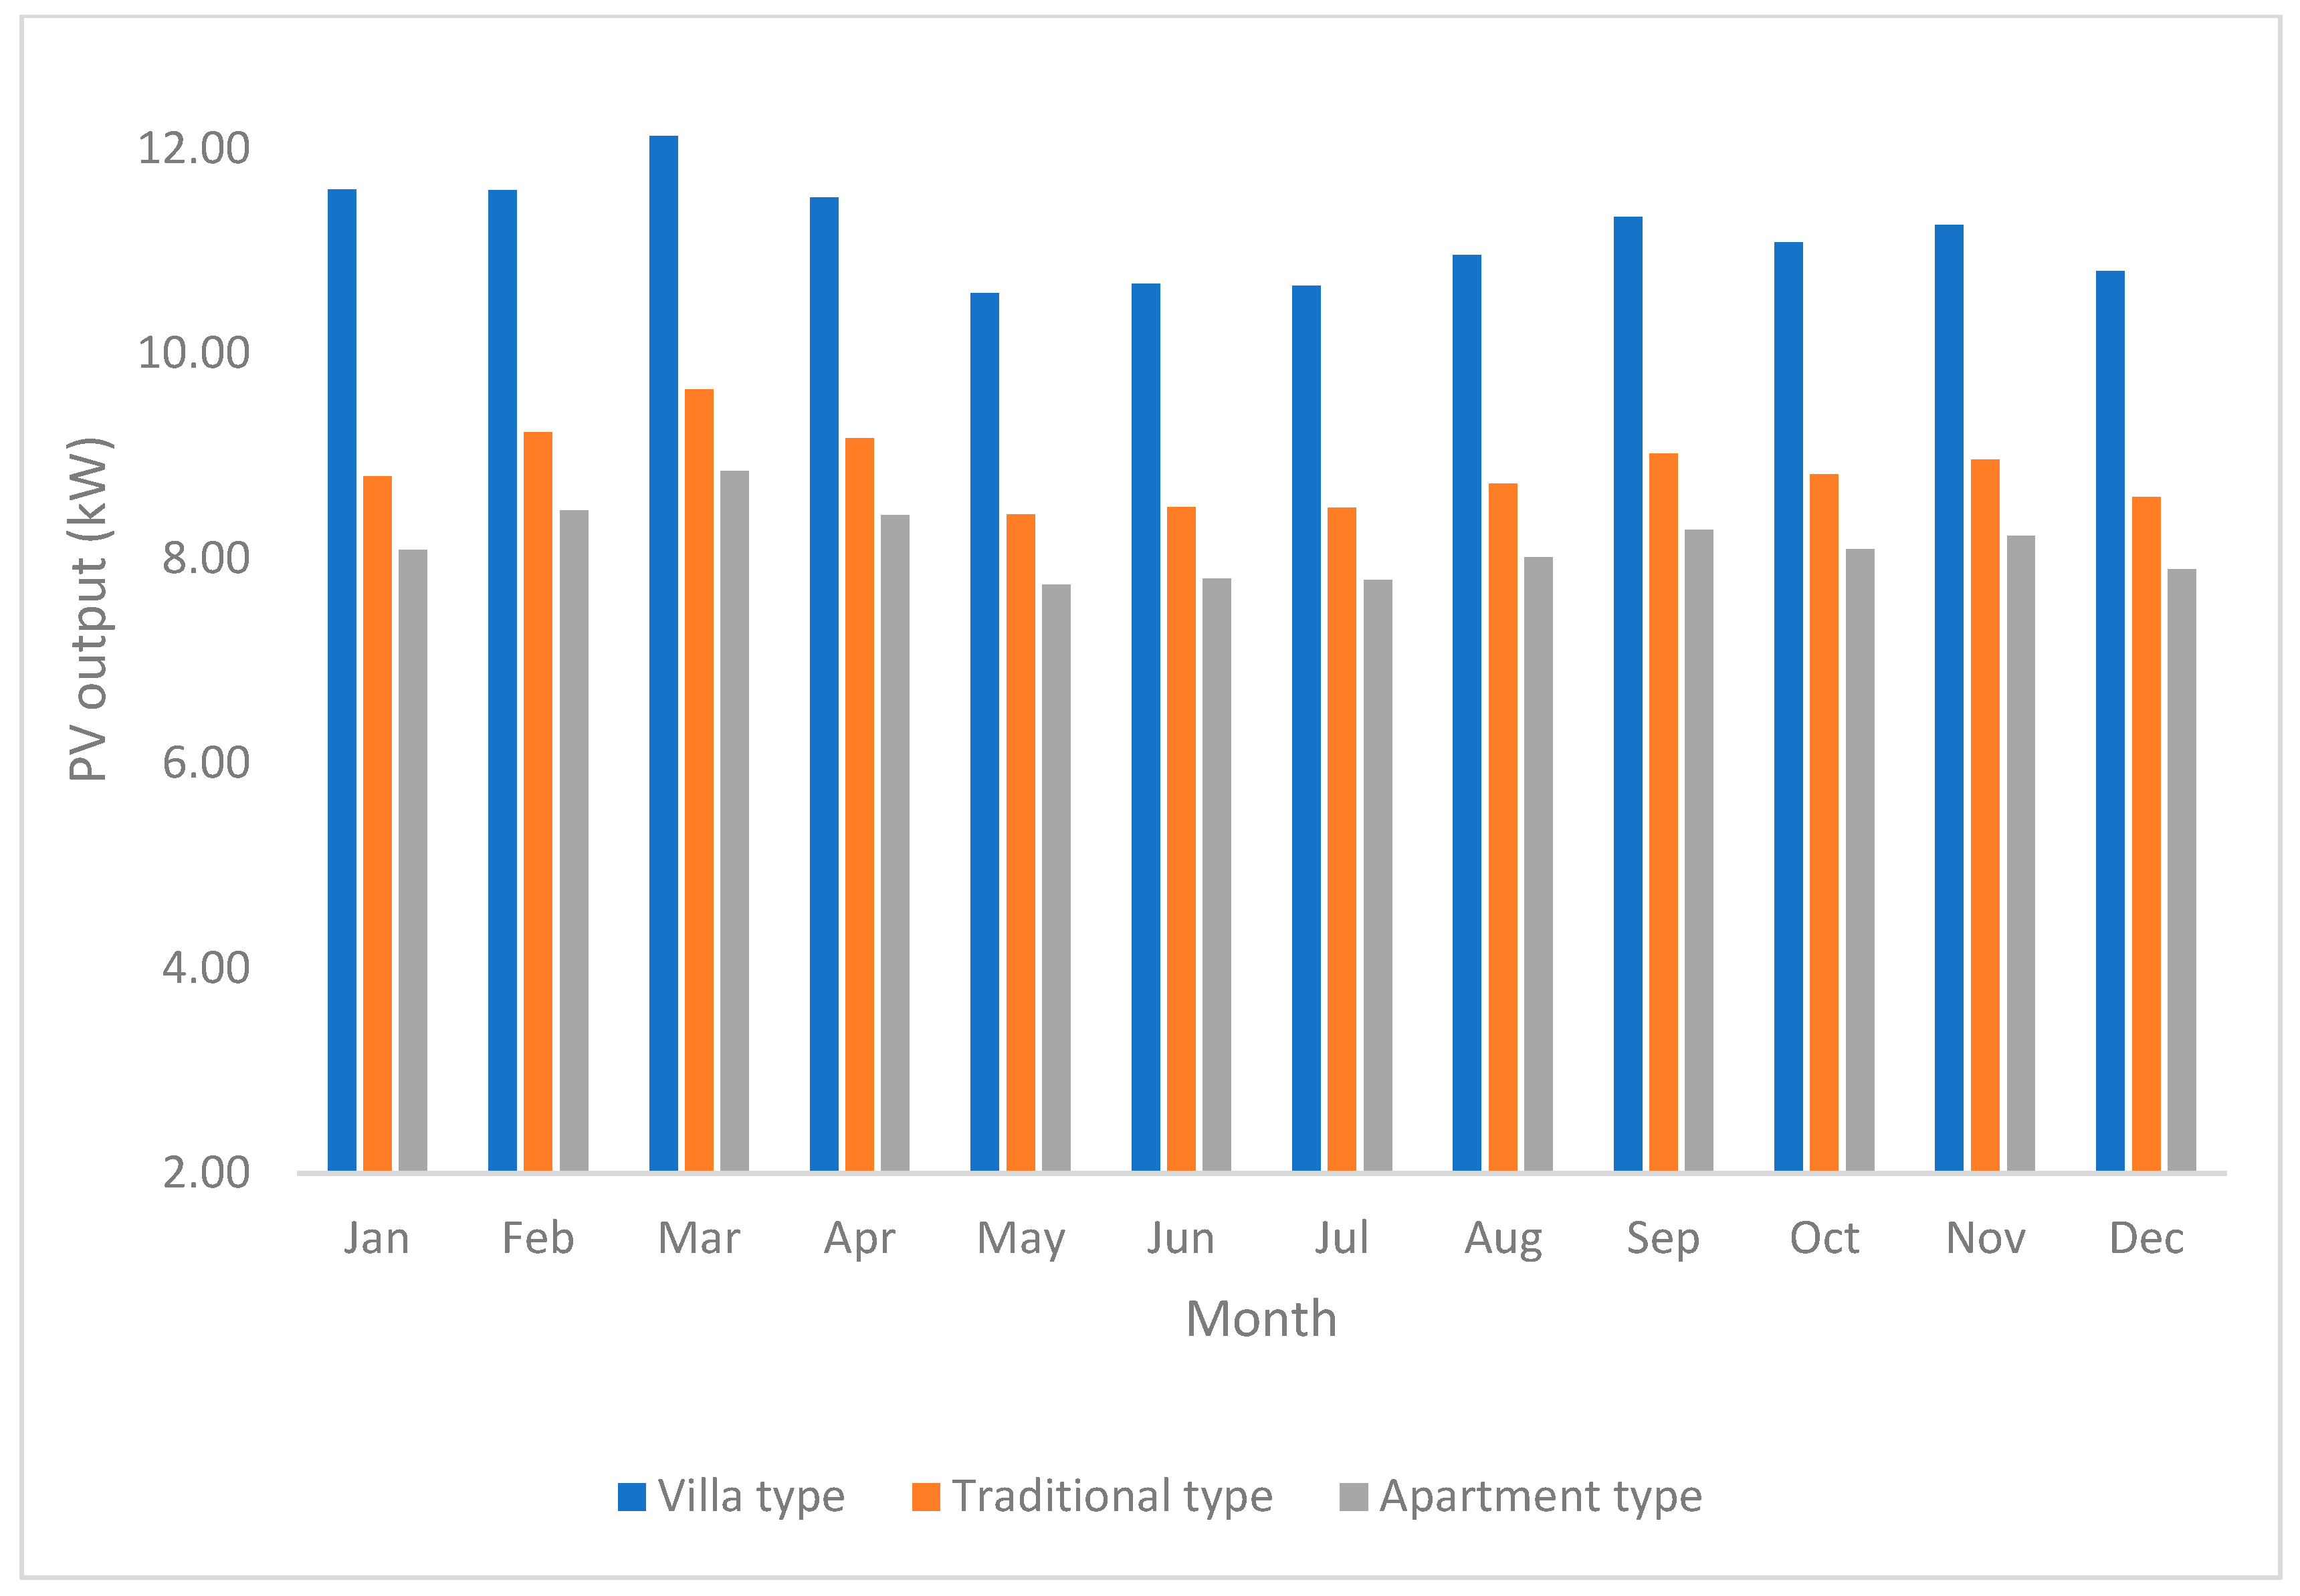
4.2.3. Energy Production

The results of simulation for the monthly average PV output in kW for the three types of dwellings considered are as shown in Figure 7. We see that all three experience a maximum in March, 12.12 kW, 9.65 kW, and 8.85 kW respectively for villa, traditional house, and apartment. We also see that all three experience a minimum in May, 10.59 kW, 8.43 kW, and 7.74 kW. The averages for the three dwellings are 11.14 kW/month for the villa, 8.87 kW/month for the traditional house, and 8.14 kW/month for apartments. The annual battery throughput was 4036 kWh/year for villas, 4028 kWh/year for traditional houses, and 4021 kWh/year for apartments. The total energy production calculated for first year for villas, traditional units, and apartment dwellings is 28,680 kWh/year and 22,617 kWh/year and 20,755 kWh/year respectively. The renewable energy as a percentage of the primary load was 62.4% for villa, 66.5% for traditional house, and 68.2% for the apartment. The rest of the primary load for each residence was provided by the national grid.

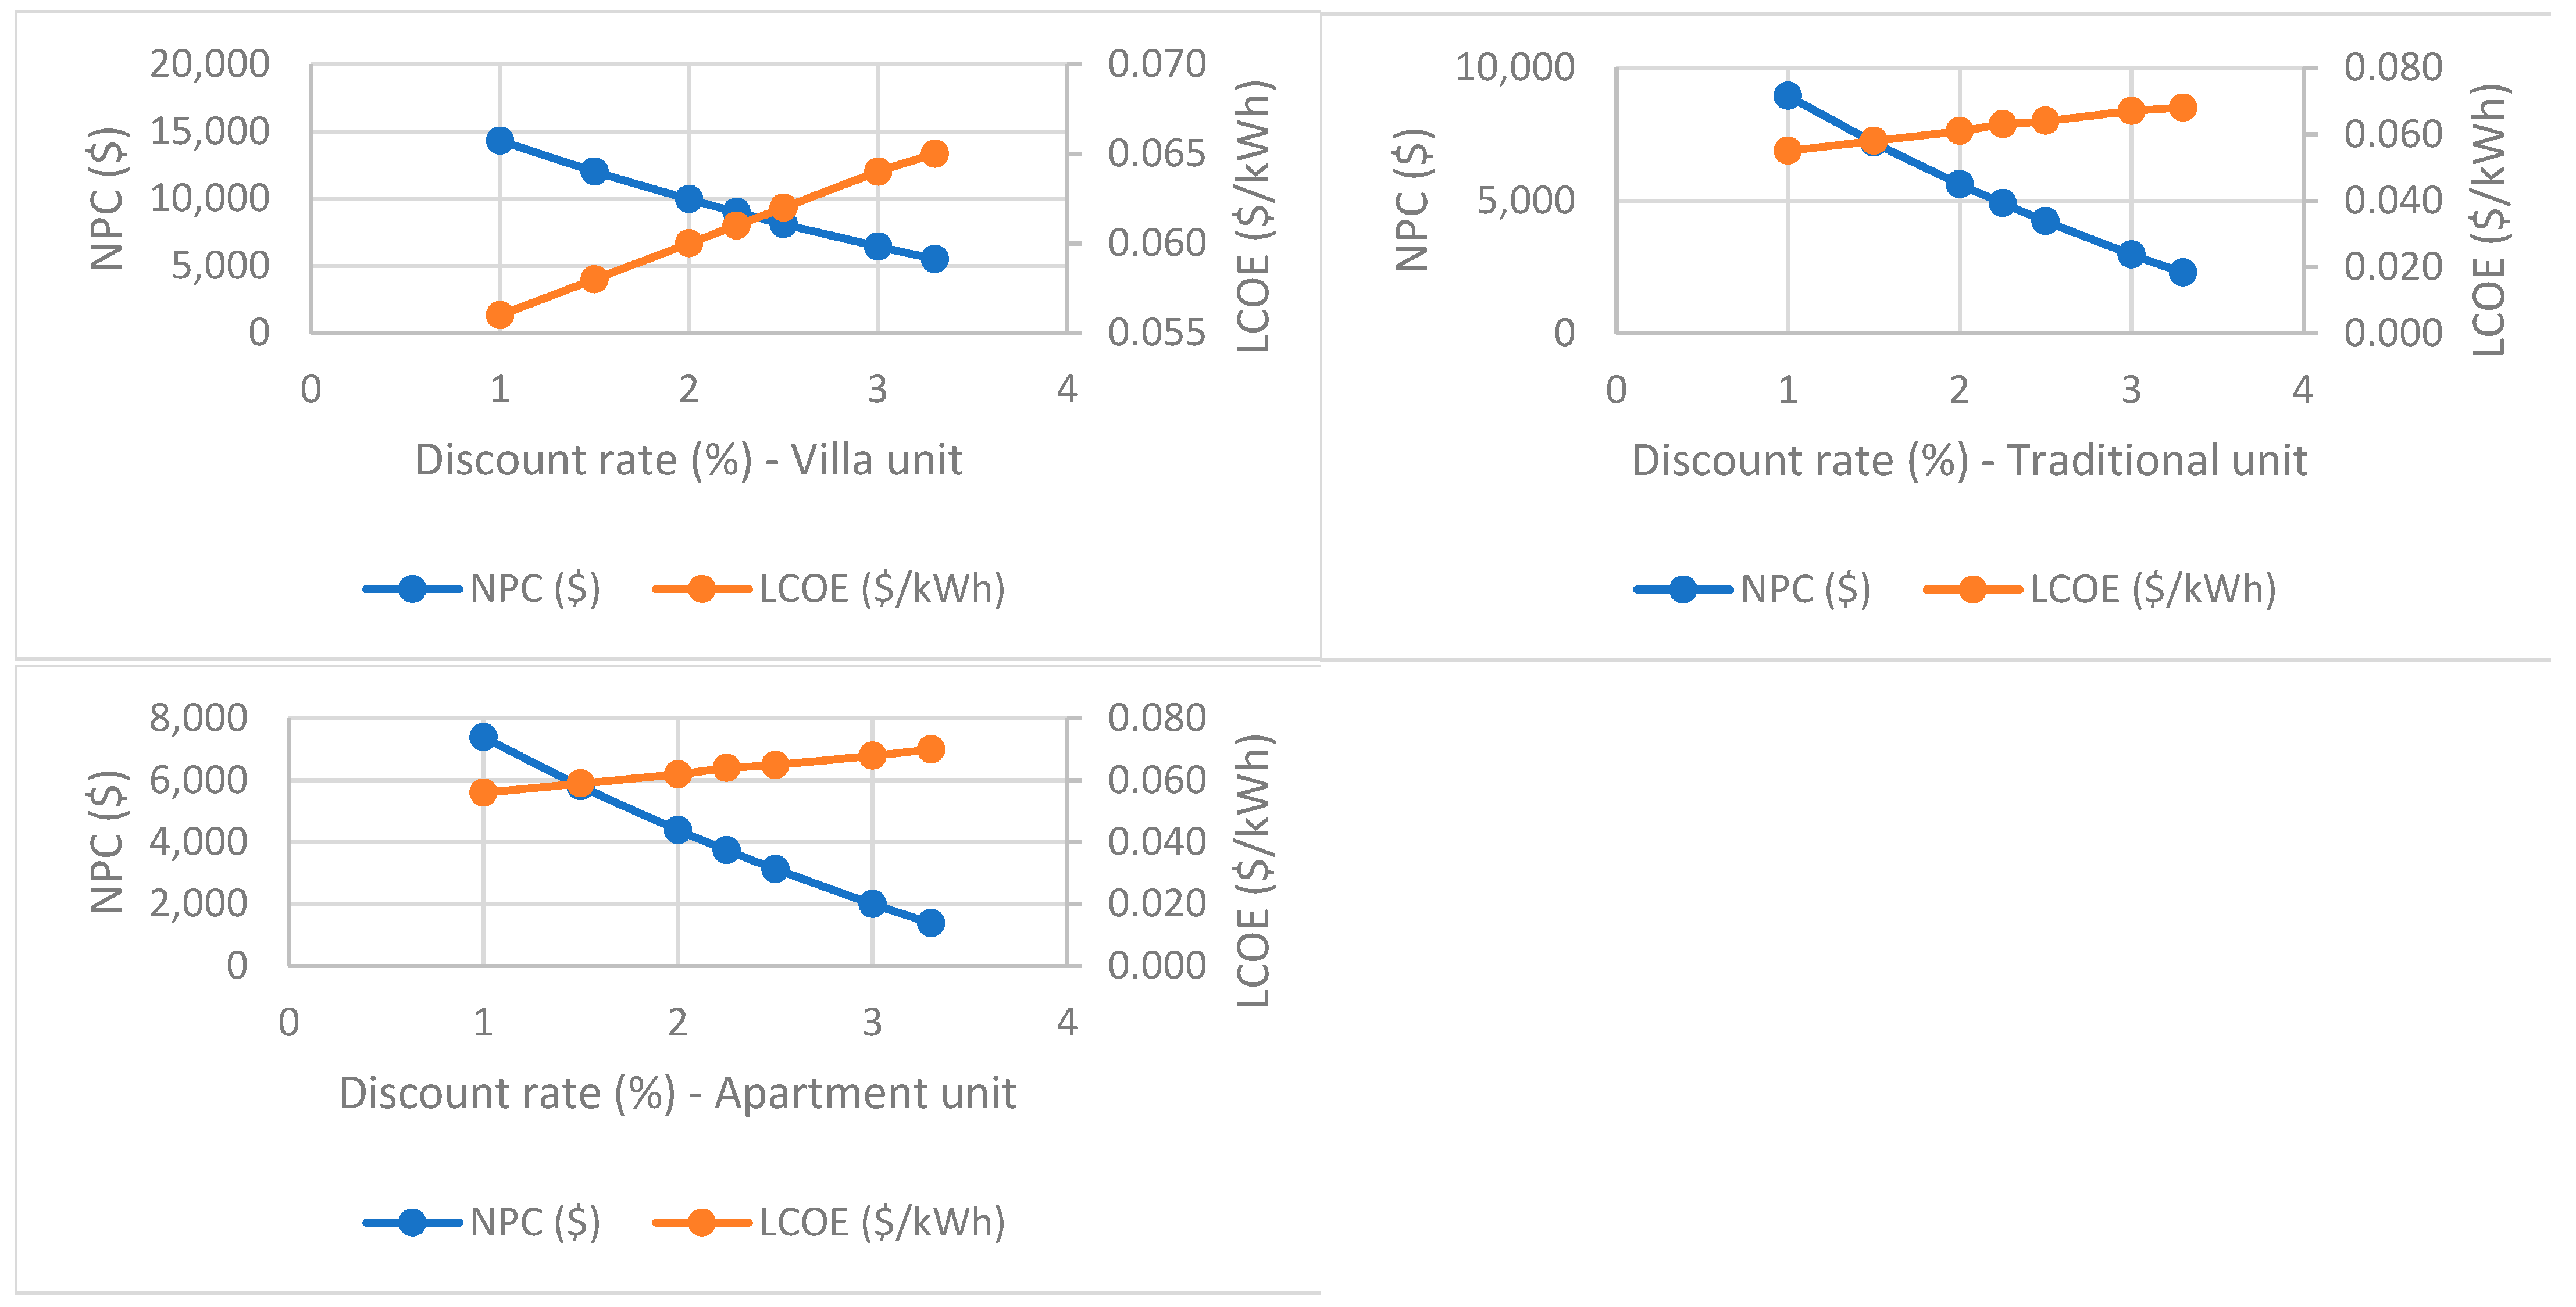
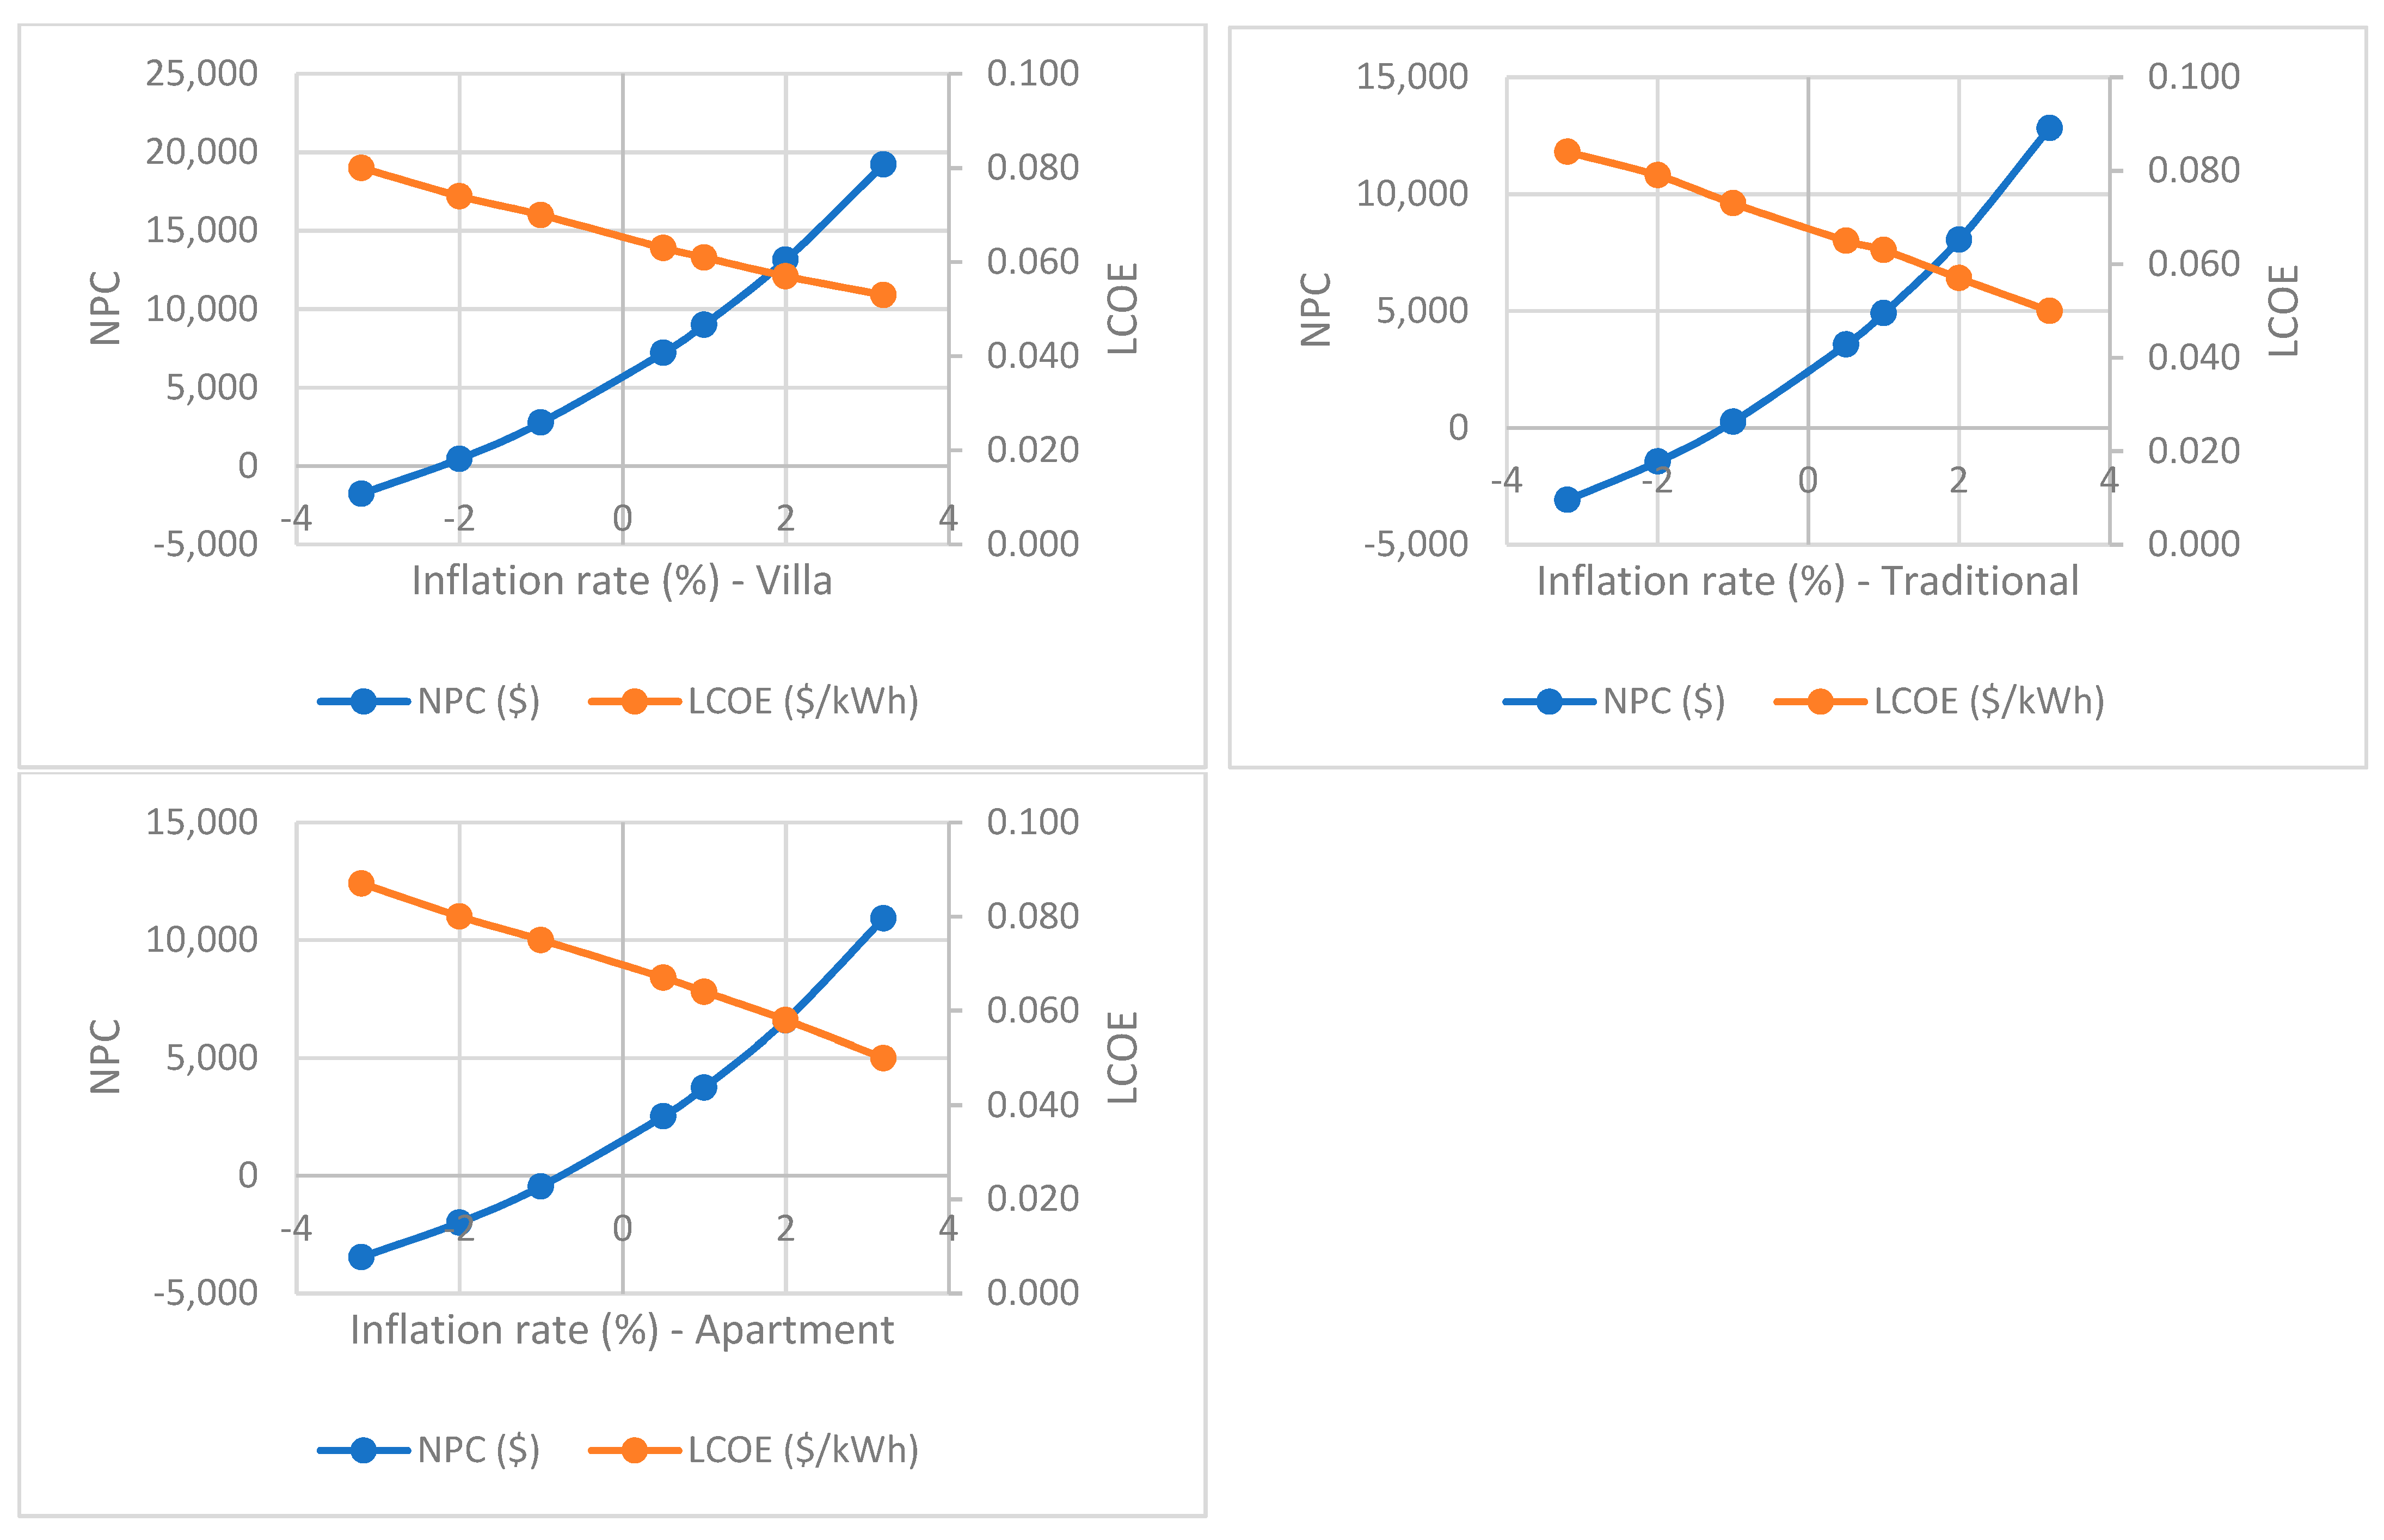
4.3. Sensitivity Analysis

An investigation of economic feasibility was carried out to determine whether the proposed IES was economically viable. The potential volatility of economic factors always makes economic investment forecasting difficult. Here, likely responses to changes in the parameters that drive economic indicators and profitability, including discount rate and inflation rate, are analyzed.
The NPC shows whether the investment is profitable. The impact of the discount rate on NPC, with inflation rate maintained at 1.0%, is shown in Figure 8 for villa, traditional house, and apartment. The trends clearly show that higher discount rates mean lower profitability. In KSA, discount rates for the period from January 2018 up to June 2020 were in the range 1–3.3% [48]. For an investment, the higher the discount rate, the greater the perceived risk, but for a discount rate less than 2.5% the proposed IES is economically feasible.
Between January 2018 and June 2020, the KSA’s inflation rate fluctuated between −3.2% to +3.2% and Figure 9 shows how energy costs depend on the inflation rate. We see LCOE is almost linearly related to inflation rate over the range investigated [49].

5. Discussion

5.1. Economic Aspects

The key economic finding was that the present base rate of 0.06 $/kWh was not a feasible basis for an IES and would result in a negative NPC for all three types of residential dwelling with solar rooftop PV systems. A tariff of 0.06 $/kWh would be loss-making with the DPBP exceeding the project’s lifespan. A new tariff of 0.08 $/kWh would make the investment economically feasible for all three residential dwelling units.
Generally, in those countries around the world that have adopted solar rooftop PV systems with storage, electricity tariffs are higher than in the KSA. Only China is close with 0.08 $/kWh [50]. The relatively cheap tariffs in the KSA adversely affect investment in adoption of low carbon technology, thus the need for a more economically viable electricity tariff to be adopted in the KSA, possibly 0.08 $/kWh for all residential dwelling units.
A long DPBP lowers the attractiveness of investing in installation of PV systems with battery storage. Here the highest electricity tariff of 0.09 $/kWh would obviously be better than the other tariffs, giving a shorter DPBP and better NPC, IRR, and ROI for all three residential dwellings.
The current trend is for the cost of PV and battery systems to decline significantly, which is an important factor when considering investment in solar PV systems. Expansion of the market will reduce equipment and installation costs and make PV systems more viable. Moreover, recent trends in battery technology and battery cost reduction will further enhance the economic feasibility of PV systems. Ellabban and Alassi [34] confirmed that IESs become more attractive with reduced PV system costs and rising electricity tariff rates. Excess power generated in the morning and earlier evenings make batteries economically viable in the city of Neom.
To assess the results, a sensitivity analysis was carried out on the most important financial input parameters to assess the economic feasibility of the project: discount rate and inflation rate. For a constant inflation rate of 1%, the impact of the discount rate on NPC was assessed for all three residential dwelling units. The trends clearly reveal that higher discount rates mean lower profits, and vice versa. The project was economically feasible below a discount rate of 2.5%. Energy costs depend on inflation rate, with LCOE almost linearly related to inflation rate over the range analysed (see also Imam et al. [51]).

5.2. Technical Aspects

This study has identified the optimal PV and battery storage system for each of the three residential building types considered, taking into account available roof area, and reducing to a minimum the cost of the total energy system for the lifetime of the project. The optimal PV system size was found to be 14.0 kW for the villa, 11.1 kW for the traditional house, and 10.3 kW for the apartment. These findings are in line with a published study by Imam et al. [51], who found the optimal PV system for an apartment was 12.25 kW without battery storage.
The optimal battery storage capacity was chosen as 12.0 kWh for each residential dwelling unit because using only the one battery unit for each residence gave considerable savings in capital and replacement costs, improving economic feasibility.
A fixed tracking system was assumed to reduce capital and maintenance costs. The optimal PV orientation was tilt angle 28°, and 0° azimuth angle. These findings are in close agreement with [25,26,51]. These studies used different methods to identify the optimal PV orientation: [25], used satellite-based information, [26] used PVWatts, and [51] used the System Advisor Model.
The PV system and battery storage can meet 62.4% of a villa’s demand, 66.5% of a traditional dwelling, and 68.2% of an apartment. Combined with other renewable technologies such as wind power, the NZEB goal for Neom city seems achievable.

5.3. Limitations of the Investigation

The results obtained in this study were limited by the input parameters to the HOMER Pro software, and to keep the scope of the study within reasonable boundaries, the system was limited to one PV array and a single battery. Other factors such as more precise determination of available rooftop areas, or the impact of electricity export tariffs or, in the future, the development of new cheaper batteries, will all benefit from further investigation.

6. Conclusions

The aim of this research was to assess how Neom city could become less reliant on the grid through the use of solar rooftop PVs with battery storage.
The analysis concluded that the IES is not commercially viable with the current minimum electricity tariff of 0.06 $/kWh, for the first 6000 kWh/month consumed. This tariff gave a negative NPC and a DPBP which exceeded the project’s lifespan. However, the study identified an alternative tariff of 0.08 $/kWh which, for all three residential buildings, made the project economically feasible. However, the KSA attempts to be in the lead in the Gulf region and more generally in the Middle East on alternative energy sources. The use of PV systems should speed up development of renewable energy sources by attracting increased investment due to the financial incentives that would come from its implementation.
The optimal size of PV system was 14.0 kW for the villa, 11.1 kW for the traditional dwelling, and 10.3 kW for the apartment, each with a single battery with 12 kWh capacity. The optimal PV orientation was a south-facing panel with tilt angle of 28°. Fixed tracking was assumed to reduce capital and maintenance costs. Energy production from PV systems and battery storage can provide the energy requirements of about two-thirds of the primary residential loads.

Author Contributions

Conceptualization, N.B.-O.; methodology, N.A. and N.B.-O.; software, N.A.; validation, N.A.; formal analysis, N.A.; investigation, N.A.; resources, N.A. and N.B.-O.; data curation, N.A.; writing—original draft preparation, N.A.; writing—review and editing, N.A. and N.B.-O.; visualization, N.A.; supervision, N.B.-O.; project administration, N.B.-O.; funding acquisition, N.A. Both authors have read and agreed to the published version of the manuscript.

Funding

This research builds onto a MSc thesis which was sponsored by the Saudi Standards, Metrology and Quality Organisation. The thesis, titled ‘Assessment of rooftop PV potential to meet residential loads in the city of Neom, Saudi Arabia’ was submitted by the first author to Cranfield University for the 2019–2020 academic year.

Institutional Review Board Statement

The study was conducted according to the guidelines of the Ethics Committee of Cranfield University (protocol code CU-RIO-POL-2.0 V7 and February 2021).

Informed Consent Statement

Not applicable.

Data Availability Statement

Not applicable.

Acknowledgments

Nasser Alqahtani, the first author, would like to express his gratitude for the financial support he received from the Saudi Standards, Metrology, and Quality Organization in the Kingdom of Saudi Arabia through scholarship programs.

Conflicts of Interest

The authors declare no conflict of interest.

Nomenclature

KSAKingdom of Saudi Arabia
GWGigawatt
MWMegawatt
kWKilowatt
SECSaudi Electricity Company
PVPhotovoltaic
GHIGlobal Horizon Irradiance
NRELNational Renewable Energy Laboratory
CO2Carbon dioxide
HVACHeating, ventilation, and air conditioning
kWhKilowatt hour
SDGSustainable development goal
Euro
NPVNet present value
DPBPDiscount payback period
IESIntegrated energy system
SAMASaudi Arabian Monetary Authority
DNIDirect normal irradiation
IRENAInternational Renewable Energy Agency
Homer ProHybrid Optimization of Multiple Energy Resources
GCCGulf Cooperation Council
°CDegree Celsius
ACAir conditioning
NASANational Aeronautics and Space Administration
ECRAElectricity and Co-Generation Regulatory Authority
DCDirect current
VATValue added tax
GATOR-GCMOMGas, Aerosol, Transport, Radiation, GeneralCirculation, Mesoscale, and Ocean Model
ACAlternative current
$US dollar
NZEBNet zero energy building
LCOELevelized cost of energy
ROIReturn on investment
IRRInternal rate of return
PBPPayback period
NPCNet present cost

References

  1. Shaahid, S.M. Economic feasibility of decentralized hybrid photovoltaic-diesel technology in Saudi Arabia: A way forward for sustainable coastal development. Therm. Sci. 2017, 21, 745–756. [Google Scholar] [CrossRef] [Green Version]
  2. Felimban, A.; Prieto, A.; Knaack, U.; Klein, T.; Qaffas, Y. Assessment of Current Energy Consumption in Residential Buildings in Jeddah, Saudi Arabia. Buildings 2019, 9, 163. [Google Scholar] [CrossRef] [Green Version]
  3. Asif, M. Growth and sustainability trends in the buildings sector in the GCC region with particular reference to the KSA and UAE. Renew. Sustain. Energy Rev. 2016, 55, 1267–1273. [Google Scholar] [CrossRef]
  4. Tsalikis, G.; Martinopoulos, G. Solar energy systems potential for nearly net zero energy residential buildings. Sol. Energy 2015, 115, 743–756. [Google Scholar] [CrossRef]
  5. Gielen, D.; Boshell, F.; Saygin, D.; Bazilian, M.D.; Wagner, N.; Gorini, R. The role of renewable energy in the global energy transformation. Energy Strategy Rev. 2019, 24, 38–50. [Google Scholar] [CrossRef]
  6. Albalawi, H.; Eisa, A.; Aggoune, E.H.M. Energy Warehouse—A New Concept for NEOM Mega Project. In Proceedings of the 2019 IEEE Jordan International Joint Conference on Electrical Engineering and Information Technology (JEEIT), Amman, Jordan, 9–11 April 2019; pp. 215–221. [Google Scholar] [CrossRef]
  7. Government of Saudi Arabia. Vison 2030 Kingdom of Saudi Arabia; Report 1–85; Government of Saudi Arabia: Riyadh, Saudi Arabia, 2016.
  8. Ali, F.; Ahmar, M.; Jiang, Y.; AlAhmad, M. A techno-economic assessment of hybrid energy systems in rural Pakistan. Energy 2021, 215. [Google Scholar] [CrossRef]
  9. Kosmadakis, I.E.; Elmasides, C.; Koulinas, G.; Tsagarakis, K.P. Energy unit cost assessment of six photovoltaic-battery configurations. Renew. Energy 2021, 173, 24–41. [Google Scholar] [CrossRef]
  10. Li, C.; Zhou, D.; Zheng, Y. Techno-economic comparative study of grid-connected PV power systems in five climate zones, China. Energy 2018, 165, 1352–1369. [Google Scholar] [CrossRef]
  11. Liu, J.; Wang, M.; Peng, J.; Chen, X.; Cao, S.; Yang, H. Techno-economic design optimization of hybrid renewable energy applications for high-rise residential buildings. Energy Convers. Manag. 2020, 213. [Google Scholar] [CrossRef]
  12. Akinsipe, O.C.; Moya, D.; Kaparaju, P. Design and economic analysis of off-grid solar PV system in Jos-Nigeria. J. Clean. Prod. 2021, 287. [Google Scholar] [CrossRef]
  13. Ghafoor, A.; Munir, A. Design and economics analysis of an off-grid PV system for household electrification. Renew. Sustain. Energy Rev. 2015, 42, 496–502. [Google Scholar] [CrossRef]
  14. Kosmadakis, I.E.; Elmasides, C. A sizing method for PV–battery–generator systems for off-grid applications based on the LCOE. Energies 2021, 14, 1988. [Google Scholar] [CrossRef]
  15. Ridha, H.M.; Gomes, C.; Hizam, H.; Ahmadipour, M.; Heidari, A.A.; Chen, H. Multi-objective optimization and multi-criteria decision-making methods for optimal design of standalone photovoltaic system: A comprehensive review. Renew. Sustain. Energy Rev. 2021, 135. [Google Scholar] [CrossRef]
  16. Arif, M.T.; Oo, A.M.T. Net-zero emission residential building in temperate weather condition. EDP Sci. 2017, 30. [Google Scholar] [CrossRef] [Green Version]
  17. Ristvej, J.; Lacinák, M.; Ondrejka, R. On Smart City and Safe City Concepts. Mob. Networks Appl. 2020. [Google Scholar] [CrossRef] [Green Version]
  18. Krarti, M.; Ihm, P. Evaluation of net-zero energy residential buildings in the MENA region. Sustain. Cities Soc. 2016, 22, 116–125. [Google Scholar] [CrossRef]
  19. Awan, A.B.; Zubair, M.; Praveen, R.P.; Abokhalil, A.G. Solar energy resource analysis and evaluation of photovoltaic system performance in various regions of Saudi Arabia. Sustainability 2018, 10, 1129. [Google Scholar] [CrossRef] [Green Version]
  20. Gagnon, P.; Margolis, R.; Melius, J.; Phillips, C.; Elmore, R. Estimating rooftop solar technical potential across the US using a combination of GIS-based methods, lidar data, and statistical modeling. Environ. Res. Lett. 2018, 13. [Google Scholar] [CrossRef]
  21. Samani, P.; Mendes, A.; Leal, V.; Correia, N. Pre-fabricated, environmentally friendly and energy self-sufficient single-family house in Kenya. J. Clean. Prod. 2017, 142, 2100–2113. [Google Scholar] [CrossRef]
  22. Calabrò, E. An Algorithm to Determine the Optimum Tilt Angle of. J. Renew. Energy 2013, 2013, 12. [Google Scholar]
  23. Guo, M.; Zang, H.; Gao, S.; Chen, T.; Xiao, J.; Cheng, L.; Wei, Z.; Sun, G. Optimal tilt angle and orientation of photovoltaic modules using HS algorithm in different climates of China. Appl. Sci. 2017, 7, 1028. [Google Scholar] [CrossRef] [Green Version]
  24. Al Garni, H.Z.; Awasthi, A.; Wright, D. Optimal orientation angles for maximizing energy yield for solar PV in Saudi Arabia. Renew. Energy 2019, 133, 538–550. [Google Scholar] [CrossRef]
  25. Kaddoura, T.O.; Ramli, M.A.M.; Al-Turki, Y.A. On the estimation of the optimum tilt angle of PV panel in Saudi Arabia. Renew. Sustain. Energy Rev. 2016, 65, 626–634. [Google Scholar] [CrossRef]
  26. Jacobson, M.Z.; Jadhav, V. World estimates of PV optimal tilt angles and ratios of sunlight incident upon tilted and tracked PV panels relative to horizontal panels. Sol. Energy 2018, 169, 55–66. [Google Scholar] [CrossRef]
  27. Hennings, W.; Stenzel, P.; Pflugradt, N. Performance of a photovoltaic plus battery home system with load profile scenarios changing over the system life. Energy Procedia 2017, 142, 3252–3257. [Google Scholar] [CrossRef]
  28. Alrawi, O.; Bayram, I.S.; Al-Ghamdi, S.G.; Koc, M. High-resolution household load profiling and evaluation of rooftop PV systems in selected houses in Qatar. Energies 2019, 12, 3876. [Google Scholar] [CrossRef] [Green Version]
  29. Awan, A.B.; Zubair, M.; Praveen, R.P.; Bhatti, A.R. Design and comparative analysis of photovoltaic and parabolic trough based CSP plants. Sol. Energy 2019, 183, 551–565. [Google Scholar] [CrossRef]
  30. Vimpari, J.; Junnila, S. Estimating the diffusion of rooftop PVs: A real estate economics perspective. Energy 2019, 172, 1087–1097. [Google Scholar] [CrossRef]
  31. Mariaud, A.; Acha, S.; Ekins-Daukes, N.; Shah, N.; Markides, C.N. Integrated optimisation of photovoltaic and battery storage systems for UK commercial buildings. Appl. Energy 2017, 199, 466–478. [Google Scholar] [CrossRef]
  32. Hartner, M.; Mayr, D.; Kollmann, A.; Haas, R. Optimal sizing of residential PV-systems from a household and social cost perspective: A case study in Austria. Sol. Energy 2017, 141, 49–58. [Google Scholar] [CrossRef]
  33. Al-Badi, A.; AlMubarak, I. Growing energy demand in the GCC countries. Arab J. Basic Appl. Sci. 2019, 26, 488–496. [Google Scholar] [CrossRef] [Green Version]
  34. Ellabban, O.; Alassi, A. Integrated Economic Adoption Model for residential grid-connected photovoltaic systems: An Australian case study. Energy Rep. 2019, 5, 310–326. [Google Scholar] [CrossRef]
  35. Shah, A.L.; Al-Awami, A.T. Financial benefits by installing PV generation and energy storage systems for households. In Proceedings of the 2017 Saudi Arabia Smart Grid (SASG), Jeddah, Saudi Arabia, 12–14 December 2017; pp. 1–7. [Google Scholar] [CrossRef]
  36. Almasoud, A.H.; Gandayh, H.M. Future of solar energy in Saudi Arabia. J. King Saud Univ. Eng. Sci. 2015, 27, 153–157. [Google Scholar] [CrossRef] [Green Version]
  37. Hong, T.; Lee, M.; Koo, C.; Kim, J.; Jeong, K. Estimation of the available rooftop area for installing the rooftop solar photovoltaic (PV) system by analyzing the building shadow using Hillshade Analysis. Energy Procedia 2016, 88, 408–413. [Google Scholar] [CrossRef] [Green Version]
  38. Khan, M.; Asif, M.; Stach, E. Rooftop PV potential in the residential sector of the kingdom of Saudi Arabia. Buildings 2017, 7, 46. [Google Scholar] [CrossRef]
  39. Alrashed, F.; Asif, M. Trends in residential energy consumption in Saudi Arabia with particular reference to the Eastern province. J. Sustain. Dev. Energy Water Environ. Syst. 2014, 2, 376–387. [Google Scholar] [CrossRef] [Green Version]
  40. Al Garni, H.; Awasthi, A. Techno-economic feasibility analysis of a solar PV grid-connected system with different tracking using HOMER software. In Proceedings of the 2017 5th IEEE International Conference on Smart Energy Grid Engineering (SEGE), Oshawa, ON, Canada, 14–17 August 2017; pp. 217–222. [Google Scholar] [CrossRef]
  41. Alotaibi, D.M.; Akrami, M.; Dibaj, M.; Javadi, A.A. Smart energy solution for an optimised sustainable hospital in the green city of NEOM. Sustain. Energy Technol. Assess. 2019, 35, 32–40. [Google Scholar] [CrossRef]
  42. Statistics, G.A. For, 2019. Housing Statistics Bulletin; General Authority for Statistics: Riyadh, Saudi Arabia, 2019. [CrossRef]
  43. Dondariya, C.; Porwal, D.; Awasthi, A.; Shukla, A.K.; Sudhakar, K.; Murali, M.M.; Bhimte, A. Performance simulation of grid-connected rooftop solar PV system for small households: A case study of Ujjain, India. Energy Rep. 2018, 4, 546–553. [Google Scholar] [CrossRef]
  44. NASA. Prediction of Worldwide Energy Resources. 2020. Available online: https://power.larc.nasa.gov/data-access-viewer/ (accessed on 8 July 2020).
  45. IRENA. Renewable Power Generation Costs in 2019; International Renewable Energy Agency: Abu Dhabi, United Arab Emirates, 2020. [Google Scholar] [CrossRef]
  46. ECRA. Electricity Tariffs-Electricity & Cogeneration Regulatory Authority. Available online: https://www.ecra.gov.sa/en-us/ECRARegulations/ElectricityTariff/Pages/Tariffconsumption.aspx (accessed on 27 July 2020).
  47. ECRA. Regulatory Framework for Small-Scale Solar PV Systems. Available online: https://www.ecra.gov.sa/en-us/Advertisements/Pages/Regulatory-framework-for-Small-Scale-Solar-PV-Systems.pdf (accessed on 25 July 2020).
  48. SAMA. Saudi Arabian Monetary Authority. Available online: https://www.sama.gov.sa/en-US/EconomicReports/Pages/AnnualReport.aspx (accessed on 1 June 2020).
  49. SAMA. Inflation Report First Quarter of 2020; SAMA: Riyadh, Saudi Arabia, 2020.
  50. Statista. Global Electricity Prices in 2018, by Select Country. 2018. Available online: https://www.statista.com/statistics/263492/electricity-prices-in-selected-countries/ (accessed on 22 September 2020).
  51. Imam, A.A.; Al-Turki, Y.A.; Kumar, R.S. Techno-economic feasibility assessment of grid-connected PV systems for residential buildings in Saudi Arabia-A case study. Sustainability 2020, 12, 262. [Google Scholar] [CrossRef] [Green Version]
Figure 1. Methodology flow chart.
Energies 14 03805 g001
Figure 2. Integrated energy system (IES) configuration.
Energies 14 03805 g002
Figure 3. Hourly average electricity load profile for different types of residential buildings. Source: SEC (Personal Communication 30 June 2020).
Energies 14 03805 g003
Figure 4. The daily average GHI for city of Neom between 2009 and 2019.
Energies 14 03805 g004
Figure 5. The average air temperature data from 2009 to 2019. Source: NASA Surface Meteorology and Solar Energy.
Energies 14 03805 g005
Figure 6. Comparison of NPC and ROI with capacity of PV for villa, traditional dwelling, and apartment.
Energies 14 03805 g006aEnergies 14 03805 g006b
Figure 7. Simulated monthly average energy yield for villa, traditional house, and apartment.
Energies 14 03805 g007
Figure 8. Effect of discount rate variability on NPC and LCOE for villa, traditional dwelling, and apartment.
Energies 14 03805 g008
Figure 9. Effect of inflation rate on NPC and LCOE for villa, traditional dwelling, and apartment.
Energies 14 03805 g009
Table 1. Overview of different residential dwelling types.
Dwelling TypeNo. of OccupantsFloor Area (m2)Available Rooftop Area (m2)
VillaTwo parents with four children(180–220)(160–200)
TraditionalTwo parents with two children(170–200)(155–185)
ApartmentTwo parents with one child(100–150)(85–135)
Source: [42] and Ministry of Housing (personal communication, 23 July 2020).
Table 2. Technical and economic data *.
ComponentParameterValuePurposeSource
GridGrid power price for residential consumption up to 6000 kWh0.06 $/kWh (incl. 15% VAT) [46]
Grid power price for residential consumption over 6000 kWh0.09 $/kWh (incl. 15% VAT)
Grid power sellback0.02 $/kWh Tariff for renewable resources[47]
PVCapital cost/kW$1200PV panel selection: Trina solar due to its common usage[45]
Operation and maintenance cost/kW10 ($/year)
Lifetime25 years
Battery storageCapital cost/unit$4800“SonnenBatterie” HOMER Pro library
Replacement cost$7946
Lifetime10 years
* Noting that 1 USD is equal to 3.75 SAR as fixed rate [48].
Table 3. Impact of different tariff rates on relevant economic variables for a traditional housing.
Economic ParameterElectricity Tariff ($/Kwh)
0.060.070.080.09
VillaHouseApartmentVillaHouseApartmentVillaHouseApartmentVillaHouseApartment
NPC ($)−119−2299−2911404112653869006490337471369985957153
LCOE ($/kWh)0.0550.0590.0600.0580.0610.0620.0610.0630.0640.0630.0640.065
ROI (%)0.70.0−0.21.71.00.02.72.01.73.62.92.6
IRR (%)1.20.10.02.91.81.44.43.33.05.74.74.3
DPBP (years)Exceeds Project Life22.4424.4924.8416.6618.3622.7114.7316.2216.75
Table 4. Optimal size of solar PV system for residential buildings assuming tariff of 0.08 $/kWh.
Dwelling TypeOptimal PV Size (kW)NPC ($)ROI (%)
Villa14.090062.7
Traditional11.149032.0
Apartment10.337471.7
Publisher’s Note: MDPI stays neutral with regard to jurisdictional claims in published maps and institutional affiliations.

