Article

Numerical Simulation of Elbow Erosion in Shale Gas Fields under Gas-Solid Two-Phase Flow

1
School of Petrochemical Engineering and Environment, Zhejiang Ocean University, Zhoushan 316022, China
2
National Engineering Laboratory for Pipeline Safety, China University of Petroleum-Beijing, Beijing 102249, China
3
China National Oil and Gas Exploration and Development Corporation, Beijing 100034, China
4
CNOOC Research Institute Co., Ltd., Beijing 100028, China
*
Authors to whom correspondence should be addressed.
Energies 2021, 14(13), 3804; https://doi.org/10.3390/en14133804
Submission received: 9 May 2021 / Revised: 5 June 2021 / Accepted: 22 June 2021 / Published: 24 June 2021
(This article belongs to the Section J3: Exergy)

Abstract

:
Erosion is one of the most common forms of material failure and equipment damage in gas transmission pipelines. Shale gas fields use hydraulic fracturing whereby solid particles are often carried in the gas flow, and the pipeline is in a high-pressure state, which is more likely to cause erosion. The prediction of particle erosion regulation in gas-solid two-phase flow is an effective means to ensure the safe operation of shale gas fields. In this paper, an integrated CFD-DPM model is established to investigate the erosion of 90° elbow in a shale gas field under gas-solid two-phase flow, employing the realizable k-ε turbulence model, discrete phase model, and erosion rate prediction model. The reliability of the proposed numerical models is verified by comparing the predicted data with the experimental data. Moreover, the effects of six important factors on maximum erosion rate are analyzed, including gas velocity, mass flow rate of sand particles, particle diameter, shape coefficient of sand particles, pipeline diameter, elbow radius of curvature. Specifically, the results indicate that the gas velocity, mass flow rate and shape coefficient of sand particles are positively correlated with the maximum erosion rate, while the pipe diameter and the elbow radius of curvature are negatively correlated with the maximum erosion rate. A new correlation was developed, which included four dimensionless groups, namely Reynolds number, diameter ratio, density ratio and particle number. The correlation can be used to predict maximum corrosion rate of elbows. This work can provide data reference and theoretical basis for mitigating the erosion rate of pipelines and managing the integrity of gas pipelines.

1. Introduction

Erosion is a phenomenon of surface damage caused by the impact of fluid bundles or fluid bundles with abrasive solid media on a solid surface [1]. Due to the presence of solid impurities in the gas component, and the debris caused by pipeline corrosion, there is an inevitably a certain amount of solid particulate matter in any gas transmission pipeline [2]. Those solid particles are continuously impacting the pipeline wall under the entrainment of the high-speed gas stream, resulting in the erosion of the pipeline [3]. Therefore, the material of the pipeline wall will be damaged, resulting in the thinning of the pipeline wall, especially at the elbows where the flow direction changes dramatically [4,5]. In many cases of pipeline failure, overflow components with sudden changes in flow direction or structure such as bends, elbows, tees, and reducers, are the most prone to local thinning and even perforation [3,6]. Eighty percent of the pipeline perforations in gathering pump stations are caused by wear and scour corrosion. The prediction of particle erosion regulation in gas-solid two-phase flow is an effective means to ensure the safe operation of gas transmission pipelines and to prevent equipment failure [7,8]. Shale gas fields adopt hydraulic fracturing [9] and as a result solid particles are often carried in the gas flow, and the pipeline is in a high-pressure state, which is more likely to cause erosion [3]. Therefore, in-depth analysis of flow field characteristics, considering the motion law of solid particles, predicting erosion rate and erosion distribution, and then being capable to take correct and feasible countermeasures on this basis, are of great significance to the safe operation of shale gas field.
Many scholars are committed to exploring the law of erosion through experimental research [5,10,11,12]. Leporini et al. [12] carried out a preliminary experimental study of three phase flows (air-water-sand) inside a horizontal pipe, and the application of the sand-liquid models in the literature was presented. It was concluded that the sand transport characteristics and the critical deposition velocity are strongly dependent on the gas-liquid flow regime and on the sand concentration [12]. However, the experimental measurements are time-consuming, expensive, and the test equipment usually interferes with the actual flow field. The continuous progress of computer technology leads to the rapid development of computational fluid dynamics (CFD) technology [4,13]. Relying on theoretical modeling basis, CFD methods can not only help to understand fluid dynamics problems intuitively and clearly, providing references for experiments and research design, but also greatly save labor, material and time [6,14,15]. Therefore, CFD methods are gradually becoming an important tool for studying flow problems together with experimental fluid dynamics. Based on the CFD method, Peng et al. [16] proposed an erosion prediction method to investigate the relationships among the gas-liquid distribution, sand movement and erosion profile. The results show that the erosion profiles of the pipeline wall are mainly controlled by three particle collision mechanisms, namely micro-cutting, plowing and impact deformation. Zhu and Qi [8] employed a CFD-DPM method based on the Eulerian-Lagrangian method and erosion model to study the flow erosion of oil flows containing sand in U-bends. The results show that the erosion mainly occurs on the outer bend, the lower surface of U-bend and downstream pipeline. Zeng et al. [7] conducted an investigation to study the erosion behavior of elbows with sulfur-containing particles. Based on CFD-DEM model, the erosion prediction model of gas-solid two-phase flow is established considering the interactions of gas-solid, particle-particle and particle-wall. The results show that the V-shaped erosion scar is caused by secondary impact. Wang [4] established a mathematical model for predicting solid particle erosion in elbow of oil pipeline considering particle fluid interaction. The results show that the erosion mainly occurs near the outlet of elbow, especially at the side wall of downstream straight pipe and the dome of bending section.
In general, erosion under gas-solid two-phase flow is a very complex process and is not yet fully understood. For the gas-solid two-phase flow pipeline widely used in shale gas engineering, it is necessary to simulate the working conditions closer to the actual operating conditions and establish the prediction model of maximum erosion rate. This paper focuses on the numerical simulation of erosion in elbow of shale gas field under gas-solid two-phase flow. By comparing with the experimental data, the reliability of the numerical model is verified, and the erosion wear law under different influencing factors is studied. The research results can provide data reference and theoretical basis for mitigating the erosion rate of pipelines and managing the integrity of gas pipelines.

2. Numerical Model

In this paper, the elbow erosion of shale gas field was studied by numerical simulation using the ANSYS Fluent software, which required three parts that include the simulation of continuous phase (gas phase) flow field, tracking of discrete phase particle trajectory, and calculation of elbow erosion rate [4]. First of all, this paper simulates the turbulent gas flow carrying particles in the pipeline. And then it analyzes the forces such as dragging force on discrete phase particles in the flow field, so as to find out the trajectory of the particles according to the Lagrange discrete phase model. Finally, when the particles impact with the pipe wall, the erosion prediction model is used to calculate the extend of erosion by particles of the pipe wall or pipe fittings.

2.1. Fluid Flow Field Modeling

The continuous phase (gas phase) flow field was simulated by the turbulence model. For different problems, it is necessary to consider the compressibility of fluid, the requirement of calculation accuracy, the performance of computer equipment, and the time limit to select the most suitable turbulence model. The realizable k-ε [8,17,18] turbulence model is chosen in this paper. The turbulent kinetic energy (k) and its energy dissipation rate (ε) transport equations are calculated as follows:
t ( ρ k ) + x j ( ρ k u j ) = x j [ ( μ + μ t σ ε ) k x j ] + G k + G b ρ ε Y M + S k
t ( ρ ε ) + x j ( ρ ε u j ) = x j [ ( μ + μ t σ ε ) ε x j ] + ρ C 1 S ε ρ C 2 ε 2 k + v ε + C 1 ε ε k C 3 ε G b + S ε
where C1, η, S are defined as follows:
C 1 = max [ 0.43 ,   η η + 5 ] ,   η = S k ε ,   S = 2 S i j S i j
where: C2 and C1ε are constants; Gk is the turbulent kinetic energy due to the average velocity gradient; Gb is the turbulent kinetic energy due to buoyancy; YM is the effect of pulsating expansion on the total dissipation rate incompressible turbulence; σk is turbulent Prandtl constant of turbulent kinetic energy k; σε is the turbulent Prandtl constant of dissipation rate ε; Sij is the average velocity strain rate tensor.

2.2. Particle Tracking Modeling

After solving the Navier-Stokes equations for the gas phase as a continuous phase, the discrete phase is solved by tracking a large number of particles according to the calculated flow field. In the discrete phase model (DPM) [4], the fluid is treated as the continuum and the particles are treated as the discrete phase. The mutual collision among particles is ignored, thus, only mass, momentum, and energy exchange between particles and fluid are considered. The trajectories of particles are calculated adopting Lagrange method. DPM model is suitable for the case where the particle volume fraction in the system is less than 10%. In consideration of the volume fraction of the particle phase in the gas pipeline is much less than 10%, which satisfies the conditions of DPM model. Therefore, the DPM model, considering the bidirectional coupling between discrete phase (solid particles) and continuous phase (gas phase), is adopted to simulate the flow behavior of particles through 90° elbows under the experimental conditions and analyze the erosion extend of pipe wall and other pipe fittings impacted by solid particles. The detailed information of DPM [4,7,8,18,19] can be found in many CFD literatures, it is not described in here to avoid repetition.

2.3. Erosion Modeling

The erosion rate is defined as follows [20]:
R e r o s i o n = p = 1 N p a r t i c l e s m ˙ p C ( d p ) f ( γ ) v b ( ν ) A f a c e
where Rerosion is the erosion rate given in units of mass of wall material removed per unit area per unit time, Nparticles is the number of particles which impact the wall in the unit superficial surface, m ˙ p  is the mass flow of particles, Aface is the unit superficial area of the wall, C(dp) is the particle diameter function, γ is the impact angle between the particle trajectory and the pipe wall, f(γ) is the impact angle function, v is the particle impact velocity, b(ν) is the particle impact velocity function. In this paper, the particle diameter function C(dp) is 1.8 × e−9 and the particle impact velocity exponent function b(ν) is 2.6 [6]. The impact angle function f(γ) is defined in a segmented linear function, and the data are shown in Table 1.
During the movement inside the elbow, the particle might collide with the pipe wall and then rebound back to the fluid domain. The standard wall equation is used to deal with the near-wall problems, and the normal rebound coefficient and tangential rebound coefficient are set as follows by Forder et al. [1,20]:
e n = 0.988 - 0.78 α + 0.19 α 2 - 0.024 α 3 + 0.027 α 4 e t = 1 - 0.78 . α + 0.84 . α 2 - 0.21 . α 3 + 0.028 α 4 - 0.022 α 5
where e n and e t are the normal and tangential restitution coefficient, respectively, α is the particle impact angle (the angle between the incident velocity and the tangent to the surface).

3. Model Validation

3.1. Parameter Setting

The internal structure of the elbow is complex, which leads to high experimental cost, and it is not convenient to adjust the internal impact angle, and the internal deformation of the elbow is not easy to obtain. Therefore, in order to simulate the impact behavior at different angles and observe the change of morphology easily, cylindrical specimen is used. Based on the existing experimental system, a metal cylindrical specimen with a diameter of 30 mm and a thickness of 3 mm is fixed on a base in the erosion system in the laboratory. The incident angle of solid particles can be adjusted by changing the mounting angle of the sample, which ranges from 0° to 90°, as shown in Figure 1.
The numerical simulation results are compared with the experimental results to verify the reliability of the numerical model developed in this paper. SolidWorks is used to establish the geometric model of the specimen (Figure 1b). ANSYS ICEM is used to extract and mesh the computational domain of established geometric model, and a non-structural mesh is adopted. The geometric models with incident angles of solid particles, which are 15°, 30°, 45°, 60° and 90°, are meshed as shown in Figure 2, respectively. Realizable k-ε turbulence model and DPM model are employed considering the bidirectional coupling of discrete phase (solid particle) and continuous phase (gas phase). Standard wall equation is used to solve the near-wall surface problem in wall boundary, wall condition of the specimen is set as rebound (reflect) in DPM option. In addition, the diameter function is and velocity exponent function is 2.6. The model is solved by the pressure base solver with the simple algorithm for pressure velocity coupling.

3.2. Calculation Results

As can be seen from Figure 3 and Figure 4, the variation law of each parameter calculated by the proposed numerical model is basically consistent with the experimental results, and the erosion rate error is less than 10%. Considering the systematic errors, due to experimental measurements and parameter settings, and the random errors, the model used in this paper is reliable.

4. Gas-Solid Erosion Simulation of 90° Elbows

4.1. Parameter Settings

The proposed numerical model above is employed to investigate gas-solid erosion of 90° elbows in shale gas field. The influence of six important factors on the maximum erosion rate are studied. The values of these factors are determined according to the actual production and operation conditions as shown in Table 2.
According to the settings in 
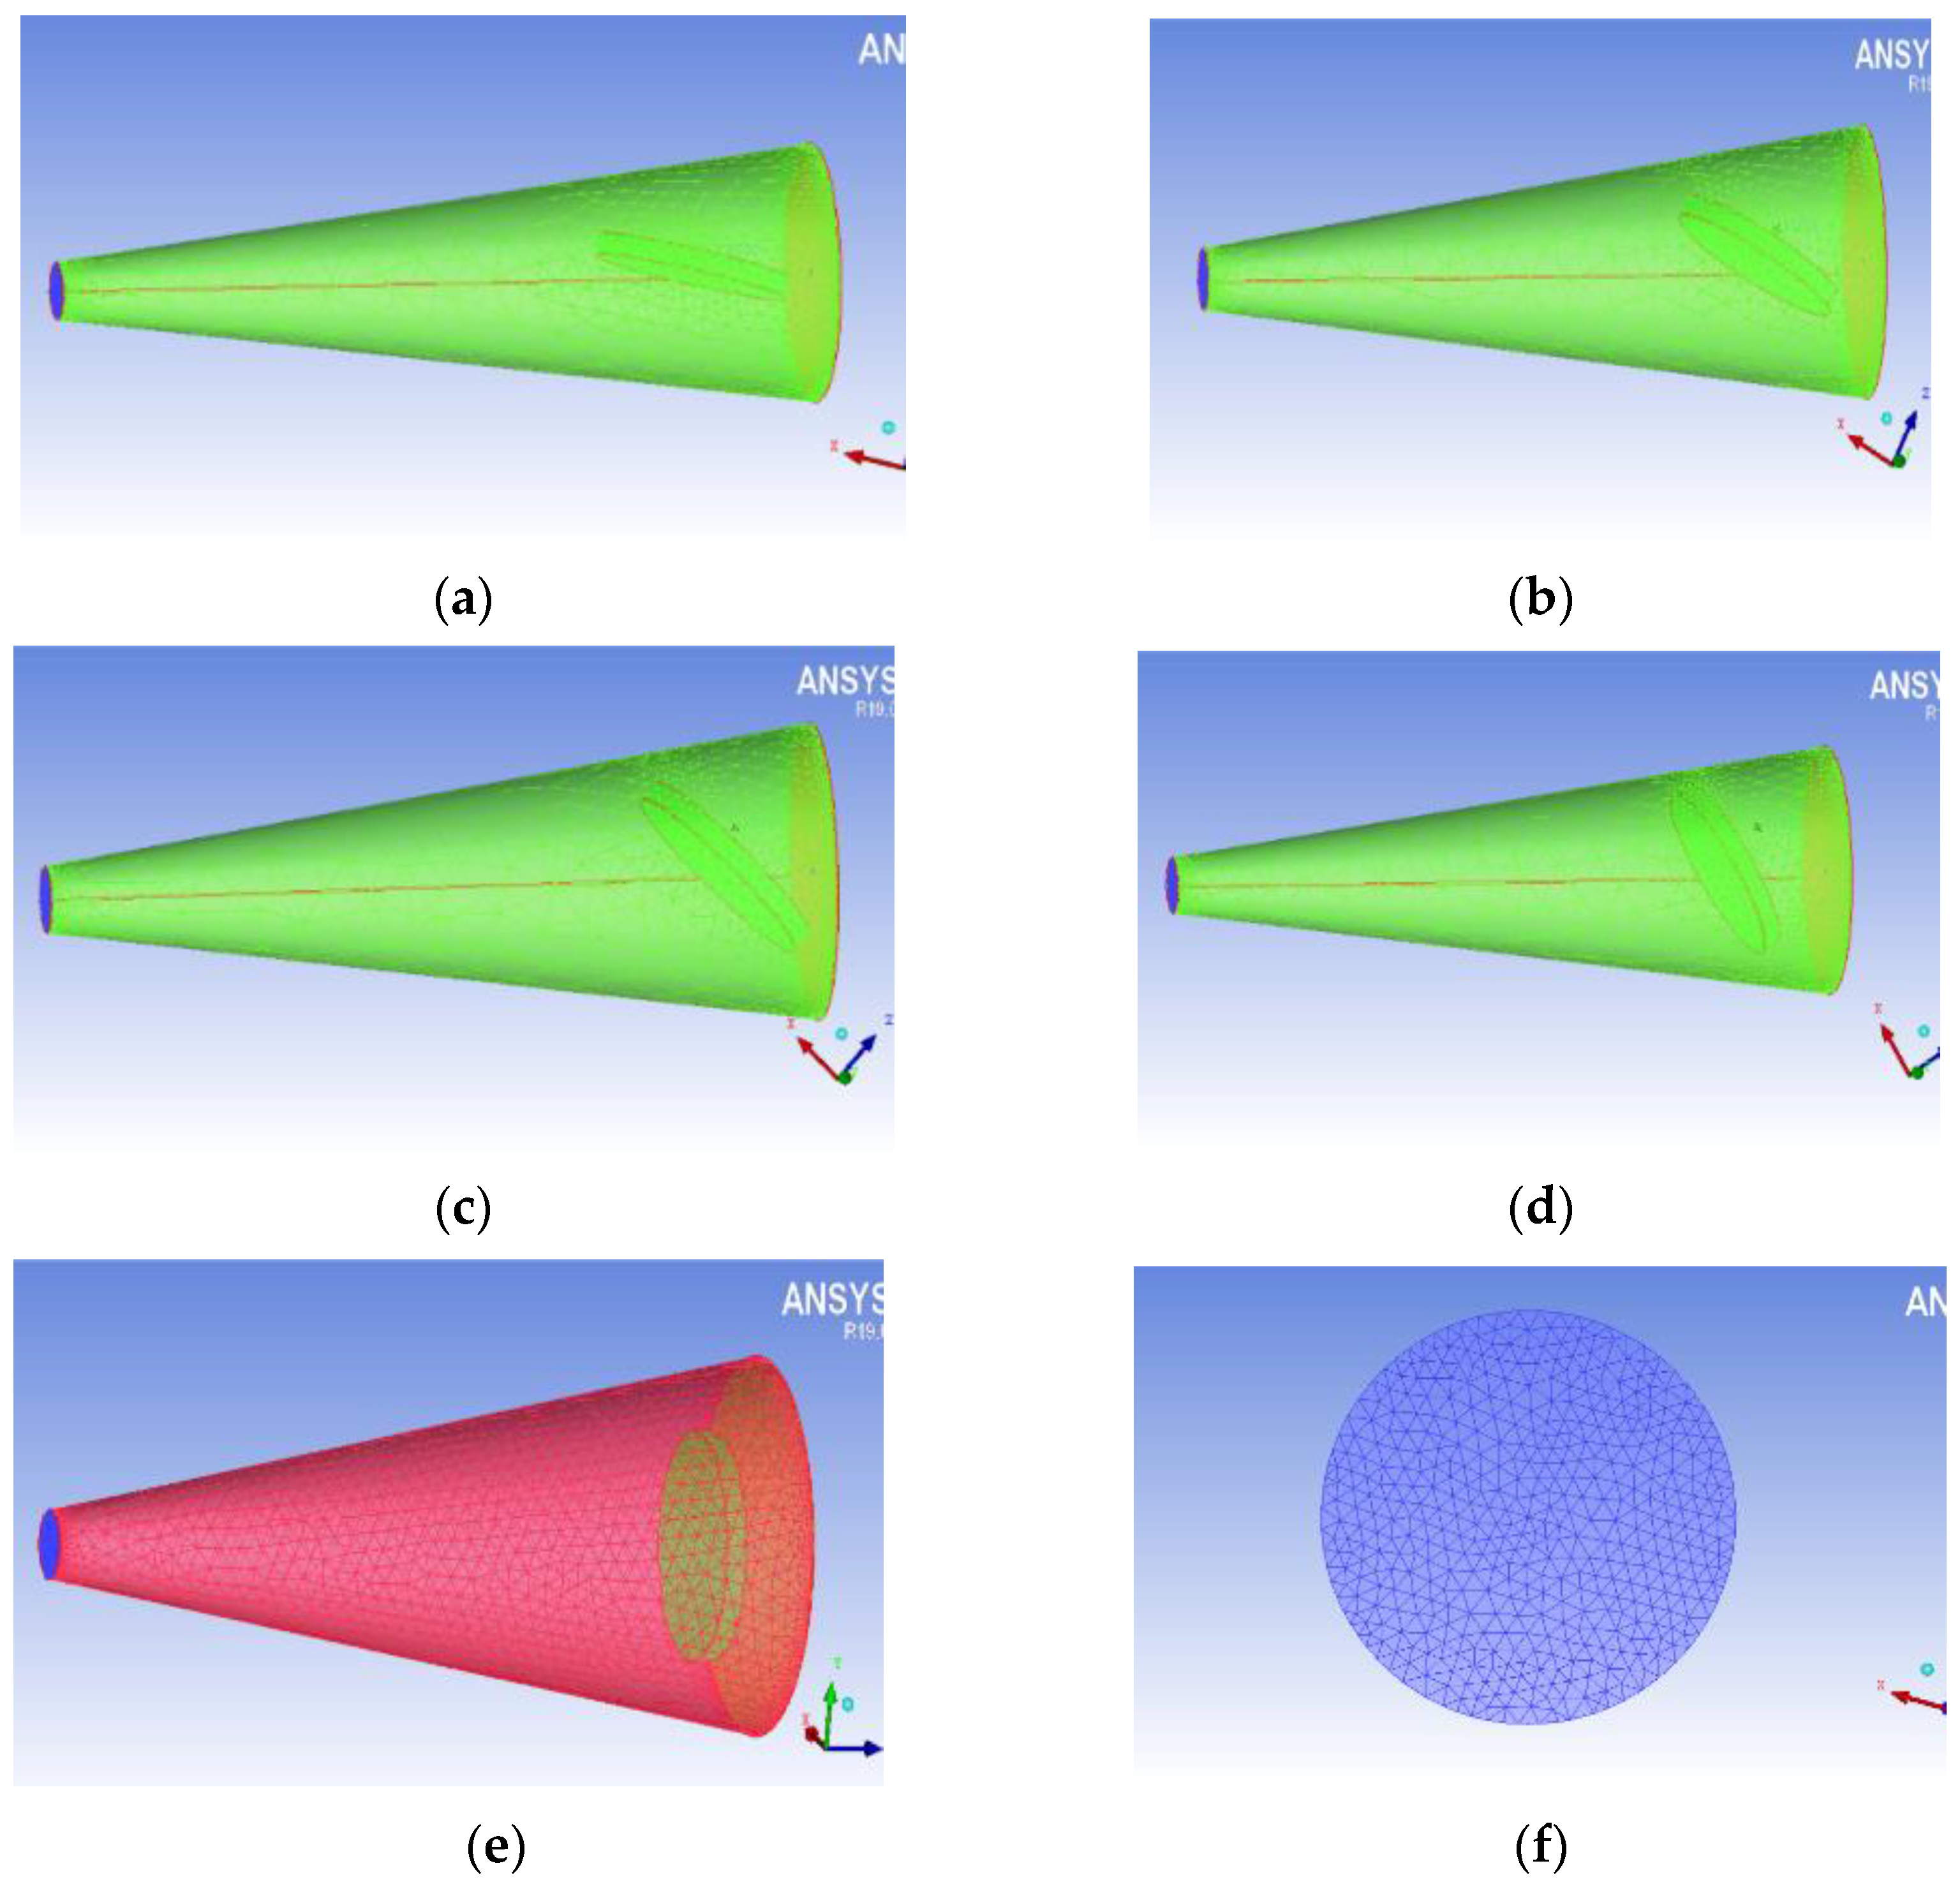
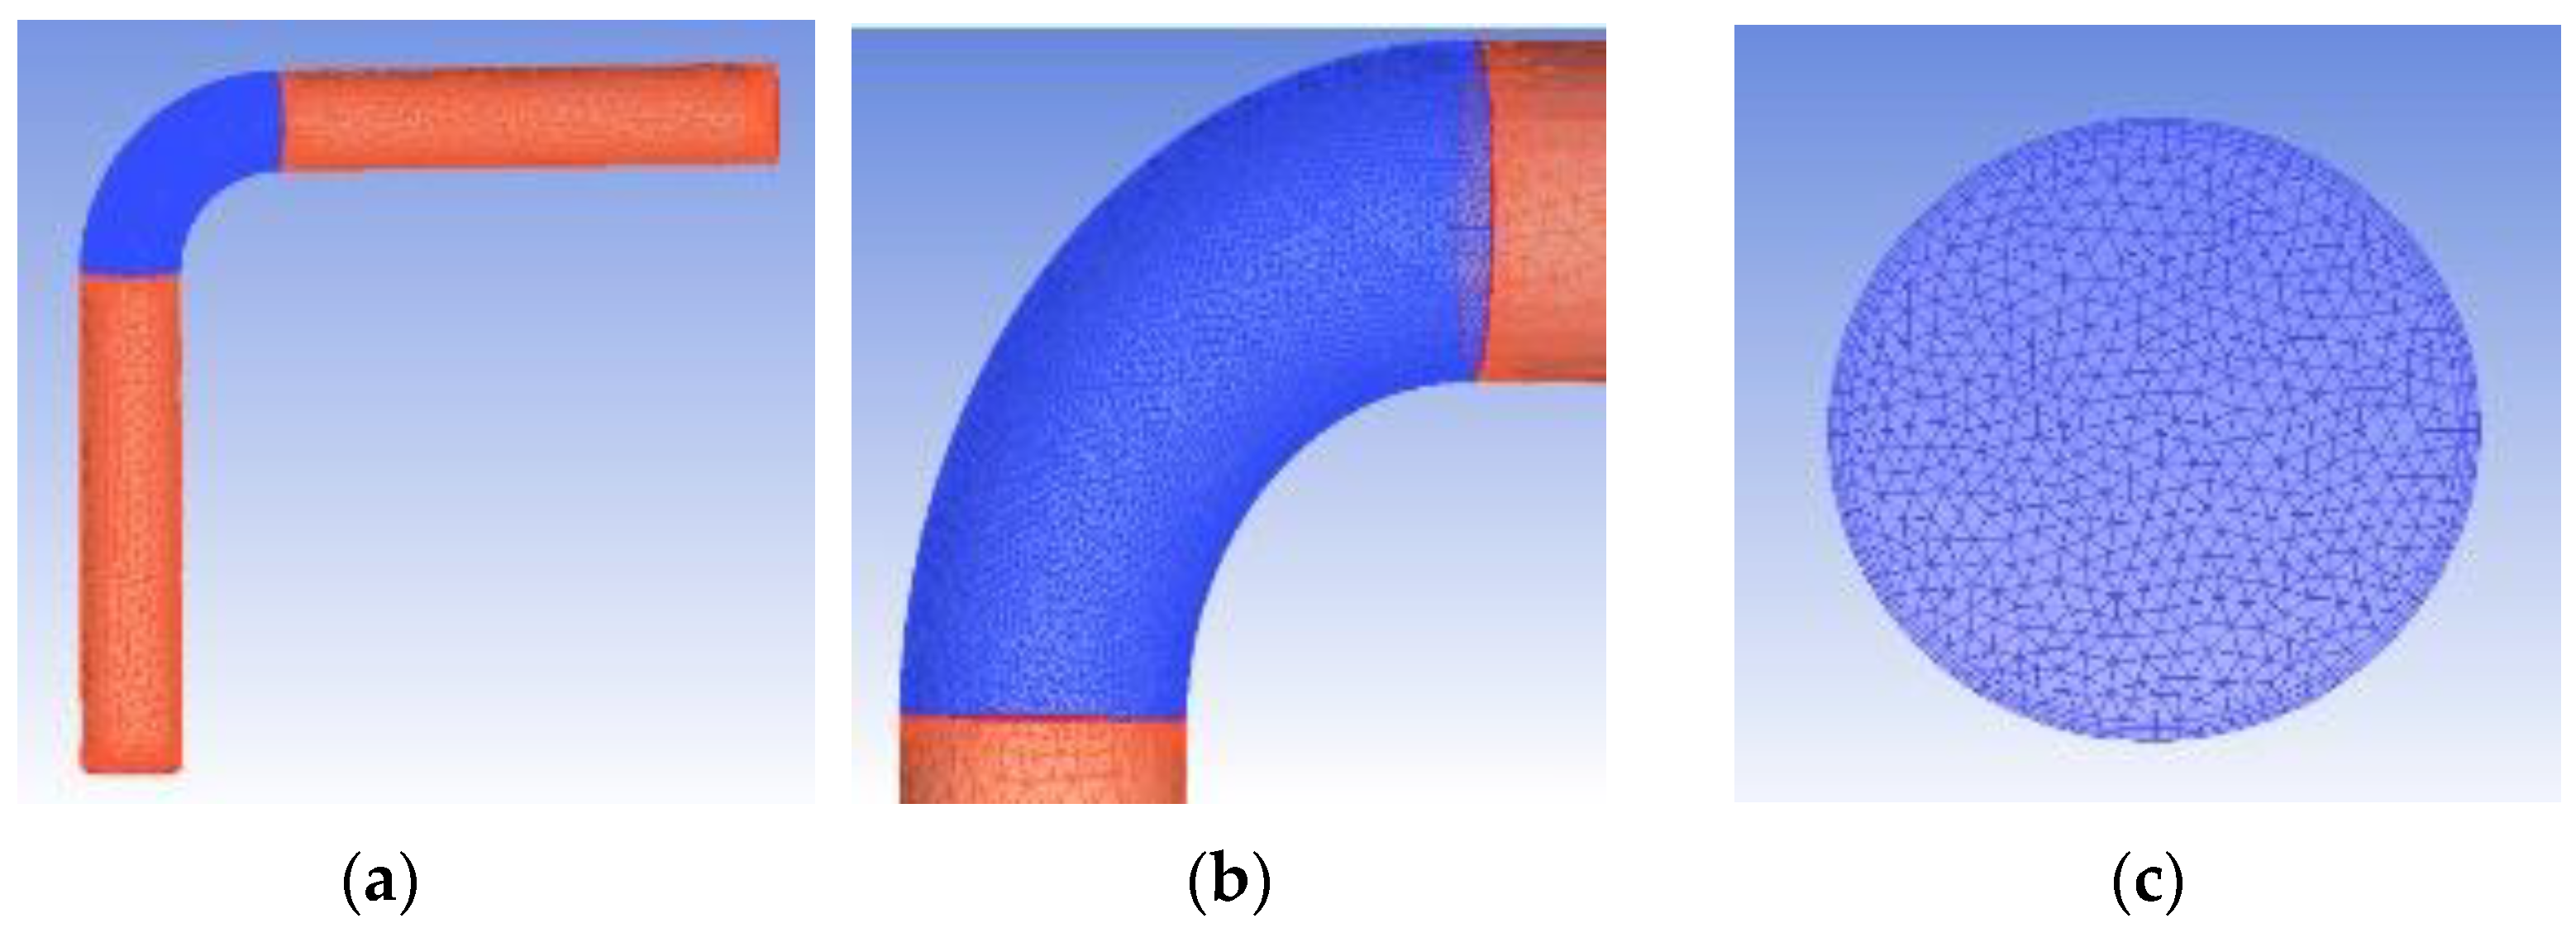
Table 2, the geometric models of pipe with different inner diameters and elbows with different elbow radius of curvature are established, respectively. A straight pipe section with a length of 5D is set before and after the elbow as a flow development section. The inner flow channel is selected as the calculation domain to simulate the gas flow inside the elbow. In order to simulate the boundary layer effect and make the mesh and surface orthogonal, a 3-layer prismatic layer mesh is added to the outer surface of the computational domain. The mesh of the elbow section is encrypted locally, and the mesh is divided as showed in Figure 5.
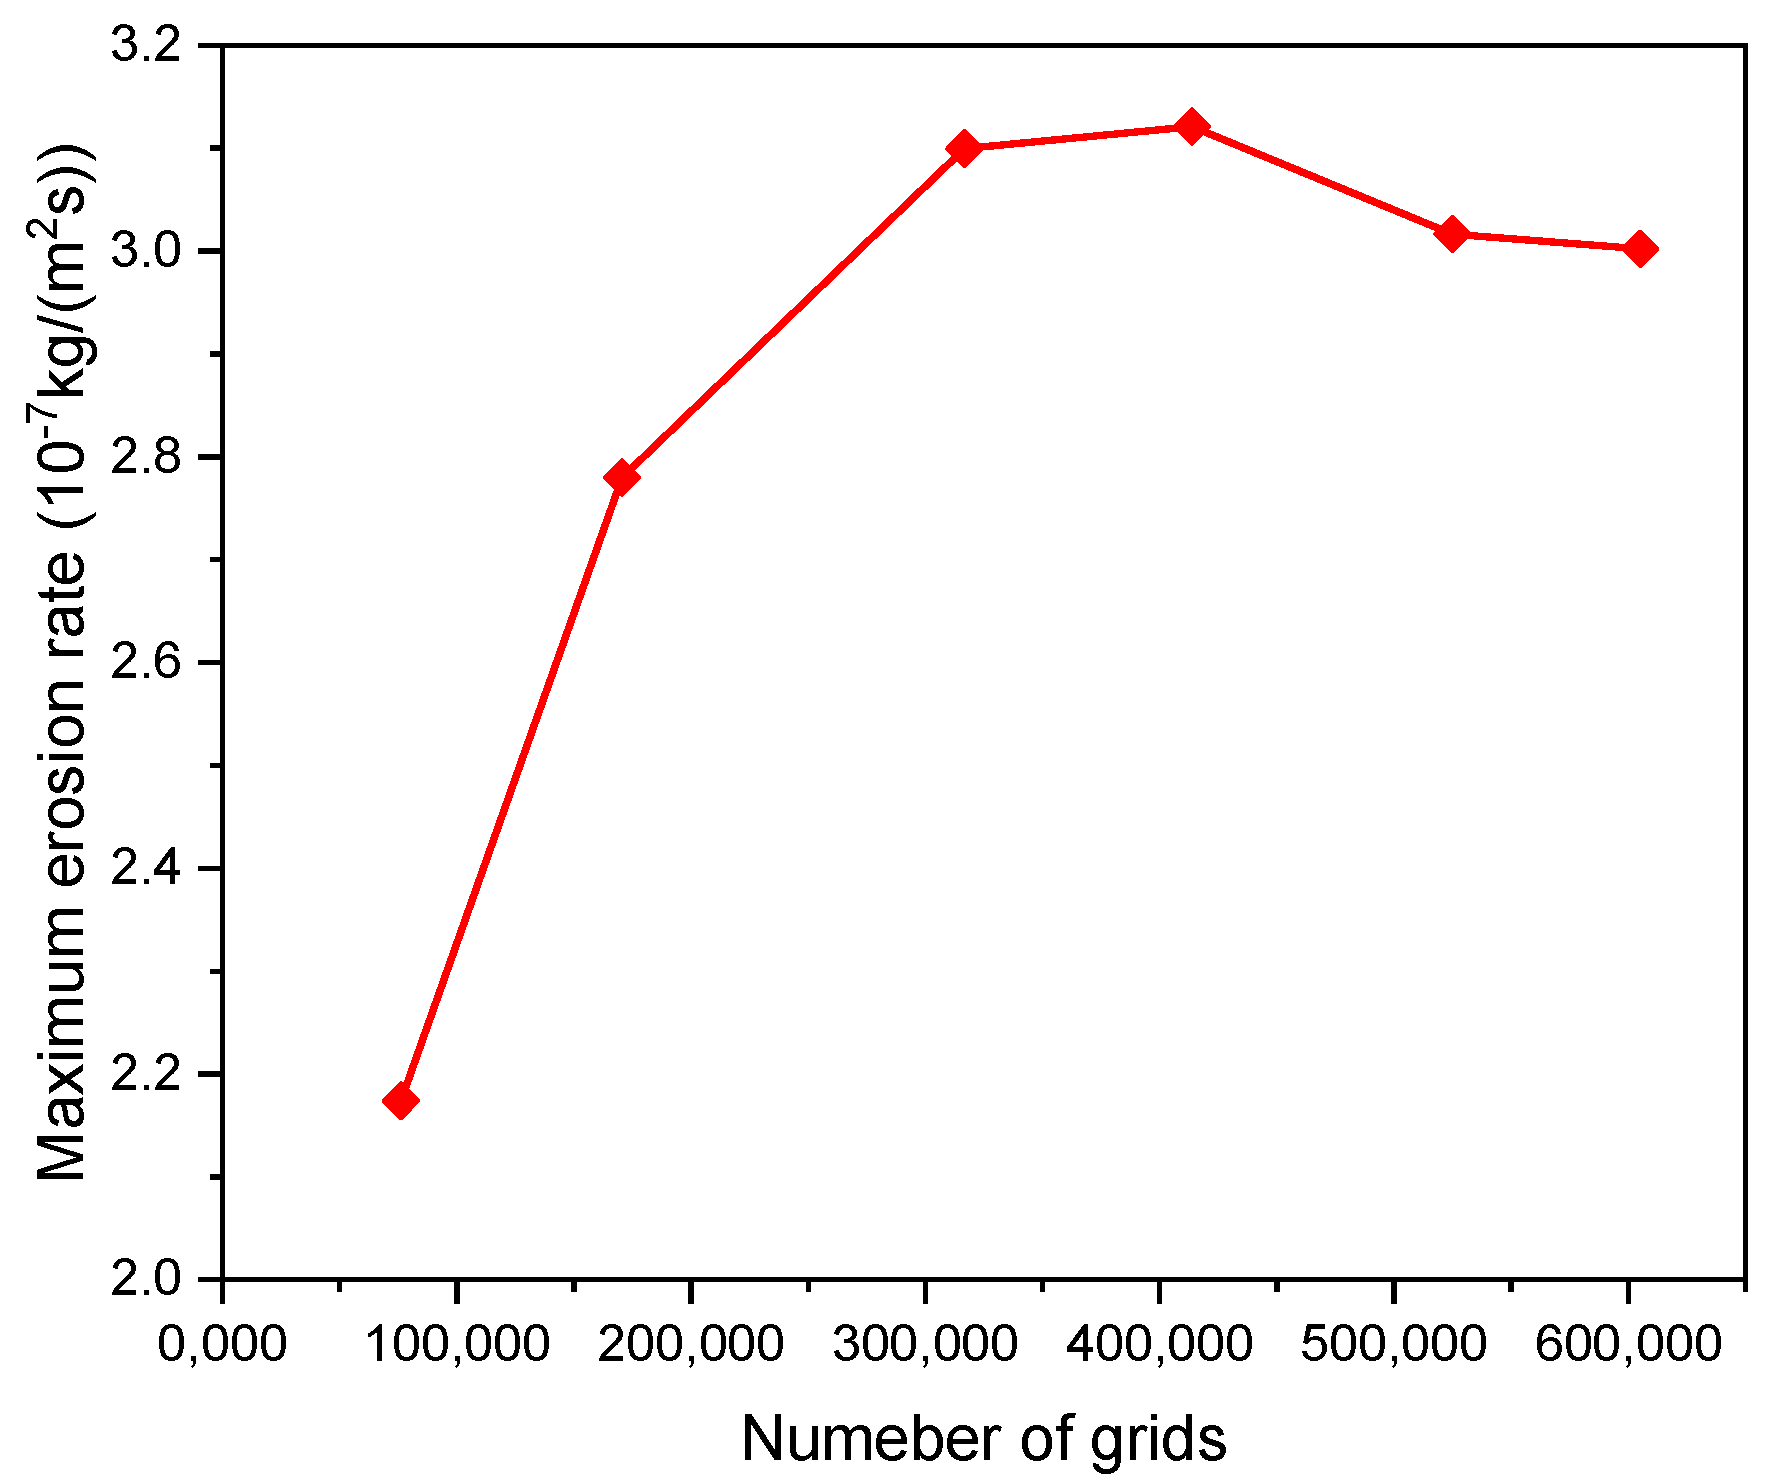
Because mesh quality directly affects the accuracy and speed of calculation, in general, the encrypted mesh improves the results accuracy, but it also requires more computer resources. Hence, it is necessary to find a reasonable mesh density. For example, the maximum erosion rate is compared under different mesh quantities for a pipe with an inner diameter of 100 mm and an elbow radius of curvature of 1.5D, as shown in Figure 6. The number of grids increased from 316,649 to 605,133, and the maximum erosion rate change only 3.1 percent, so the mesh system with a mesh quantity of 316,649 is selected. Besides, mesh independent verification is carried out on other specifications of elbows.

4.2. Result and Disscution

Taking the inner diameter of 100 mm, elbow radius of curvature of 1.5D, gas velocity of 10 m/s, sand mass flow rate of 0.001 kg/s, particle size of 300 μm and shape coefficient of sand of 0.53 as an example to analyze the flow field of the elbow, obtaining the wall erosion distribution, the maximum wall erosion rate, the wall pressure distribution and the particle motion trajectories.
As can be seen from 
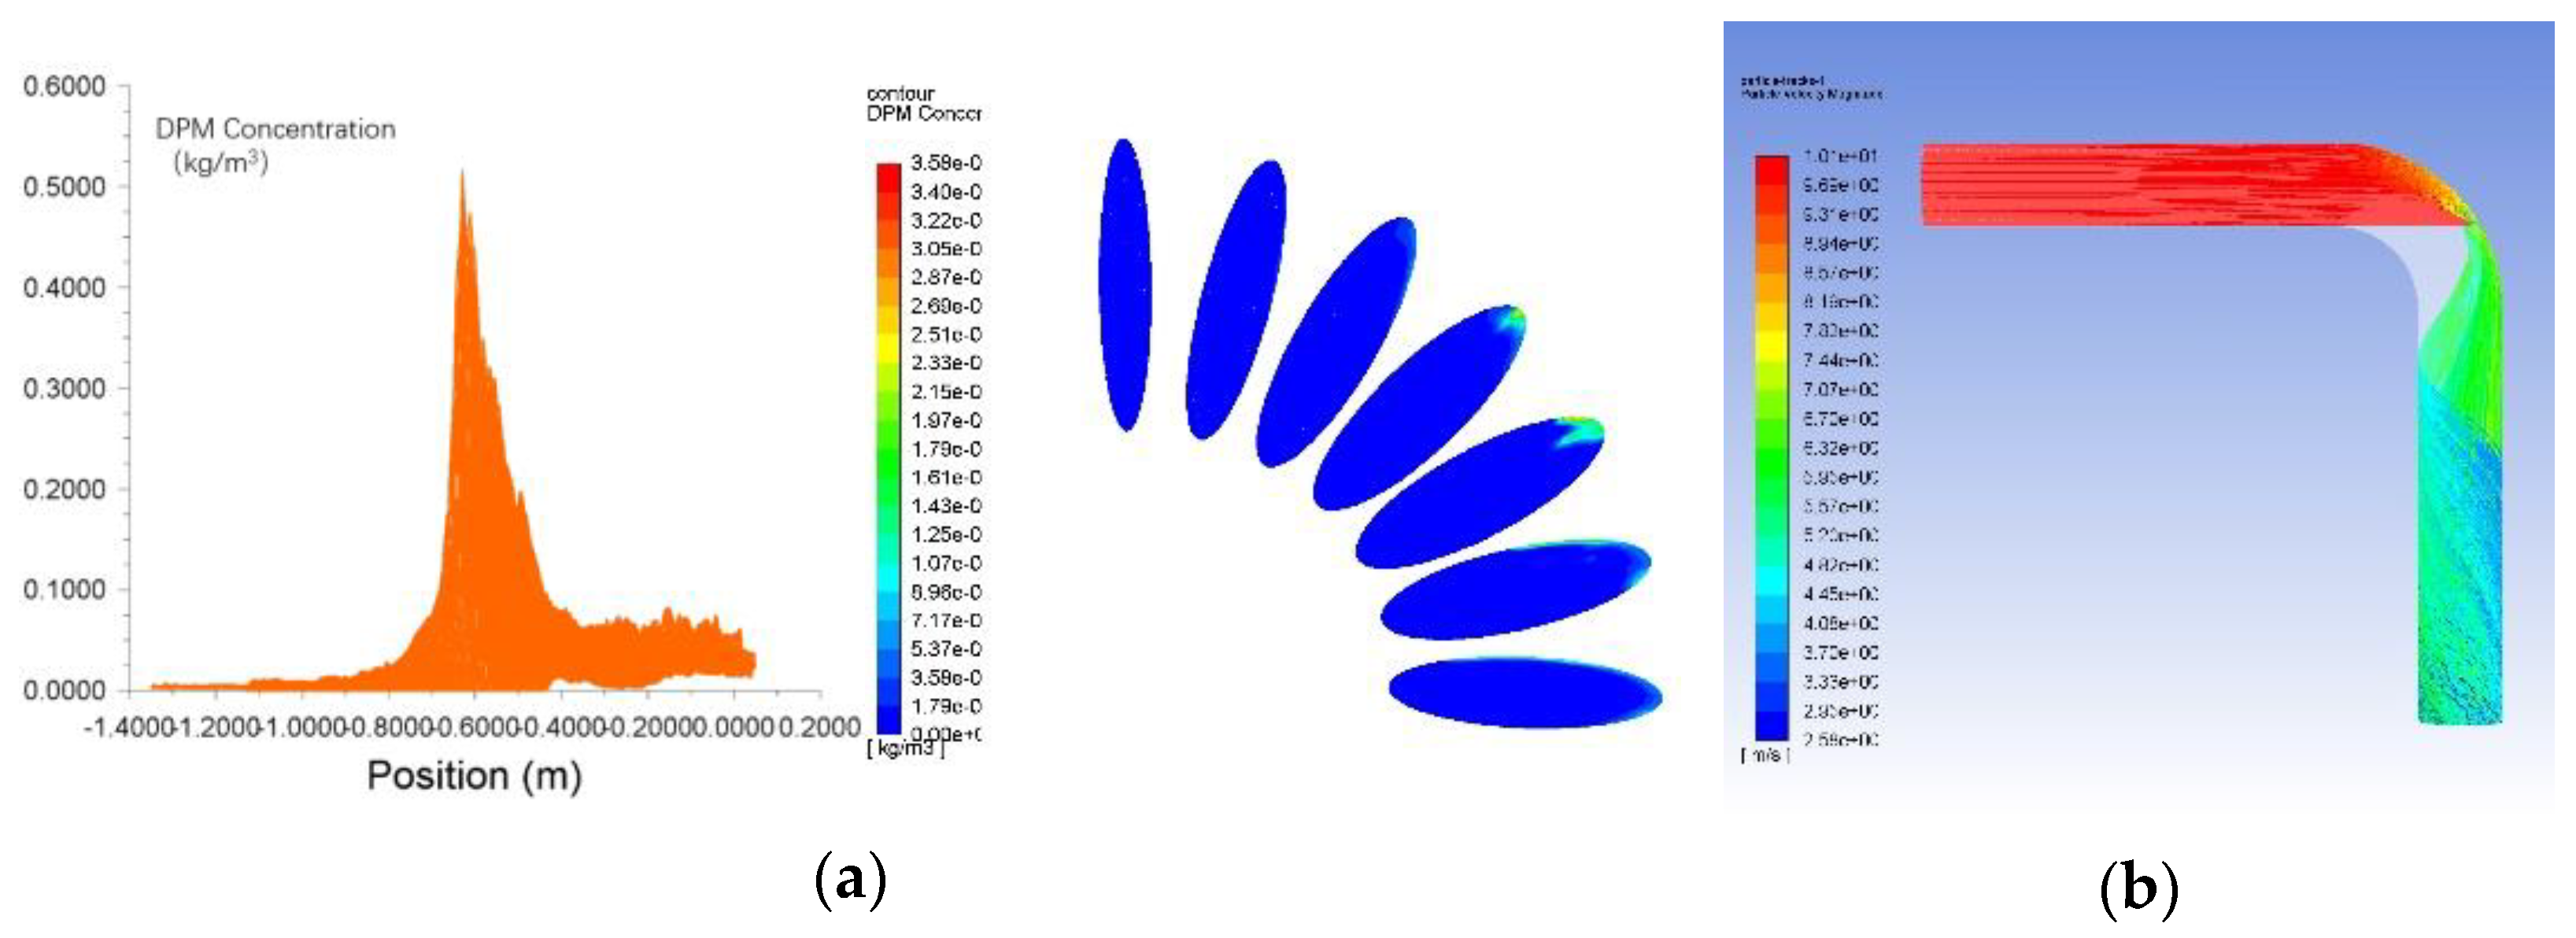
Figure 7, the erosion is concentrated at the outer wall of the elbow, and the maximum erosion position is about 60° at the outer arc of the elbow. The particle motion trajectories indicate that the particles are approximately moving in a straight line before entering the elbow and the motion trajectory changes when they hit the pipe wall more intensively at the outer arc of the elbow. It can be seen from Figure 8 that the maximum DPM concentration at the arc of the elbow is the highest, indicating that the particles cluster here. From the contour of DPM concentration, it can be seen that DPM concentration is the highest at the outer arc of the elbow about 40° to 60°. Particle trajectory diagram confirms this finding. The clustering of particles leads to increased erosion rate at the outer wall of the elbow as shown in Figure 7.
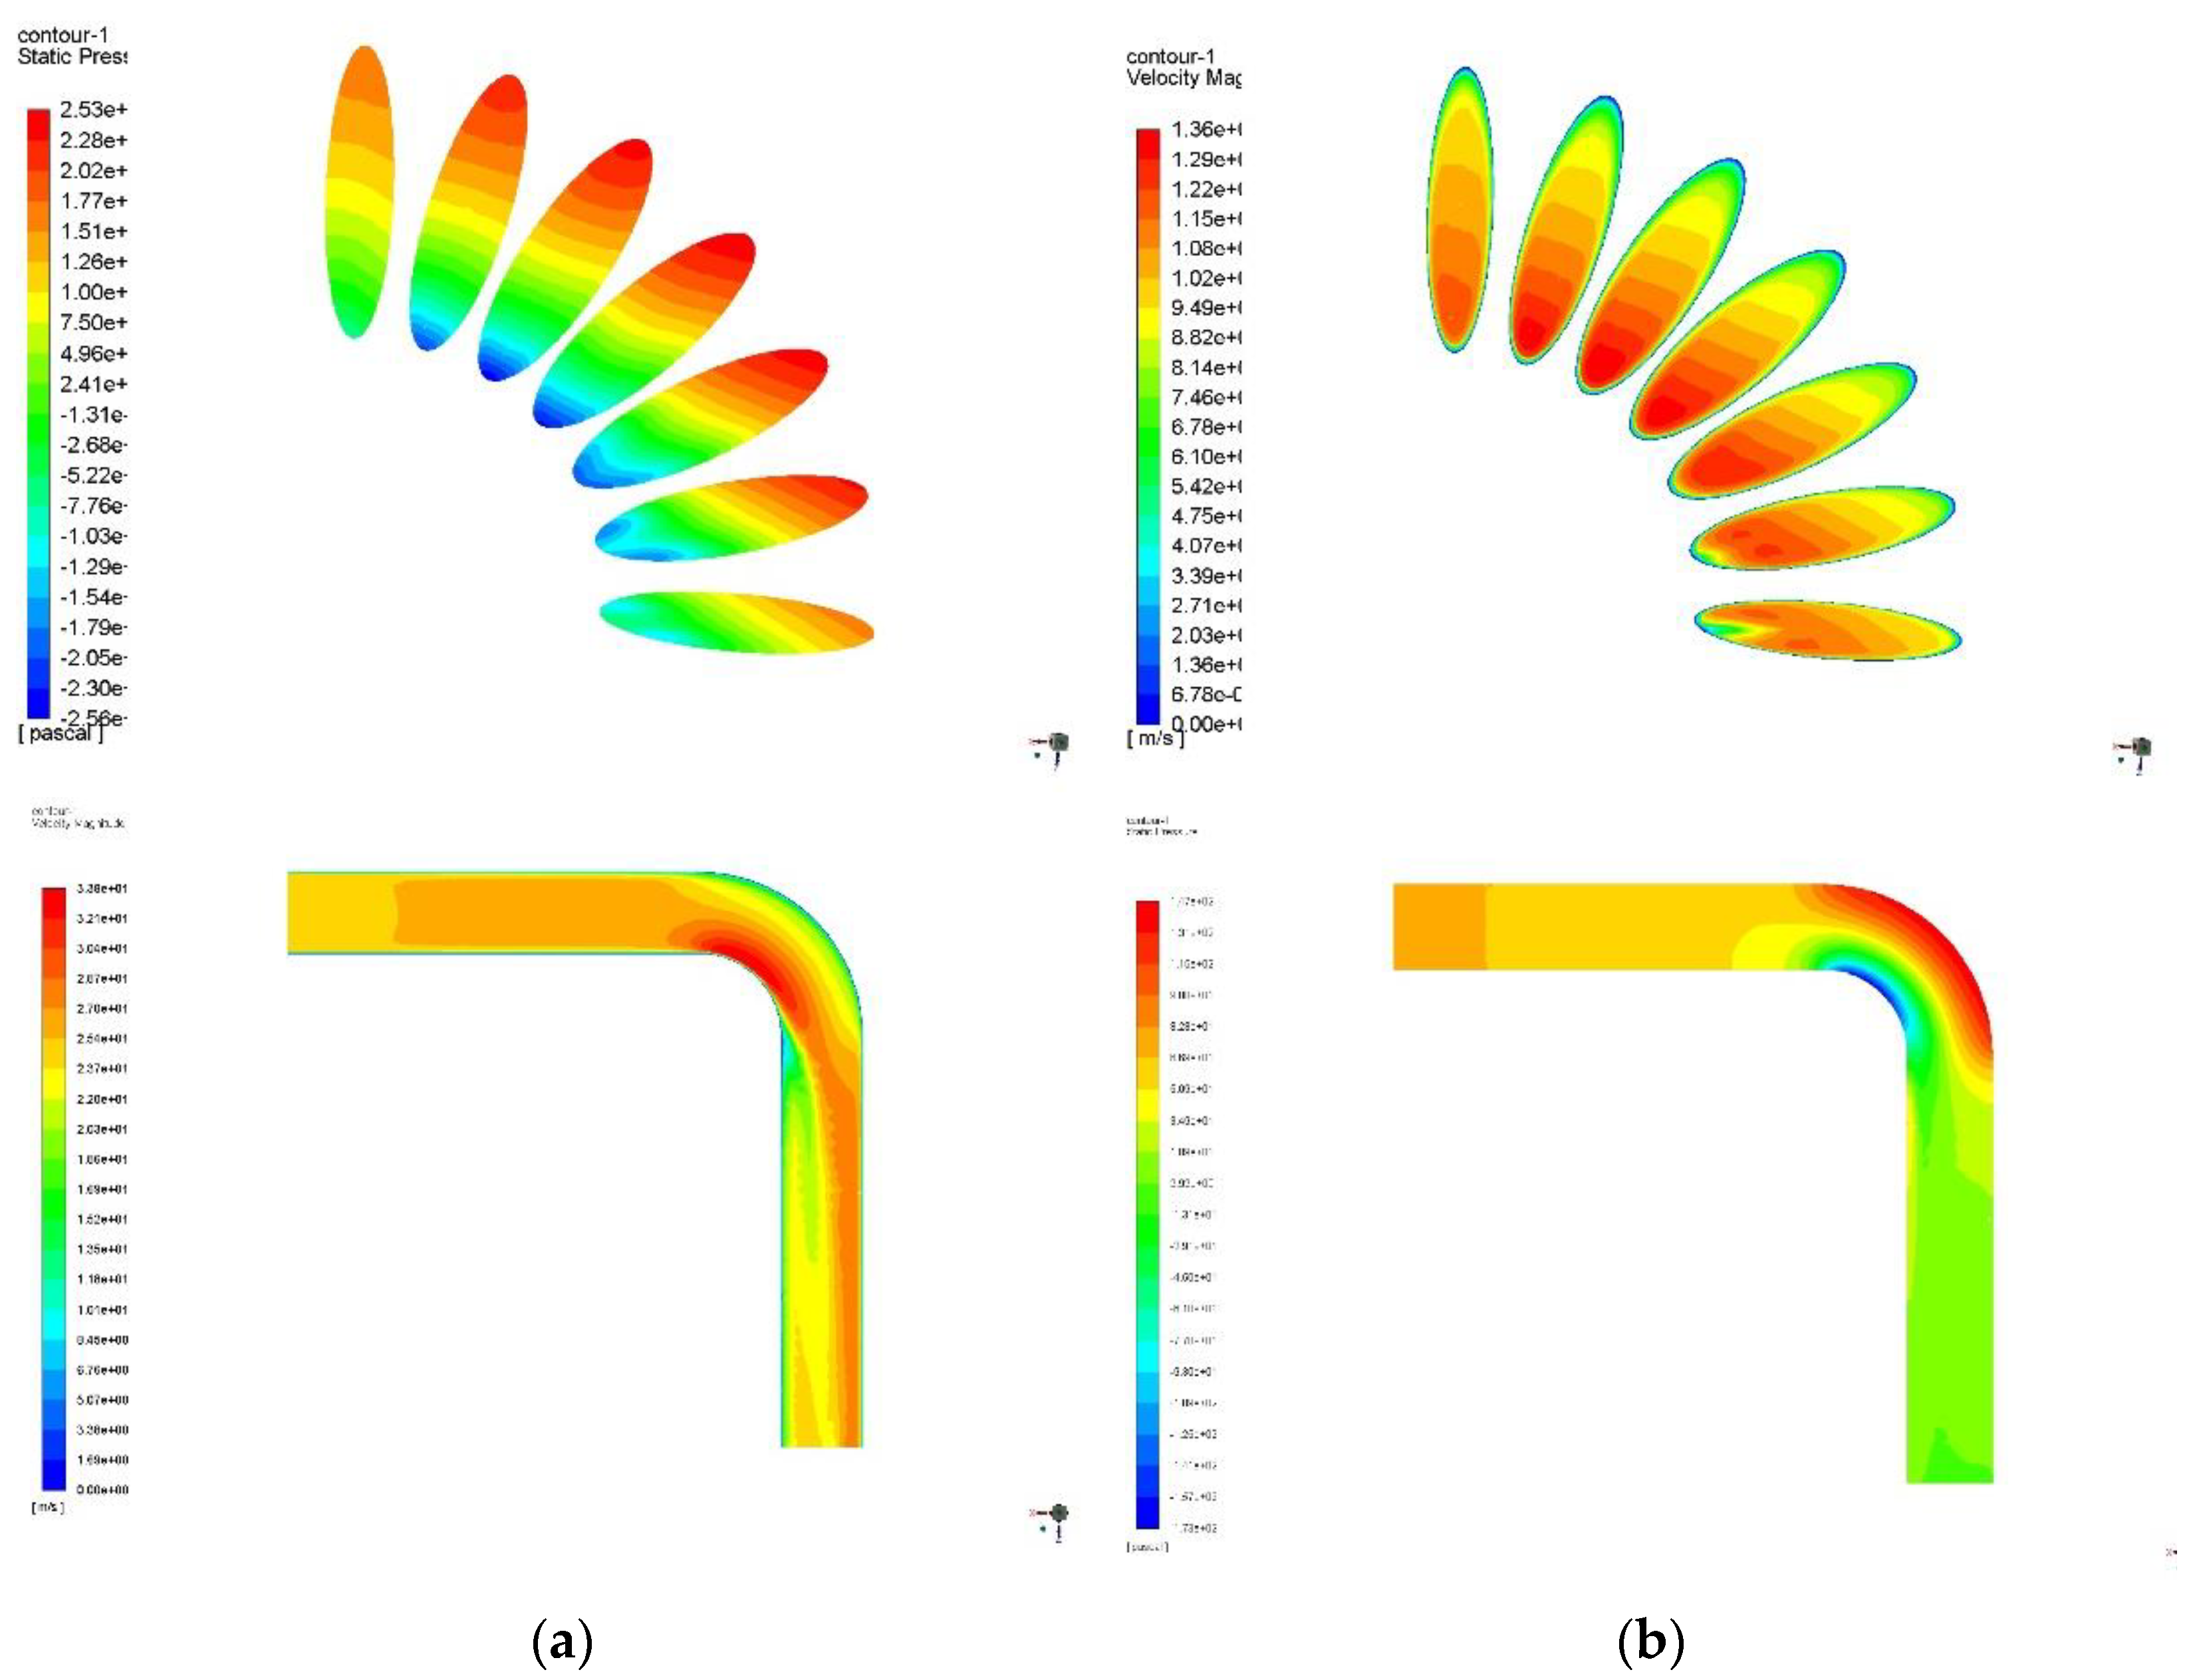
The pressure and the velocity distribution in Figure 9 show that the pressure rises significantly at the outer arc of the elbow, forming a high-pressure area, while the velocity decreases, and the pressure decreases gradually along the radial direction of the elbow. Numerically, the negative pressure appears at the inner arc of the elbow, where the pressure reaches the minimum value and the flow velocity is the highest. When the sand-carrying gas in the pipeline passes through the elbow, the flow direction of gas changes because of the change of the structure, so the pressure increases at the position of the outer arc surface. At the same time, a large number of particles impact the outer wall of the elbow from different angles, and almost no particles impact the inner wall, thus leading to serious erosion at the outer wall surface of the elbow. The maximum erosion rate of the pipe wall is 3.63 × 10⁻⁷ kg/(m2·s), where the density of the pipe is 7850 kg/m3, therefore, the annual maximum erosion depth of the pipe wall is 1.45 mm. The result shows that the sand carrying gas may lead to very serious erosion on the elbow, and moreover causes perforation failure. The following subsections use the controlled variable method on the basis of Table 2 to study the influence of various factors on erosion.

4.3. Effect of the Gas Velocity

Under the certain conditions of other influencing factors (where the diameter is 100 mm, sand shape coefficient is 0.53, the temperature is 300 K, elbow radius of curvature is 1.5D, sand diameter is 300 μm), the maximum erosion rate and particle motion trajectories at different gas velocity are obtained to study the effect of the gas velocity on the maximum erosion rate.
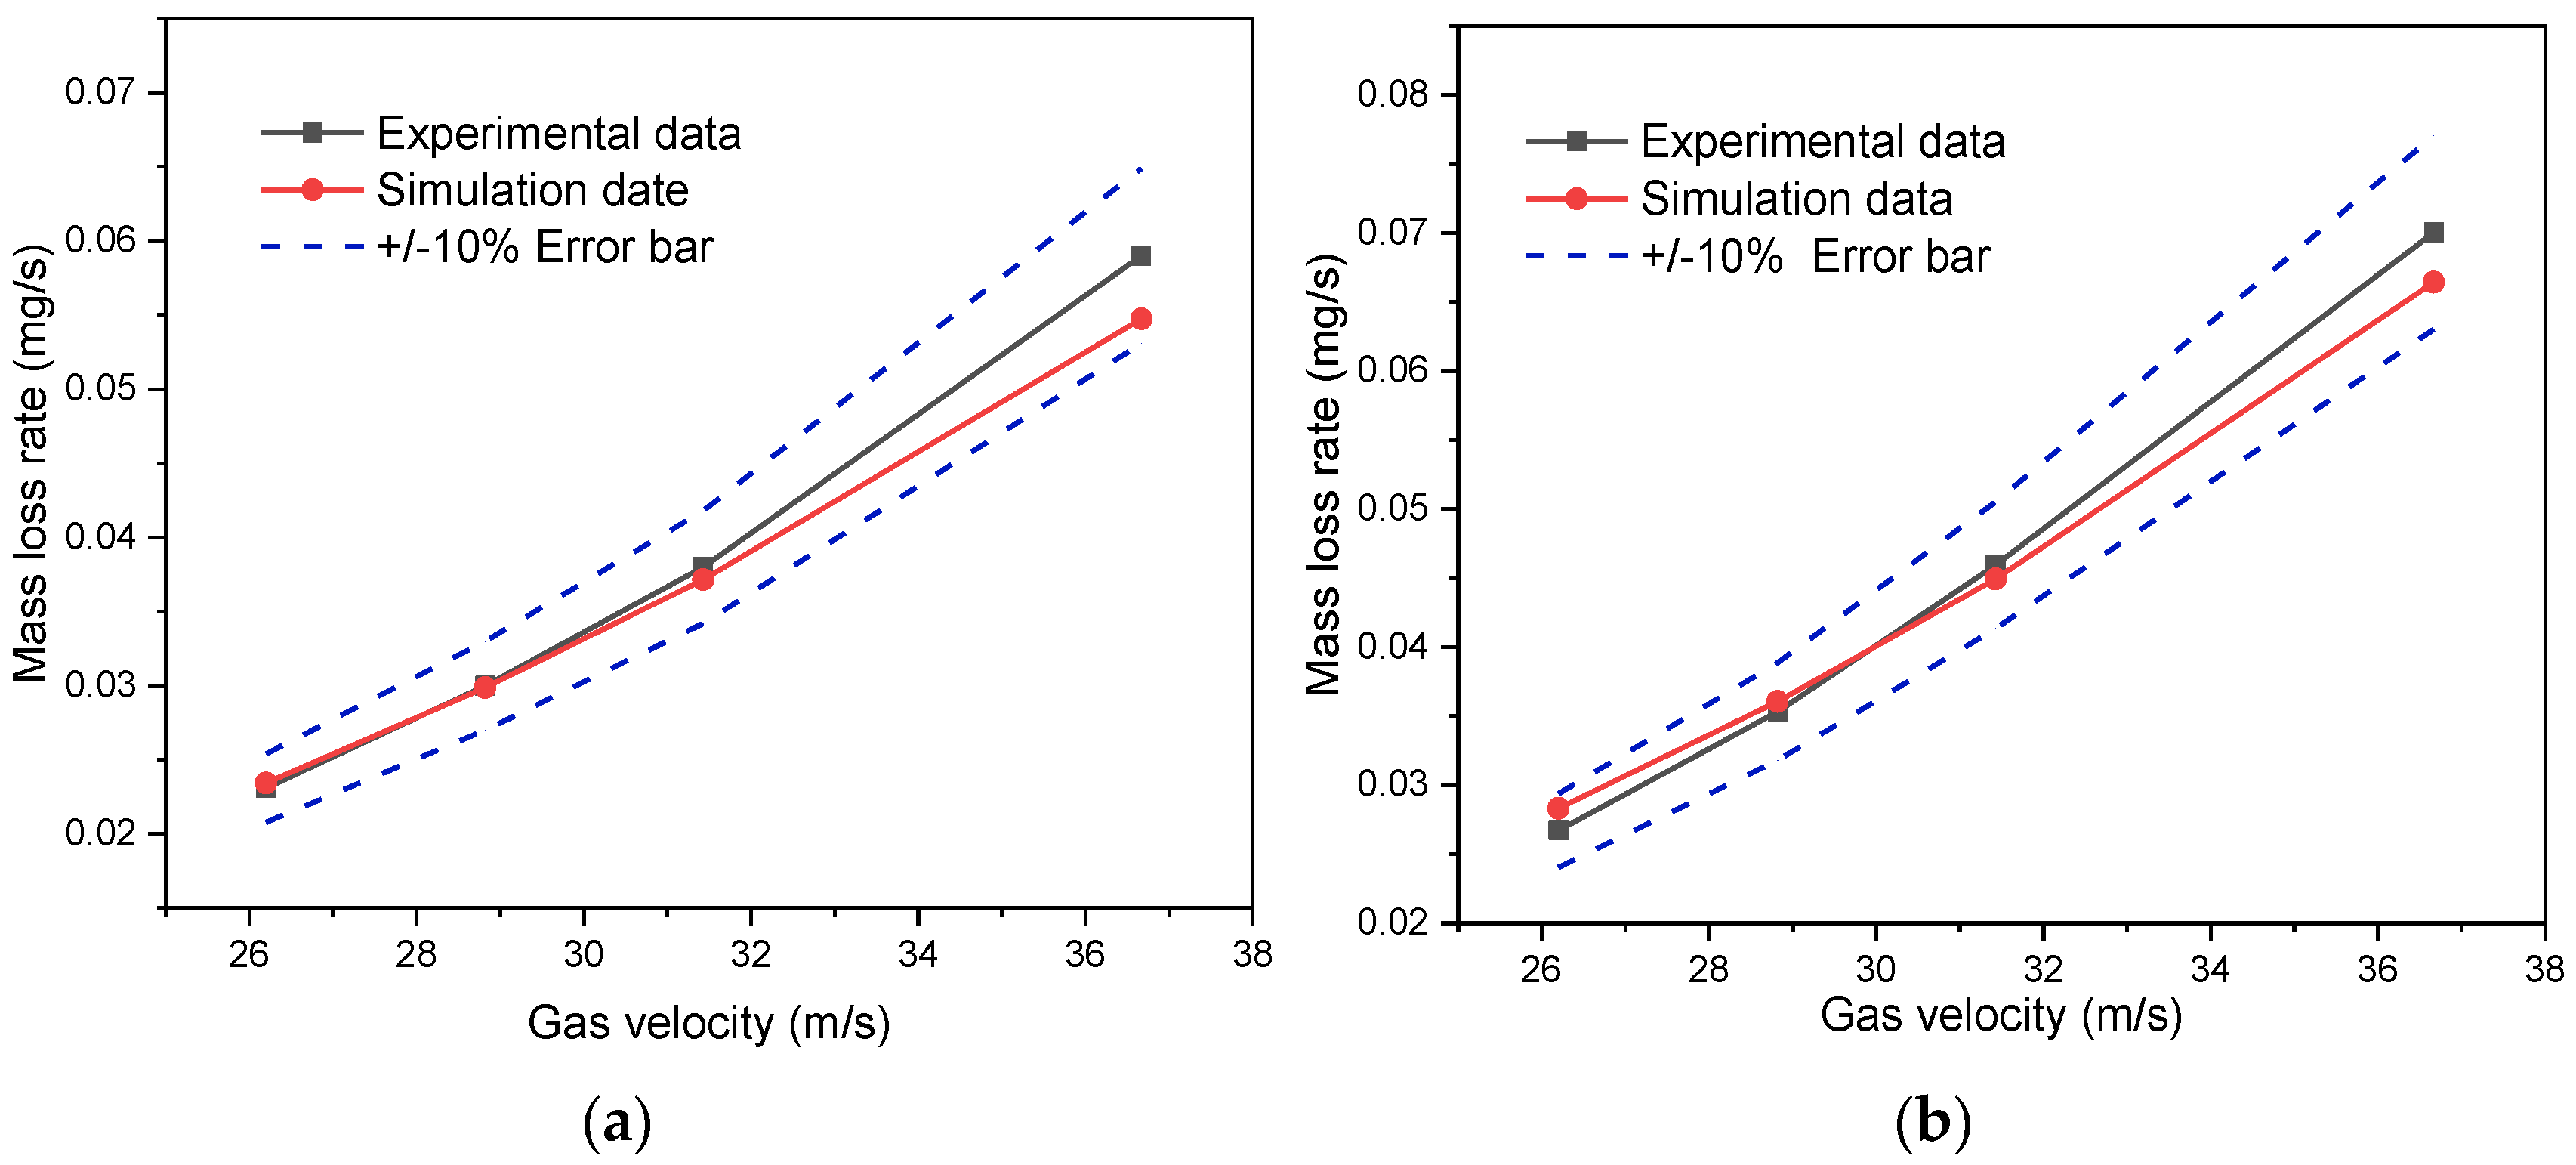
As can be seen from Figure 10a, the faster gas velocity is, the greater the maximum erosion rate of the pipe wall will be. On the one hand, as the gas velocity increases, the relative velocity between the sand particles and elbow wall increases as well, and the kinetic energy of the sand particles increases; on the other hand, as the flow velocity increases, the impacting frequency of the sand particles to elbow wall increases, thus causing the more serious erosion of the elbow wall. When the flow rate increases to about 10 m/s, the maximum erosion rate increases more obviously with the increase of gas velocity. Therefore, under this condition, the gas velocity should be controlled not to exceed 10 m/s, so as to slow down the erosion degree of the elbow wall. In addition, the following microscopic flow laws can be obtained through numerical simulation. when the fluid flows slowly, the low velocity makes the sand settle to the bottom of the horizontal elbow, and the gravitational influence on the sand particles dominates, leading to the erosion area of the elbow being concentrated at the bottom of the pipe. When the flow velocity increases, the maximum erosion area gradually moves from the bottom of the elbow to the outer wall of the elbow, and the trajectory of the sand particles becomes more complex.

4.4. Effect of the Sand Mass Flow Rate

Similarly, under the certain conditions of other influencing factors (where the diameter is 100 mm, sand shape coefficient is 0.53, the temperature is 300 K, the elbow radius of curvature is 1.5D, sand diameter is 300 μm), the maximum erosion rate and particle motion trajectories at different sand mass flow rate are obtained to study the effect on the maximum erosion rate.
With the increase of the sand mass flow rate, the movement trajectory of the sand particles is basically the same and the maximum erosion position of the pipe wall is unchanged. However, the maximum erosion rate shows a significant linear upward trend in Figure 10b, which indicates that the increase of sand content in the pipeline can enhance the erosion wear of the pipe wall. This is because as the mass flow rate of sand particles increases, the number of particles in the pipeline also increases. Therefore, the frequency of particle impact on the wall per unit area increases, resulting in an increase in the erosion rate of the pipe wall.

4.5. Effect of the Particle Diameter

Figure 11 shows the contours of erosion rate and particle movement trajectories under different particle diameters. In the case of a certain sand mass flow rate, the smaller the particle diameter, the greater the number. Therefore, when the particle diameter is small, the erosion area of the elbow is larger, and when the particle diameter is larger, the erosion area of the elbow pipe is more concentrated, and the erosion area is smaller. In addition, the larger the particle size, the more obvious the influence of gravity on the particles, thus the more obvious sinking will occur during the movement.
Figure 12a shows that there is a “critical particle diameter “, which is 100 μm under the working conditions used in this paper. When the diameter of sand is less than the critical particle diameter, the maximum erosion rate increases obviously with the increase of sand diameter, while when it is more than the critical particle diameter, the maximum erosion rate starts fluctuating and changing little, which is determined by the particle diameter and the number of particles.

4.6. Effect of the Particle Shape Coefficient

Figure 12b shows that the maximum erosion rate increases gradually when the shape coefficient of sand particles increases from 0.2 to 1, especially when the sand particle diameter is small, the change becomes more obvious.

4.7. Effect of the Pipe Diameter

Using the controlled variable method, the variation law of the maximum erosion rate with the pipe diameter is obtained, as shown in Figure 13a. When the pipe diameter is less than 80 mm, as the pipe diameter increases, the maximum erosion rate of the pipe wall decreases rapidly; but when the pipe diameter is greater than 80 mm, the maximum wall erosion rate decreases slowly.
This is because when the pipe diameter is small, the particles in the pipe are more concentrated, and the part that hits the inner wall of the elbow when passing through the elbow is more concentrated. On the contrary, when the pipe diameter is larger, the radial space inside the pipe is larger, the distribution of particles is more dispersed, the particles are obviously affected by gravity, and gradually deposit at the bottom of the pipe, resulting in the offset of the erosion area compared with the smaller pipe diameter. In addition, the probability of solid particles hitting a unit pipe wall area decreases, resulting in a relatively small maximum erosion rate. In addition, the probability of solid particles impacting on the unit wall area decreases, resulting in a relatively small maximum erosion rate.

4.8. Effect of the Elbow Radius of Curvature

The influence of four kinds of the elbow radius of curvature of 1.5D, 2D, 4D and 5D on the maximum erosion rate was studied. It can be seen from Figure 13b that the maximum erosion rate of the pipe wall decreases with the increase of the elbow radius of curvature, and the decreasing trend is more obvious when the radius is small. This is because the bending path becomes longer with the increase of elbow radius; when the elbow radius is 4D and 5D, the particles impact the wall twice at the elbow, resulting in the erosion area becoming longer; but when the elbow radius is 1.5D and 2D, the particles impact the pipe wall more intensively, so the erosion area is more concentrated.

5. Dimensionless Analysis

Different flow and particle parameters have different effects on the erosion rate. Based on numerical simulation data above, a dimensionless mechanism model describing erosion can be obtained through dimensional analysis, which makes it easier to predict erosion rate and develop the correlation. The dimensionless erosion (ER/Vg) is a function of the following three dimensionless group [21]:
{ π 1 = ρ g V g D μ g π 2 = d p D π 3 = ρ p ρ g
where π1 is the Reynolds number (Re), π2 is the ratio of particle diameter (dp) to the pipe diameter (D), and π3 is the ratio of particle density (ρp) to the gas density (ρg), ER and 
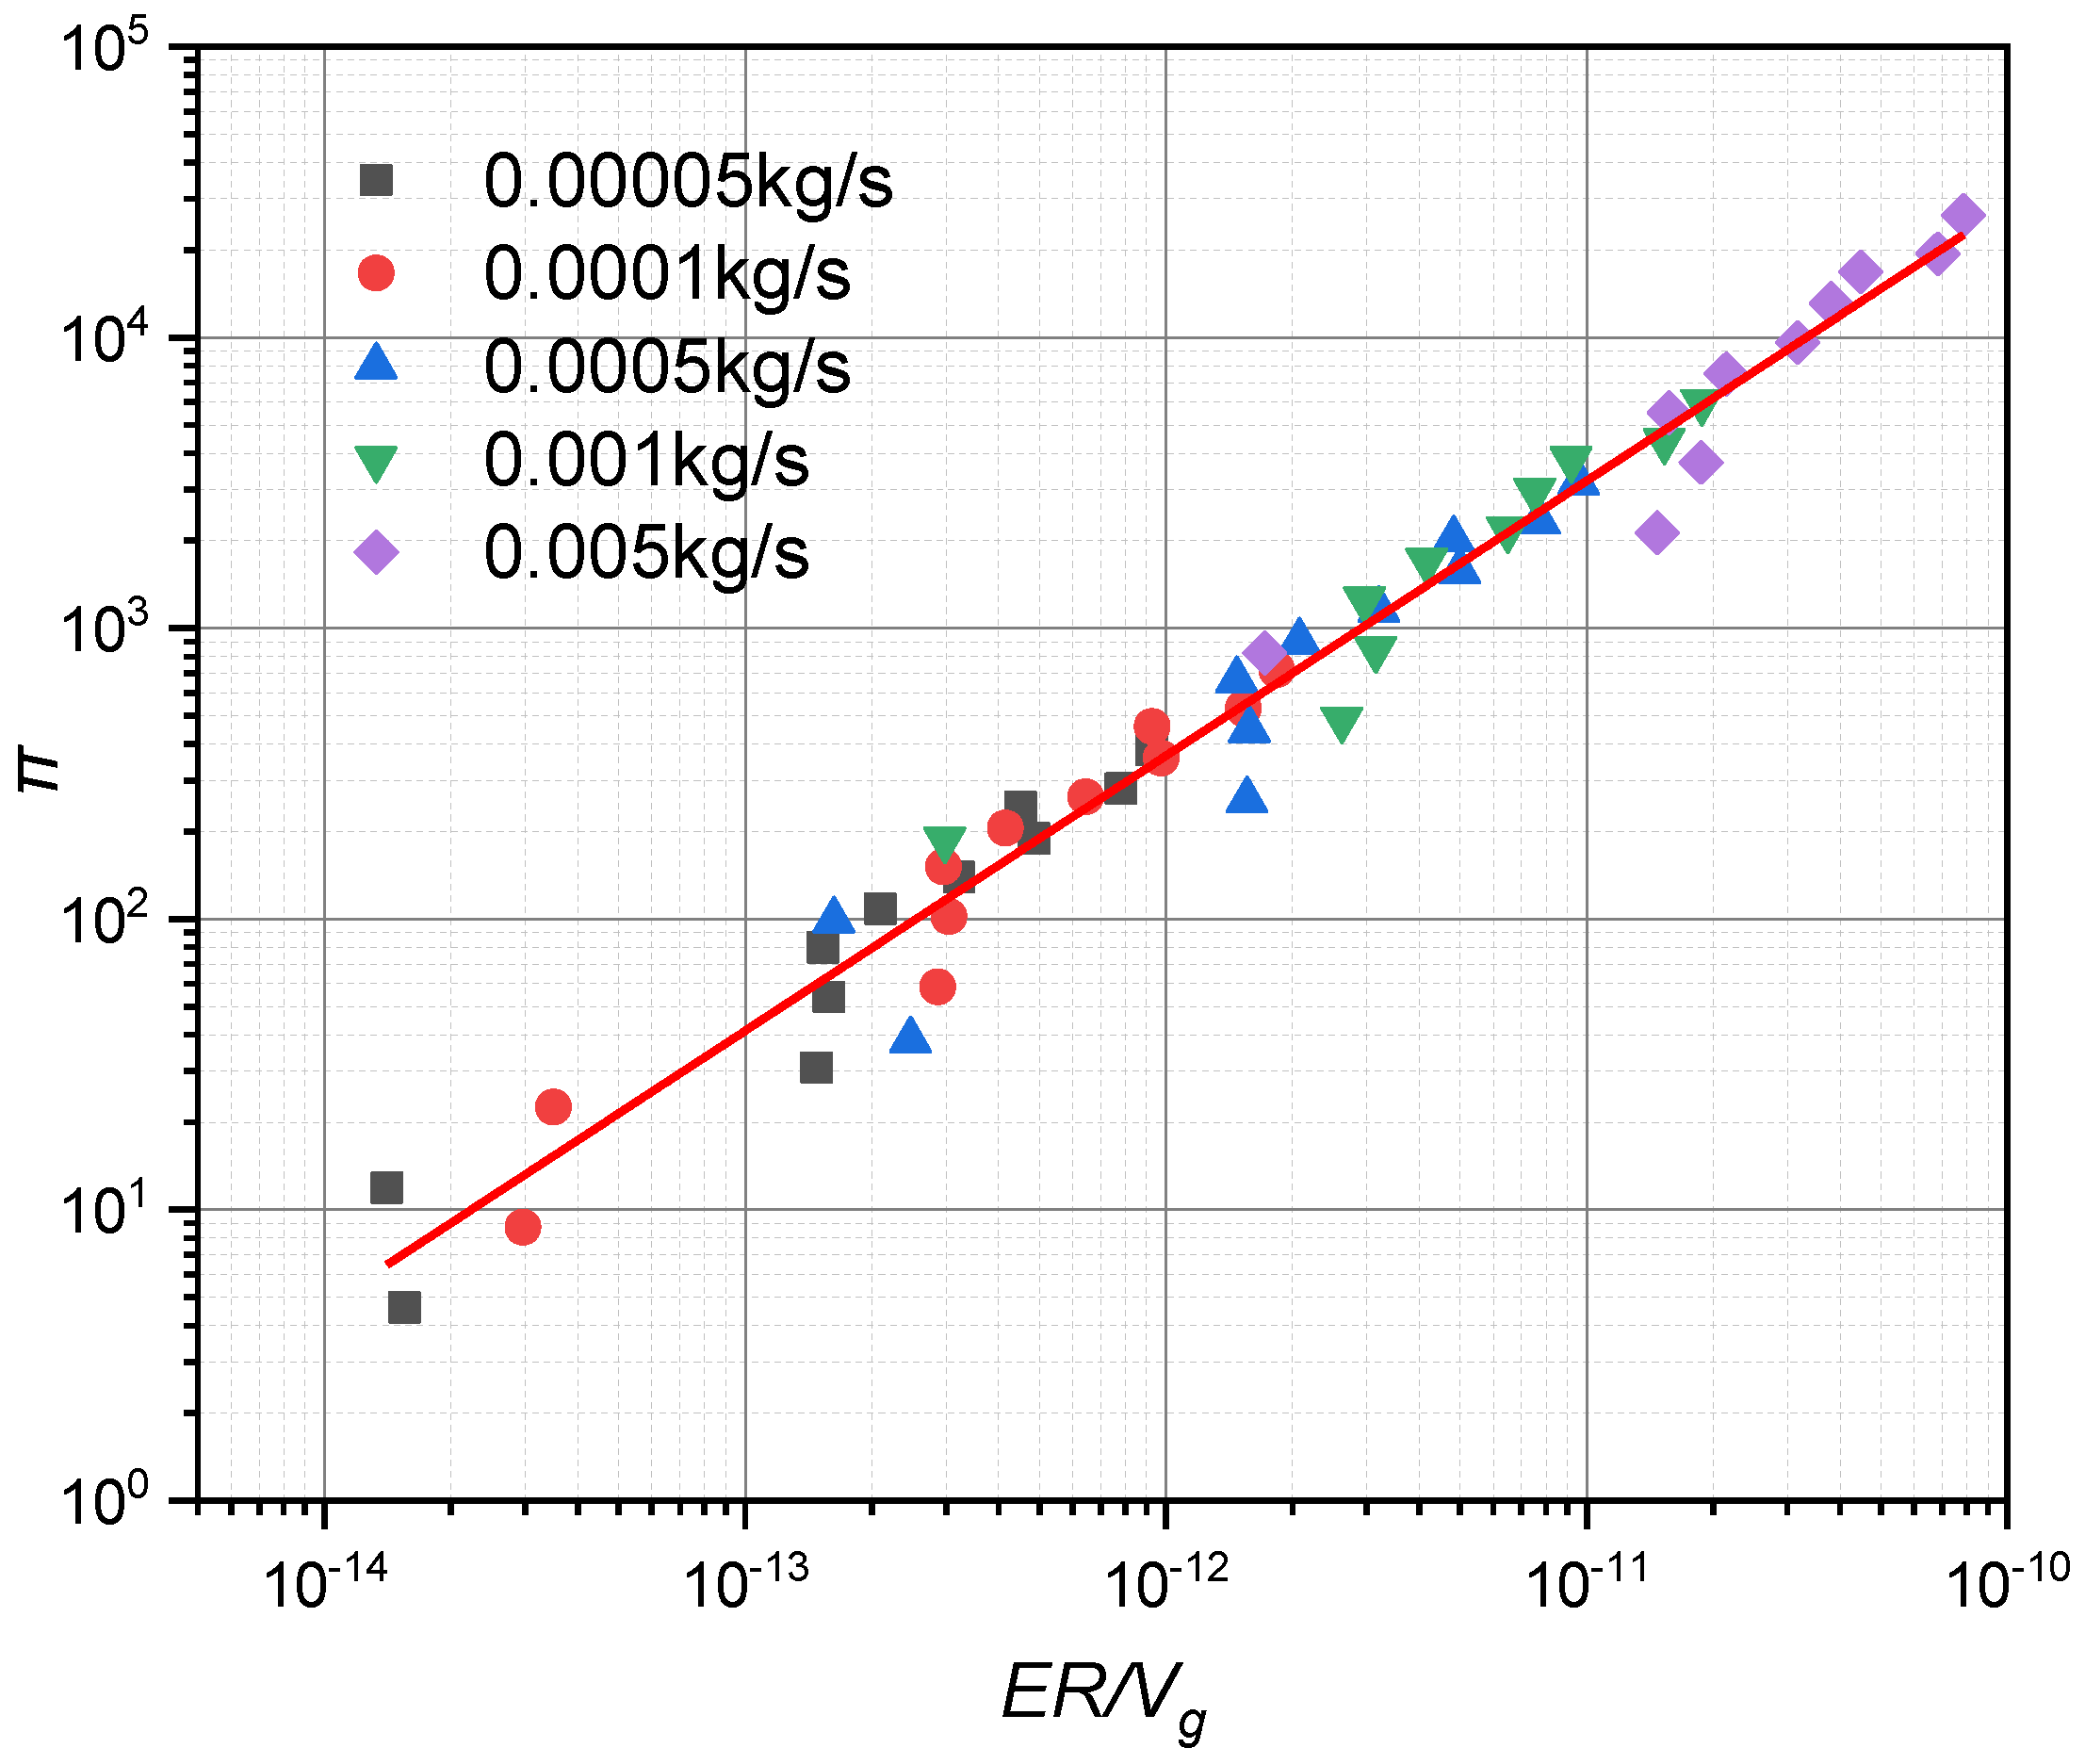
Vg are the erosion rate and the gas velocity, respectively. Because the erosion rate is related to the number of particles, so the number of particles should be considered and the number of particles (Np) when the particle mass flow is 0.001 kg/s is used as a reference particle number (Np_ref). Then, a power-law relationship is employed to combine the three equations above and into the number of particles one group:
π 4 = R e α × ( d p D ) β × ( ρ p ρ f ) γ × ( N p _ r e f N p ) η
where α, β, γ and η are undetermined coefficients that can be obtained by data regression. The combined dimensionless group (π4) is plotted against dimensionless erosion ratio. As shown in Figure 14, for each specific particle mass flow rate, the corresponding results are in a linear relationship approximately demonstrating that the data points for different conditions are on the same single line.
Therefore, the undetermined coefficients α, β, γ and η are obtained, so dimensionless group (π) is expressed as following:
π = R e 1.372 × ( d p D ) 3.41 × ( ρ p ρ g ) 1.45 × ( N p _ r e f N p ) 0.92
In addition, based on Figure 14, the following correlation is established:
ER V g = 2.3754 × 10 15 × ( π ) 1.0280
Which can also be written as:
ER V g ( R e 1.372 × ( d p D ) 3.41 × ( ρ p ρ g ) 1.45 × ( N p _ r e f N p ) 0.92 ) 1.0280
This indicates that:
E R V g 2.41   and   E R D 2.10
From the analysis results, it can be found that erosion in an elbow is proportional to the gas velocity to the power of 2.41, which is close to the value of 2.6 in Section 2.3. And as the elbow’s diameter increases, erosion rate decreases with the square of the diameter, which is consistent with the results in Section 4.7.

6. Conclusions

This paper aims to investigate the elbow erosion of gas-solid two-phase flow in shale gas fields by a numerical simulation method. An integrated CFD-DPM model is established coupling the realizable k-ε turbulence model, discrete phase model and erosion model to determine the maximum erosion rate. Compared with the experimental data, the calculation error is within 10%. For the results the following conclusions can be put forth:
(1)
The erosion is concentrated at the outer wall of the elbow, and the maximum erosion position is about 60° at the outer arc of the elbow. The particle motion trajectories indicate that the particles are approximately moving in a straight line before entering the elbow and the motion trajectory changes when they hit the pipe wall more intensively at the outer arc of the elbow. The clustering of particles leads to increased erosion rate at the outer wall of the elbow.
(2)
The influence law of different factors on erosion is studied. The gas velocity, mass flow rate and shape coefficient of sand particles are positively correlated with the maximum erosion rate, while the pipe diameter and the elbow radius of curvature are negatively correlated with the maximum erosion rate.
(3)
With the increase of the elbow radius of curvature, the maximum erosion rate decreases gradually, and when the elbow radius of curvature is relatively small, the downward trend is more obvious. Therefore, in line with the engineering design specifications, it is necessary to avoid the use of elbow with small radius of curvature as far as possible, in order to prevent severe erosion at the elbow resulting in potential safety hazards.
(4)
A new correlation was developed, which included four dimensionless groups namely Reynolds number, diameter ratio, density ratio and particle number. The correlation can be used to predict maximum corrosion rate of elbows.

Author Contributions

Conceptualization, B.H. and X.L.; methodology, B.H. and Y.Y.; software and validation, B.H., Y.L. (Yanbo Li) and Y.Y.; writing—original draft preparation, B.H., Y.L. (Yu Li) and D.A.; writing—review and editing, B.H. and Y.W.; visualization, B.H., Y.L. (Yanbo Li) and Y.Y.; supervision, X.L. and J.G.; funding acquisition, B.H. and J.G. All authors have read and agreed to the published version of the manuscript.

Funding

This research was funded by the National Science and Technology Major Project of China (2016ZX05066005-001), National Natural Science Foundation of China (51874323), National Key Research and Development Plan of China (2016YFC0303704), Zhoushan Science and Technology Project (2021C21011) and Science Foundation of Zhejiang Ocean University (11025090721), all of which are gratefully acknowledged.

Institutional Review Board Statement

Not applicable.

Informed Consent Statement

Not applicable.

Data Availability Statement

Not applicable.

Conflicts of Interest

The authors declare no conflict of interest.

References

  1. Liu, P.; Wang, Y.; Yan, F.; Nie, C.; Ouyang, X.; Xu, J.; Gong, J. Effects of Fluid Viscosity and Two-Phase Flow on Performance of ESP. Energies 2020, 13, 5486. [Google Scholar] [CrossRef]
  2. Xu, J.; Lian, Z.; Hu, J.; Luo, M. Prediction of the Maximum Erosion Rate of Gas–Solid Two-Phase Flow Pipelines. Energies 2018, 11, 2773. [Google Scholar] [CrossRef] [Green Version]
  3. Jia, W.; Zhang, Y.; Li, C.; Luo, P.; Song, X.; Wang, Y.; Hu, X. Experimental and numerical simulation of erosion-corrosion of 90° steel elbow in shale gas pipeline. J. Nat. Gas Sci. Eng. 2021, 89, 103871. [Google Scholar] [CrossRef]
  4. Wang, K.; Li, X.; Wang, Y.; He, R. Numerical investigation of the erosion behavior in elbows of petroleum pipelines. Powder Technol. 2017, 314, 490–499. [Google Scholar] [CrossRef]
  5. Vieira, R.E.; Parsi, M.; Zahedi, P.; McLaury, B.S.; Shirazi, S.A. Sand erosion measurements under multiphase annular flow conditions in a horizontal-horizontal elbow. Powder Technol. 2017, 320, 625–636. [Google Scholar] [CrossRef]
  6. Vieira, R.E.; Mansouri, A.; McLaury, B.S.; Shirazi, S.A. Experimental and computational study of erosion in elbows due to sand particles in air flow. Powder Technol. 2016, 288, 339–353. [Google Scholar] [CrossRef]
  7. Zeng, D.; Zhang, E.; Ding, Y.; Yi, Y.; Xian, Q.; Yao, G.; Zhu, H.; Shi, T. Investigation of erosion behaviors of sulfur-particle-laden gas flow in an elbow via a CFD-DEM coupling method. Powder Technol. 2018, 329, 115–128. [Google Scholar] [CrossRef]
  8. Zhu, H.; Qi, Y. Numerical investigation of flow erosion of sand-laden oil flow in a U-bend. Process Saf. Environ. Prot. 2019, 131, 16–27. [Google Scholar] [CrossRef]
  9. Hong, B.; Li, X.; Song, S.; Chen, S.; Zhao, C.; Gong, J. Optimal planning and modular infrastructure dynamic allocation for shale gas production. Appl. Energy 2020, 261, 114439. [Google Scholar] [CrossRef]
  10. Zahedi, P.; Parsi, M.; Asgharpour, A.; McLaury, B.S.; Shirazi, S.A. Experimental investigation of sand particle erosion in a 90° elbow in annular two-phase flows. Wear 2019, 438–439, 203048. [Google Scholar] [CrossRef]
  11. Cao, X.; Li, X.; Fan, Y.; Peng, W.; Xie, Z. Effect of superficial air and water velocities on the erosion of horizontal elbow in slug flow. Powder Technol. 2020, 364, 785–794. [Google Scholar] [CrossRef]
  12. Leporini, M.; Marchetti, B.; Corvaro, F.; di Giovine, G.; Polonara, F.; Terenzi, A. Sand transport in multiphase flow mixtures in a horizontal pipeline: An experimental investigation. Petroleum 2019, 5, 161–170. [Google Scholar] [CrossRef]
  13. Zhang, E.; Zeng, D.; Zhu, H.; Li, S.; Chen, D.; Li, J.; Ding, Y.; Tian, G. Numerical simulation for erosion effects of three-phase flow containing sulfur particles on elbows in high sour gas fields. Petroleum 2018, 4, 158–167. [Google Scholar] [CrossRef]
  14. Peng, W.; Cao, X.; Hou, J.; Ma, L.; Wang, P.; Miao, Y. Numerical prediction of solid particle erosion under upward multiphase annular flow in vertical pipe bends. Int. J. Press. Vessel. Pip. 2021, 192, 104427. [Google Scholar] [CrossRef]
  15. Jia, W.; Lin, Y.; Yang, F.; Li, C. A novel lift-off diameter model for boiling bubbles in natural gas liquids transmission pipelines. Energy Rep. 2020, 6, 478–489. [Google Scholar] [CrossRef]
  16. Peng, W.; Cao, X.; Hou, J.; Xu, K.; Fan, Y.; Xing, S. Experiment and numerical simulation of sand particle erosion under slug flow condition in a horizontal pipe bend. J. Nat. Gas Sci. Eng. 2020, 76, 103175. [Google Scholar] [CrossRef]
  17. Farokhipour, A.; Mansoori, Z.; Saffar-Avval, M.; Ahmadi, G. 3D computational modeling of sand erosion in gas-liquid-particle multiphase annular flows in bends. Wear 2020, 450–451, 203241. [Google Scholar] [CrossRef]
  18. Zhu, H.; Wang, J.; Ba, B.; Wu, Z.; Wang, W. Numerical investigation of flow erosion and flow induced displacement of gas well relief line. J. Loss Prev. Process Ind. 2015, 37, 19–32. [Google Scholar] [CrossRef]
  19. Liu, Q.; Luo, Z.-H. CFD-VOF-DPM simulations of bubble rising and coalescence in low hold-up particle-liquid suspension systems. Powder Technol. 2018, 339, 459–469. [Google Scholar] [CrossRef]
  20. Forder, A.; Thew, M.; Harrison, D. A numerical investigation of solid particle erosion experienced within oilfield control valves. Wear 1998, 216, 184–193. [Google Scholar] [CrossRef]
  21. Parsi, M.; Arabnejad, H.; Al-Sarkhi, A.; Zahedi, P.; Vieira, R.E.; Sharma, P.; McLaury, B.S. A new correlation for predicting solid particle erosion caused by gas-sand flow in elbows. In Proceedings of the Offshore Technology Conference (OTC 2018), Houston, TX, USA, 30 April–3 May 2018. [Google Scholar]
Figure 1. The experiment equipment and the specimen. (a) Experimental device of particle erosion, (b) Metal cylindrical specimen.
Energies 14 03804 g001
Figure 2. Mesh of models with different particle impact angle. (a) 15°; (b) 30°; (c) 45°; (d) 60°; (e) 90°; (f) Cross-sectional slices.
Energies 14 03804 g002
Figure 3. The relationship between erosion rate and particle impact angle. (a) Gas velocity 26.2 m/s and particle mass flow rate 10.73 g/s; (b) Gas velocity 28.82 m/s and particle mass flow rate 11.37 g/s.
Energies 14 03804 g003
Figure 4. The relationship between erosion rate and gas velocity. (a) Particle mass flow rate 10 g/s; (b) Particle mass flow rate 12 g/s.
Energies 14 03804 g004
Figure 5. Mesh diagram. (a) Computing mesh; (b) Local mesh refinement; (c) Inlet cross-section.
Energies 14 03804 g005
Figure 6. Analysis of mesh independence by comparing the maximum erosion rate with different grid quantities.
Energies 14 03804 g006
Figure 7. Erosion rate distribution and particle trajectories in the elbow.
Energies 14 03804 g007
Figure 8. DPM concentration distribution and particle trajectories. (a) DPM concentration distribution; (b) Particle trajectories.
Energies 14 03804 g008
Figure 9. Contours of pressure and gas velocity. (a) Pressure distribution in elbow; (b) Gas velocity distribution in elbow.
Energies 14 03804 g009
Figure 10. Effect of the gas velocity and particle mass flow rate on the maximum erosion rate. (a) Gas velocity; (b) Particle mass flow rate.
Energies 14 03804 g010
Figure 11. Erosion rate distribution and particle trajectories in the elbow with different particle diameter. (a) erosion rate distribution of 25 μm; (b) erosion rate distribution of 100 μm; (c) erosion rate distribution of 500 μm; (d) particle trajectories of 25 μm; (e) particle trajectories of 100 μm; and (f) particle trajectories of 25 μm.
Energies 14 03804 g011
Figure 12. Effect of the particle diameter and particle shape coefficient on the maximum erosion rate. (a) Particle diameter; (b) Particle shape coefficient.
Energies 14 03804 g012
Figure 13. Effect of the pipe diameter and elbow radius of curvature on the maximum erosion rate. (a) Pipe diameter; (b) Elbow radius of curvature.
Energies 14 03804 g013
Figure 14. Relationship of π versus dimensionless erosion ratio.
Energies 14 03804 g014
Table 1. Parameters of the impact angle function.
Point12345
Angle020304590
Value00.810.50.4
Table 2. Parameters of the impact angle function.
Influencing FactorsVariable Value
Gas flow rate (m/s)1/2/4/6/8/10/12/15
Sand mass flow (kg/s)0.005/0.001/0.0005/0.0001/0.00005
Sand particle size (μm)25/50/100/200/300/400/500/600/800
Shape coefficient of sand1/0.53/0.2
Inner diameter (mm)25/50/80/100/150/200/300
elbow radius of curvature1.5D/2D/4D/5D
Publisher’s Note: MDPI stays neutral with regard to jurisdictional claims in published maps and institutional affiliations.

