1. Introduction
Over the last five decades the rapid growth of aviation has had numerous negative environmental impacts as a result of the combustion of fossil fuels in aircraft engines. These effects, in the form of atmospheric greenhouse gas emissions, noise emissions and land occupation, have direct and indirect impacts on human quality of life and health [
1]. Recently, extensive research has been conducted to identify ways to mitigate the negative environmental impacts of air transport. The use of biofuels, carbon footprint taxation, and the development of navigation systems resulting in shorter flight times and thus reduced fuel consumption have been identified as the main ways to achieve this goal.
This article presents the relationship between air transport and greenhouse gas emissions. Various socio-economic policy tools implemented by the European Union countries, such as environmental taxes and GDP, and their connection with the growth of the aviation sector as well as their impact on greenhouse gas emissions were taken into consideration.
Greenhouse gas emissions from international aviation have more than doubled over the past two decades. Although international aviation accounts for less than 3.5% of the EU’s total greenhouse gas emissions, it is the source of the world’ fastest-growing emissions, having a severe impact on climate change. This is mainly due to record traffic growth caused by rising passenger numbers (until the global pandemic caused by the COVID-19 virus) and by increased trade. In addition, these sectors have only recently become the focus of efforts to reduce greenhouse gas emissions, both at the EU and global levels.
Another instrument that is closely related to air transport is environmental taxes. The Finance Ministers of the EU Member States have recognized that air travel is too easily accessible, and therefore they proposed the implementation of a common aviation tax, which would significantly reduce the harmful effects of air transport on the environment by shifting part of the demand to other modes of transport. Aviation is insufficiently taxed in comparison with other modes of transport; as it is exempt from excise duty, there is no VAT included in the price of tickets for international flights, and there is no coordinated common tax or any other economic instrument across Europe that would reduce greenhouse gas emissions. In addition, there is no charge for aircraft noise or pollution included in the price of tickets for such flights. Attention should also be paid to the competitiveness of air transport in individual Member States and the important role it plays in these countries in terms of geographical location and level of economic development; this is why another instrument—Gross Domestic Product—was included in the analysis.
Having examined the above variables, the authors attempted to create a typification that represents the interplay between GHG emissions and air transport, environmental taxes and GDP from 2009 to 2018.
The purpose of this paper is to diagnose the relationship between the development of the aviation sector in EU countries and the level of GHG emissions, the revenues from environmental taxes and GDP per capita, with the latter being a measure of economic development. On this basis, possible ways to reduce GHG emissions from aviation were indicated, and recommendations for further development of air transport and carriers were made.
The article consists of five sections.
Section 1, the Introduction, describes the socio-economic background for the research undertaken.
Section 2, the Literature Review, discusses the literature with a view to identifying the research gap concerning the relationship between sustainable aviation and GHG emissions from this mode of transport, environmental taxes in aviation, as well as the relationship between aviation and the level of economic development, as measured by GDP per capita.
Section 3 lists the variables and describes the research methods. The main research results and their discussion are presented in
Section 4, Results and Discussion. Finally,
Section 5 presents the conclusions from the study and the contribution the paper makes to the existing literature on the subject.
2. Literature Review
The topic of sustainable transport, with particular emphasis on air transport, has been frequently raised in recent years as a consequence of the growing awareness of the progressive environment degradation resulting from human activity. One of the pressing problems is greenhouse gas emissions from air transport and their impact on the environment. A book on sustainable aviation [
2] identifies GHG emissions as one of the most important elements of sustainable aviation. Diverse initiatives and projects, mainly related to reducing fuel demand or modifying fuel composition, have been undertaken to reduce GHG emissions. Their objectives are as follows:
improved aerodynamics and propulsion efficiency of aircrafts to reduce energy demand,
improved effectiveness in the use of airspace,
improved effectiveness of flight planning and aircraft operations,
development of new energy sources for existing aircraft types,
new solutions to offset or reverse the effects of emissions, and
development of new modes of transport, travel patterns or types of aircraft that will reduce or completely eliminate the need for fossil fuels.
In a book on the relationship between air transport and the environment [
3], the most important types of greenhouse gases emitted by aircraft are listed, and their environmental impact is identified. The possibilities and ways to reduce emissions are shown, and the resulting negative impact on the environment in various areas of air transport industry, i.e., engine and fuselage technologies, fuel types, operating methods and legal regulations, is discussed. The same topic was addressed by [
4] in a report prepared by the working groups of the International Panel on Climate Change. As in the previously cited publication, it specified different types of pollutants emitted by air transport and their impact on selected elements of the environment. It also divided aviation activity into two areas—technological and operational—and then showed their association with the emission of pollutants. In the final part of the paper, possible scenarios for the future development of aviation were proposed as well as the resulting pollution.
In another work [
5], consideration is given to the possibility of reducing emissions from air transport by 2025 without simultaneously reducing the demand for air freight performance [
5]. Having analyzed the levels of emissions, their rate of growth, and the current level of technological development, the authors conclude that the above possibility is unlikely, and additional steps are needed to curb global warming. In another article [
6], the authors list the share of greenhouse gas emissions from air transport in various areas of the European Union economy and trends in recent years. However, they point out the necessity of taking steps leading to changes in these trends in order to meet the environmental goals set by the EU to be achieved by 2050. The effects of increasing emissions from air transport and how to prevent them in the future are also addressed by [
7] in an article on long-term strategies to counteract the carbon footprint of commercial aviation. The authors first point to the growing demand in the commercial air transport market and the resulting increase in GHG emissions. Based on an analysis of future market trends, they list five potential areas where changes need to be made to make air transport more environmentally friendly: improvements in technological efficiency, improvements in operational efficiency, use of alternative fuels, shifting the demand, and CO
2 costs. Based on this, they develop 34 possible scenarios for further development, taking into account the above-mentioned areas; however, none succeed in balancing the demand growth with halting the emissions growth. However, the main conclusion reached by the authors is that it is necessary to combine all five aforementioned areas of the air transport industry in order to make air transport in the future as environmentally and economically sustainable as possible. In [
8], the issue of GHG emissions from air transport is approached from the angle of EU environmental policy. This research shows that existing environmental plans will not significantly reduce emissions from the aviation sector, and a combination of more stringent long-term solutions and short-term state policies is needed to increase the effect. In addition, a significant rise in the distance-based air passenger tax rate, carbon taxes on jet fuel, and other financial obligations could make a significant contribution to lowering emissions.
Aviation as a mode of transport is not subject to direct taxation. The levies imposed are indirect in nature and relate separately to particular aspects of the economic activity and elements of the transport service. The Working Paper entitled Indirect Taxes on International Aviation for the International Monetary Fund lists and characterizes diverse types of taxes and surcharges in air transport, such as excise duty on fuel, ticket tax, travel tax, emission tax, noise tax, local air pollution tax, airspace fee and a variety of other taxes and fees [
9]. The authors indicate that progressive environmental degradation and its consequences are the main factors for imposing charges on the aviation sector. [
10] also writes about financial instruments in aviation—taxes, fees and permits—and their direct relation to environmental issues as well as about the need for their further expansion on a global scale, while stipulating that they must not adversely affect passenger and cargo traffic flows. The need to impose charges on the aviation sector is supported by the rapid growth in the volume of commercial aviation and air operations, in particular those resulting from the emergence of a new low-cost business model. [
11] indicates that the degree of taxation on aviation, in terms of emissions and carbon footprint, is still insufficient—few countries (e.g., Norway and the United Kingdom) have imposed direct charges on air travel. In the absence of uniform charging rules, a common solution to address the emissions problem is to encourage voluntary carbon offsets. However, given the projected marked growth in aviation emissions, this is insufficient. Therefore, another tool to reduce emissions is to discourage people from travelling by imposing taxes on airline tickets. The issue of aviation taxes is also addressed in Chapter 9 of the 2008 IFS Green Budget [
12]. Similar to the above-mentioned studies, the authors point to the large contribution of aviation to overall gas emissions and environmental pollution, with taxes being one of the methods of prevention. Since agreements prohibit the imposition of fuel surcharges on international routes, they specify tickets, passengers and flights as areas of air transport activity that can be taxed. They also point out that several factors should be considered when setting tax rates:
The tax rate should be equal to the marginal external costs, while preserving the social optimum.
External costs due to noise and gas emissions will vary depending on, e.g., local population density, type of aircraft, type of engine or flight destination.
Tax competition among countries may arise.
A different approach is proposed by [
13]. The authors identify two ways to reduce the harmful environmental impact of aviation: enforcing fleet renewal and taxing the carbon footprint. By combining these two tools, it is possible to create a policy of subsidizing fleet renewal through the proceeds from a tax imposed on carbon emissions. By implementing such a solution, carbon emissions in passenger air transport may be reduced globally by one-third by 2050.
The authors also conduct research on the relationship between emissions and GDP; however, the number of studies in this area is still limited. There is also a deficiency of works discussing the relationship between economic growth, represented by GDP per capita, and the aviation sector expansion. The authors of [
14], having analyzed GDP per capita and carbon emissions in 137 countries, found that a higher rate of GDP growth leads to a slower increase in emission levels. This means that the need for environmental protection is correlated with the level of income. Similarly, ref. [
15] indicates that reducing carbon emissions while maintaining a high level of economic growth is a central tenet of sustainable development policy, and it is necessary to bring about a situation where the rate of economic development exceeds the rate of emissions growth. At the same time, it is the most developed countries that are the leaders in the fight against climate change.
3. Materials and Methods
Based on the analysis of selected variables, such as the level of emissions, the number of registered aircraft and the GDP, the authors made an attempt to construct a matrix that shows the relationship between greenhouse gas emissions and air transport, environmental taxes and GDP in the timeframe of 2009–2018. The results of this analysis are included in
Table A1. In the construction of the matrix, typification was made using two criteria, taking values below average (named “low” in the matrix) and above average (named “high” in the matrix).
The varying results obtained in the analyzed years inspired further analysis and verification of whether the conclusions drawn are true. Statistical methods were used for this purpose.
The first method applied to study the relationship between air transport and greenhouse gas emissions in the European Union countries was TOPSIS (Technique for Order Preference by Similarity to Ideal Solution), a linear ordering method, and then the Perkal index. A total of 14 explanatory variables were selected for the analysis and were divided into four groups (
Table 1).
The analyzed variables had different names and value domains. To solve this problem, the authors applied a standardization procedure to all the variables.
The variables classified for the study were stimulant in nature [
17], and equal weights were used for all of them.
The TOPSIS method is a method of linear ordering of objects, thanks to which we obtain a uniform, standardized (on a scale from 0 to 1) index that makes it possible to rank many objects. TOPSIS is not the only method for organizing objects. An alternative method of measuring the relationship between aggregate variables is the soft model, or canonical correlation. However, the authors wanted to measure the relationship between unobservable variables and to arrange and rank objects due to the level of aviation development, and such possibilities are provided by the TOPSIS method. Due to the above, it was decided to use this method, while the other methods will contribute to considerations in further research.
The study, conducted by means of TOPSIS, a linear ordering method, included the following steps [
18,
19]:
Construction of the data matrix concerning variables that describe the indicator of a given group of variables adopted for the study. All the selected variables are characterized by universality, meaning the generally recognized importance of a given variable in shaping the level of the indicator of a given group of variables adopted for the study. The variables are also comparable, which allows juxtaposing the EU countries regardless of the number of airports located on their territory;
Normalization of indicator values for stimulants in order to make them comparable;
Calculation of weights for the analyzed indicators and calculation of weights based on the coefficient of variation; for the purposes of the study, equal weights were assumed for the analyzed indicators [
19];
Calculation of the Euclidean distance in the European Union countries from the pattern and anti-pattern [
20];
Determination of the value of the synthetic measure of all the variables in the European Union countries [
18,
19];
Correlation analysis of synthetic measures obtained with the TOPSIS method in individual areas.
Next, the study used a method of calculating the Perkal index. This index is used to compare individual measures and to obtain one synthetic level indicator in each group of the variables under study. This process included the following phases [
21]:
Standardization of individual indicators adopted for the study, as a result of which all the indicators expressed in standardized units become comparable and can be summed up (they have zero mean and the same standard deviation);
Calculation of synthetic indicators in each group of variables adopted in the study.
4. Results and Discussion
The study presents the impact of air transport on greenhouse gas emissions. All data were extracted from the Eurostat database for the period of 2009–2018 to ensure full data integrity and comparability. The conducted analysis revealed the relationships between variables in the European Union countries.
The analysis findings allow us to conclude that the greatest potential of all the areas being currently investigated in terms of their air transport and tax system impact on greenhouse gas emissions lies with Austria, France, Spain, Ireland and Italy. The least attractive areas include Bulgaria, Croatia, Czech Republic, Denmark, Estonia, Finland, Hungary, Latvia, Lithuania, Romania, Slovakia and Sweden.
When analyzing the relationship between GDP and GHG emissions, a conclusion can be drawn that the strongest correlation between these two variables is seen in countries such as Austria, Belgium, France, the Netherlands, Ireland, Luxembourg, Finland and Italy. The group of countries with the lowest correlation encompassed Bulgaria, Croatia, the Czech Republic, Estonia, Latvia, Lithuania, Romania, Slovakia and Hungary and, in some years, Finland, Poland and Sweden. However, it should be borne in mind that, within the adopted timeframe, the majority of countries under study migrated to different parts of the constructed grid.
There is a significant difference in the impact of air transport on GHG emissions, as well as its impact on transport taxes and GDP in the analyzed countries. The interdependence of these variables is quite evident in the developed EU countries, which are world leaders in environmental protection and aviation. The values of all correlation coefficients are shown in
Table 2.
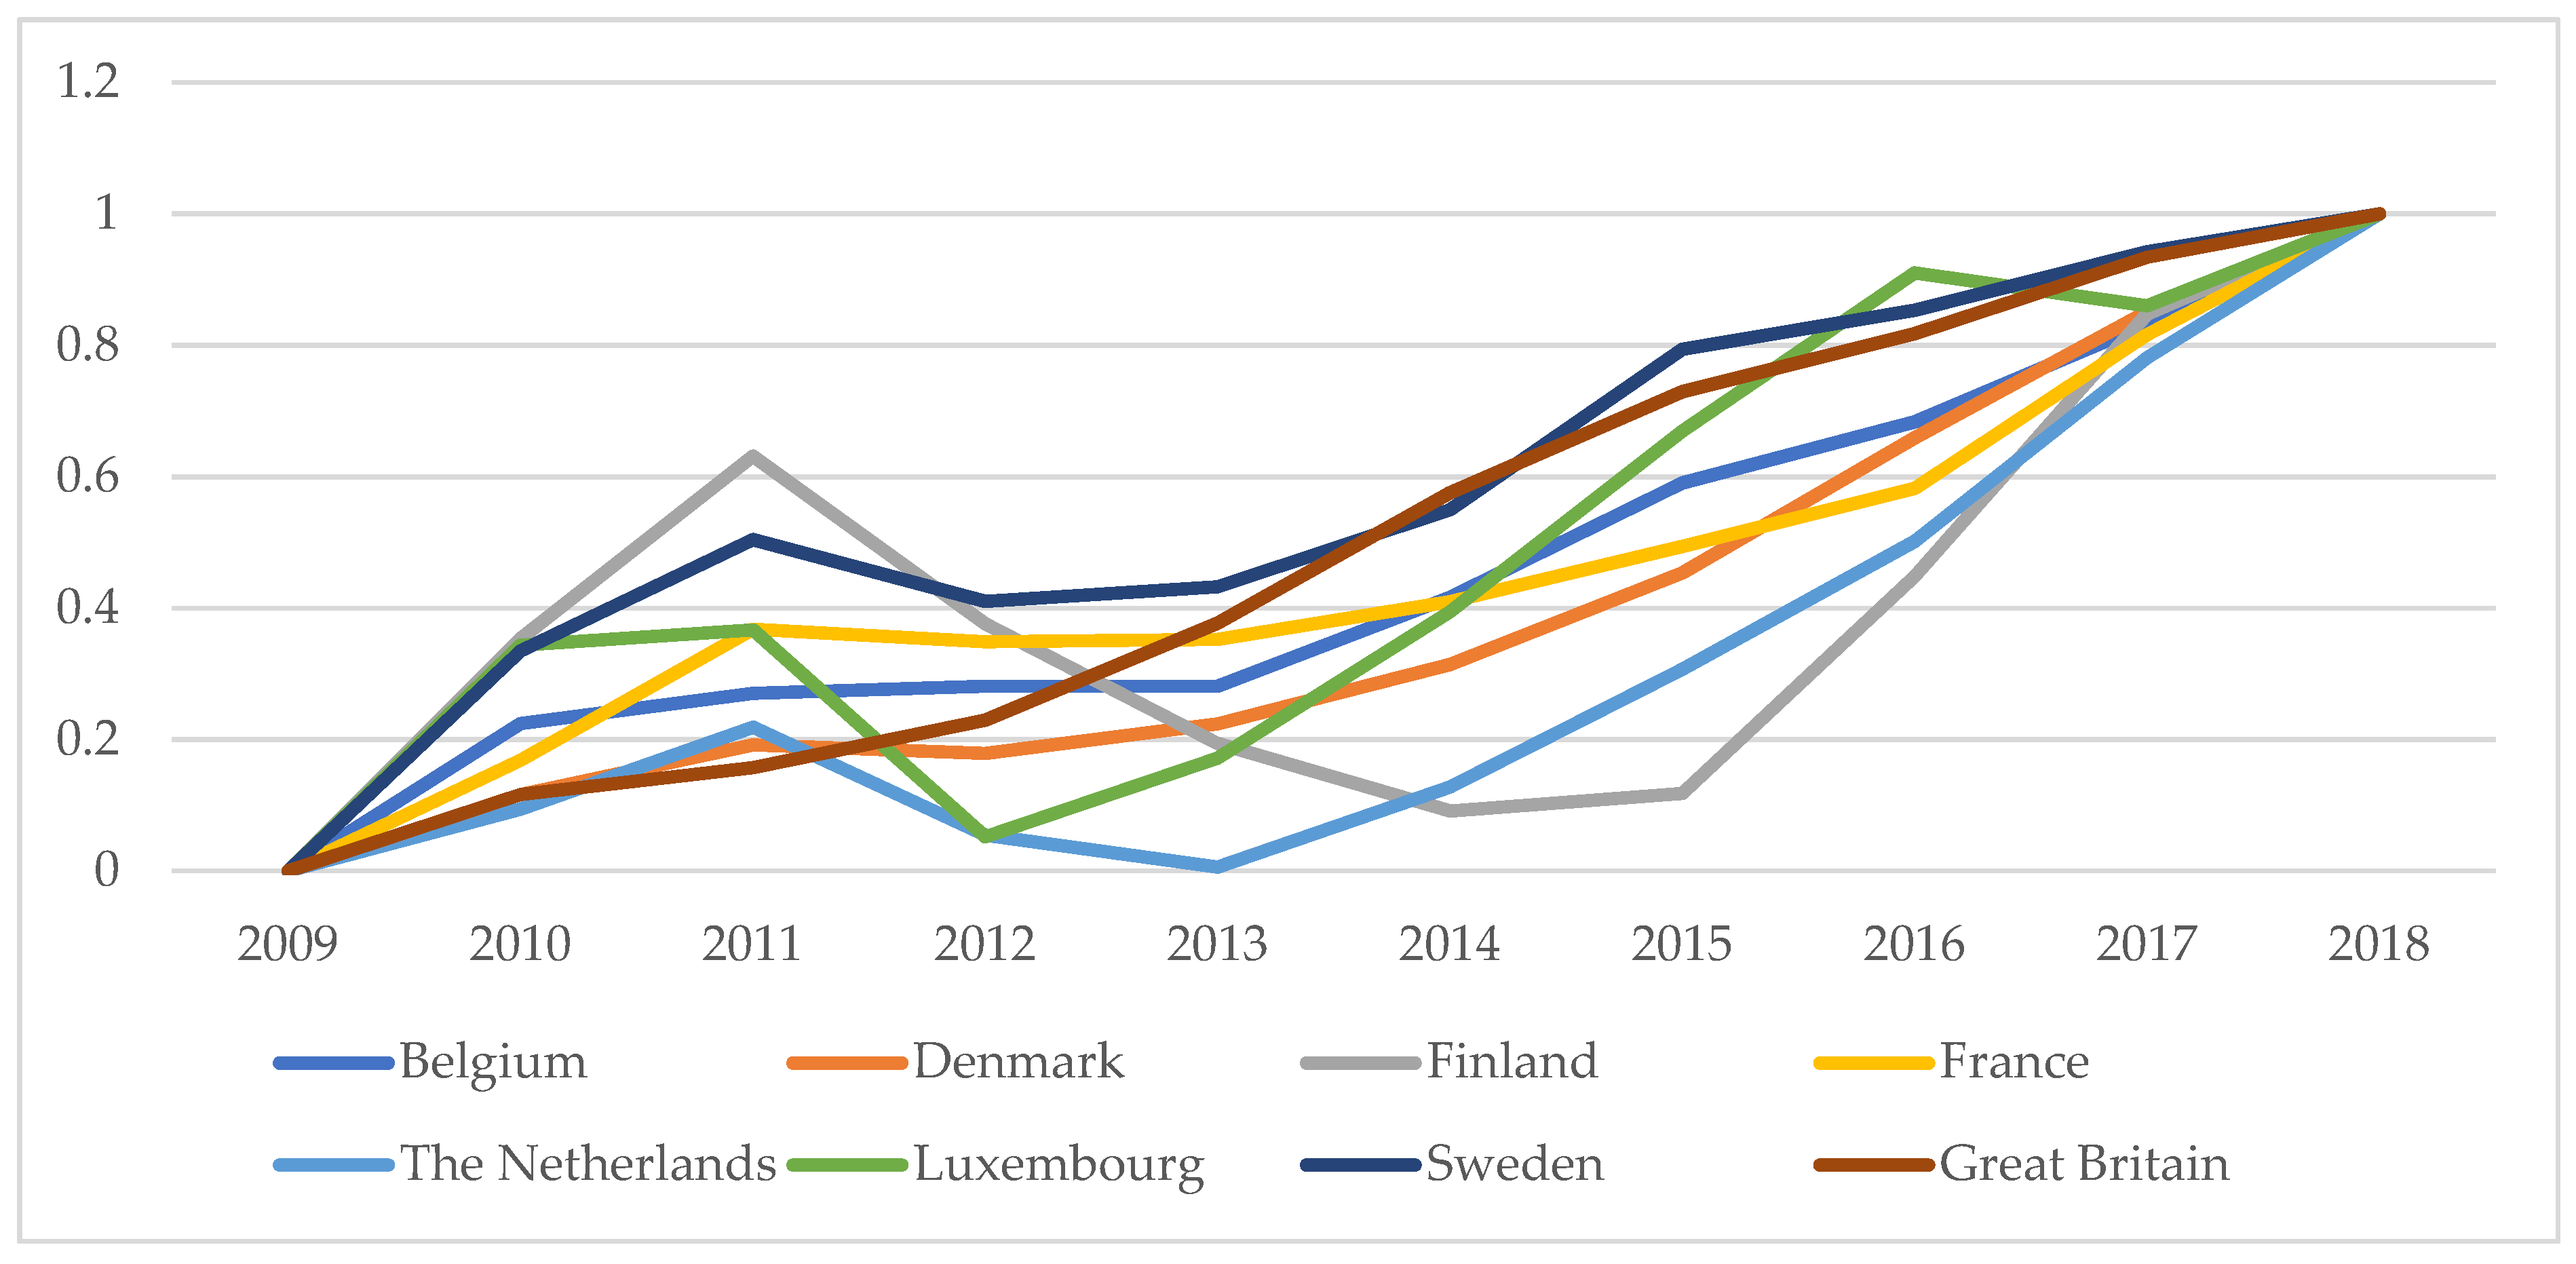
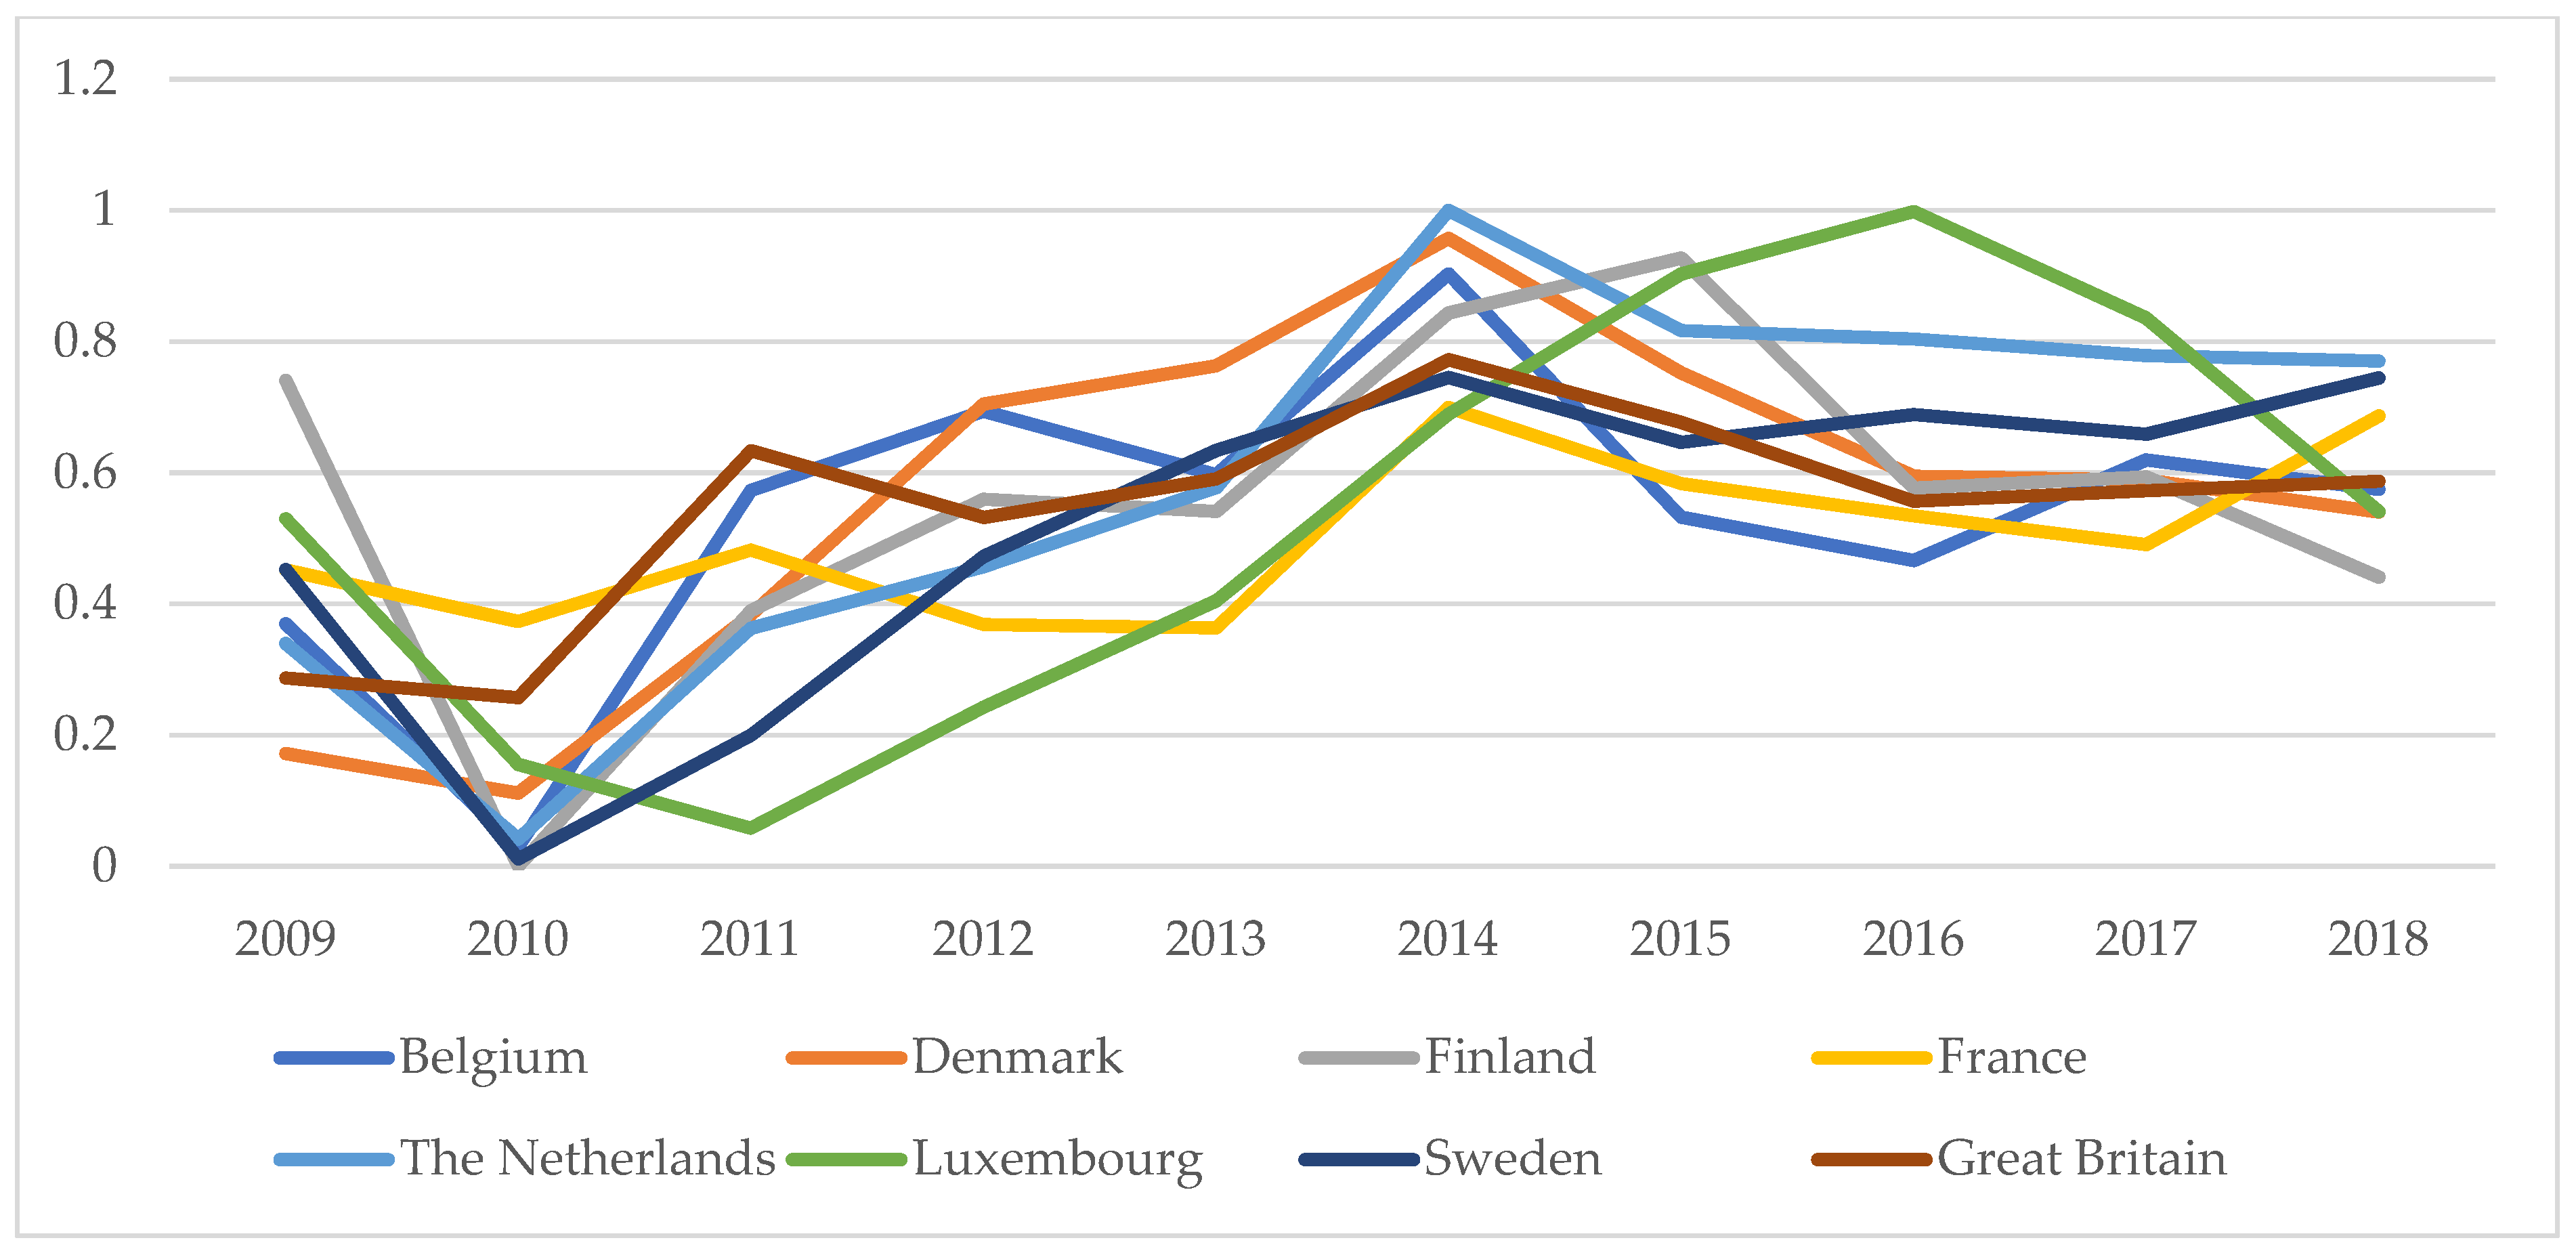
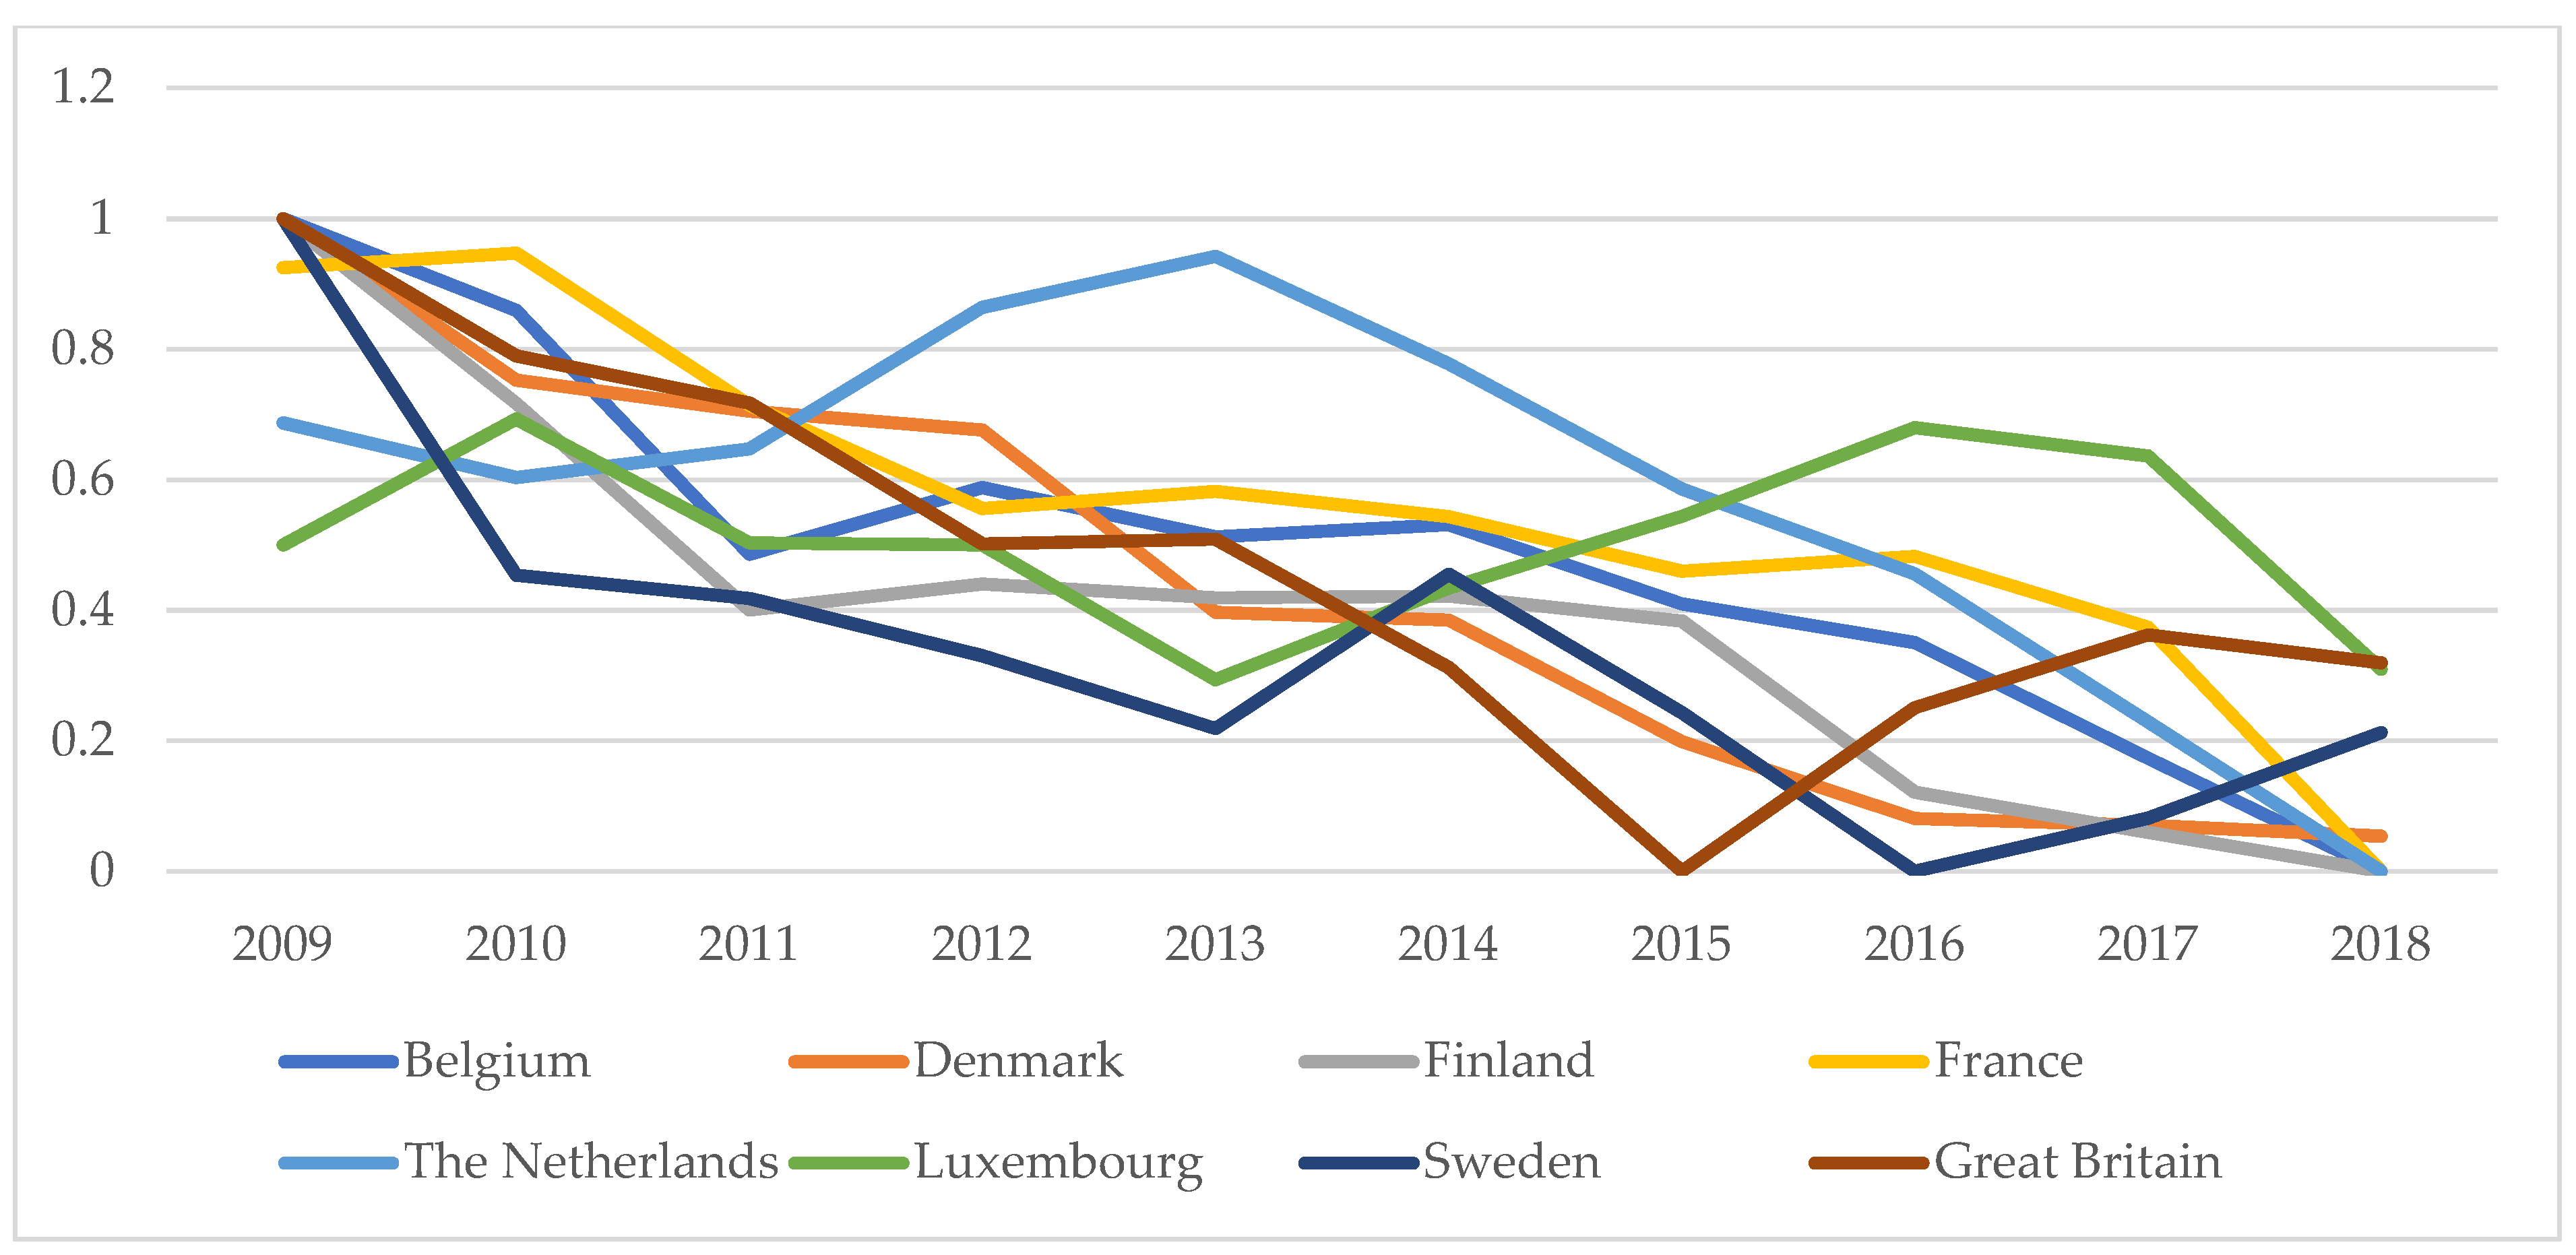
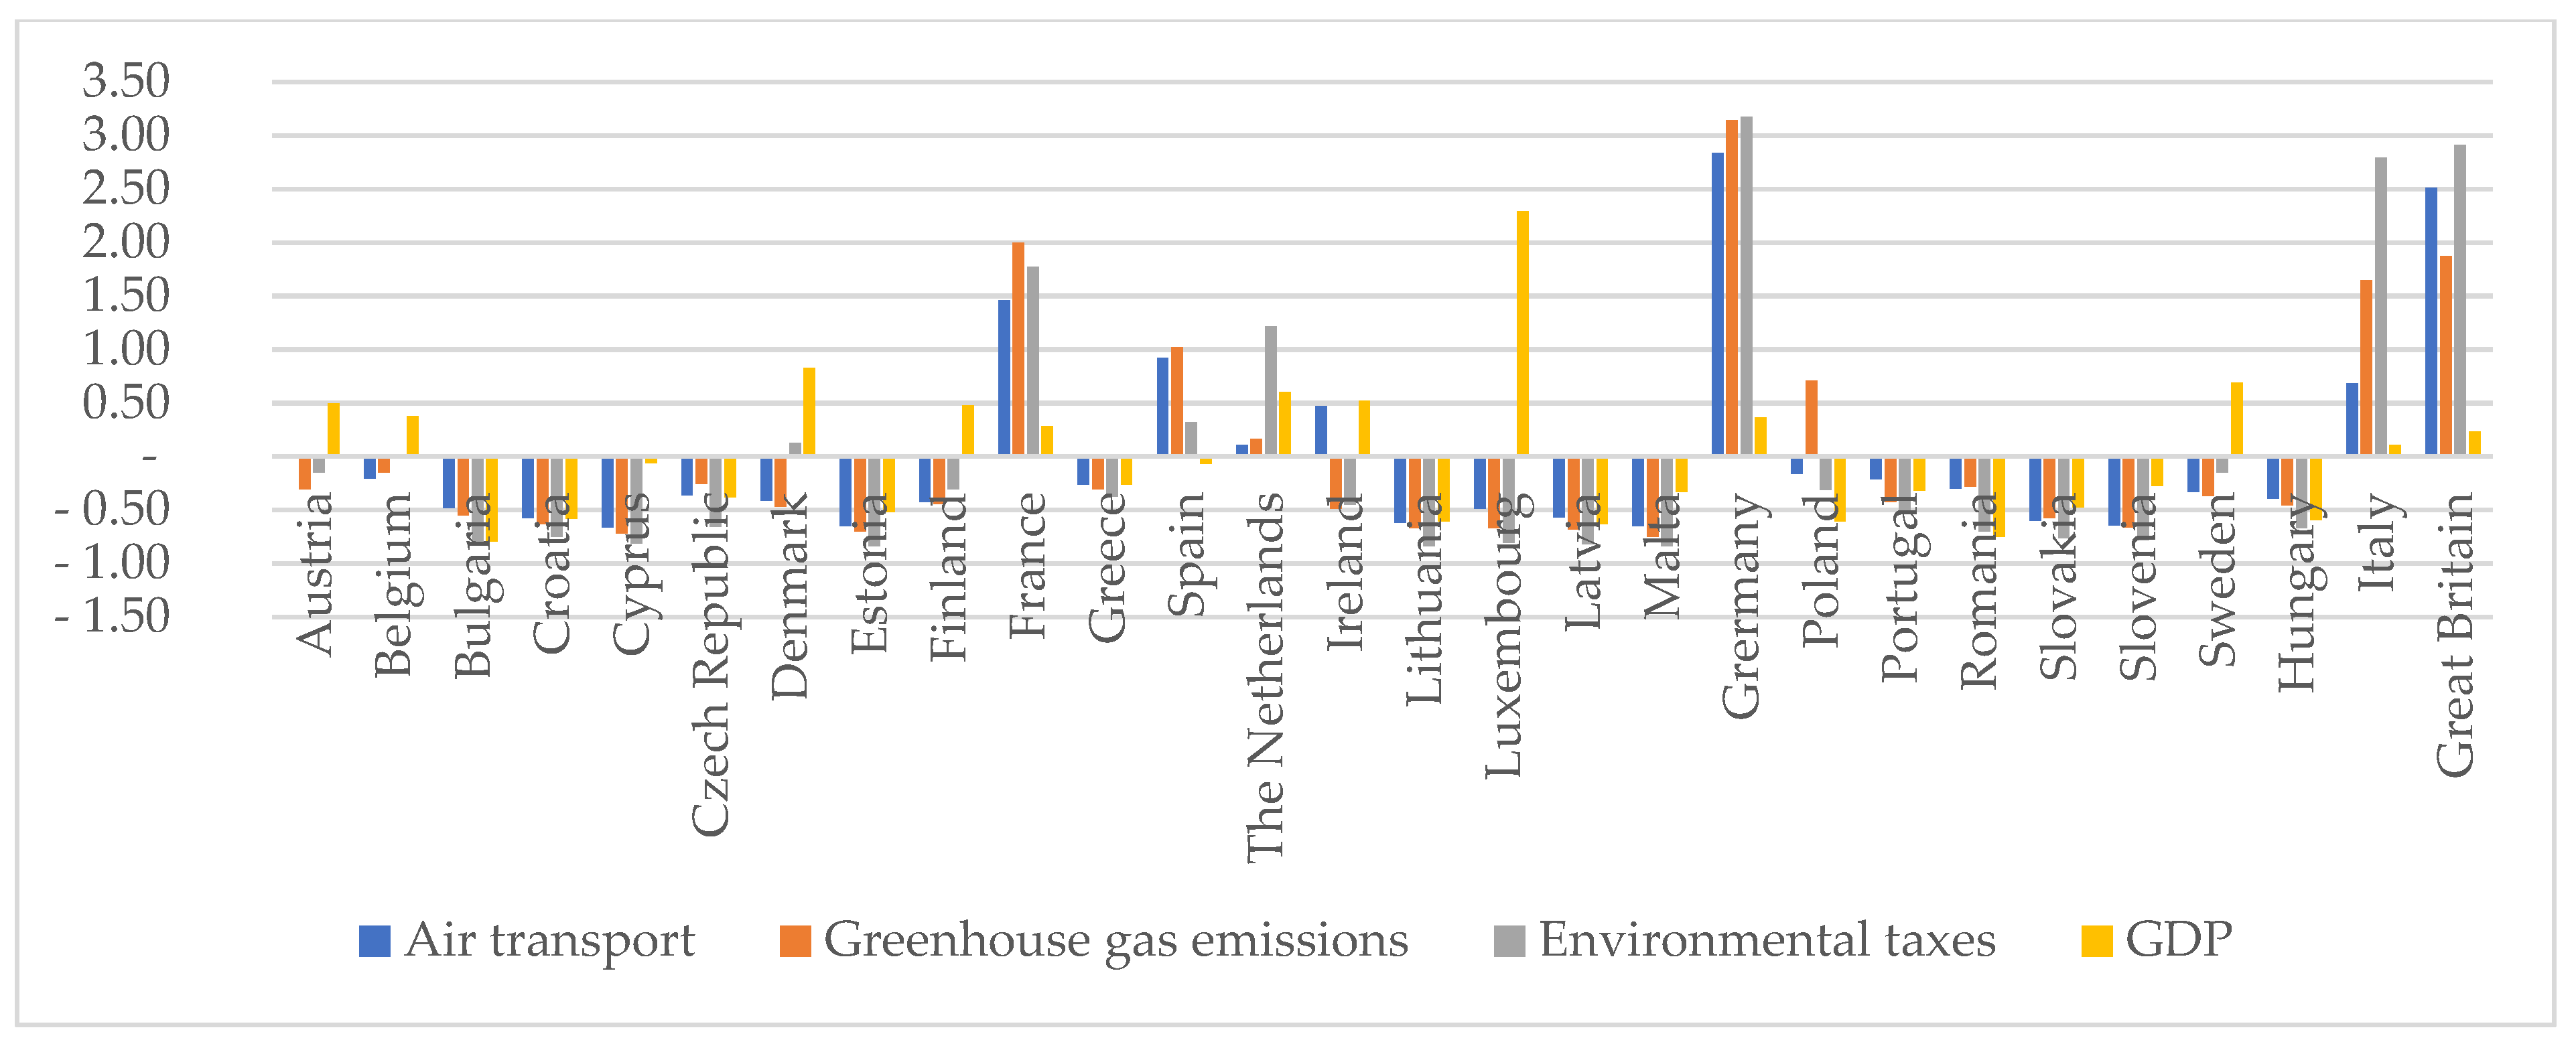
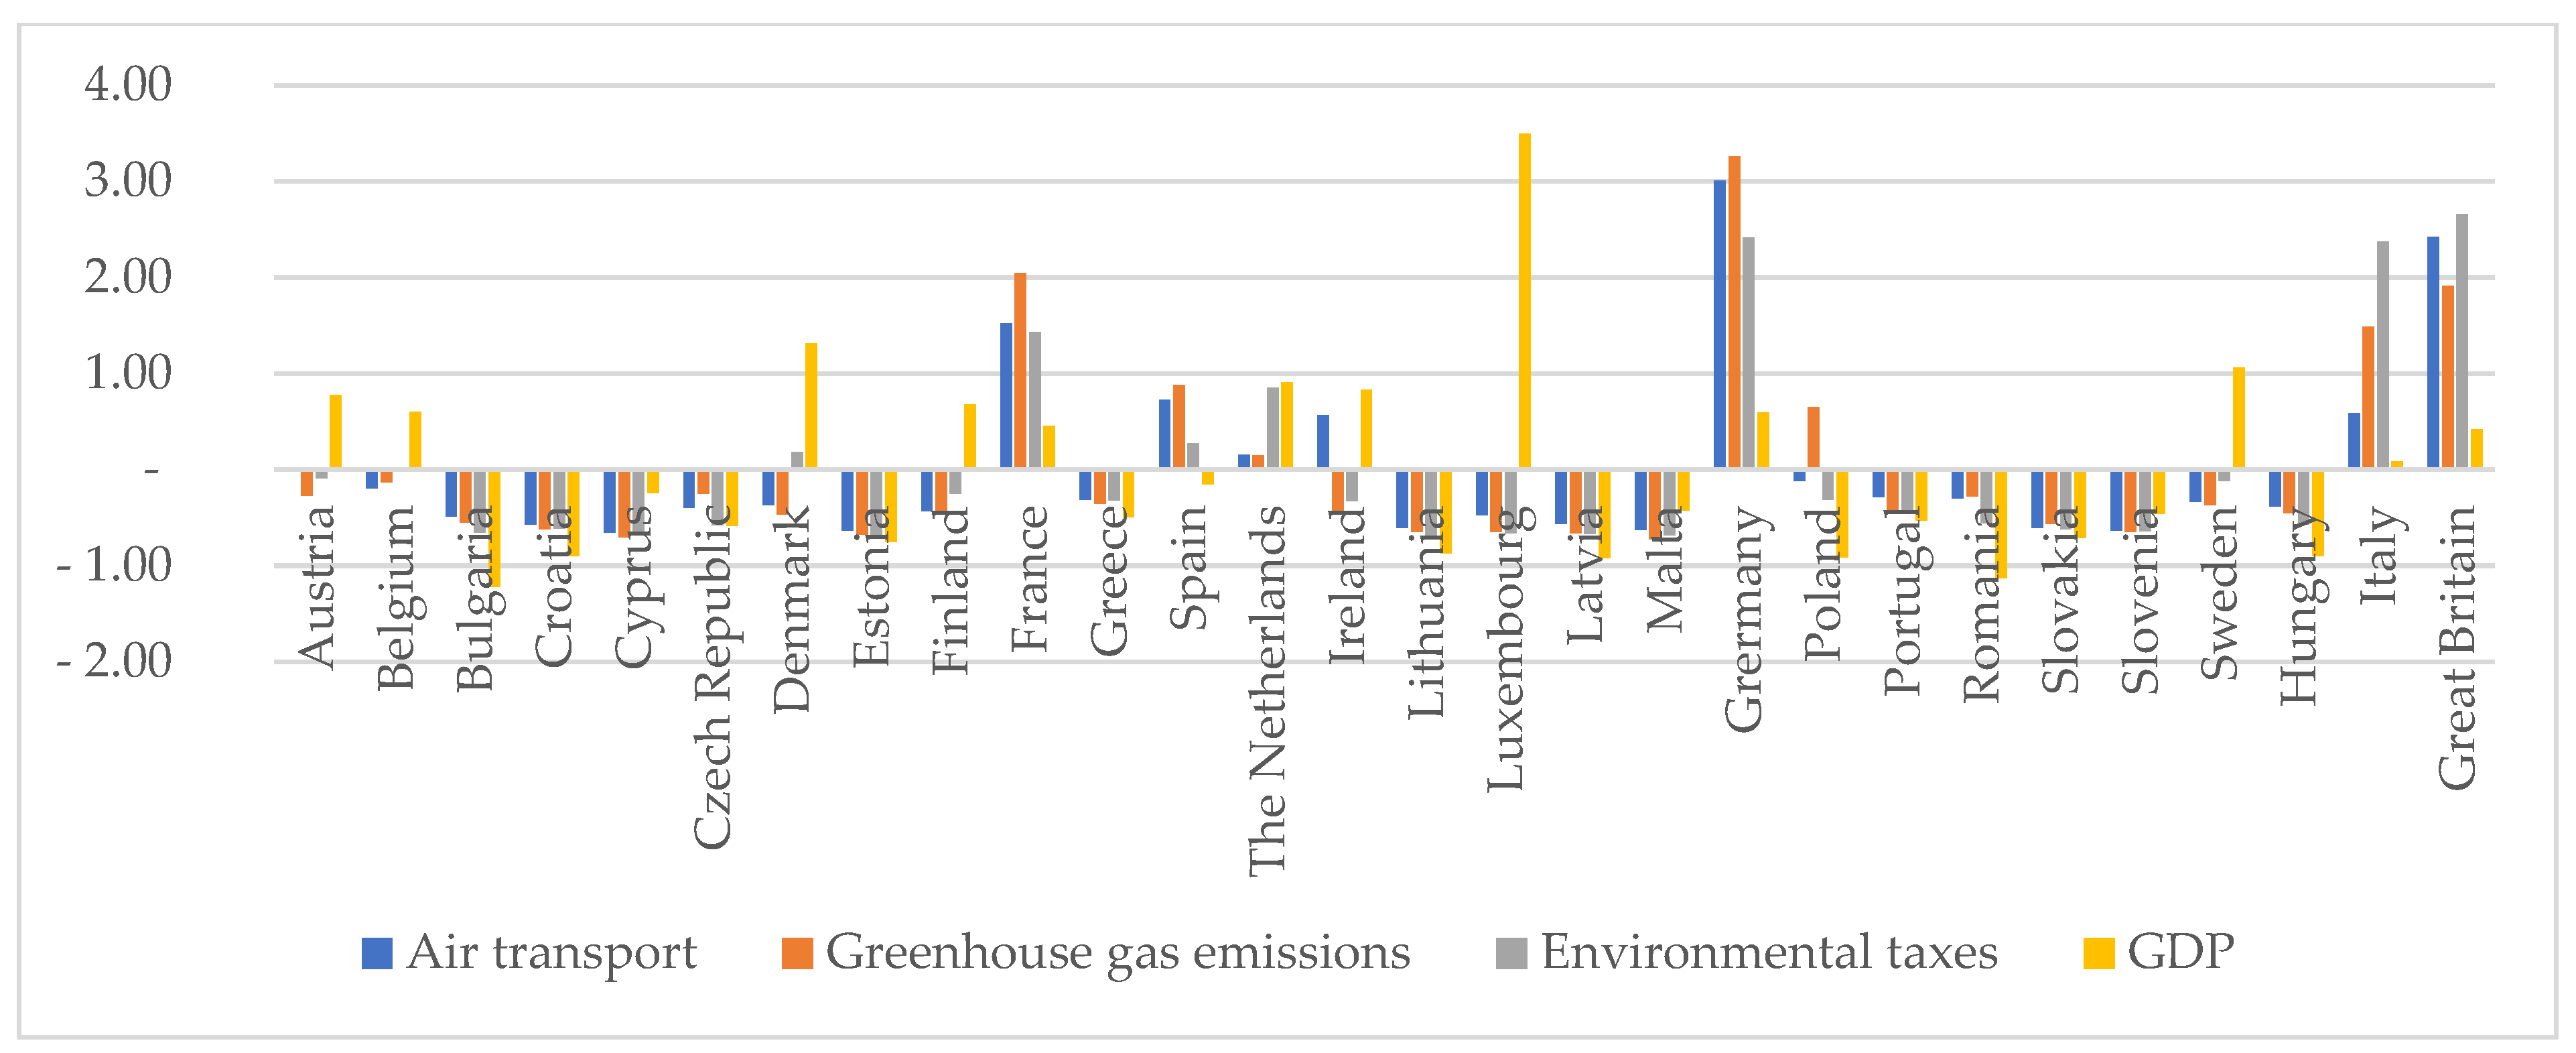
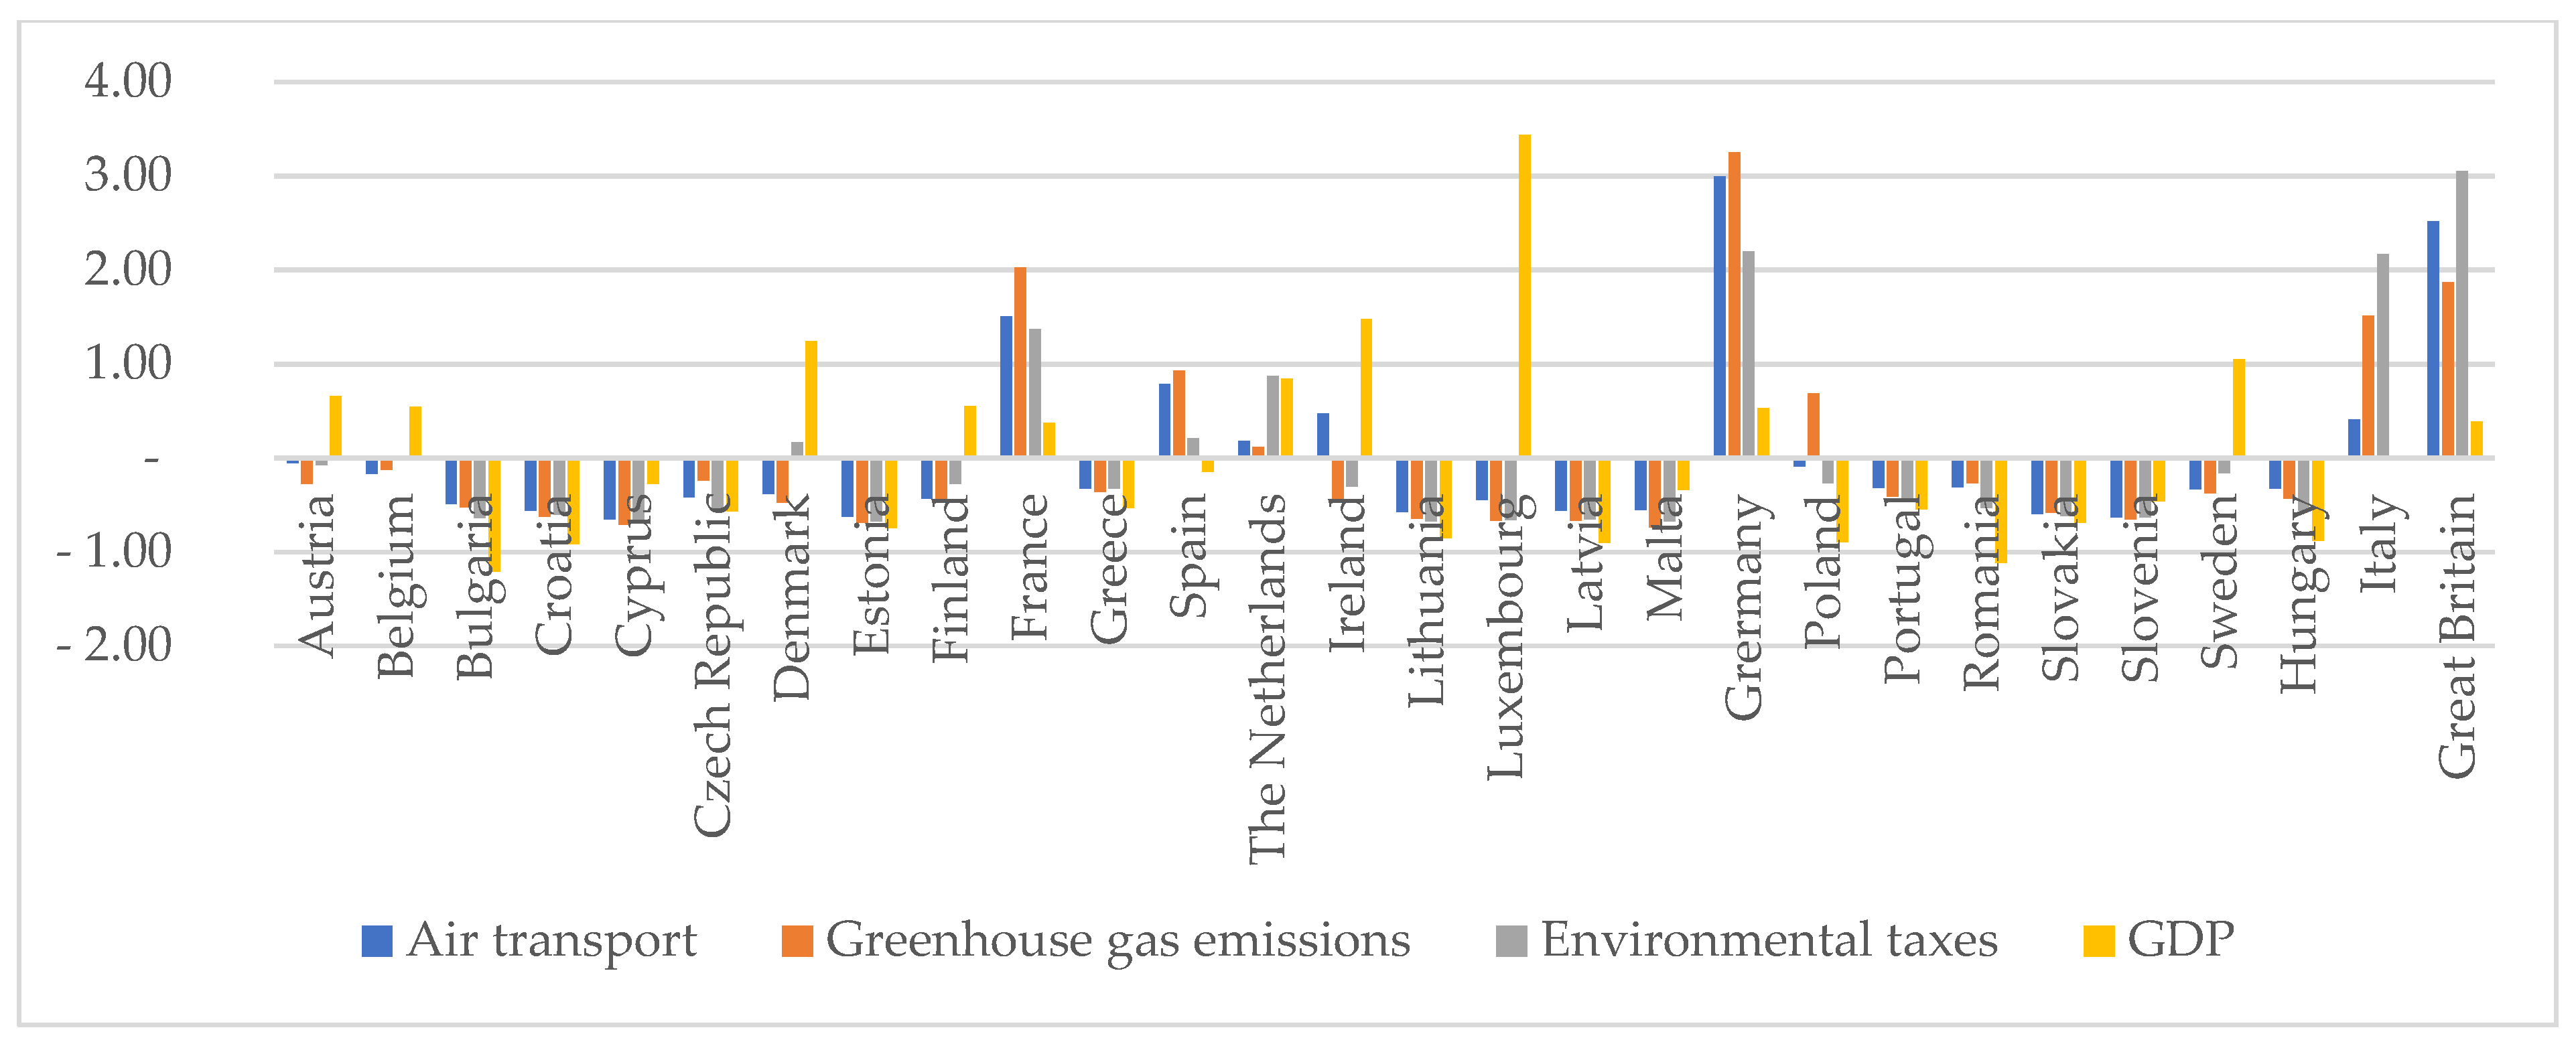
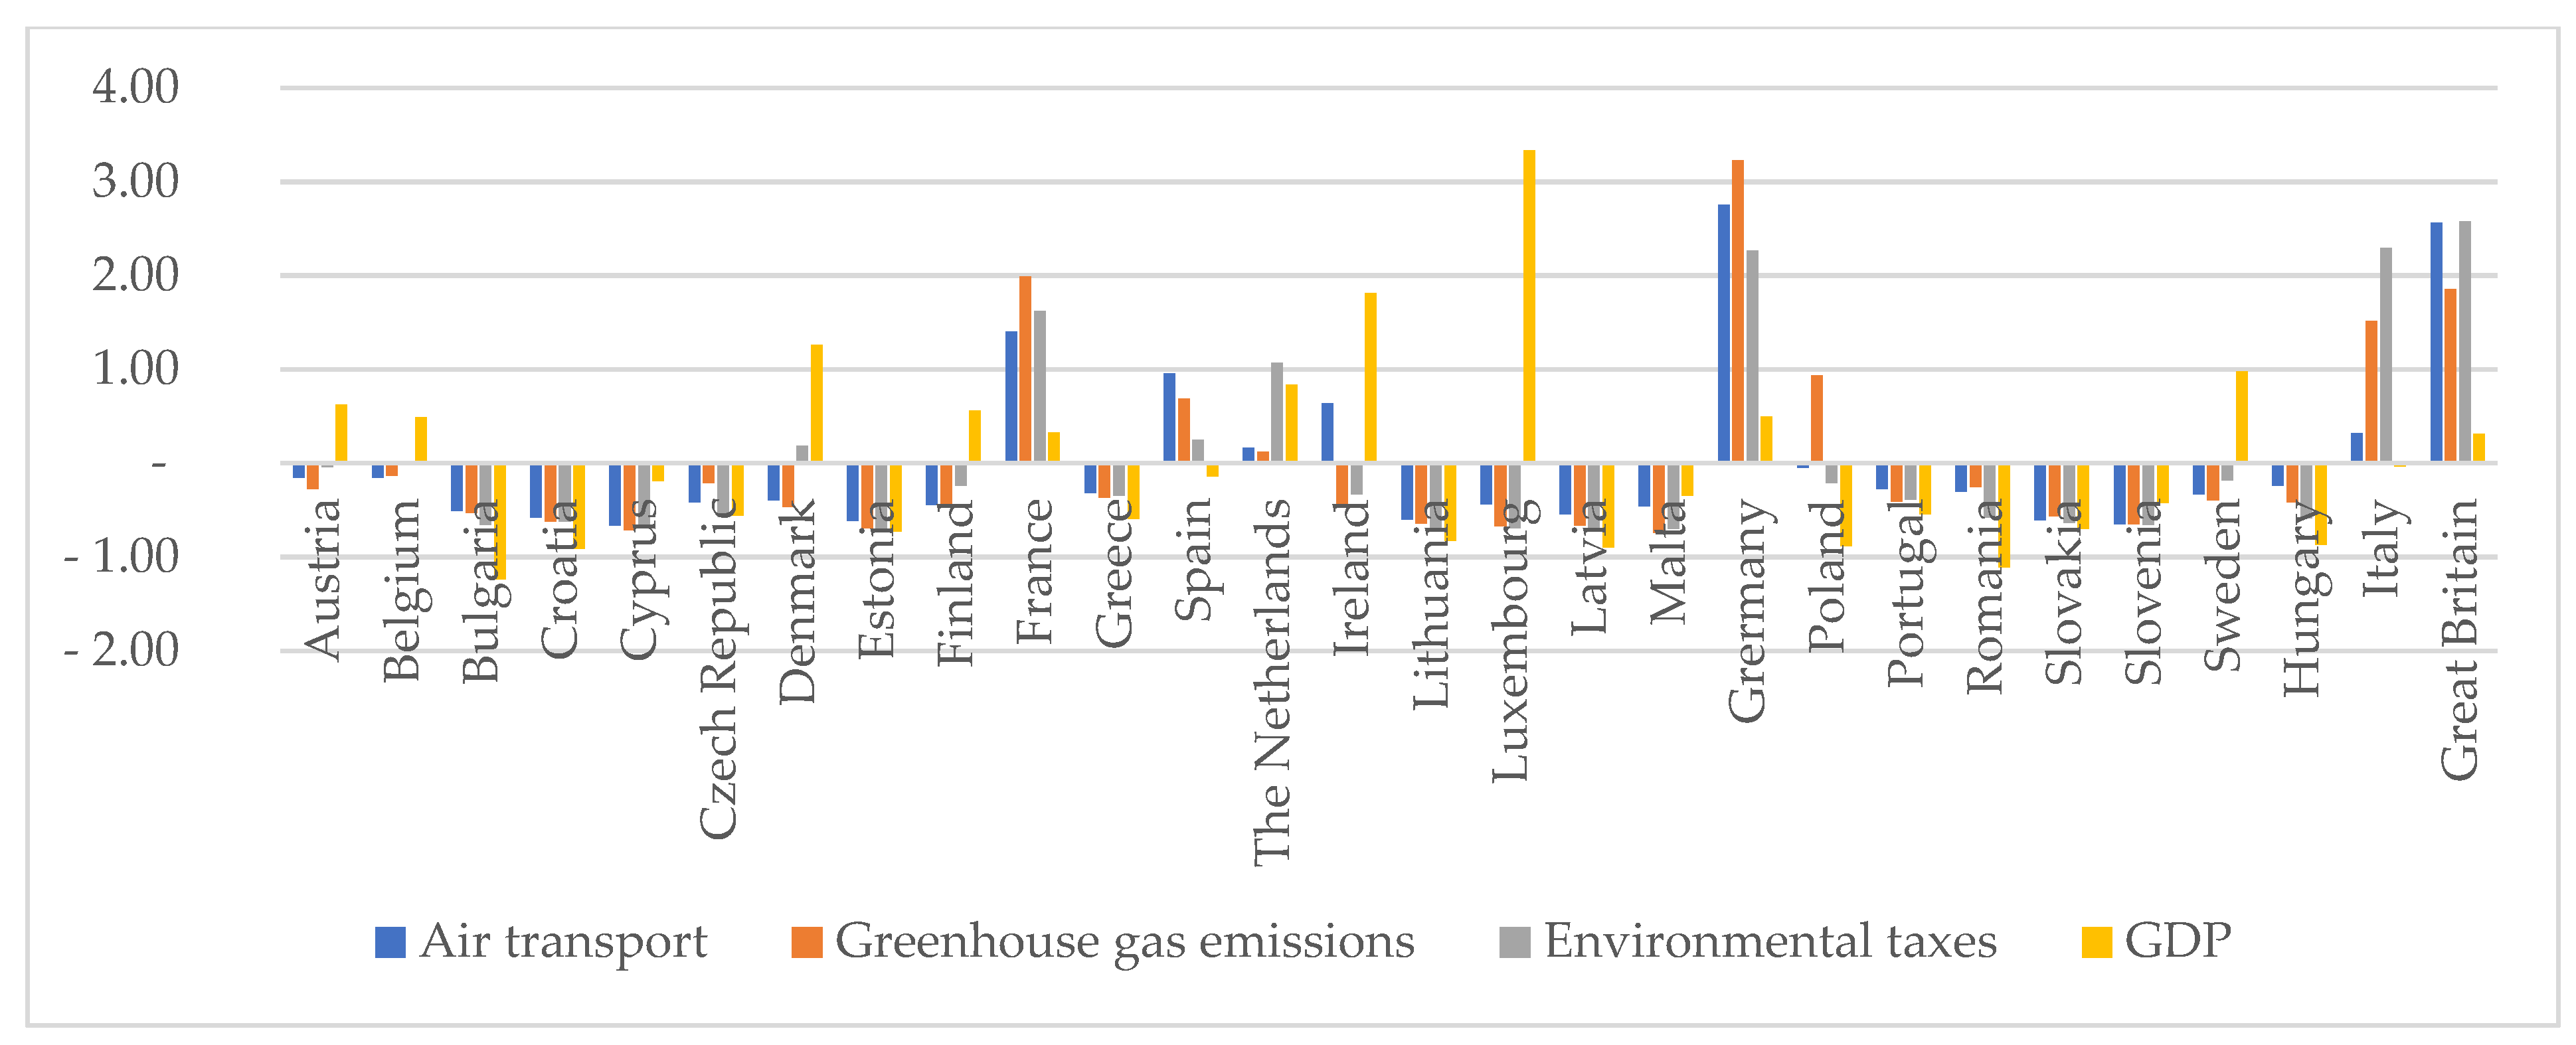
When looking at the value of the correlation coefficient between the air transport variable and greenhouse gas emissions, it is worth noting its positive and negative value [
22]. The positive value of the correlation means that the development of aviation is accompanied by a rise in greenhouse gas emissions. However, it is interesting to note that the increasing level of this indicator does not depend solely on air transport though it is positively correlated with it, so the trends evolve in the same direction. Such a situation is true in the case of such countries as Austria, Bulgaria, Croatia, Cyprus, the Czech Republic, Estonia, Germany, Greece, Hungary, Ireland, Italy, Latvia, Lithuania, Malta, Poland, Portugal, Romania, Slovakia, Slovenia and Spain. In contrast, in Belgium, Denmark, Finland, France, the Netherlands, Luxembourg, Sweden and the United Kingdom, negative correlation values are seen, which means that the decreasing values of one variable are accompanied by increasing values of the other. In these countries, air transport has slightly improved, while gas emissions have slightly decreased. The disparities between these countries with regard to each of the variables in question are shown in
Appendix A,
Figure A1,
Figure A2,
Figure A3 and
Figure A4.
The Perkal index gave an overall picture of the spatial diversity of EU countries between 2009 and 2018 with regard to the variables under study. To illustrate these variables,
Figure A5,
Figure A6,
Figure A7,
Figure A8,
Figure A9 and
Figure A10 in the
Appendix A show the distribution of EU countries with the use of the Perkal index in the timeframe of 2009–2018.
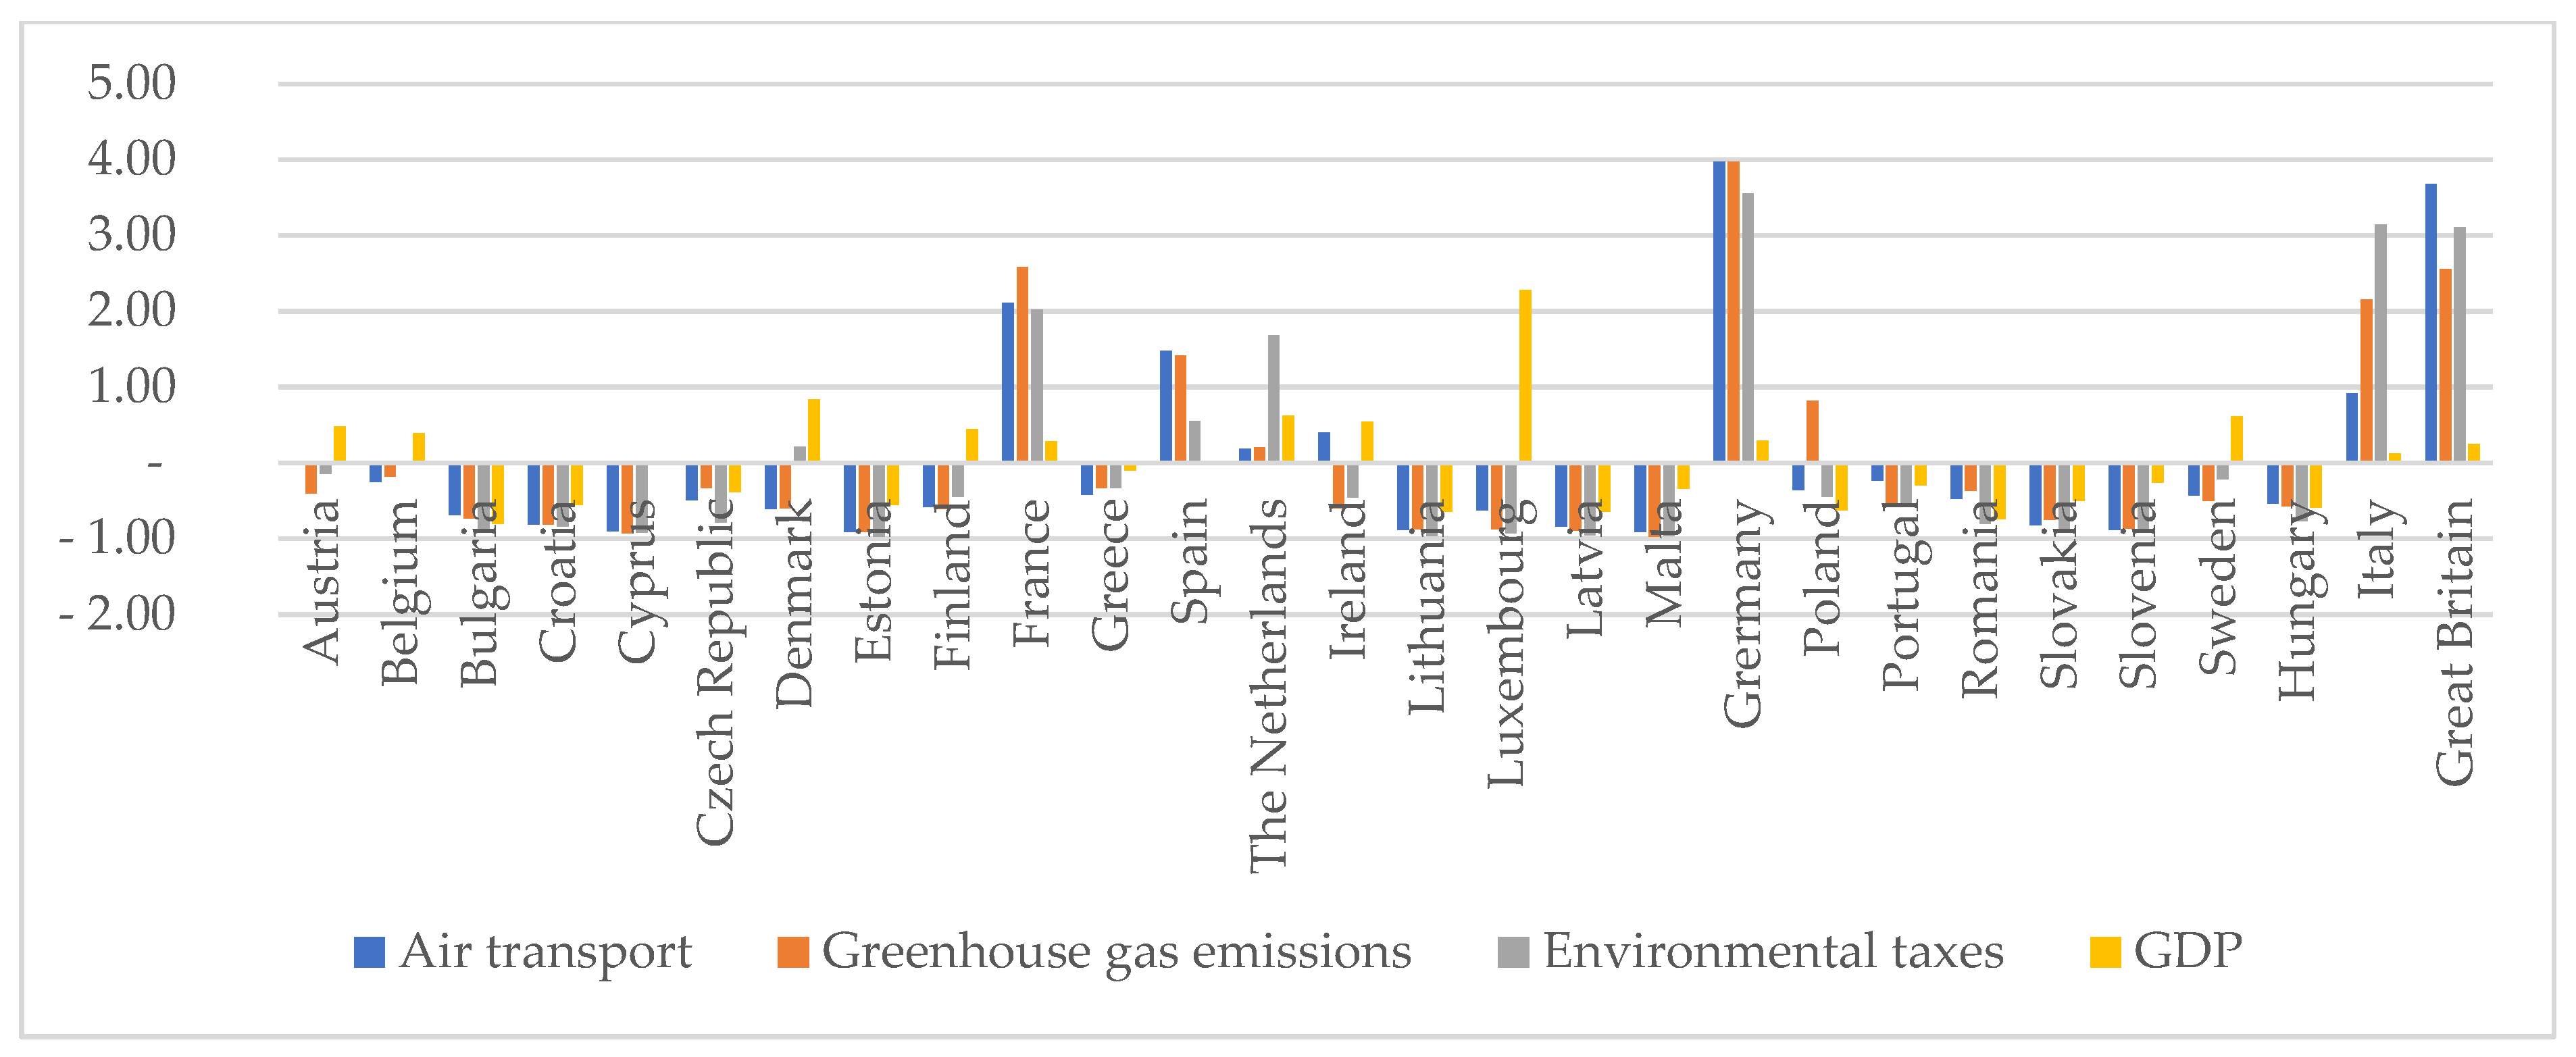
The examination of the 2009–2018 variables reveals that there were strong correlations between air transport, greenhouse gas emissions and environmental taxes from transport and GDP in the majority of the European Union countries. Yet, in Austria, Belgium, Denmark, Finland, Spain, Ireland, Luxembourg, Poland and Sweden, these variables had different deviations. In Denmark, environmental taxes from transport and GDP were higher than aviation expansion over the whole period of observation. In contrast, Poland saw GHG emissions at a much higher level than air transport and GDP growth. In Ireland, on the other hand, there was a marked growth of aviation and GDP relative to gas emissions and environmental taxes from transport. Austria, Belgium, Finland, Luxembourg and Sweden reported their GDPs to be higher than the remaining variables under study.
It can also be seen from the graph that there was a noticeable growth in air transport in France, Spain, the Netherlands, Ireland, Germany, Italy and the UK in all the years under study, but in France, Spain, Germany and Italy air transport growth was slower than GHG emissions. The Netherlands and Spain did not see air transport growth that surpassed their GHG emissions until 2014 and 2018, respectively. The present analysis also shows that, in the United Kingdom, highly developed air transport is accompanied by heavy environmental taxes from transport, but lower greenhouse gas emissions. Therefore, the authors distinguished two groups of countries in terms of their aviation industry performance:
innovators, encompassing France, Spain, the Netherlands, Ireland, Germany, Italy and the United Kingdom, and
standard centers, including the remaining EU countries.
The reason for the above division may be the fact that the countries classified as innovators have well-established pro-ecological policies. By using different “toolboxes” we can distinguish:
the innovator’s toolbox, which includes countries such as Ireland, Spain, the Netherlands and the United Kingdom, due to the fact that in these countries’ GHG emissions are noticeably lower than transport growth,
the stable toolbox, which includes countries such as France, Germany and Italy, given the high growth of aviation but also the high level of emissions relative to the innovators, and
the student toolbox, which includes countries such as Austria, Belgium, Bulgaria, Croatia, Cyprus, Czech Republic, Denmark, Estonia, Finland, Greece, Hungary, Latvia, Lithuania, Luxembourg, Malta, Poland, Portugal, Romania, Slovakia, Slovenia and Sweden. These countries are characterized by the lowest indicators, with negative values.
The results of the research conducted regarding the relationship of GHG emissions with levels of aviation development and state policy instruments, including green taxes, are consistent with the assumptions presented by [
3,
4,
7,
8,
9,
10,
11,
12]. In terms of the relationship between aviation and the level of economic development, measured by GDP per capita, the results obtained are consistent with the thesis of [
14,
15]. However, it is important to keep in mind that most studies deal with the interactions of two or three areas analyzed (emissions, level of aviation development, environmental tax revenues, GDP per capita) and therefore do not fully overlap with the results presented in this paper.
5. Conclusions
The purpose of the article was to indicate the relationship between the degree of air transport growth and GHG emissions from transport, revenues from environmental taxes and GDP per capita in the European Union countries. This paper presents a new, more complex theoretical approach to the subject of the relationship between the level of aviation development, greenhouse gas emissions, environmental tax revenues and the degree of economic development. Previously published studies have focused on the relationship between two or three of the analyzed variables, while this paper considers all the mentioned factors and their interactions. The novelty is also the methodological approach based on the matrix of interactions between the analyzed variables and the subsequent verification of the obtained results using statistical methods—TOPSIS and Perkal index.
The study identified correlations among GHG emissions and the development of the air transport sector, environmental tax revenues and the level of economic development. The preliminary findings of the analysis in the group of the examined EU countries shows existing strong and positive relationships among all the variables adopted in the study.
Based on the performed analysis, the authors came to the conclusion that the growth of aviation is accompanied by the growth of greenhouse gas emissions. However, this is not a directly proportional increase, because the growth rate of emissions exceeds the growth rate of the aviation sector. A similar relationship can be found when analyzing the variables of environmental taxes from aviation; the more developed the aviation sector, the higher the revenues from environmental taxes. There is a strong positive correlation here. Attention should also be paid to the relationship between aviation and GDP; the wealthier the society, the faster the development of aviation, which in turn boosts gas emissions.
In summary, the growth rate of the air transport sector is closely related to the variables in this study, namely the greenhouse gas emissions, environmental taxes and GDP. The analyses indicate that the expanding aviation sector entails growth of the other factors in question. However, from an environmental point of view, it is desirable that the growth rate of air transport exceeds the growth rate of emissions. The research has shown that in some European countries—Ireland, Spain, the Netherlands and the United Kingdom—transport and environment policies are developed in such a way that these countries can be seen as innovators, being pioneers setting best practices in the development of aviation, economic growth, environmental taxation and emissions. Particularly noteworthy in this group is Ireland, whose main growth engine in the area of aviation is the low-cost airline Ryanair. The airline’s operations have considerably contributed to high growth rates in the aviation sector, with transport emissions and environmental tax revenues staying at a low level. This is due to two factors: first, the aircraft are registered in Ireland, but thanks to the Open Skies policy, they perform most of their transport operations in other European Union countries on a cabotage basis; second, Ryanair’s fleet consists of young aircraft, whose design and technological solutions significantly affect the level of emissions.
The second group of countries (labeled as Stable) consists of France, Germany and Italy. In these countries the levels of development and growth of aviation and emissions are similar, but with the predominance of the latter. The remaining 21 countries are assigned to the Student toolbox, meaning that their transport emissions far outweigh the aviation sector development, environmental tax revenues and GDP.
It can be observed that there were some movements in the matrix in different years, which is the result of several market and/or administrative changes implemented in some countries within the variables analyzed, in the sense that some countries have significantly reduced their GHG emissions from transport, have restructured their fleets, have increased their environmental tax revenues or have significantly increased their level of economic development.
The study has confirmed the effectiveness of policies implemented by the Innovators and came to the conclusion that replicating these patterns in other countries, or creating similar instruments, could lead to a significant reduction in GHG emissions from transport without harming the aviation sector. It is also possible to create favorable conditions for aircraft registration (in a manner similar to the one in maritime transport) in order to attract carriers. However, in addition to the policy-making instruments, there is also a need for parallel technological advancement, in the form of wider popularity of biofuels and alternative energy sources as well as new low-emission jet engines.
It is worth emphasizing that this is one of rather few publications providing a comprehensive analysis of the relationship between the growth rate of the aviation sector and the levels of greenhouse gas emissions, revenues from environmental taxes and the GDP per capita as a measure of economic growth of EU countries. The results presented in the article have not only scientific and theoretical value, but also practical value, addressing mainly the following:
carriers looking for the most profitable conditions of operation, both in terms of technology (e.g., fleet structure, used fuels) and organization (e.g., country of aircraft registration, offered routes, operating costs),
European Union authorities developing complex policies and plans for the development of the aviation sector, leading to the reduction of negative effects of transport activities on the environment (Green Deal, circular economy), and
state governments responsible for establishing transportation policy and taxation of various transportation activities, including aviation, which directly translates into mode shift and thus improved quality of life for the public.
A major limitation to the performed research was the scarcity of literature on the relation of the aviation sector to environmental taxes and national economic growth, as well as the absence of publicly available sources of information on specific environmental policy instruments in individual countries.
Continued in-depth research on this problem will be carried out in two ways. On the one hand, it will focus on analyzing the relationship between aviation sector growth and GHG emissions, taxes and GDP in individual EU countries as well as on identifying individual governments’ environmental policy instruments. On the other hand, it will provide a more detailed analysis of the aviation sector development with regard to each of the indicators.


 ,
, 


