Article

Emission Mitigation and Energy Security Trade-Off: Role of Natural Gas in the Indian Power Sector

1
Global Change Programme Jadavpur University, Kolkata 700032, India
2
School of Humanities and Social Sciences, Indian Institute of Technology, Mandi 175005, India
3
Department of Energy, Environment, and Climate, School of Environment, Resources and Development, Asian Institute of Technology, Bangkok 12120, Thailand
4
Department of Economics, Global Change Programme, Jadavpur University, Kolkata 700032, India
5
Department of Media and Social Sciences, University of Stavanger, 4021 Stavanger, Norway
6
Department of Energy and Petroleum Engineering, University of Stavanger, 4021 Stavanger, Norway
*
Author to whom correspondence should be addressed.
Energies 2021, 14(13), 3787; https://doi.org/10.3390/en14133787
Submission received: 28 April 2021 / Revised: 5 June 2021 / Accepted: 15 June 2021 / Published: 24 June 2021

Abstract

:
India’s Nationally Determined Contributions (NDC) aim to increase the share of non-fossil fuel, especially renewables, in power generation. But at the same time, it mentions that coal is likely to dominate the power generation in the short and medium term to meet the increase in demand and support the intermittency of renewable energy-based power generation. Thus, additional efforts to transform the thermal power generation to a more efficient and less emitting one in the near term by increasing the use of natural gas (a fossil fuel with a lower emission factor than coal) may be planned towards achieving India’s additional mitigation commitments. The paper presents the implications of a proposed increase in the share of natural gas in thermal power generation of India by looking into the trade-off between emission mitigation and energy security. Along with a Reference Scenario, three alternative emission scenarios are proposed to understand the likely impacts of increased penetration of natural gas in power generation on India’s projected emission profile up to 2050. Results suggest that higher mitigation potential can be achieved through fuel-switch in thermal generation and technological up-gradation to enhance energy use efficiency. The energy security due to the increased share of natural gas imports can be dealt with by diversifying import sources. Shifts can achieve this in the emphasis on long-term contracts.

1. Introduction

Achieving long-term stabilization of global mean temperature requires coordinated efforts from all the countries through various national level sectoral interventions [1,2]. According to the Intergovernmental Panel on Climate Change (IPCC), mitigation scenarios with a relatively low concentration of greenhouse gases (GHGs), i.e., 450–530 parts per million CO2 equivalents (ppm CO2e), require a transformation of the energy system [3]. While India has achieved relative decoupling of economic growth and emission over the last few decades, mainly through energy intensity improvements in the manufacturing sector, the untapped potential exists in other sectors, including power generation [4]. Along with the energy intensity reduction of the Gross Domestic Product (GDP), India has also focused on reducing the emission intensity of its power generation sector through increased penetration of renewables in the total fuel mix. However, unlike conventional power generation, renewable energy-based generation is intermittent and variable [5].
Additionally, the demand for electricity in India is projected to rise by more than two-folds between 2012 (776 TWh) and 2030 (2499 TWh) [6]. Therefore, even in the face of the growing importance of renewables, fossil fuel-based power generation will continue to play an essential role in the near future, both to balance the variable supply from renewables and meet the absolute demand. Only renewable energy-based capacity addition will be insufficient to cater to this increased demand given the intermittency problem. In such circumstances, coal is anticipated to continue in the power generation sector in India in the short–medium term [6]. While the deployment of various clean-coal technologies such as the integrated gasification combined cycle (IGCC), ultra-supercritical technology, have the potential to achieve emission reduction [7] (With its considerable high coal reserve, Carbon Capture and Storage (CCS) could be an important technology solution for India towards a low carbon transition without disturbing its energy security. However, for India, there exists several challenges to successful full-scale implementation of CCS, including lack of successful implementation at a commercial level [8,9,10] and huge investment [7] as well as operation and maintenance (O and M) cost [8], resulting in the high unit price of electricity [9,11]. Although the recent projection of NITI Aayog of India assumed implementation of CCS by 2025 [7], existing literature has found that it will be difficult to become operational before 2030 [8].), it is also important to explore the role of other low-carbon fuels to replace coal for achieving relatively faster emission reduction from the power sector.
In this context, natural gas is gaining increased attention as a bridge fuel with a lower carbon intensity than coal for both developed and developing countries [12,13]. In the Indian power sector, gas as a transition fuel in the near to medium term can help in further decoupling of emission from economic growth [4,13]. However, given the limited domestic availability of natural gas, India has to depend on imported natural gas to facilitate such transition. In this context, understanding the implications of enhanced use of natural gas both from emission mitigation and national energy security perspective becomes essential [14]. This article considers two research questions: first, if natural gas increasingly replaced coal in the short–medium term, how would that contribute to reducing the emission intensity of the power generation sector in India? Secondly, what would gas dependence imply for the country’s energy security?
The rest of the paper is divided into the following sections. Section 2 provides an overview of techno-economic and geopolitical issues of natural gas as a transition fuel for India. Section 3 presents a selected number of future alternative emission scenarios for the Indian power sector under different degrees of penetration of natural gas. It estimates indices for assessing the energy security implications. Section 4 presents the results and discussions, followed by the conclusions in Section 5.

2. Natural Gas as a Transition Fuel

2.1. Sustainable Energy Management Practices

Sustainable energy management is key to a low carbon future. It requires an increased efficiency of the energy production sector for transmission and distribution and the choice of fuel and technology [15]. In this context, the penetration of renewable energy sources and natural gas has assumed an important role in different parts of the world, including several developing countries. Among ASEAN (The Association of Southeast Asian Nations) countries, while coal remained the major source of energy fuel for countries such as Malaysia, Indonesia, the Philippines, and Cambodia, other countries such as Singapore, Brunei, Thailand, and Myanmar rely on natural gas as their primary fuel for electricity generation [16].
Existing studies emphasize the role of suitable energy policies for energy transitions [17]. Though a fossil fuel, natural gas is relatively a cleaner option than coal without Carbon Capture and Storage (CCS) in thermal power generation. The carbon emission intensity of natural gas is 15.3 Kg/G.J. compared to 26.2 Kg/G.J. for non-coking coal [18]. Coal is the most widely used fossil fuel in power generation in India [19]. India’s National Electricity Plan [20] has acknowledged the potential of natural gas to achieve a low-carbon transition of the power sector. To support grid balancing, in anticipation of the future increased penetration of variable renewable energy, the Standing Committee on Energy recommended reviving the natural gas-based plants, which got stranded due to the low domestic supply of gas. Importing natural gas, both in the form of liquified natural gas (LNG) and through the pipeline, is encouraged [21,22]. The annual LNG import is expected to be approximately 78 billion cubic meters (BCM) by 2030 [23]. While the government has taken significant initiatives towards infrastructure development to facilitate transportation of LNG, the achievements are subject to various socio-political and economic bottlenecks [13,24]. Analysis of such bottlenecks needs future scenario-driven strategy planning, which is beyond the scope of this paper.

2.2. Techno-Economical Aspect

In India, natural gas-based power plants broadly use two types of technologies: simple cycle gas turbine (SCGT) and combined cycle gas turbine (CCGT). Coal-based power plants use subcritical and supercritical technologies. While CCGT is a more efficient technology than SCGT, supercritical is more efficient than subcritical plants. In 2015, over 80% of the total installed capacity of coal-based power plants in India was subcritical, and over 95% of natural gas-based power plants had SCGT. Therefore, there are several advantages if new CCGT-based gas power plants replace the existing subcritical coal-fired thermal power plants in India. Firstly, the CO2 emissions in power plants with CCGT are approximately one-half of a subcritical coal-based one, subject to the upstream emissions of natural gas extraction [3]. The thermal efficiency of CCGT-based gas power plants has reached 63% in recent times [25]. It is higher than the economic and operational efficiency [26] of the latest technology available for coal-based power generation in India. Secondly, the installation of CCGT-based gas power plants is generally cheaper than coal-based power plants. The capital costs of CCGT-based gas power plants are around INR 35.85 million/M.W. as compared to INR 52.5 million/M.W. in the case of supercritical coal-based power plant [7,27,28]. Thirdly, a gas power plant with CCGT can be erected within a year, while new coal-based power plants take about five years or more. However, the reduced operational cost is not directly evident since coal is cheaper at the current market price (1.5–2.3 Rs/kWh) than natural gas. In the absence of a carbon content-based pricing of fuels, natural gas cannot compete with coal in the current market condition despite the higher technical efficiency [29].

2.3. The Geopolitical Aspect

According to the International Energy Agency (IEA) projection, the contribution of natural gas in the global energy mix will be the second largest after oil by 2040, and 80% of this projected growth will come from developing nations, including India [30]. The increasing supply of natural gas at the global level, following the successful implementation of horizontal drilling combined with the process technology of hydraulic fracture in the USA, has led to a significant decline in the price of natural gas in the world market. In World Energy Outlook [30,31], it has been projected that a new gas order has emerged globally with the USA as a net exporter of gas following the utilization of its shale gas reserves and additional growth from potential new suppliers are expected after 2025 [31]. However, the transition to gas-based power generation is likely to face challenges from social, technical, economic, and geopolitical perspectives, as does any other transition fuel [24]. The most prominent challenge is the limited supply of natural gas in India. While the new reserve of natural gas in India is identified as over 1.1 million km2 [32], exploration and development activities in the potential fields are comparatively low [32]. Still, the supply of natural gas is expected to increase at a Compound Annual Growth Rate (CAGR) of 7.2% by 2030 from 2012, increasing domestic gas production and imported LNG. The supply share of domestic and imported gas is also anticipated to be equal by that time [23]. After 2012, the production of natural gas in the country has declined consistently due to geological uncertainties [23]. Therefore, to ensure the availability of natural gas domestically, unconventional sources of natural gas such as coal bed methane (CBM), natural gas hydrates, and underground coal gasification have been tapped into. However, production from these sources is not that promising yet as out of five blocks, only one CBM block is currently commercially producing, and the scope of natural gas hydrates is still at a very preliminary level. This has led to a higher import dependency and related vulnerability in the case of external supply shocks. Due to the constrained supply conditions, a sizeable gas-based power generation capacity in India remains unutilized [20].

3. Methodology

3.1. Scenario Analysis

We present a limited number of aspirational scenarios here because the goal is to explore some plausible alternative cases where natural gas can replace coal in India’s power generation sector based on the current policy discourse in the country. One can build various combinations and generate many scenarios, but we take three scenarios as broad options and assess the impact of the process.

3.1.1. Key Assumption

To understand India’s future emission profile with the increasing use of natural gas in thermal power generation, alternative emission scenarios are developed for 2015–2050. The assumptions of these scenarios are consistent with various national and international vision documents:
  • The projected growth of India’s average annual electricity demand growth is 4–6% [7,32,33]. Based on the most conservative figures, the present paper assumes a 4% average annual growth rate starting from a base of 1170 TWh in 2015–2016, leading to a demand of 5000 TWh in 2050.
  • The commensurate supply-side capacity expansion has been assumed for the demand increase. The technology and fuel choice are assumed to align with various policy measures in the National Electricity Plan, 2016 [20]. While the total installed capacity grows over time, they are assumed to be the same under all scenarios in a particular year.
  • The share of non-fossil fuel grows over time, as mentioned in the NDC targets, but does not vary across scenarios. In terms of installed capacity, where the fossil to non-fossil share is approximately 7:3 in 2015, it is almost reversed to become 3:7 in 2050 as per vision documents (Table 1). The figures in Table 1 are reflections of India’s NDC targets up to 2030; beyond that, it has been assumed that the contribution of fossil fuel will be reduced by 1% every five years up to 2050 [34].
  • Coal and natural gas constitute fossil fuel shares, and the non-fossil sources consist of nuclear, large hydro, and renewable sources, including solar, wind, small hydro, and biomass [33]. Different scenarios are developed to explore the implications of the different mixes of natural gas and coal in fossil fuel-based power generation. The scenarios are constructed for the time frame 2015–2050, and the assumptions of these scenarios are summarized in Table 2.
Table 1. The projected share of fossil and non-fossil fuel in power generation in India.
Source20152020202520302035204020452050
Fossil66%53%45%40%39%38%37%36%
Non-Fossil34%47%55%60%61%62%63%64%
Source: Authors’ calculations are based on the projections of NDC of India [34].
Table 2. Potential of power generation from non-fossil sources.
Non-Fossil Energy SourcesPotential
[35]
Status (2015)
[20]
Target
[6]
Wind302 GW23.76 GW installed capacity60 GW installed capacity by 2022
Solar750 GW4.06 GW installed capacity100 GW by 2022
Biomass25 GW4.4 GW current capacity10 GW by 2022
HydroLarge hydro
149 GW,
Small hydro
21 GW
46.1 GW current installed capacity out of 4.1 GW small hydro and 41.99 GW large hydro-
Nuclear-5.78 GW current installed capacity63 GW by 2032
In 2015, coal-based power generation in India accounted for ~55% (~141 GW; subcritical—45%, supercritical—10%) out of the total installed capacity, while gas-based power generation accounted for ~13% (~32 GW; CGT—1%, SCGT—12%). Hydro, nuclear and renewables contributed ~42 GW (16%), ~6 GW (2%), and ~35 GW (14%), respectively [6].

3.1.2. Reference Scenario

Under the Reference Scenario, it has been assumed that the share of subcritical coal-based power plants gradually declines to ~57 GW in 2030 and remains constant after that. This decline in the share is due to no further capacity addition to subcritical technology and the gradual retirement of old plants. Between March 2016 and May 2019, a total of 8470 MW capacity of coal or lignite-based thermal power units, which are older than 25 years and low in efficiency, have been assumed to retire as they become un-economical [36]. Capacity addition to coal-based power generation will only be through supercritical technology. Which is 26 GW in 2015; it will increase up to 398 GW in 2050. Under the Reference Scenario in 2050, the share of coal will be 26% of the total installed capacity, and out of that, 71% will be in the form of supercritical technology. The government of India has already taken the initiative to facilitate the development of a few Ultra Mega Power Projects of about 4000 MW capacity using supercritical technology [37].
Under the Reference Scenario, all new capacity addition to natural gas will be CCGT technology-based and will increase at 10% every five-year starting from 2020. The existing capacity of SCGT will remain unchanged up to 2025 and starts to decline at a rate of 10% every five-year after that due to the retirement of old plants. However, as one of the important features of SCGT is its quick ramping flexibility, an SCGT capacity of 5% of total renewable capacity has been assumed to be present throughout projection to support the intermittency of variable renewable-based power generation. This capacity has been assumed to run for 6 h a day with 50% of the Plant Load Factor (PLF) [20]. The share of natural gas-based power generation will be 7% of the total installed capacity and 19% of the thermal capacity in 2050, under the Reference Scenario.
The total installed capacity for the rest of the fuels is calculated based on India’s NDC and projections under the 13th Five Year Plan. It is also consistent with its potential for non-fossil power generation (Table 2). Under the projection of the 13th Plan by the former Planning Commission of India (revamped to NITI Aayog in 2015), capacity addition to large hydro will be 12 GW during 2018–2022 [38]. Under the Reference Scenario, it has been assumed that this trend of capacity addition will continue in the future and that 12 GW capacity will be added to large hydro every five years.
In India’s recent energy policy documents, solar has been emphasized as one of the most significant sources of non-fossil-based power generation. In the NDC, the goal for solar-based power generation has been set to achieve 100 GW by 2022 from the 2015 capacity of 4.06 GW. This impetus is assumed to continue in solar even beyond 2022 but at a lower rate of 5% annual growth rate. The total installed capacity of solar is estimated to be ~480 GW by 2050, almost the same as the coal capacity of 2050. The annual growth rate of capacity additions to the wind, biomass, and small hydro during 2016–2022 are 14%, 12%, and 3%, respectively. These capacity addition rates are assumed to continue till 2050 for the respective fuels. Wind, biomass, and small hydro capacity will be 60 GW, 10 GW, and 5 GW, respectively, in 2022 and will become 172 GW, 32 GW, and 8.5 GW in 2050 with respective average annual growth rates of 4%, 2%, and 4%. According to the NDC, nuclear capacity, which was 5.8 GW in 2015, will increase to 63 GW by 2032, subject to a smooth fuel supply [6]. The annual growth rate of capacity addition to nuclear during 2015–2032 is 15%. It is assumed that this rate of capacity addition will continue until 2050.

3.1.3. Other Scenarios

Scenario 1
Under Scenario 1, it has been assumed that compared to Reference Scenario, 50% of the addition to coal-based supercritical capacity will be shifted to CCGT-based gas power plants, starting from 2020. The capacity of subcritical coal and SCGT-based gas power plants to support renewables, hydro, nuclear, and other renewables remains the same as in the Reference Scenario.
Scenario 2
In Scenario 2, no coal-based supercritical capacity additions will occur after 2015, and it will remain constant at 26 GW The capacity addition to the supercritical power generation under the Reference Scenario will be shifted to CCGT-based natural gas power plants starting from 2020. The capacity of subcritical coal and SCGT-based natural gas power plants to support renewables, hydro, nuclear, and other renewables will remain the same as in the Reference Scenario.
Scenario 3
In the above two scenarios, the assumption is that coal-based subcritical capacity continues to decline until 2030 and remains constant after that. In Scenario 3, it has been assumed that approximately 50% of the existing subcritical capacity (approximately 30 GW) in 2050 under Scenario 2 is converted into CCGT based gas power plants in a phased manner. This is achieved by replacing 5 GW of subcritical coal capacity with CCGT-based gas power plants every 5 years starting from 2025. The capacity of supercritical coal, existing CCGT, and SCGT to support renewables, hydro, nuclear, and other renewables are the same as in Scenario 2.
However, to support these scenarios, the supply of natural gas has to increase. If that happens, the efficiency of existing gas-based plants will also increase, and the same installed capacity will be able to generate more electricity. However, here, it has been assumed that the efficiency is at a lower level, implying a relatively less optimistic situation. A higher level of efficiency would lead to lower emissions from a given quantity of natural gas. Table 3 summarizes the main assumptions behind all the scenarios.

3.2. Determination of Emission Level and Annual Fuel Requirement

The annual electricity generation from a particular fuel source has been calculated by multiplying the total installed capacity of that fuel by the total number of days in operation throughout the year, taking the number of hours in operation and the plant load factor [18]. The annual generation is measured in watt-hours as per Equation (1).
Annual   Generation = Total   installed   capacity × number   of   operational   days × number   of   operational   hours   in   a   day × PLF
where PLF = Plant load factor.
Annual fuel consumption is derived by multiplying the annual generation with the station heat rate (SHR) of a particular fuel (Equation (2)).
Annual   fuel   consumption = Annual   generation × SHR
The annual emission of a particular GHG during fuel combustion is calculated based on their annual consumption, emission factor (E.F.), and Global Warming Potentials (GWP) and expressed in terms of CO2e (Equation (3)). E.F. and GWP of the fuels are given in Table 4.
Annual   Emissions   ( C O 2   equivalent ) = Annual   fuel   consumption × [ ( E F   of   C O 2 ) + ( E F   of   C H 4 × GWP   of   C H 4 ) + ( EF   of   N 2 O × GWP   of   N 2 O )

3.3. Energy Security Indicators

Following the scenario analysis, energy security indices have been calculated as suggestive measures and substantiated by qualitative analysis. The discussion on energy security is associated with the concepts of robustness, resilience, and sovereignty [39,40]. Hence, understanding the energy security implications of natural gas imports for 20 years is rather complex. To address the issue, a two-way approach has been adopted. First, quantitative energy security indices (Herfindahl–Hirschman Index (HHI), Shannon–Weiner index (SWI), adjusted Shannon–Wiener–Neumann index (SWN)) are derived for the year 2012 and 2030. This helps in understanding the implications of switching to a fuel that will be primarily imported. While such energy security indices represent the situation, the additional qualitative discussion often requires further qualitative debate.
HHI is an indicator to study market concentration [41] and is calculated based on Equation (4).
H H I = i x i 2
where xi is the share of the ith country in total import. The value of HHI will always lie between 0 and 1, and a higher value of HHI indicates a high degree of market concentration towards a single country and hence a less conducive situation for energy security [41,42].
SWI has a similar underpinning as HHI and is based on the import share from the ith source [41]. In SWI, a logarithmic weight is attached to the import share from the ith source and is calculated based on Equation (5).
S W I = i x i ln ( x i )
The negative sign in the equation makes sure that the outcome of the SWI is always positive. Unlike HHI, as a diversity index, the higher value of SWI stands for the favorable position of a country for energy security. The minimum value for SWI is zero, and that is reached when all imports come from a single source [41].
One of the drawbacks of both HHI and SWI is that they do not consider the share of domestic production. The existence of high market concentration or low diversity, along with a more significant share of natural gas being imported than being domestically produced, makes a country more vulnerable to the risks of trade coming from various sources, including geopolitical. An adjusted Shannon–Wiener–Neumann index (SWN) is recommended to include two additional factors: the political stability factor of the country from which import is taking place and the share of domestic production [41]. Higher values of both indicators play a positive role in enhancing energy security [41]. SWN is calculated based on Equation (6).
S W N = i ( b i x i ln ( x i )   ( 1 + g ) )
where   b i is the political stability index, and g is the share of domestic production.
Similar to SWI, the higher the value of SWN higher will be the country’s energy security.

4. Results and Discussion

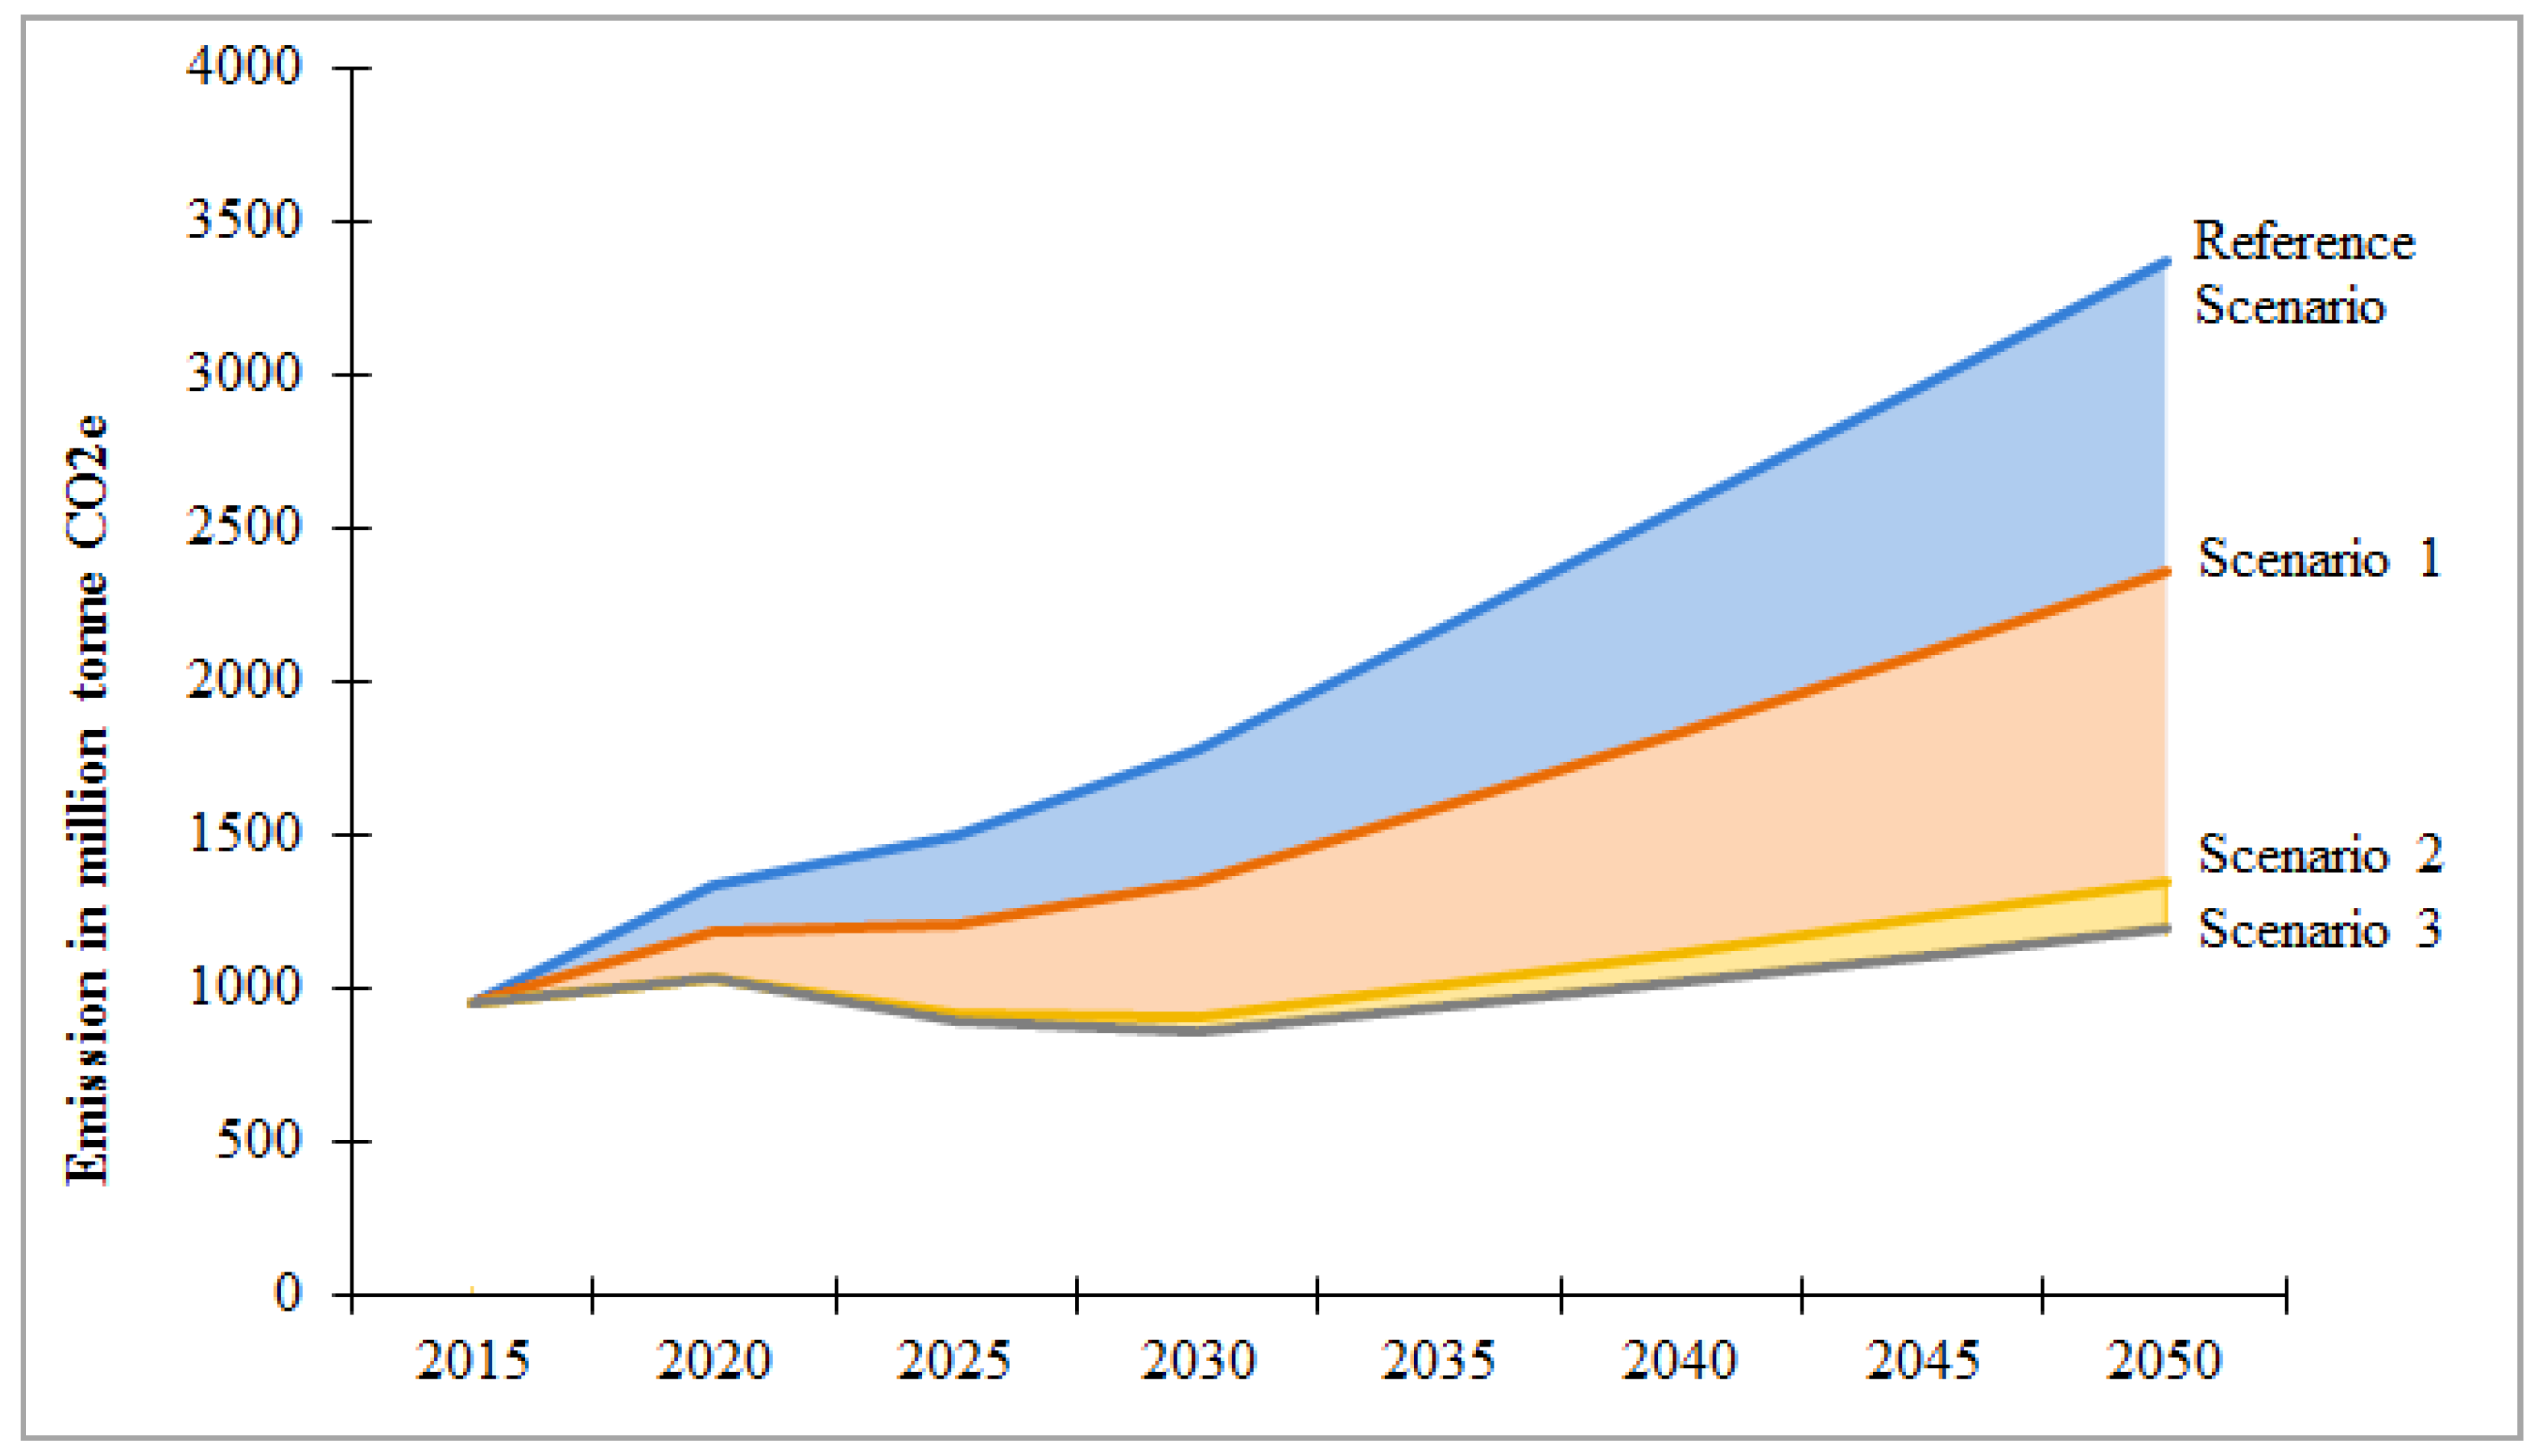
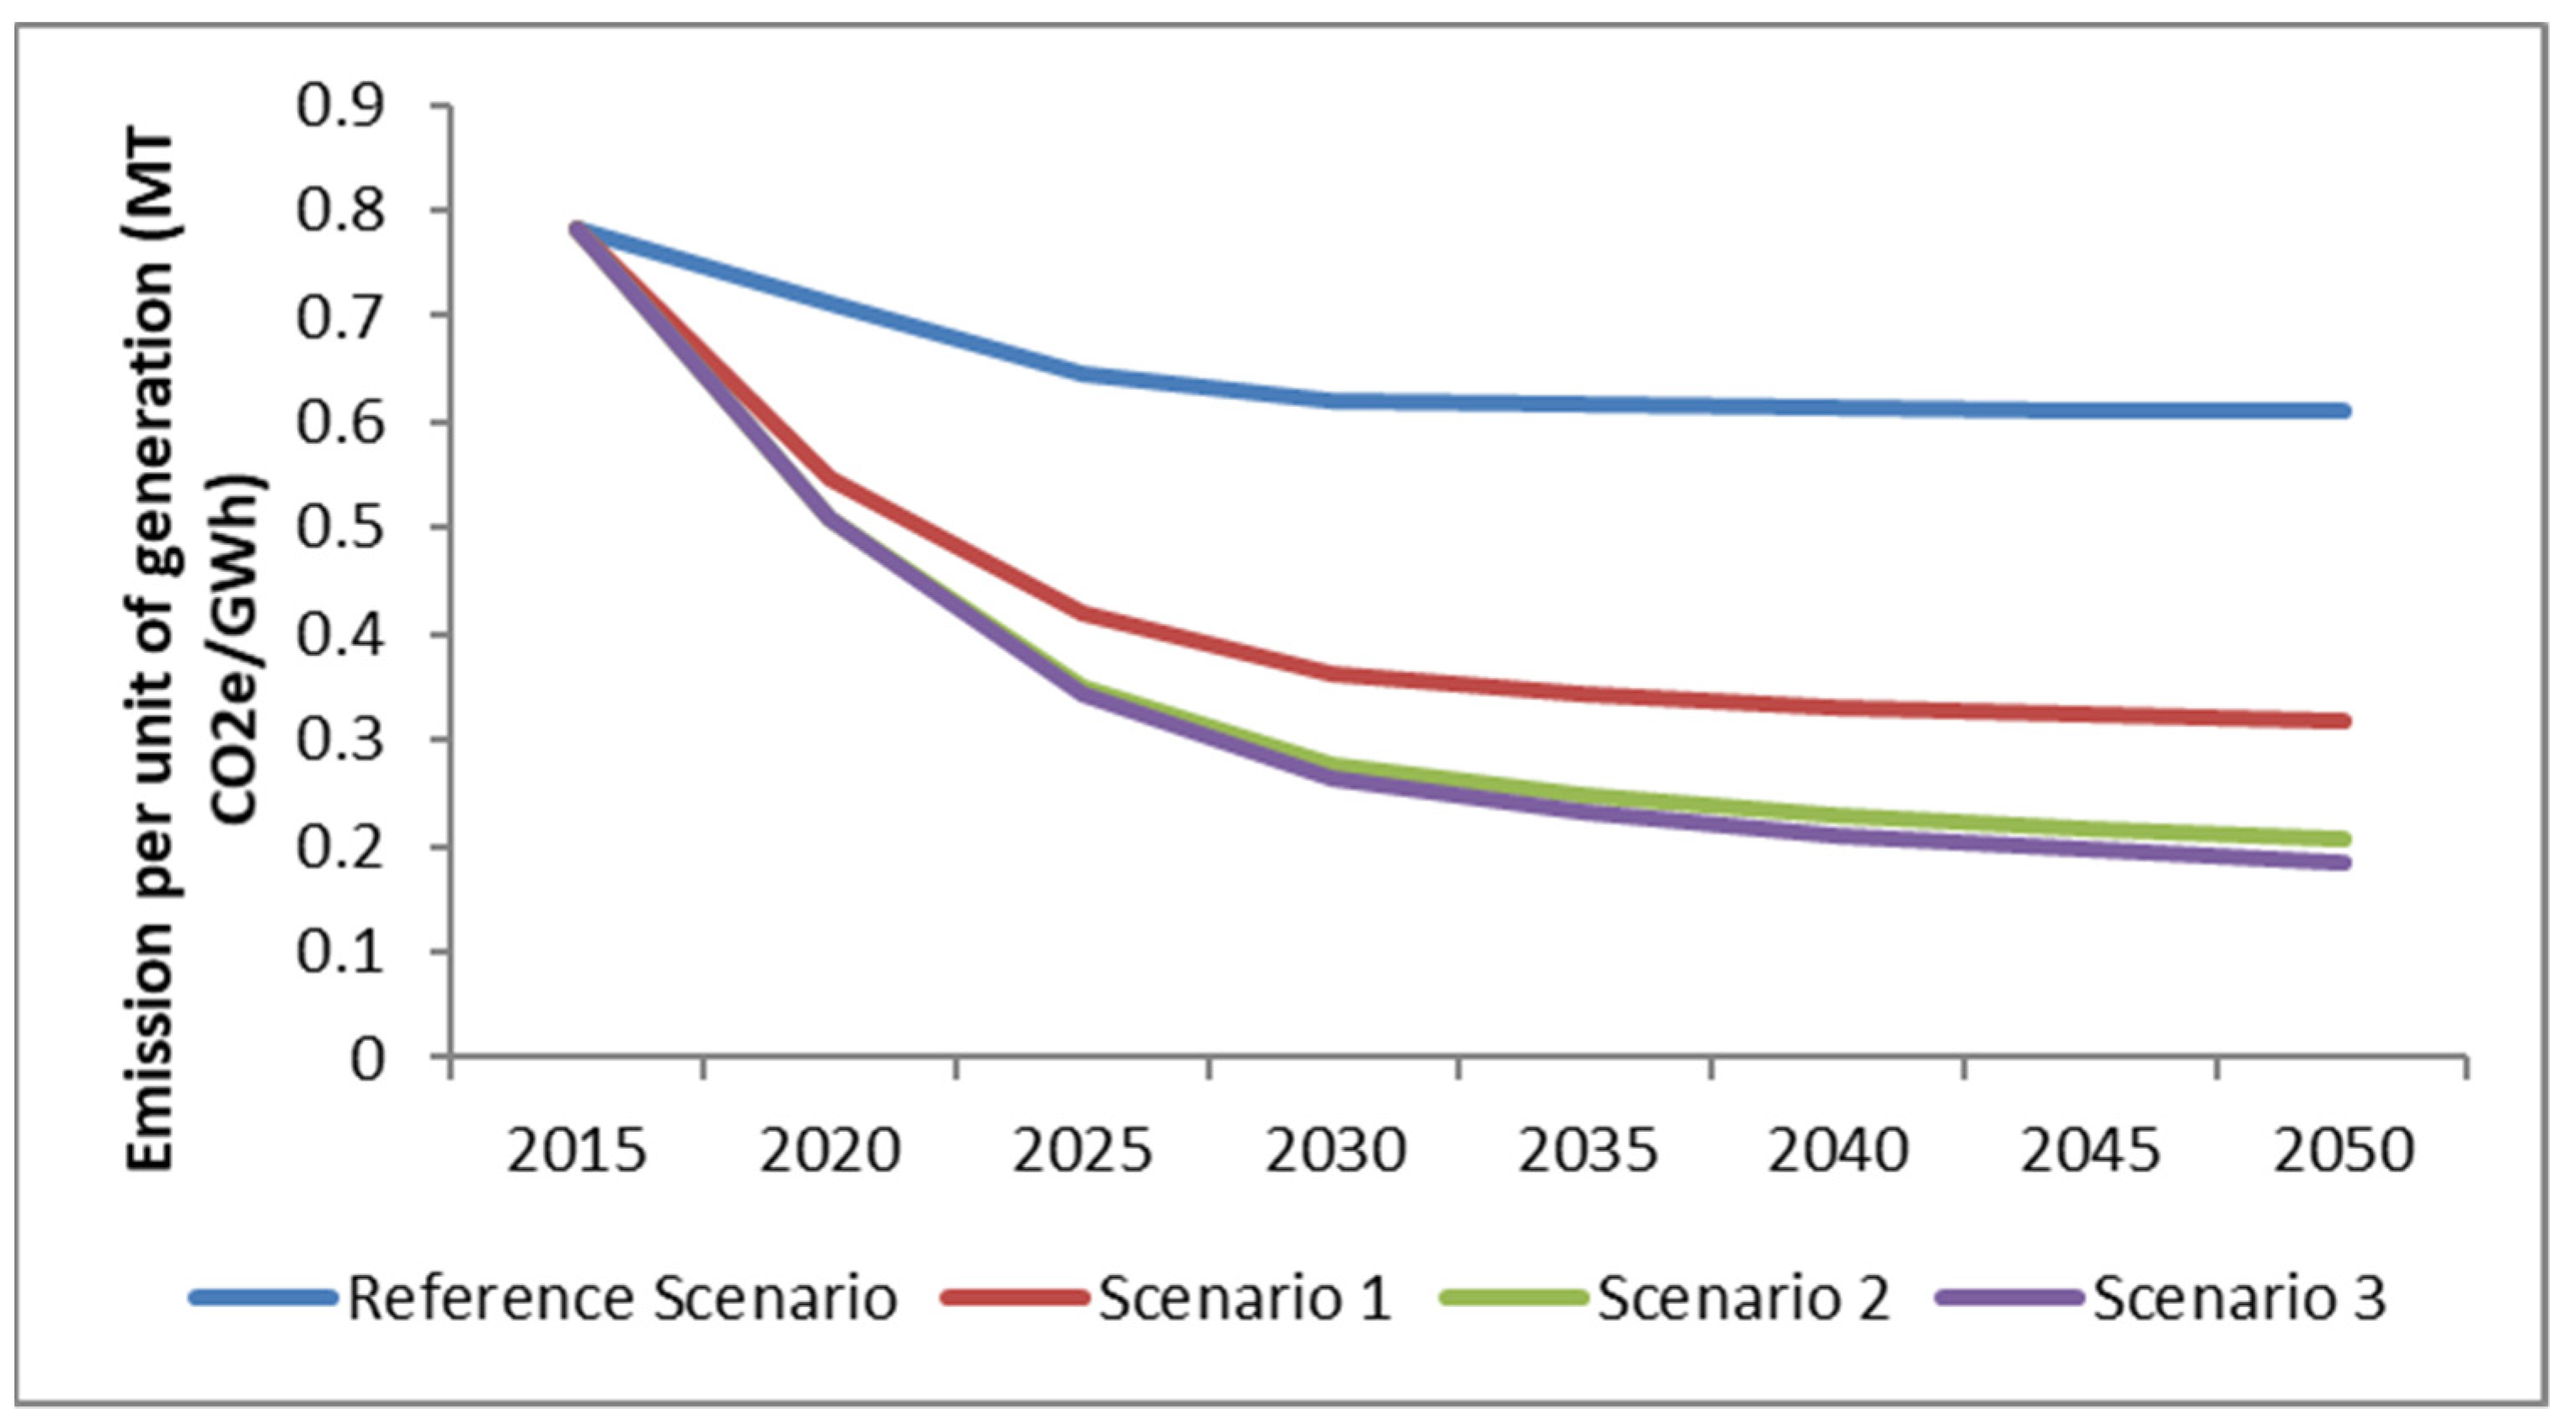
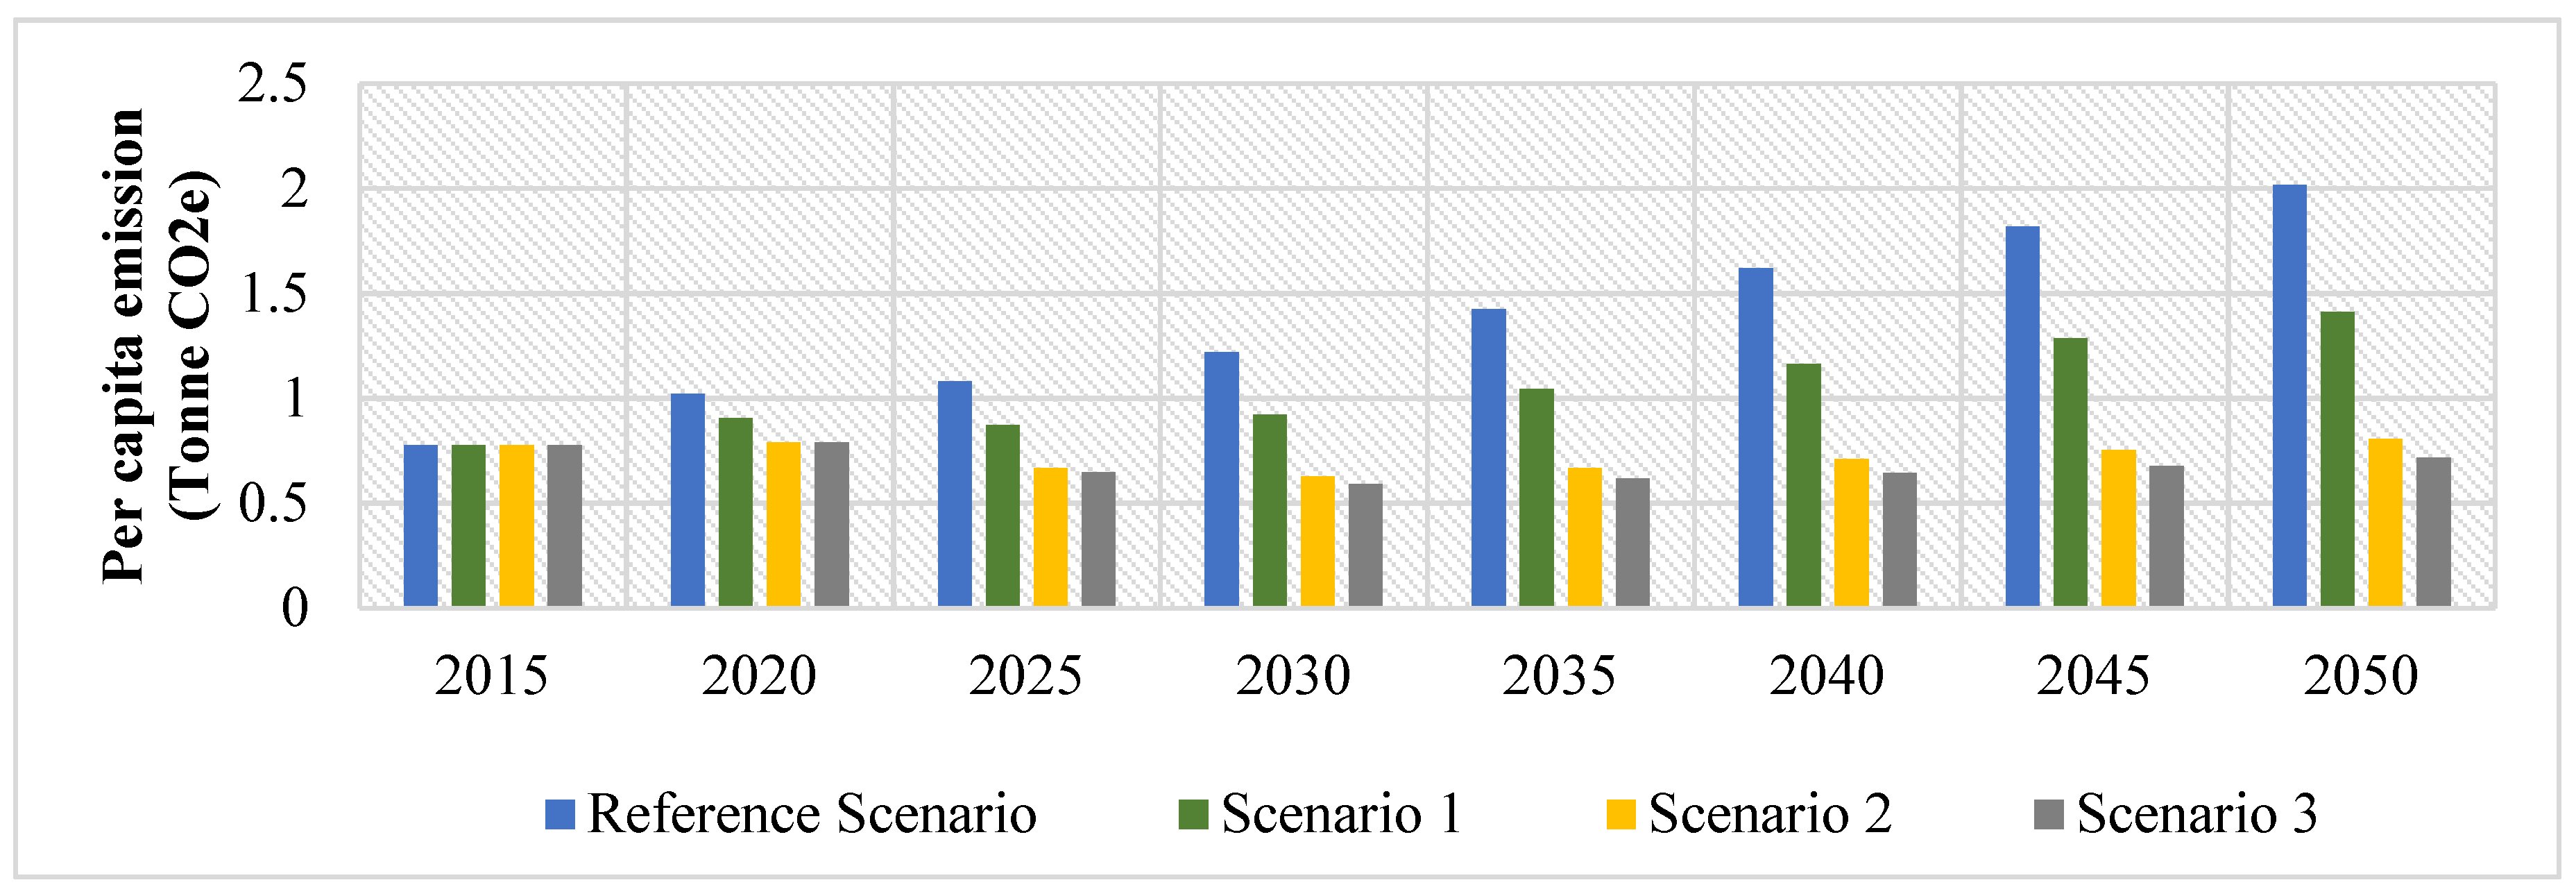
4.1. Emission Scenario

As the non-fossil capacity remains the same across all the scenarios, the results change with changing share of gas and coal-based capacities within the fossil or thermal capacity. These are presented in the different panels of Figure 1. The Reference Scenario is designed to achieve an efficient coal capacity with more capacity additions to supercritical technology. The share of supercritical coal capacity in 2015 was 10% of the total capacity and 15% thermal capacity. This capacity represents 17% of the entire generation and 21% of thermal generation. Under the Reference Scenario, the supercritical coal capacity represents 27% of the total installed capacity, 71% of total thermal capacity, contributing 56% of the total generation in 2050.
The installed capacity of supercritical technology declines in the other two scenarios and represents 14% in Scenario 1 and 2% in Scenarios 2 and 3. The reduced share of supercritical capacity is compensated by CCGT capacity. Under the Reference Scenario, the share of CCGT is less than 1% in 2015. In 2050, it constitutes 4%, 16%, 28%, and 30% in the Reference Scenario and Scenarios 1, 2, and 3, respectively. Hence, a major change in the scenarios is the replacement of subcritical coal capacity. It declines to 4% of the total installed capacity and 10% of the thermal capacity in 2050, down from 45% and 66%, respectively, in 2015 under the Reference Scenario. In 2050, the share of subcritical capacity is estimated to constitute 4% in both Scenarios 2 and 3, and it constitutes 2% of total capacity in Scenario 3. The decline is not only in installed capacity but also in the generation. In 2015, the share of subcritical coal in the total generation was 57%, and it declines to 6%, 4%, 5%, and 2%, respectively, under the Reference Scenario and Scenarios 1, 2, and 3.
Corresponding to the projected capacity and power generation scenarios, we get different emission trajectories (Figure 2). In all of the scenarios, the thermal power sector (comprising coal and gas) and biomass are the only emitting fuel sources. It is evident from Figure 2 that under all scenarios, total emissions continue to rise but at very different scales. Emissions in Scenario 3 are 64% lower in 2050 than in the Reference Scenario—1196 MT CO2e compared to 3374 MT CO2e, respectively—due to a greater use of natural gas with efficient technologies in electricity generation. However, emissions per unit of generation decline in all four scenarios (Figure 3).
Total emissions and CO2 emissions per unit of generation are the same for all the scenarios in 2015, 956 million tons CO2e and 0.78 MT/MWh, respectively. This refers to the emission from the fuel used in the power generation sector. Under the Reference Scenario, total emissions have grown to 3374 million tonnes of CO2e in 2050, with a decline in CO2e emission per unit of generation to 0.61 MT/MWh. This is because none of the capacity additions comes from subcritical coal but from more efficient technologies for coal and natural gas, i.e., supercritical technology for coal and CCGT for natural gas. In Scenario 1, it has been assumed that half of the additions to supercritical technology are diversified into natural gas capacity with CCGT. In this scenario, total CO2e emissions decline to 2360 million tons, with CO2e emissions per unit of generation to 0.32 MT/MWh. This is an improved scenario from the Reference Scenario in terms of total emissions and emissions per unit of generation. Scenario 2 shifts the total addition to supercritical coal capacity under Scenario 1 into natural gas CCGT capacity. In Scenario 2, total emissions decline to 1347 million tonne CO2e in 2050, and CO2e emissions per unit of generation further decline to 0.21MT/MWh. In addition to the assumptions in Scenario 2, Scenario 3 assumes that the existing subcritical capacity is partly converted into natural gas-based CCGT. This contributes to lower total emissions in Scenario 3; 1196 million tons CO2e in 2050, with CO2e emissions per unit of generation falling to 0.18 MT/MWh. Here, the emission per unit of generation (Figure 3) under scenarios 2 and 3 are marginally different. However, Scenario 3 has been exhibited as a plausible scenario, and any increase in the proportion of sub-critical capacity will increase the difference between scenarios 2 and 3 (A supplementary analysis of cost corresponding to the scenarios reveal that in the initial years, the cost associated with Scenario 3 is lower than Scenario 2; however, the gap between the costs of these two scenarios decline in later years. For details, refer to the Supplementary Material).
Following the population projection by UNDP [43], per capita, CO2e emissions from power generation in Scenarios 2 and 3 continue to decline until 2035 but increases after that at a marginal rate (Figure 4). This is mainly owing to a gradual decline in the rate at which the population is projected to increase. However, as compared to 2.01 per capita CO2e in 2050 under the reference scenario, the figures are 1.4, 0.80, and 0.71, respectively, under Scenario 1, 2, and 3.
In its NDC, India has committed to reducing the emission intensity of its GDP by 30–33% by 2025. Following the various scenarios, more stringent efforts in fuel switching and technological upgrading give a higher chance of abatement. The change in emission intensity of GDP from power generation in 2050 from its 2015 level is 80%, 89%, and 90%, respectively, under Scenarios 1, 2, and 3. The same from the 2005 level is 93%, 96%, and 97%, respectively, under Scenarios 1, 2, and 3. Given India’s climate commitment at the global level, additional efforts for India can be to transform its thermal power generation to a more efficient and less emitting one by increasing the use of natural gas.

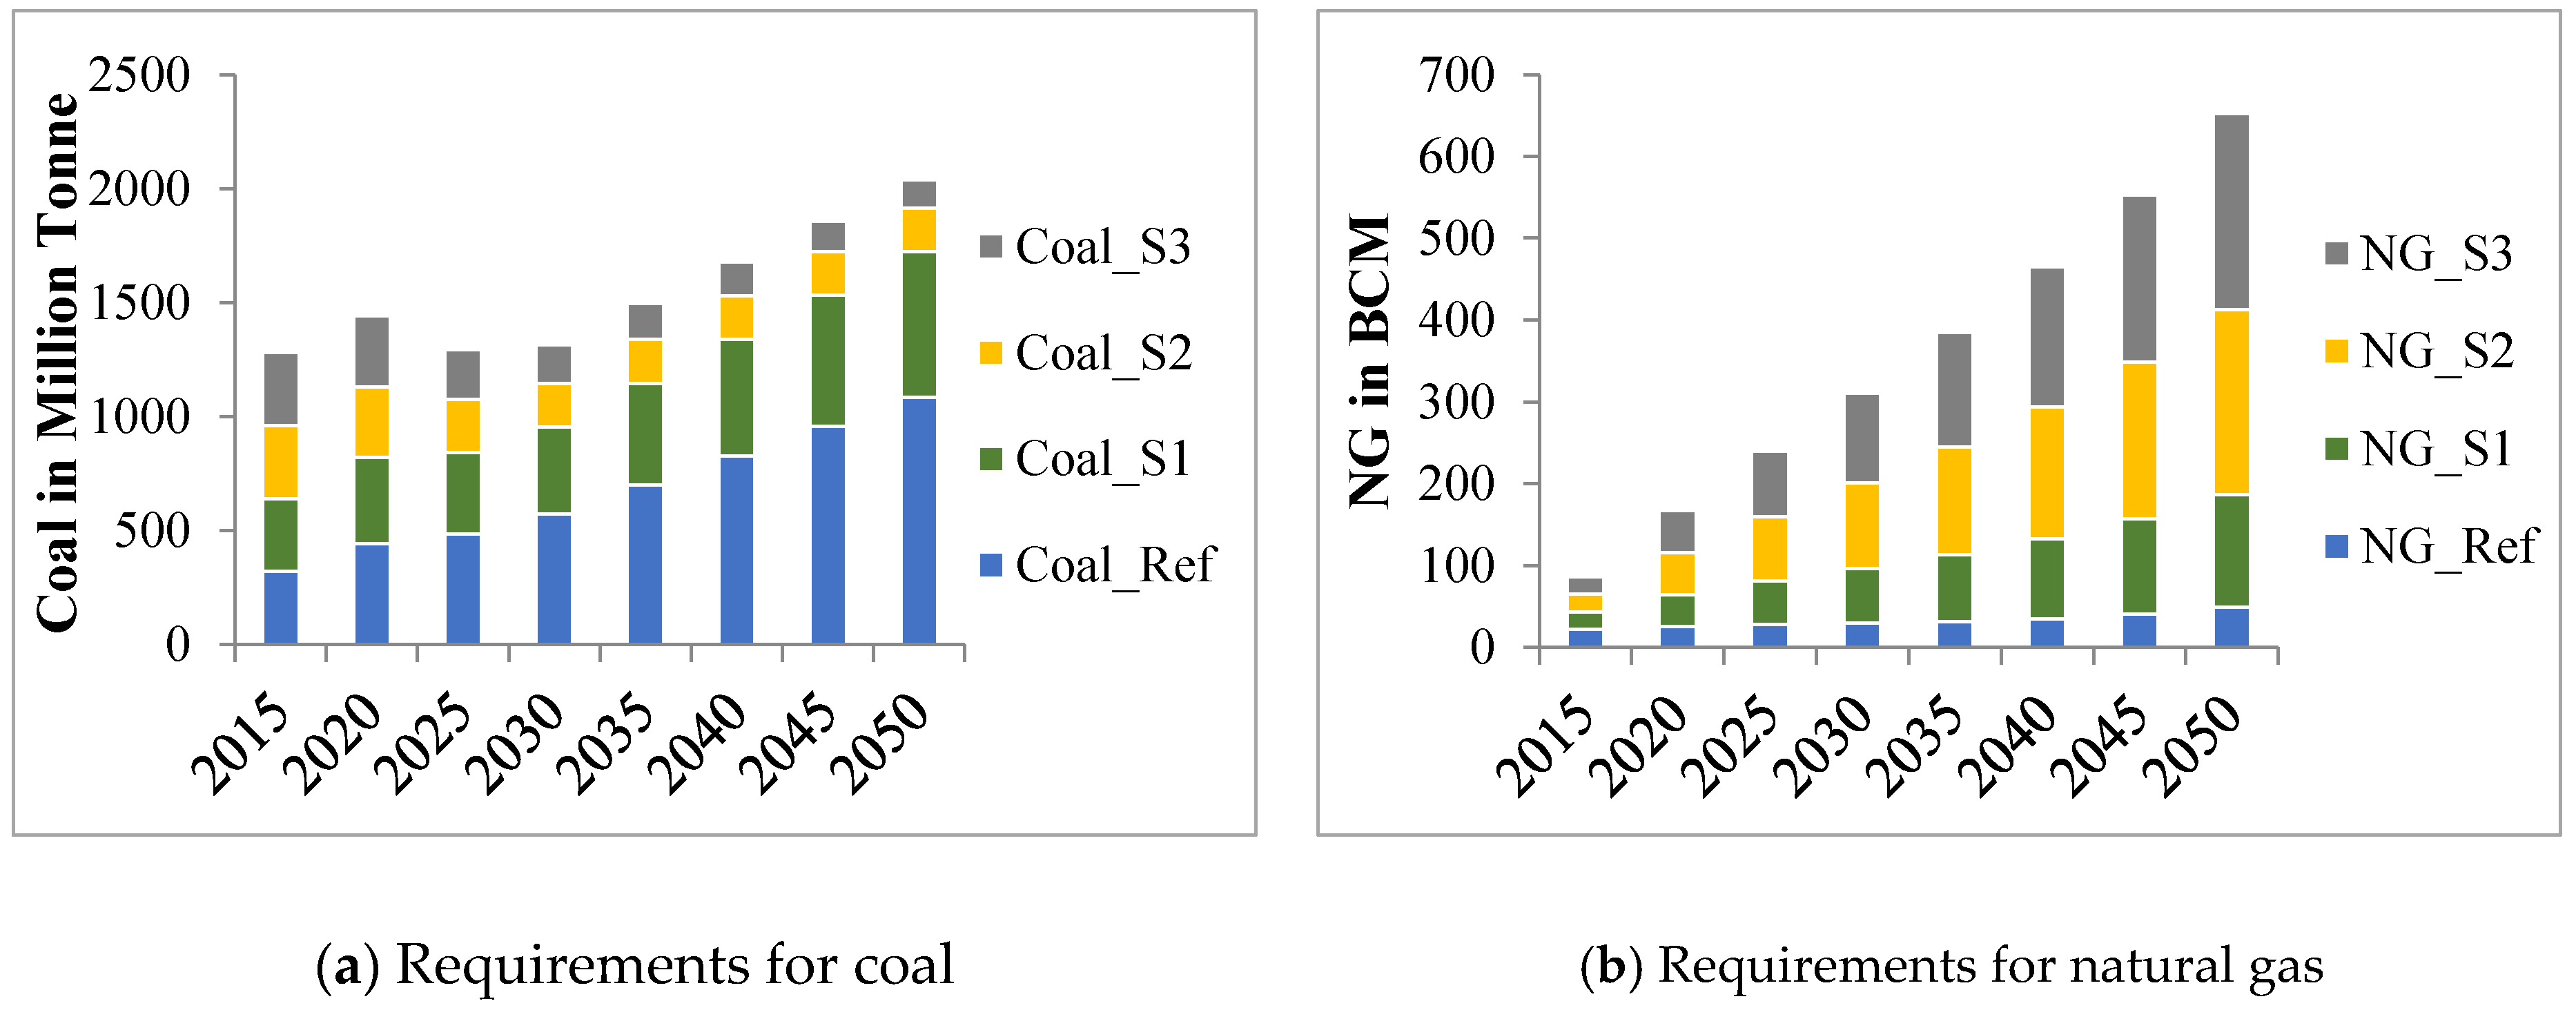
4.2. Fuel Requirement

Total proven reserves of coal and lignite in India at the end of 2015 were 137.8 billion tons with a lifespan of more than 200 years given the current production level. During 2014–15, a total of 612.44 million tons of coal was produced in India, 8.25% more than the previous year [19]. The import of high-quality coal has become indispensable for India as the average quality of Indian coal is not optimal for power generation because of its high ash content. The import of coal has increased steadily from 38.59 million tons in 2005–06 to 212.1 million tons in 2014–2015 [44]. The proven reserve of natural gas in India as of March 2016 was 1227.20 billion cubic meters (BCM), and out of that, 745.41 BCM is offshore [22].
Following the capacity and emission scenarios, the future requirement for coal and natural gas will change in India. The total need for coal and natural gas in 2015 was 321 million tons and 22 BCM, respectively. Under the Reference Scenario, this demand is going to be 1085 million tons of coal, which will go down to 638 (41%), 191 (82%), and 124 (89%) million tons under Scenarios 1, 2, and 3, respectively. As Indian coal is high in ash content and low in calorific value, around 30% of coal used in thermal power plants needs to be imported [20]. This falling demand for coal for thermal generation will lead to a reduction in coal imports for India. However, the demand for natural gas will rise over the scenarios: 49, 137, 226, and 240 BCM, respectively, under the Reference Scenario and Scenarios 1, 2, and 3. Compared to the Reference Scenario, the demand for natural gas will increase by around 3, 4.5, and 5 folds in Scenarios 1, 2, and 3, respectively (Figure 5).
This raises the question of energy security for India. If one assumes an electricity supply trajectory in accordance with Scenarios 2 and 3 in particular, it will lead to a substantial increase in the consumption of natural gas. Therefore, it is important to understand the dependence on natural gas and its implications for energy security and supply chain infrastructure; the latter is outside the purview of this article.
The existing PLF of natural gas-based power plants in India on average is 25% [20] due to an inconsistent supply of natural gas. However, all the above scenarios are built on the assumption that future gas supply in India will improve from both domestic reserves and imports. Considering that this assumption holds, the improved natural gas supply will make it possible for natural gas plants to run at a better PLF and thus make them able to generate more electricity with the same capacity. Hence, if the natural gas supply improves in India in the future, then the required amount of electricity can be supplied with less capacity addition. Thereby, a considerable investment can be saved and shifted into infrastructure developments for natural gas transportation.

4.3. Energy Security Indicators

The domestic reserves of natural gas in India are not sufficient to support increased demand. In 2014–2015, 40% of gas demand was supported by imported gas [22]. Over the years, India has imported natural gas from various countries across various continents/sub-continents, including the Middle East and Caspian region, Africa, Europe, Asia, and Latin America. Some of the sourcing countries are Qatar, Nigeria, Yemen, and Egypt. Qatar has been a significant country, with ~90% of imported natural gas in India coming from Qatar, followed by ~4% from the Yemen Republic in 2013–2014. The rest, 6%, was imported mainly from Brunei, Egypt, Nigeria, and Norway [45]. This clearly shows a significant concentration of market share that will result in a high value of HHI and a low value of SWI. If a similar pattern sustains in the future, then using natural gas as transitional fuel in the short to mid-term will increase energy security concerns.

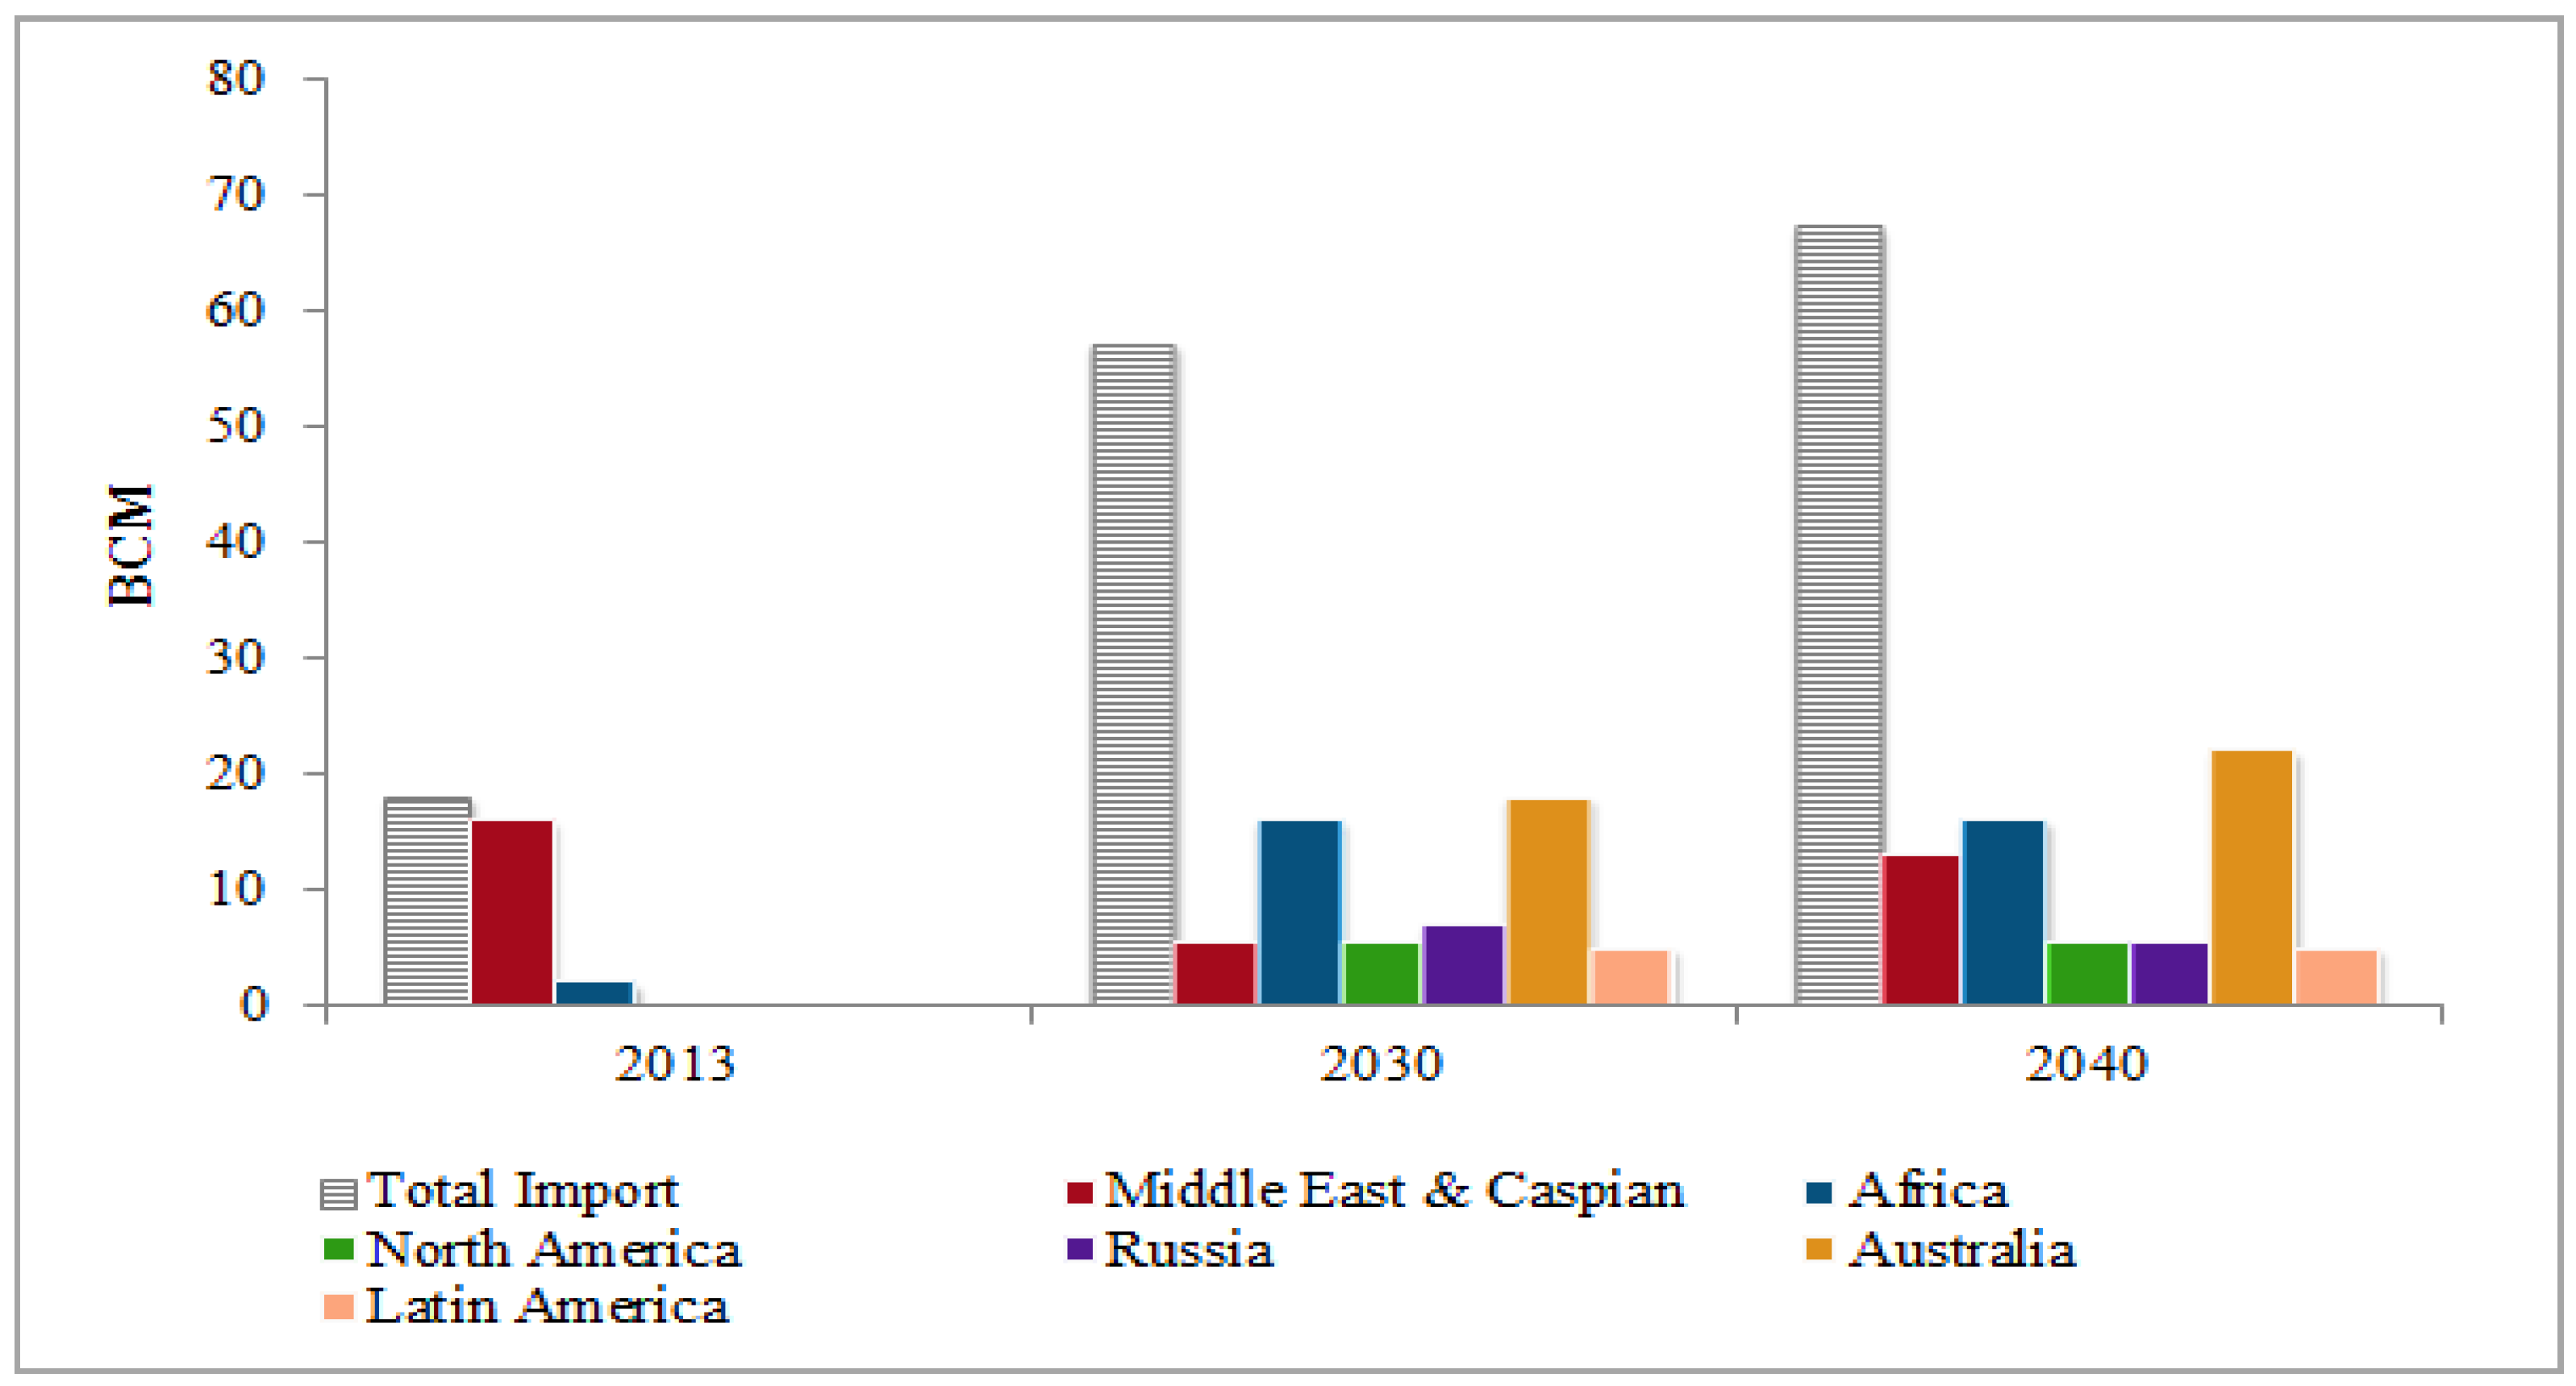
Projection of Energy Security by 2030

The energy security indicators are calculated for 2013–2014 and compared with projected figures for 2030. The underlying assumption of the share of various continents/subcontinents from where India can import is based on the IEA projection of India’s import of natural gas from multiple continents (Figure 6). The projection shows the potential entry of new entrants like the USA and Russia in the future, though these countries are not currently exporting natural gas to India. Additionally, the average political stability index of the exporting countries is taken in this study as a proxy of the political stability of the continent/subcontinent for the calculation of SWN.
Table 5 and Table 6, respectively, provide the data used and calculations of HHI, SWI, and SWN for 2013 and the projection for 2030. HHI, SWI, and SWN indices are calculated to be 0.8, 0.44, and 2.01, respectively, for the years 2013–2014. This clearly shows a very high market concentration, owing to ~89% import share of the Middle East and Caspian region.
Under a projected scenario by the IEA, new import links will emerge for India with North America, Russia, Latin America, and Australia. With the increase in the number of sources, market concentration is estimated to reduce under the projected scenario, with only 25% coming from the Middle East [31]. It can be predicted that the supply of natural gas will become increasingly diverse after 2025, with a range of new countries. This results in a much lower value of HHI (0.19) and a much higher value of SWI (1.78) and SWN (8.21), having positive implications for energy security (Table 6). Interestingly, even if the share of domestic production of natural gas is projected to decrease from 67% in 2013 to 46% in 2030, the energy security increases.

5. Conclusions

The study shows that by increasing the share of natural gas in power generation in India’s short–medium-term future, there could be a significant gain in emission reduction. Under alternative illustrative scenarios, both fuel switching and technological up-gradation provide scope for mitigating GHG emissions beyond India’s current NDC pledges. The demand for natural gas in Scenario 3 in 2050 is quite close to IEA’s Sustainable Development Scenario for India. The WEO scenario stipulates a demand of 237 BCM in India by 2040 (a 30% increase from their new Policies scenario). Scenario 3 estimates a demand of 240 BCM by 2050. However, there are other challenges. Higher import dependency in the absence of domestic availability of natural gas for India under low carbon scenarios may arise due to global political changes. However, this also relates to coal. Currently, coal-based power generation accounts for more than 60% of the total generation. The import of coal increased steadily from 38.59 million tons in 2005–2006 to 212.1 million tons in 2014–2015. So, increasing the share of natural gas in power production diversifies the import dependency of India. With the increased diversity in sources and a decrease in market concentration in India, energy security can increase with higher penetration of natural gas. This will also depend on several factors, such as the future availability of natural gas, the demand for natural gas in other regions, and the price of natural gas. There are four common elements addressed in World Energy Outlook, 2017 [30] that are seen as necessary for natural gas to thrive. Natural gas needs to be reliable and affordable; it needs to be seen as part of the solution to local and global environmental problems; it requires an adequate institutional and policy context. It needs to be supported by appropriate measures such as carbon pricing emission standards and more. Of these, affordability may be the biggest challenge in the Indian context. Plentiful and cheap coal reserves and infrastructure constrains the transition to import large quantities and natural gas distribution in India. The future price of natural gas also depends on the policies in other countries and regions. So far, most of the import contracts for LNG that India has undertaken are long-term and linked to the crude oil price. Therefore, the country cannot gain much from a significant decline in the LNG spot prices due to steady growth in global supply and new projects in Australia, the USA, and Russia. While the import of natural gas accounts for a considerable expenditure share of the country and the impact of any upward fluctuation in prices can be mitigated through such long-term contracts, it is also important to notice that the decline in the spot price has been relatively steady. Given this, long-term contracts benchmarked to daily spot prices of LNG that India is looking forward to might work as a better strategy to keep energy sources cheaper. However, gains from such arrangements are always subject to market fluctuations.
In the Sustainable Development Scenario of World Energy Outlook 2018 [31], gas demand continues to grow to 2025 before flattening out and declining due to improved efficiency in buildings and industry and more rapid decarbonization of power in Europe and North America. Therefore, lower demand could ‘translate into lower prices as well as lower investment needs for gas supply.’ Suppose the goal is to contribute to a sustainable energy trajectory in India. In that case, natural gas should be seen as part of the solution and strategic infrastructure building to support the supply chain. This requires more investment, effective institutional change, and policy in support of natural gas. Policy measures such as carbon pricing and emission standards to promote the use of gas would also need complementary policies around coal. Natural gas can be a feasible way to move towards deep decarbonization of power production in the longer run. The benefits of natural gas may outweigh the costs of the broader energy transition facing India. The paper does not focus on infrastructure to enable enhanced gas supply within the country as this needs complete technical and non-technical issues to be addressed. It can be a future research agenda.

Supplementary Materials

The following are available online at https://www.mdpi.com/article/10.3390/en14133787/s1. In supplementary material we have provided the details analysis of cost corresponding to the scenarios.

Author Contributions

Conceptualization: N.D. and S.D.; data curation: N.D. and S.D.; formal analysis: N.D. and S.D.; funding acquisition: M.A.; methodology: N.D., S.D. and J.R.; supervision: J.R., O.L. and M.A.; writing—original draft: N.D., S.D. and O.L.; writing—review and editing, J.R., O.L. and M.A. All authors have read and agreed to the published version of the manuscript.

Funding

This research is funded under the Indo-Norwegian Cooperation Program (INCP-2014/10086) of the University Grants Commission (UGC) of India, awarded to Prof. Sudipta De as P.I. and the Research Council of Norway (RCN) awarded to Prof. Mohsen Assadi as P.I.

Institutional Review Board Statement

Not applicable.

Informed Consent Statement

Not applicable.

Data Availability Statement

Not applicable.

Acknowledgments

This work is part of a collaborative project between the Global Change Programme of Jadavpur University and the University of Stavanger. The authors duly acknowledge the travel and collaboration support provided under Indo-Norwegian Cooperation Program (INCP-2014/10086) project for the successful completion of this work. Part of the paper is developed based on the research output of the Ph.D. thesis of Nandini Das submitted to and degree awarded by the Department of Economics, Jadavpur University, and she duly acknowledges the Global Change Programme of Jadavpur University for the financial and infrastructural support to carry her doctoral research.

Conflicts of Interest

We have no conflict of interest to disclose.

Abbreviations

BCMBillion Cubic Meters
CAGRCompound Annual Growth Rate
CBMCoal Bed Methane
CCGTCombined Cycle Gas Turbine
CCSCarbon Capture and Storage
EFEmission factor
GDPGross Domestic Product
GHGsGreenhouse gases
GWGigawatt
GWPGlobal Warming Potentials
HHIHerfindahl–Hirschman Index
IEAInternational Energy Agency
IGCCIntegrated Gasification Combined Cycle
IPCCIntergovernmental Panel on Climate Change
LNGLiquefied Natural Gas
MT/MWh Megatons/Megawatt Hour
NDCNationally Determined Contributions
O and MOperation and Maintenance
PLFPlant Load Factor
ppm CO2eParts per million CO2 equivalent
SCGTSimple Cycle Gas Turbine
SHRStation Heat Rate
SWIShannon–Weiner index
SWNShannon–Wiener–Neumann index
TWhTerawatt-hour
UNDPUnited Nations Development Programme
WEOWorld Energy Outlook

References

  1. UNFCCC. Aggregate Effect of the Intended Nationally Determined Contributions: An Update. 2016. Available online: http://unfccc.int/resource/docs/2016/cop22/eng/02.pdf (accessed on 10 June 2017).
  2. Masson-Delmotte, V.P.; Zhai, H.-O.; Pörtner, D.; Roberts, J.; Skea, P.R.; Shukla, A.; Pirani, W.; Moufouma-Okia, C.; Péan, R.; Pidcock, S.; et al. (Eds.) IPCC: Global Warming of 1.5 °C. In An IPCC Special Report on the Impacts of Global Warming of 1.5 °C above Pre-Industrial Levels and Related Global Greenhouse Gas Emission Pathways, in the Context of Strengthening the Global Response to the Threat of Climate Change, Sustainable Development, and Efforts to Eradicate Poverty; 2018; (In press). Available online: https://www.ipcc.ch/site/assets/uploads/sites/2/2019/05/SR15_SPM_version_report_LR.pdf (accessed on 3 May 2021).
  3. IPCC. Climate Change 2014: Mitigation of Climate Change. Contribution of Working Group III to the Fifth Assessment Report of the Intergovernmental Panel on Climate Change; Edenhofer, O.R., Pichs-Madruga, Y., Sokona, E., Farahani, S., Kadner, K., Seyboth, A., Adler, I., Baum, S., Brunner, P., Eickemeier, B., et al., Eds.; Cambridge University Press: Cambridge, UK, 2014. [Google Scholar]
  4. Das, N.; Roy, J. India can increase its mitigation ambition: An analysis based on historical evidence of decoupling between emission and economic growth. Energy Sustain. Dev. 2020, 57, 189–199. [Google Scholar] [CrossRef]
  5. Press Information Bureau, Government of India Website. Promote New & Renewable Energy to Ensure Energy Security, to Protect Climate & to Reduce Pollution. Available online: http://pib.nic.in/newsite/PrintRelease.aspx?relid=189632 (accessed on 3 May 2021).
  6. Government of India. Intended Nationally Determined Contributions. New Delhi. 2015. Available online: https://www4.unfccc.int/sites/ndcstaging/PublishedDocuments/India%20First/INDIA%20INDC%20TO%20UNFCCC.pdf (accessed on 25 May 2021).
  7. Government of India. India Energy Security Scenario 2047; Niti Aayog, Government of India: New Delhi, India, 2016.
  8. Viebahn, P.; Vallentin, D.; Höller, S. Prospects of carbon capture and storage (CCS) in India’s power sector—An integrated assessment. Appl. Energy 2014, 117, 62–75. [Google Scholar] [CrossRef] [Green Version]
  9. Kapila, R.V.; Chalmers, H.; Haszeldinea, S. CCS prospects in India: Results from an expert stakeholder survey. Energy Procedia 2011, 4, 6280–6287. [Google Scholar] [CrossRef] [Green Version]
  10. Parikh, J. Analysis of Carbon Capture and Storage (CCS) Technology in the Context of Indian Power Sector. 2010. Available online: https://www.irade.org/website%20documents/CCS_IRAde_DST.pdf (accessed on 21 November 2017).
  11. Akash, A.R.; Rao, A.B.; Chandel, M.K. Prospects of implementing CO2 capture and sequestration (CCS) in the proposed supercritical coal power plants in India. Energy Procedia 2016, 90, 604–612. [Google Scholar] [CrossRef]
  12. Busch, C.; Gimon, E. Natural Gas versus Coal: Is Natural Gas Better for the Climate? Electr. J. 2014, 27, 97–111. [Google Scholar] [CrossRef]
  13. Safari, A.; Das, N.; Langhelle, O.; Roy, J.; Assadi, M. Natural gas: A transition fuel for sustainable energy system. Energy Sci. Eng. 2019, 7, 1075–1094. [Google Scholar] [CrossRef]
  14. Brown, S.P.; Huntington, H.G. Energy security and climate change protection: Complementarity or trade-off? Energy Policy 2008, 36, 3510–3513. [Google Scholar] [CrossRef]
  15. Chu, S.; Cui, Y.; Liu, N. The path towards sustainable energy. Nat. Mater. 2016, 16, 16–22. [Google Scholar] [CrossRef] [PubMed]
  16. Abdul Latif, S.N.; Chiong, M.S.; Rajoo, S.; Takada, A.; Chun, Y.-Y.; Tahara, K.; Ikegami, Y. The Trend and Status of Energy Resources and Greenhouse Gas Emissions in the Malaysia Power Generation Mix. Energies 2021, 14, 2200. [Google Scholar] [CrossRef]
  17. Zimon, G.; Zimon, D. The Impact of Purchasing Group on the Profitability of Companies Operating in the Renewable Energy Sector—The Case of Poland. Energies 2020, 13, 6588. [Google Scholar] [CrossRef]
  18. IPCC. IPCC Guidelines for National Greenhouse Gas Inventories, Vol 2, Energy. By the Intergovernmental Panel on Climate Change. 2006. Available online: https://www.ipcc-nggip.iges.or.jp/public/2006gl/vol2.html (accessed on 18 November 2017).
  19. Government of India. Ministry of Coal. Provisional Coal Statistics 2014–2015. 2015. Available online: http://coal.nic.in/sites/default/files/2020-01/Provisional_Coal_Statistics_2014-15.pdf (accessed on 20 November 2017).
  20. Website of Government of India, Ministry of Power. National Electricity Plan. 2016. Available online: https://powermin.gov.in/en/content/national-electricity-plan-0 (accessed on 23 May 2021).
  21. Ministry of Petroleum & Natural Gas, Government of India. Hydrocarbon Vision 2025. New Delhi. 2000. Available online: http://petroleum.nic.in/sites/default/files/vision.pdf (accessed on 20 November 2017).
  22. Ministry of Petroleum & Natural Gas, Government of India, Petroleum and Natural Gas Statistics 2016–2017. New Delhi. 2017. Available online: http://www.indiaenvironmentportal.org.in/files/file/pngstat%202016-17.pdf (accessed on 21 November 2017).
  23. Petroleum & Natural Gas Regulatory Board, Vision 2030: Natural Gas Infrastructure in India. 2013. Available online: https://www.pngrb.gov.in/Hindi-Website/pdf/vision-NGPV-2030-06092013.pdf (accessed on 21 November 2017).
  24. Safari, A.; Das, N.; Jafari, S.; Langhelle, O.; Roy, J.; Assadi, M. Role of gas-fuelled solutions in support of future sustainable energy world: Part II: Case Studies. In Sustainable Energy Technology and Policies. Green Energy and Technology; De, S., Bandyopadhyay, S., Assadi, M., Mukherjee, D.A., Eds.; Springer: Singapore, 2018; pp. 35–86. ISBN 978-981-10-7188-1. [Google Scholar]
  25. Power Technology Home Page. Irsching Siemens Gas Turbine, Germany. Available online: https://www.power-technology.com/projects/irsching/ (accessed on 3 June 2021).
  26. Zhang, X.; Sugishita, H.; Ni, W.; Li, Z. Economics and performance forecast of gas turbine combined cycle. Tsinghua Sci. Technol. 2015, 110, 633–636. [Google Scholar] [CrossRef]
  27. Colpier, U.C.; Cornland, D. The economics of the combined cycle gas turbine—an experience curve analysis. Energy Policy 2002, 30, 309–316. [Google Scholar] [CrossRef]
  28. Sims, R.E.; Rogner, H.-H.; Gregory, K. Carbon emission and mitigation cost comparisons between fossil fuel, nuclear and renewable energy resources for electricity generation. Energy Policy 2003, 31, 1315–1326. [Google Scholar] [CrossRef]
  29. Jeong, S.-J.; Kim, K.-S.; Park, J.-W.; Lim, D.-S.; Lee, S.-M. Economic comparison between coal-fired and liquefied natural gas combined cycle power plants considering carbon tax: Korean case. Energy 2008, 33, 1320–1330. [Google Scholar] [CrossRef]
  30. IEA. World Energy Outlook; International Energy Agency: Paris, France, 2017. [Google Scholar]
  31. IEA. World Energy Outlook; International Energy Agency: Paris, France, 2018. [Google Scholar]
  32. IEA. India Energy Outlook; International Energy Agency: Paris, France, 2015. [Google Scholar]
  33. Website of Government of India, Ministry of Power. Growth of Electricity Sector in India from 1947–2017. 2017. Available online: https://cea.nic.in/wp-content/uploads/pdm/2020/12/growth_2020.pdf (accessed on 20 November 2017).
  34. Das, N.; Roy, J. Making Indian Power Sector Low Carbon: Opportunities and Policy Challenges. In Sustainable Energy and Transportation; Gautam, A., De, S., Dhar, A., Gupta, J.G., Pandey, A., Eds.; Springer: Singapore, 2018; pp. 163–183. ISBN 978-981-10-7508-7. [Google Scholar]
  35. Ministry of New and Renewable Energy, Government of India. Year-End Review 2017—MNRE. Available online: http://pib.nic.in/PressReleaseIframePage.aspx?PRID=1514215 (accessed on 23 May 2021).
  36. Central Electricity Authority, Ministry of Power, Government of India, Annual Report 2014–2015. 2015. Available online: https://vol11.cases.som.yale.edu/sites/default/files/cases/mera_gao_power/annual_report-2015.pdf (accessed on 20 November 2017).
  37. Ministry of Power, Government of India. Ultra Mega Power Projects. 2015. Available online: https://powermin.nic.in/sites/default/files/uploads/ultra_mega_power_project.pdf (accessed on 24 February 2021).
  38. Planning Commission of India. Twelfth Five Year Plan; Planning Commission of India: New Delhi, India, 2012.
  39. International Institute for Applied Systems Analysis (IIASA). Global Energy Assessment; Cambridge University Press: Cambridge, UK, 2012. [Google Scholar]
  40. Chuang, M.C.; Ma, H.W. Energy security and improvements in the function of diversity indices—Taiwan energy supply structure case study. Renew. Sustain. Energy Rev. 2013, 24, 9–20. [Google Scholar] [CrossRef]
  41. Bhattacharya, S.C. Energy Security Issues in Energy Economics; Springer: Berlin/Heidelberg, Germany, 2011; pp. 463–484. ISBN 978-0-85729-268-1. [Google Scholar]
  42. Kruyt, B.; Vuuren, D.P.V.; Vries, H.J.M.; Groenenberg, H. Indicators for energy security. Energy Policy 2009, 37, 2166–2181. [Google Scholar] [CrossRef]
  43. United Nations Development Programme. World Population Prospects: The 2017 Revision; United Nations: New York, NY, USA, 2017. [Google Scholar]
  44. Ministry of Statistics and Programme Implementation, Government of India. Energy Statistics 2016. Available online: http://www.mospi.nic.in/publication/energy-statistics-2016 (accessed on 21 November 2017).
  45. Indian Bureau of Mines; Ministry of Mines; Government of India. Indian Minerals Yearbook; Indian Bureau of Mines: New Delhi, India, 2015.
  46. World Bank Home Page. Available online: https://databank.worldbank.org/reports.aspx?source=worldwide-governance-indicators (accessed on 23 May 2021).
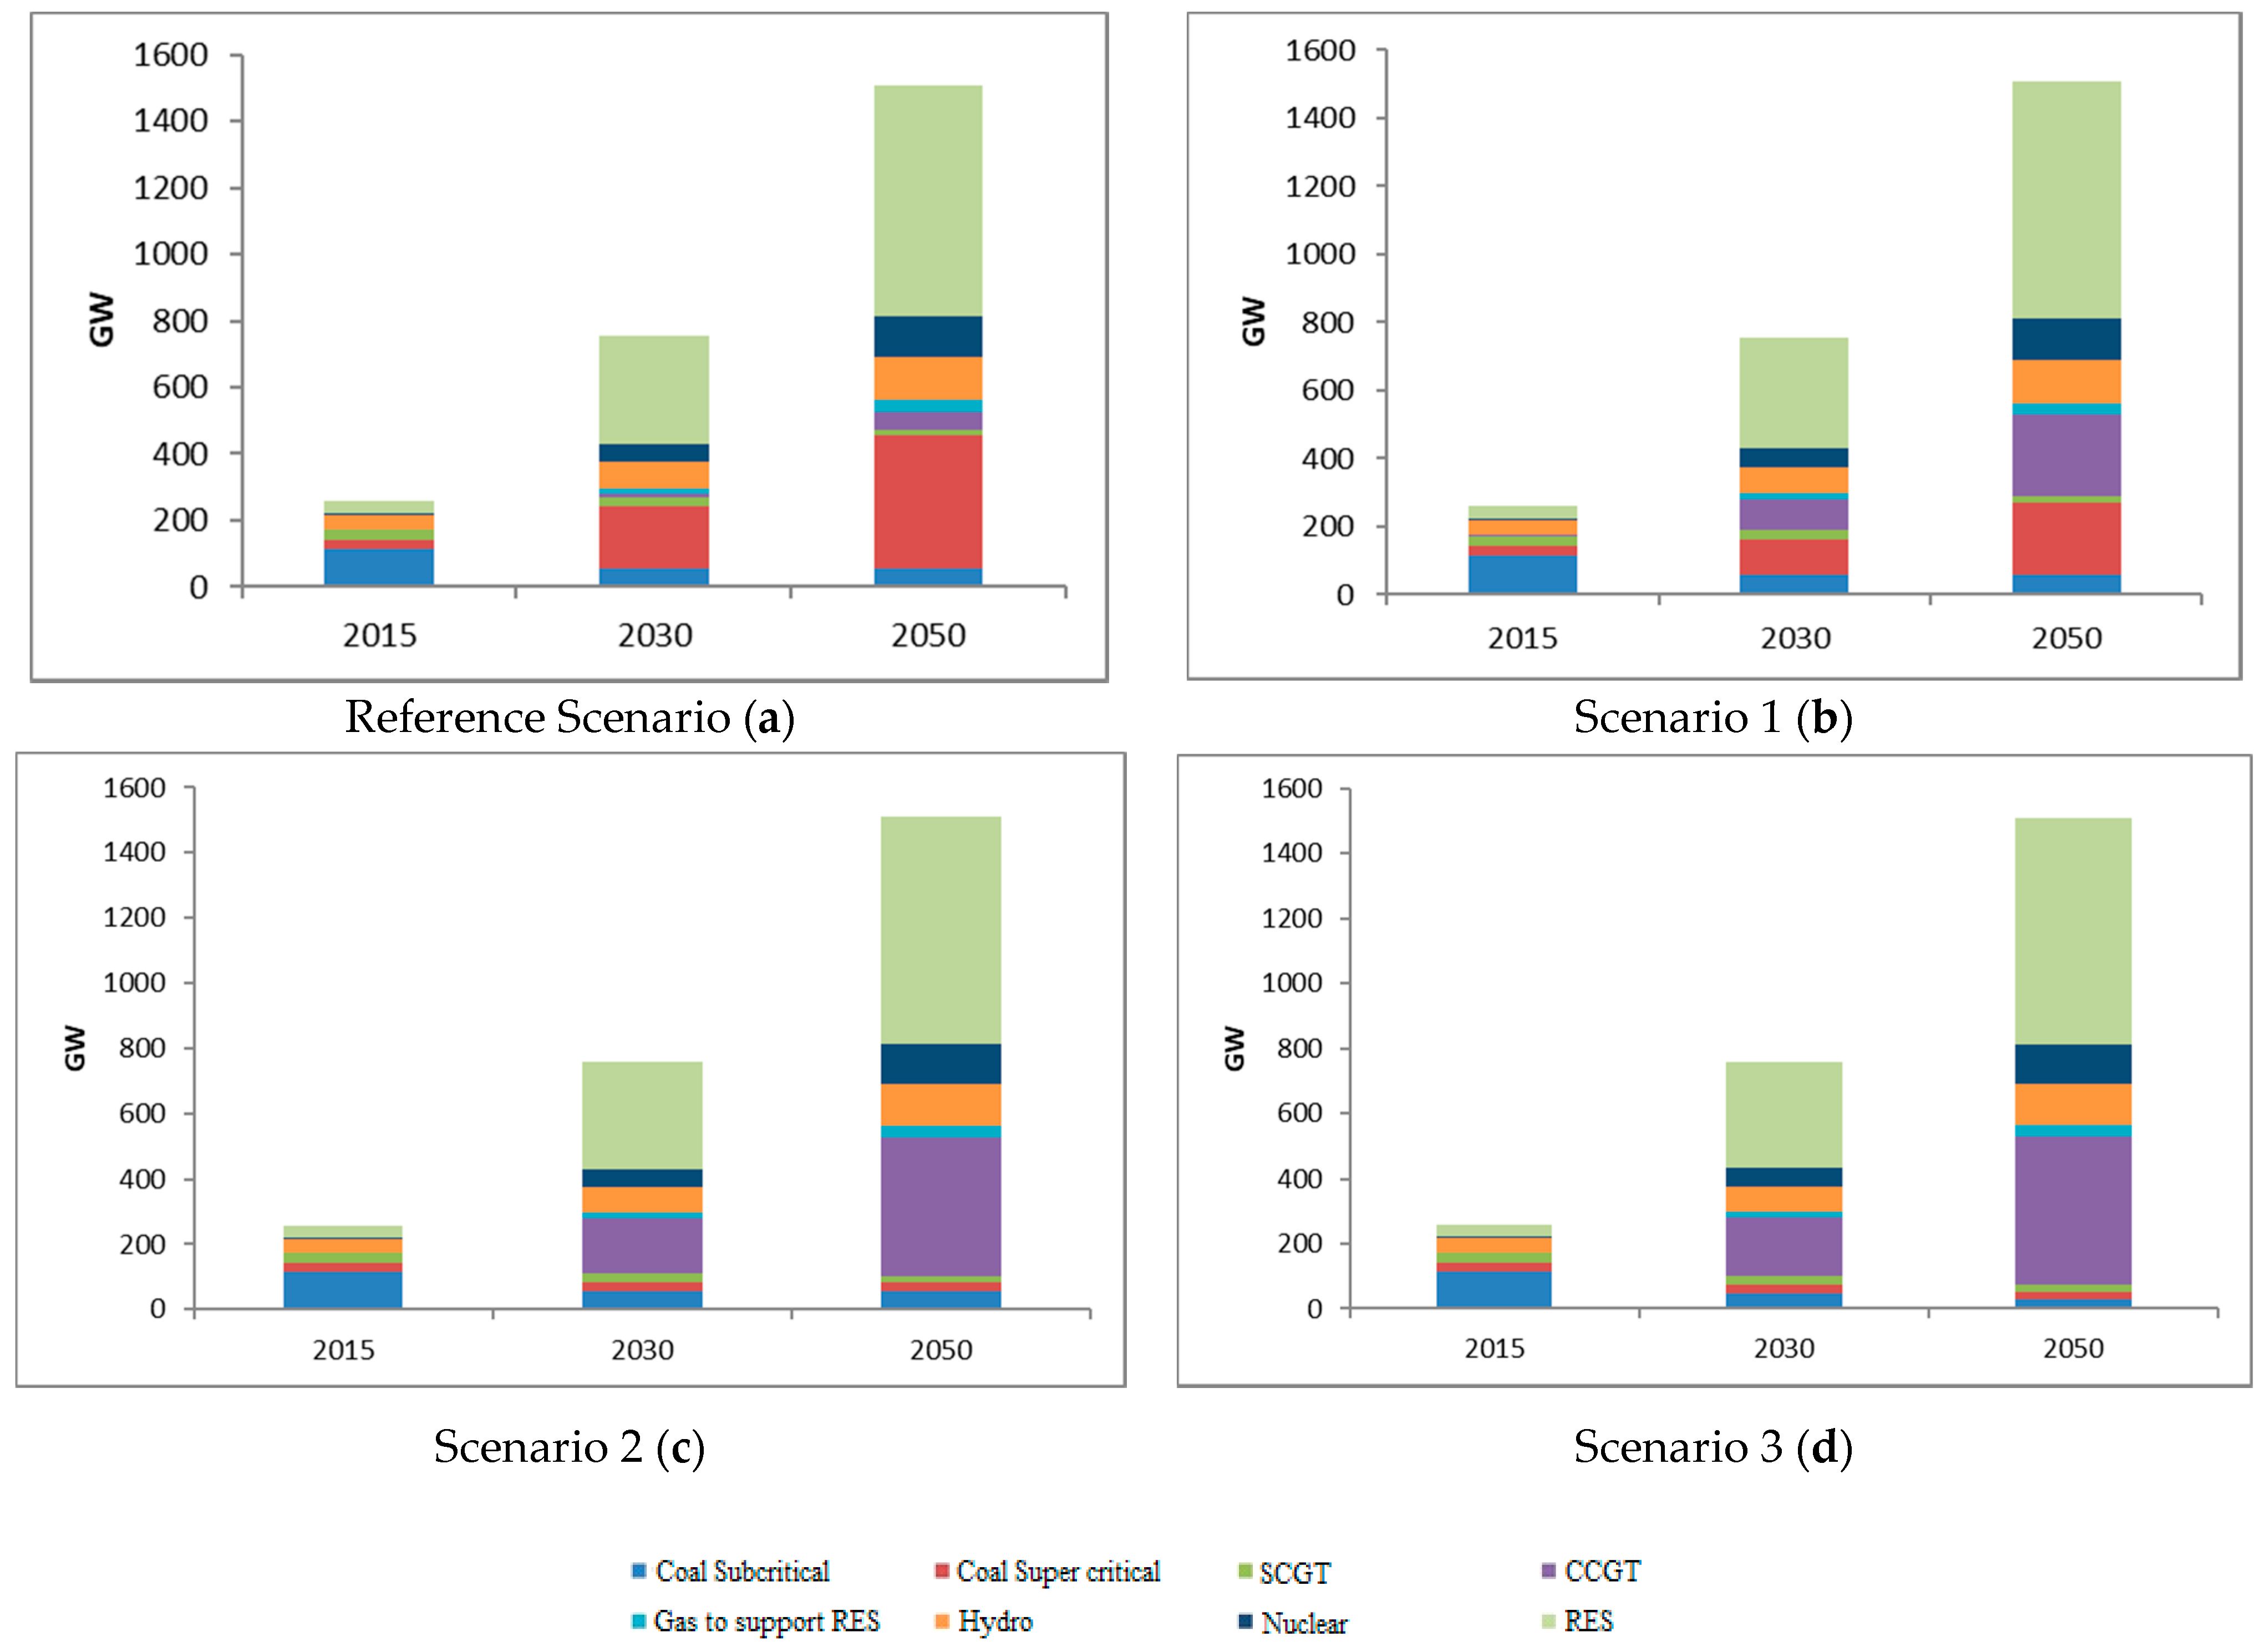
Figure 1. The installed capacity by technologies and fuels under different scenarios.
Energies 14 03787 g001
Figure 2. Total emissions under different scenarios.
Energies 14 03787 g002
Figure 3. Emissions per unit of generation under different scenarios.
Energies 14 03787 g003
Figure 4. Per capita emissions under different scenarios.
Energies 14 03787 g004
Figure 5. Requirements for coal and natural gas under different scenarios.
Energies 14 03787 g005
Figure 6. India’s natural gas imports through LNG under the New Policies Scenario of India Energy Outlook, 2015; Figure prepared based on partial data extracted from Fig. 3.14 of India Energy Outlook, 2015 [32].
Energies 14 03787 g006
Table 3. Assumptions behind the scenarios designed.
ScenarioCoalGasNon-Fossil
Reference ScenarioSubcritical coal capacity will gradually decline up to 2030, starting from 2020.
Capacity addition to coal-based power generation will be only through supercritical technology.
The existing capacity of SCGT will remain unchanged up to 2025 and continue to decline at a 10% rate every five years after that.
New capacity addition to natural gas will be mainly in CCGT based power generation at a 10% rate every five years.
SCGT capacity of 5% of total renewable capacity to support grid balance.
Following the current trend of capacity addition to hydro, 12 GW capacity will be added to large hydro every five years.
The total installed capacity of solar is estimated to be approximately 480 GW by 2050.
Scenario 1In total, 50% of the additions to fossil fuel-based capacity will be through coal-based supercritical plants, and the rest will be through natural gas-based CCGT.The same as the Reference Scenario.
Scenario 2No coal-based supercritical capacity additions will take place after 2015, and it remains constant at 26 GWCapacity addition to supercritical power generation under the reference scenario will now be shifted to CCGT.The same as the Reference Scenario.
Scenario 3Existing coal-based subcritical capacity will gradually but partially be replaced by CCGT in a phased manner.The same as the Reference Scenario.
Table 4. Emission factors and global warming potentials (GWP).
Emission Factor and GWPCO2CH4N2OSource
Emission factor of Coal (kg/TJ)95,8101.001.50[18]
Emission factor of Natural Gas (kg/TJ)56,1001.001.00[18]
Emission factor Biomass (kg/TJ)112,000304[18]
Global Warming Potential of 100 years134298[3]
Table 5. India’s Energy Security Indicators with respect to the importation of natural gas (2013–14).
Continents/Sub-continentsMarket Share (xi)xi^2xi × Negln (xi)Political Stability = biShare of Domestic Production = gibi × xi Neg ln(xi)(1 + gi)
Middle East and Caspian0.890.790.103.10.670.55
Asia0.040.000.142.70.670.62
Africa0.060.000.172.40.670.68
Europe0.000.000.033.60.670.16
Total HHI = 0.80SWI = 0.44 SWN = 2.01
Data source of import quantity: [46], for political stability: Worldwide Governance Indicators, World Bank [46]. Since many of the cases in the political stability index reported by the World Bank are non-positive, each value is added to 3 to convert them to positive.
Table 6. India’s Energy Security Indicators with respect to the importation of natural gas (2030 projection).
Continents/Sub-ContinentsMarket Share (xi)xi^2xi × Neg(ln (xi))Political Stability = biShare of Domestic Production = gibi × xi Neg ln(xi)(1 + gi)
Middle East and Caspian0.250.060.353.10.461.59
USA0.080.010.203.60.461.06
Russia0.100.010.232.10.460.69
Africa0.200.040.322.70.461.27
Latin America0.070.000.193.00.460.80
Australia0.250.060.354.00.462.04
Europe0.050.000.153.50.460.76
Total HHI = 0.19SWI = 1.78 SWN = 8.21
Publisher’s Note: MDPI stays neutral with regard to jurisdictional claims in published maps and institutional affiliations.

