
Life Cycle Assessment as a Major Support Tool within Multi-Criteria Design Process of Single Dwellings Located in Poland


Abstract
:1. Introduction
2. Materials and Methods
- Calculation method for embodied carbon emission including other greenhouse gases (GWP).
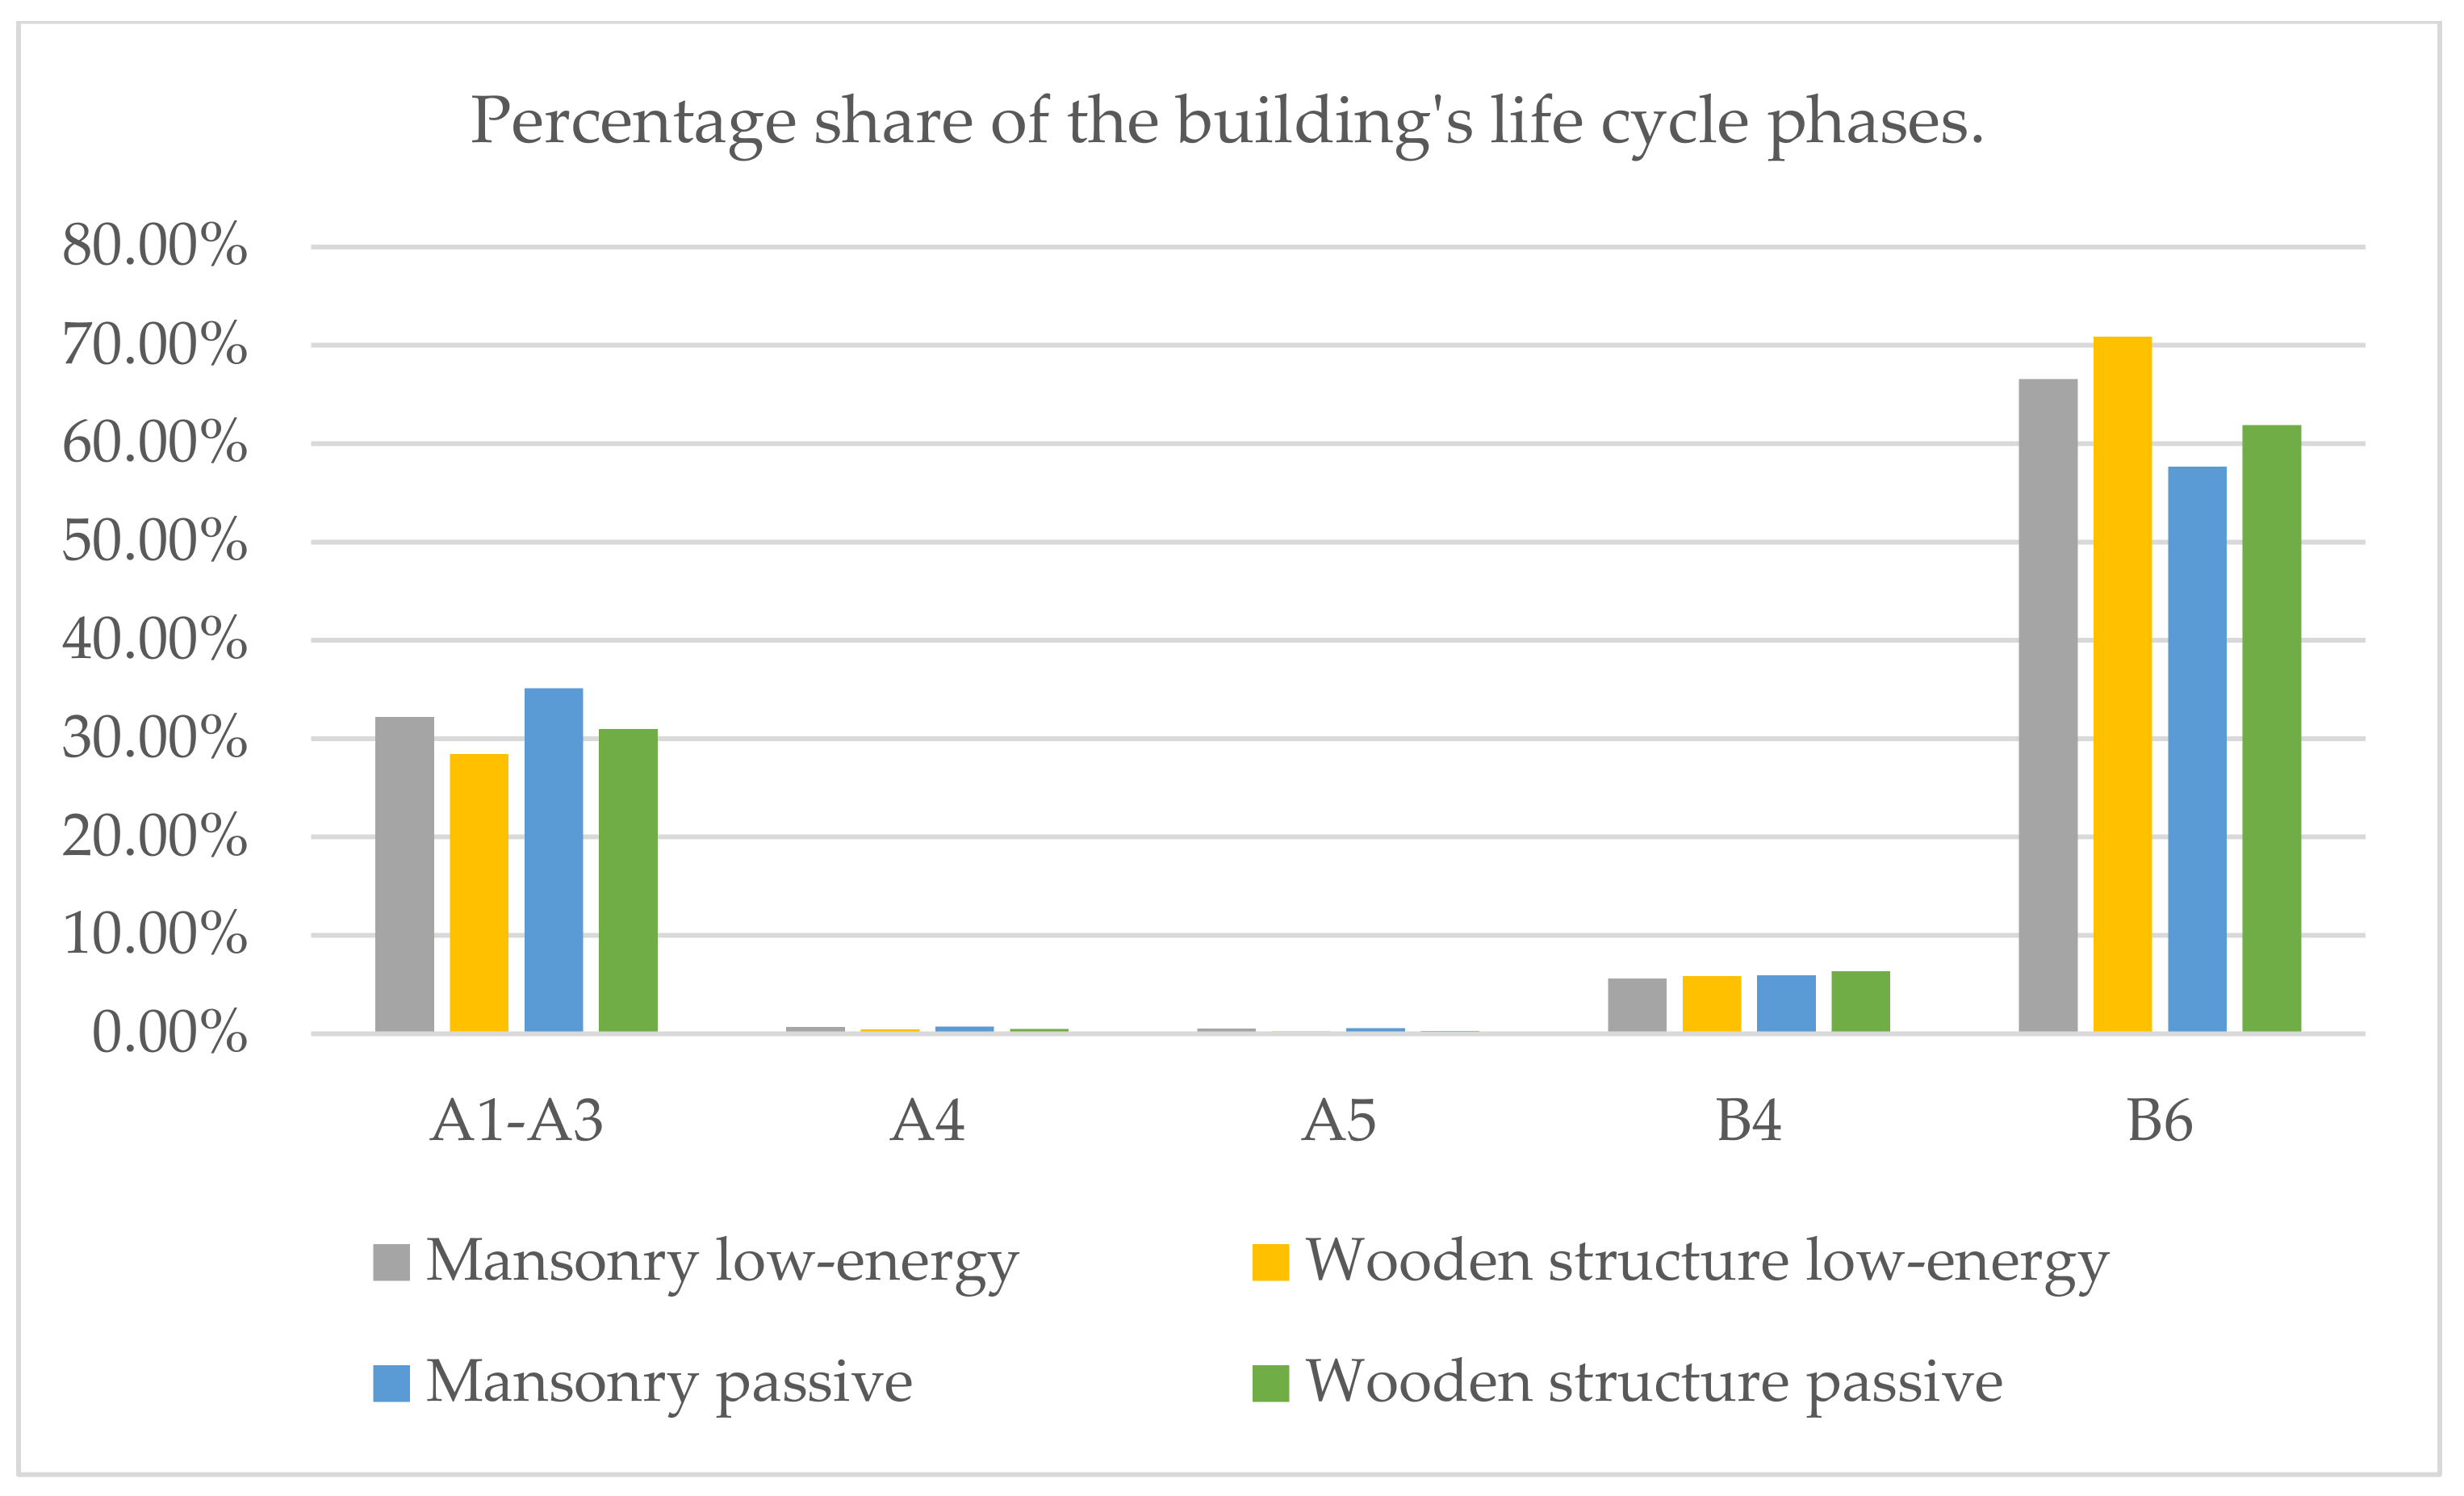
- The scope of the life cycle includes the cradle-to-gate stage (A1–A3) and the operational stage of a building whose life cycle is 20 years (B6). The scope of a cradle-to-gate analysis covers the main building components of the highest weight and volume share. LCA data (as per EN 15804) were used, and type III Environmental Product Declarations were mainly utilised as data sources.
- Analyses of the construction market in Poland were performed for single-family housing. Interviews were also conducted with 90 people. This analysis was to define popular solutions applied to single-family housing.
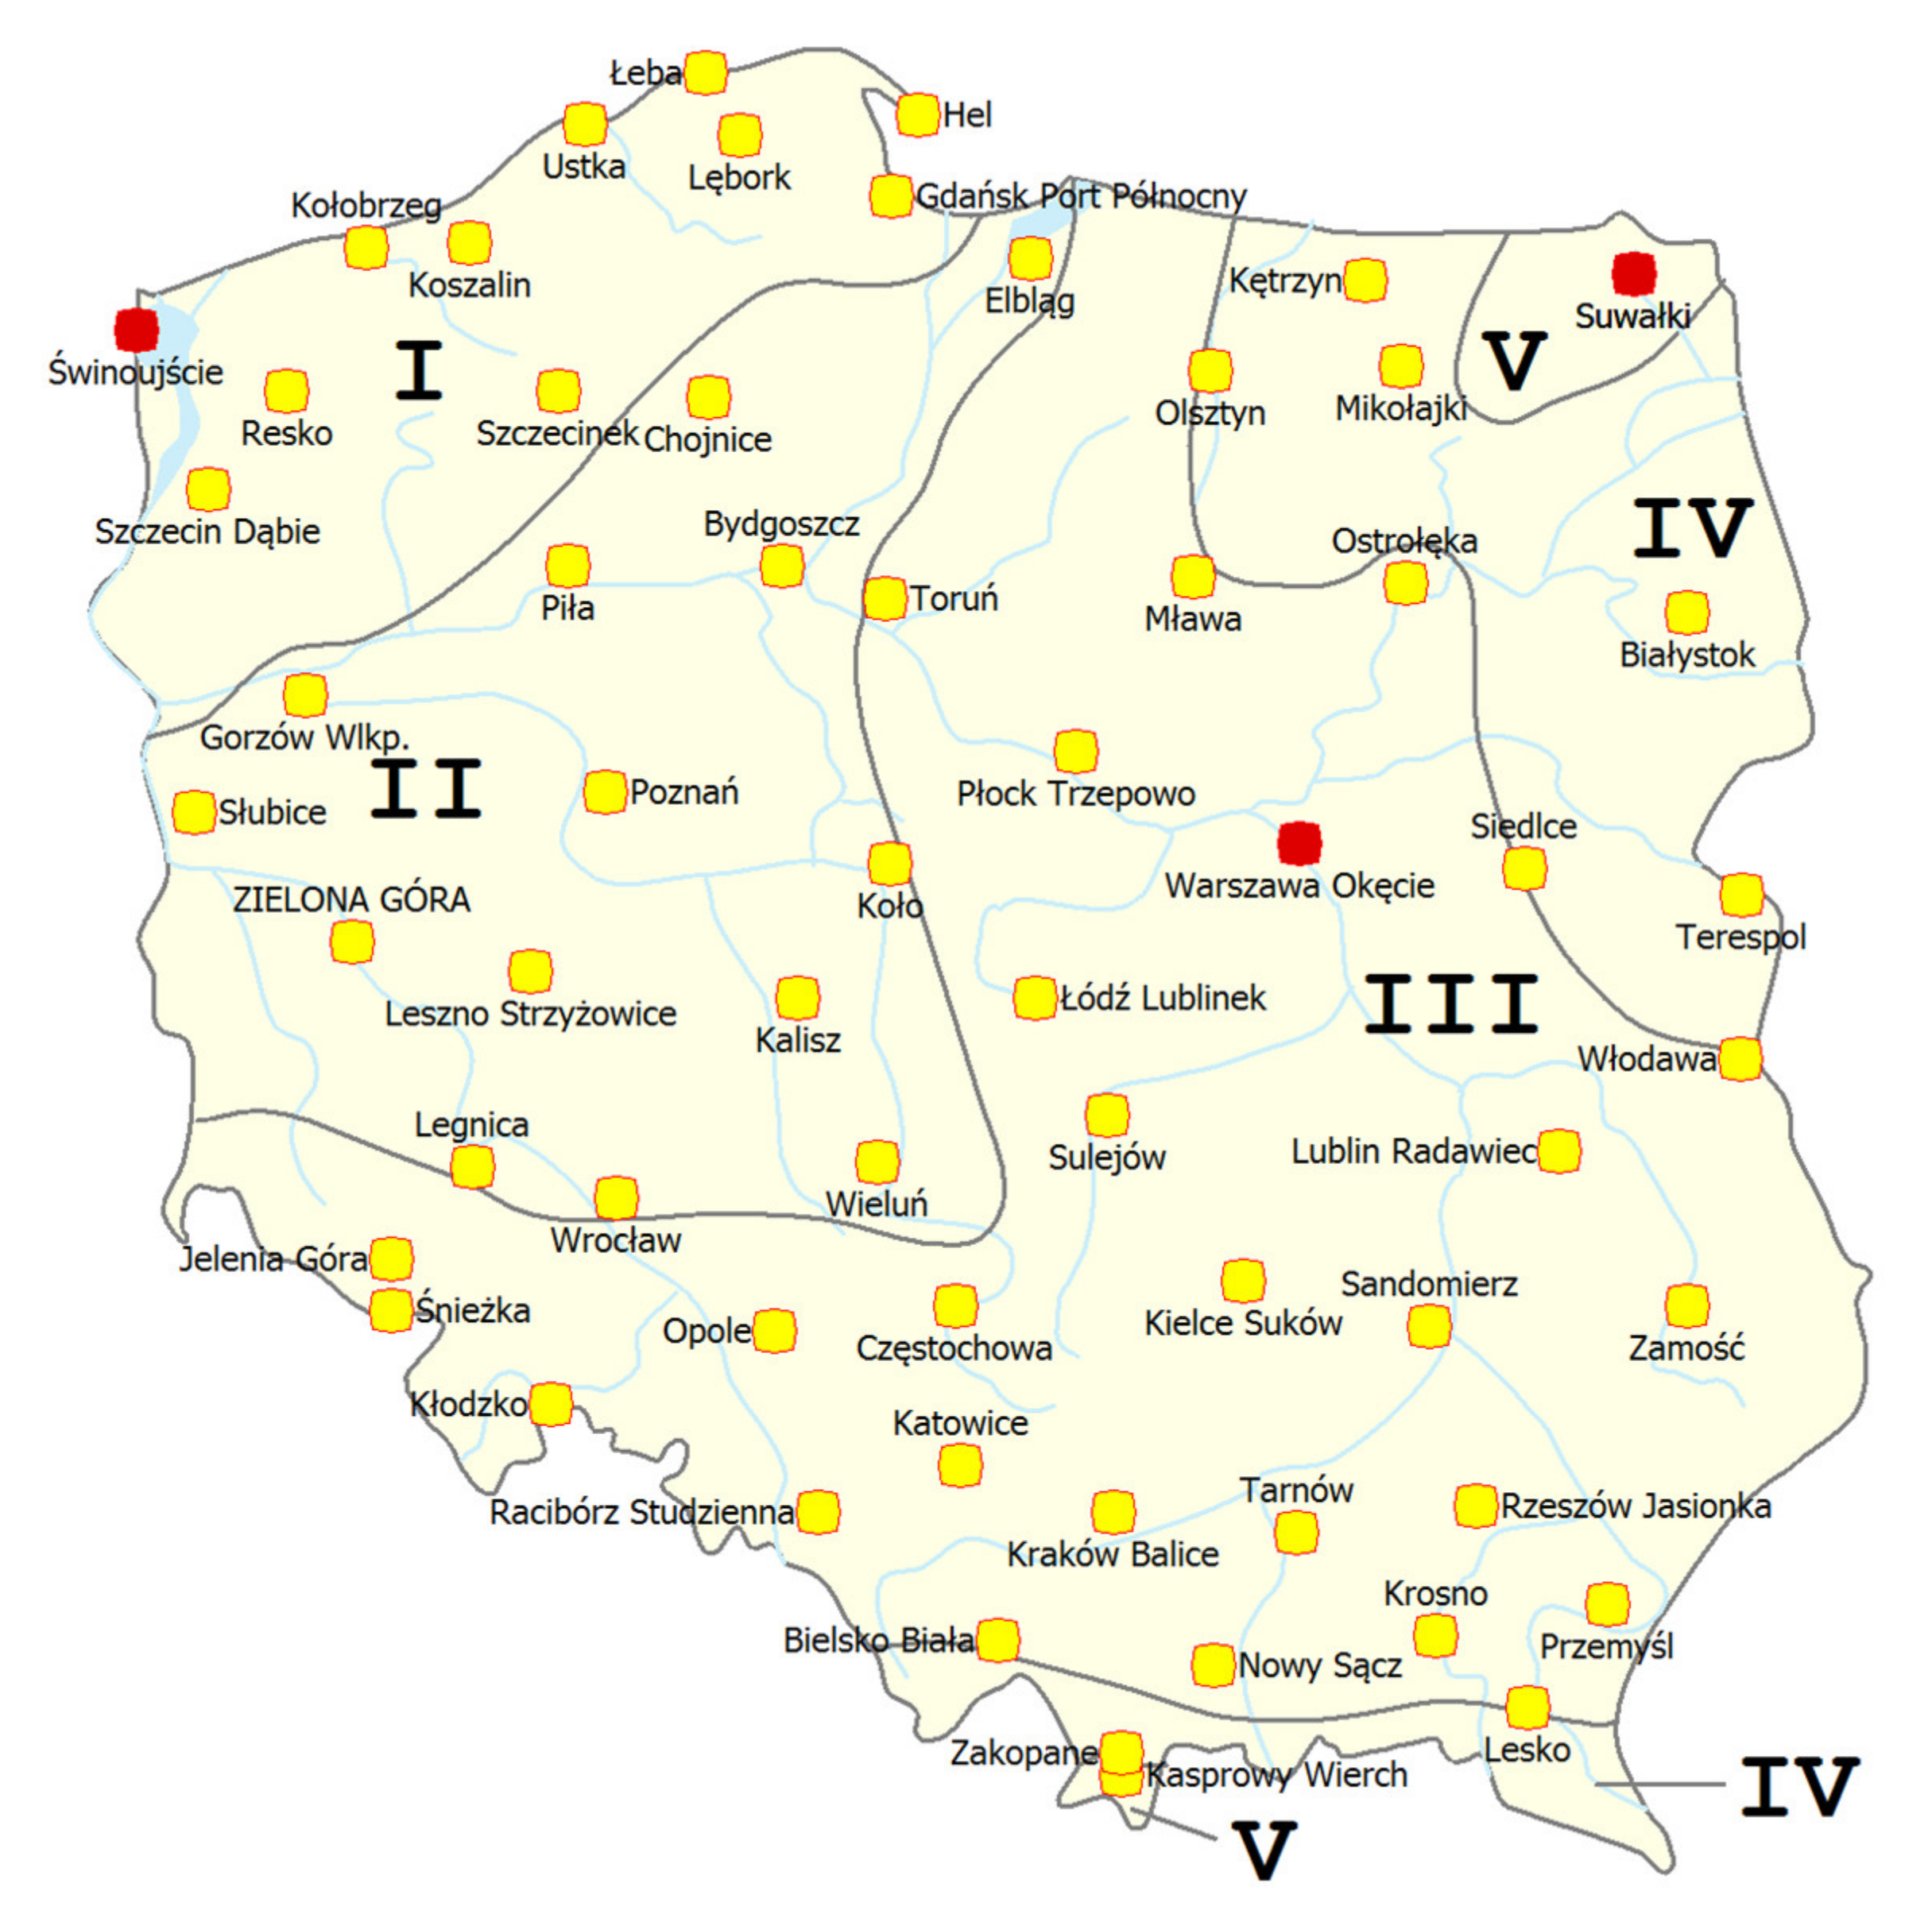
- The location of Warsaw was selected as the most representative place, as it is situated in the centre of the country, in climatic zone III, which covers the largest area of Poland. (Figure 1)
- A reference building design was developed according to previous market analyses. The design was made in line with the principles of designing energy-efficient buildings.
- An LCA database of construction products was created for further research. The database was regularly supplemented with information collected from other databases, type III EPDs, scientific articles and other publications. Details of the data acquisition are described in the sections: LCA Method and Database of Construction Products and Energy Carriers. The LCA database features records of initial embodied energy [MJ] and initial embodied carbon emissions [kg CO2e.].
- BIM-based models of individual buildings were made in ARCHICAD (Graphisoft SE). The buildings were based on the reference building design. Descriptions of respective models can be found in the Models of Buildings section.
- Calculations of energy performance were made in accordance with Polish requirements (monthly method) using Audytor OZC (Sankom Sp. z o.o.), whereas the building designs were adjusted to the requirements of the regulation on the maximum PEF (partial maximum value of the PEF for heating, ventilation and hot water PEH+W for a single-family dwelling was 95 [kWh/(m2 year)]) in force in Poland in 2020.
- The energy performance of buildings was calculated in the EcoDesigner Star application (dynamic hourly method).
- The dedicated Passive House Planning Package (PHPP) tool was used to verify compliance with the Passive House standard.
- Total embodied energy [MJ] and embodied carbon emissions [kg CO2e.] were calculated for the building. This stage consisted of calculations made for the construction products used in the building designs (main construction products, such as components of walls, roofs, ceilings, as well as windows, doors, basic installations, i.e., gas boiler and air handling unit) and for their stage of use based on the calculations from the previous stage.
- Final conclusions were drawn.
2.1. LCA Method
- A reliable source of information on individual materials and construction products at the cradle-to-gate stage—from the extraction of raw materials and product manufacturing;
- An assessment tool for the entire product (building), which can be used to optimise the reduction in adverse environmental impact.
- Specifying the analysis purpose and scope;
- Analysis of the set of inputs and outputs—LCI (life cycle inventory), e.g., input, such as raw materials and energy, and output, such as waste;
- Life cycle impact assessment—LCIA;
- Life cycle interpretation.
2.2. Database of Construction Products and Energy Carriers
- It includes only the product stage (A1–A3), which is called “Cradle-to-gate”;
- It includes the product stage (A1–A3) and several subsequent selected life cycle stages. Such an environmental product declaration is called “Cradle-to-gate with options”;
- It includes the full life cycle based on the full LCA, called “Cradle-to-grave”. Such an environmental product declaration covers the production, installation and use stages, including maintenance, demolition, recycling, recovery and disposal. It may also feature information module D.
- Acquisition (e.g., extraction) and processing of raw materials, as well as the production and processing of biomass (A1);
- Reuse and recycle of products or materials from the previous system, without processes from the previous product system (A1);
- Generation of electricity and heat, including their acquisition, processing and transport (A1);
- Energy recovery and fuel recovery processes, without processes from the previous product system (A1);
- Transport to the plant boundaries (gate) and within the plant (A2);
- Production of semi-finished products and auxiliary materials (A3);
- Manufacturing of construction products (A3);
- Manufacturing of packaging (A3);
- Processing or disposal of final waste (A3).
- Total consumption of renewable and non-renewable primary energy resources (embodied energy) expressed in MJ/kg of product;
- Global warming potential (embodied carbon emission) expressed in kg CO2e/kg of product.
2.3. Energy Carriers
2.4. Climate and Weather Data
- Zone I (Koszalin/Kołobrzeg);
- Zone II (Poznań/Piła);
- Zone III (Warsaw);
- Zone IV (Białystok/Mikołajki);
- Zone V_N (Suwałki/Mikołajki);
- Zone V_S (Zakopane).
2.5. Research Assumptions
2.5.1. General Assumptions
2.5.2. Design Rules for Energy-Efficient Buildings
- Favourable location of the building in relation to the cardinal directions, with the bedrooms and largest rooms on the south side;
- Reduction in glazing to a minimum on the north side;
- Air tightness less than 1.5 h−1 (as per the national requirements);
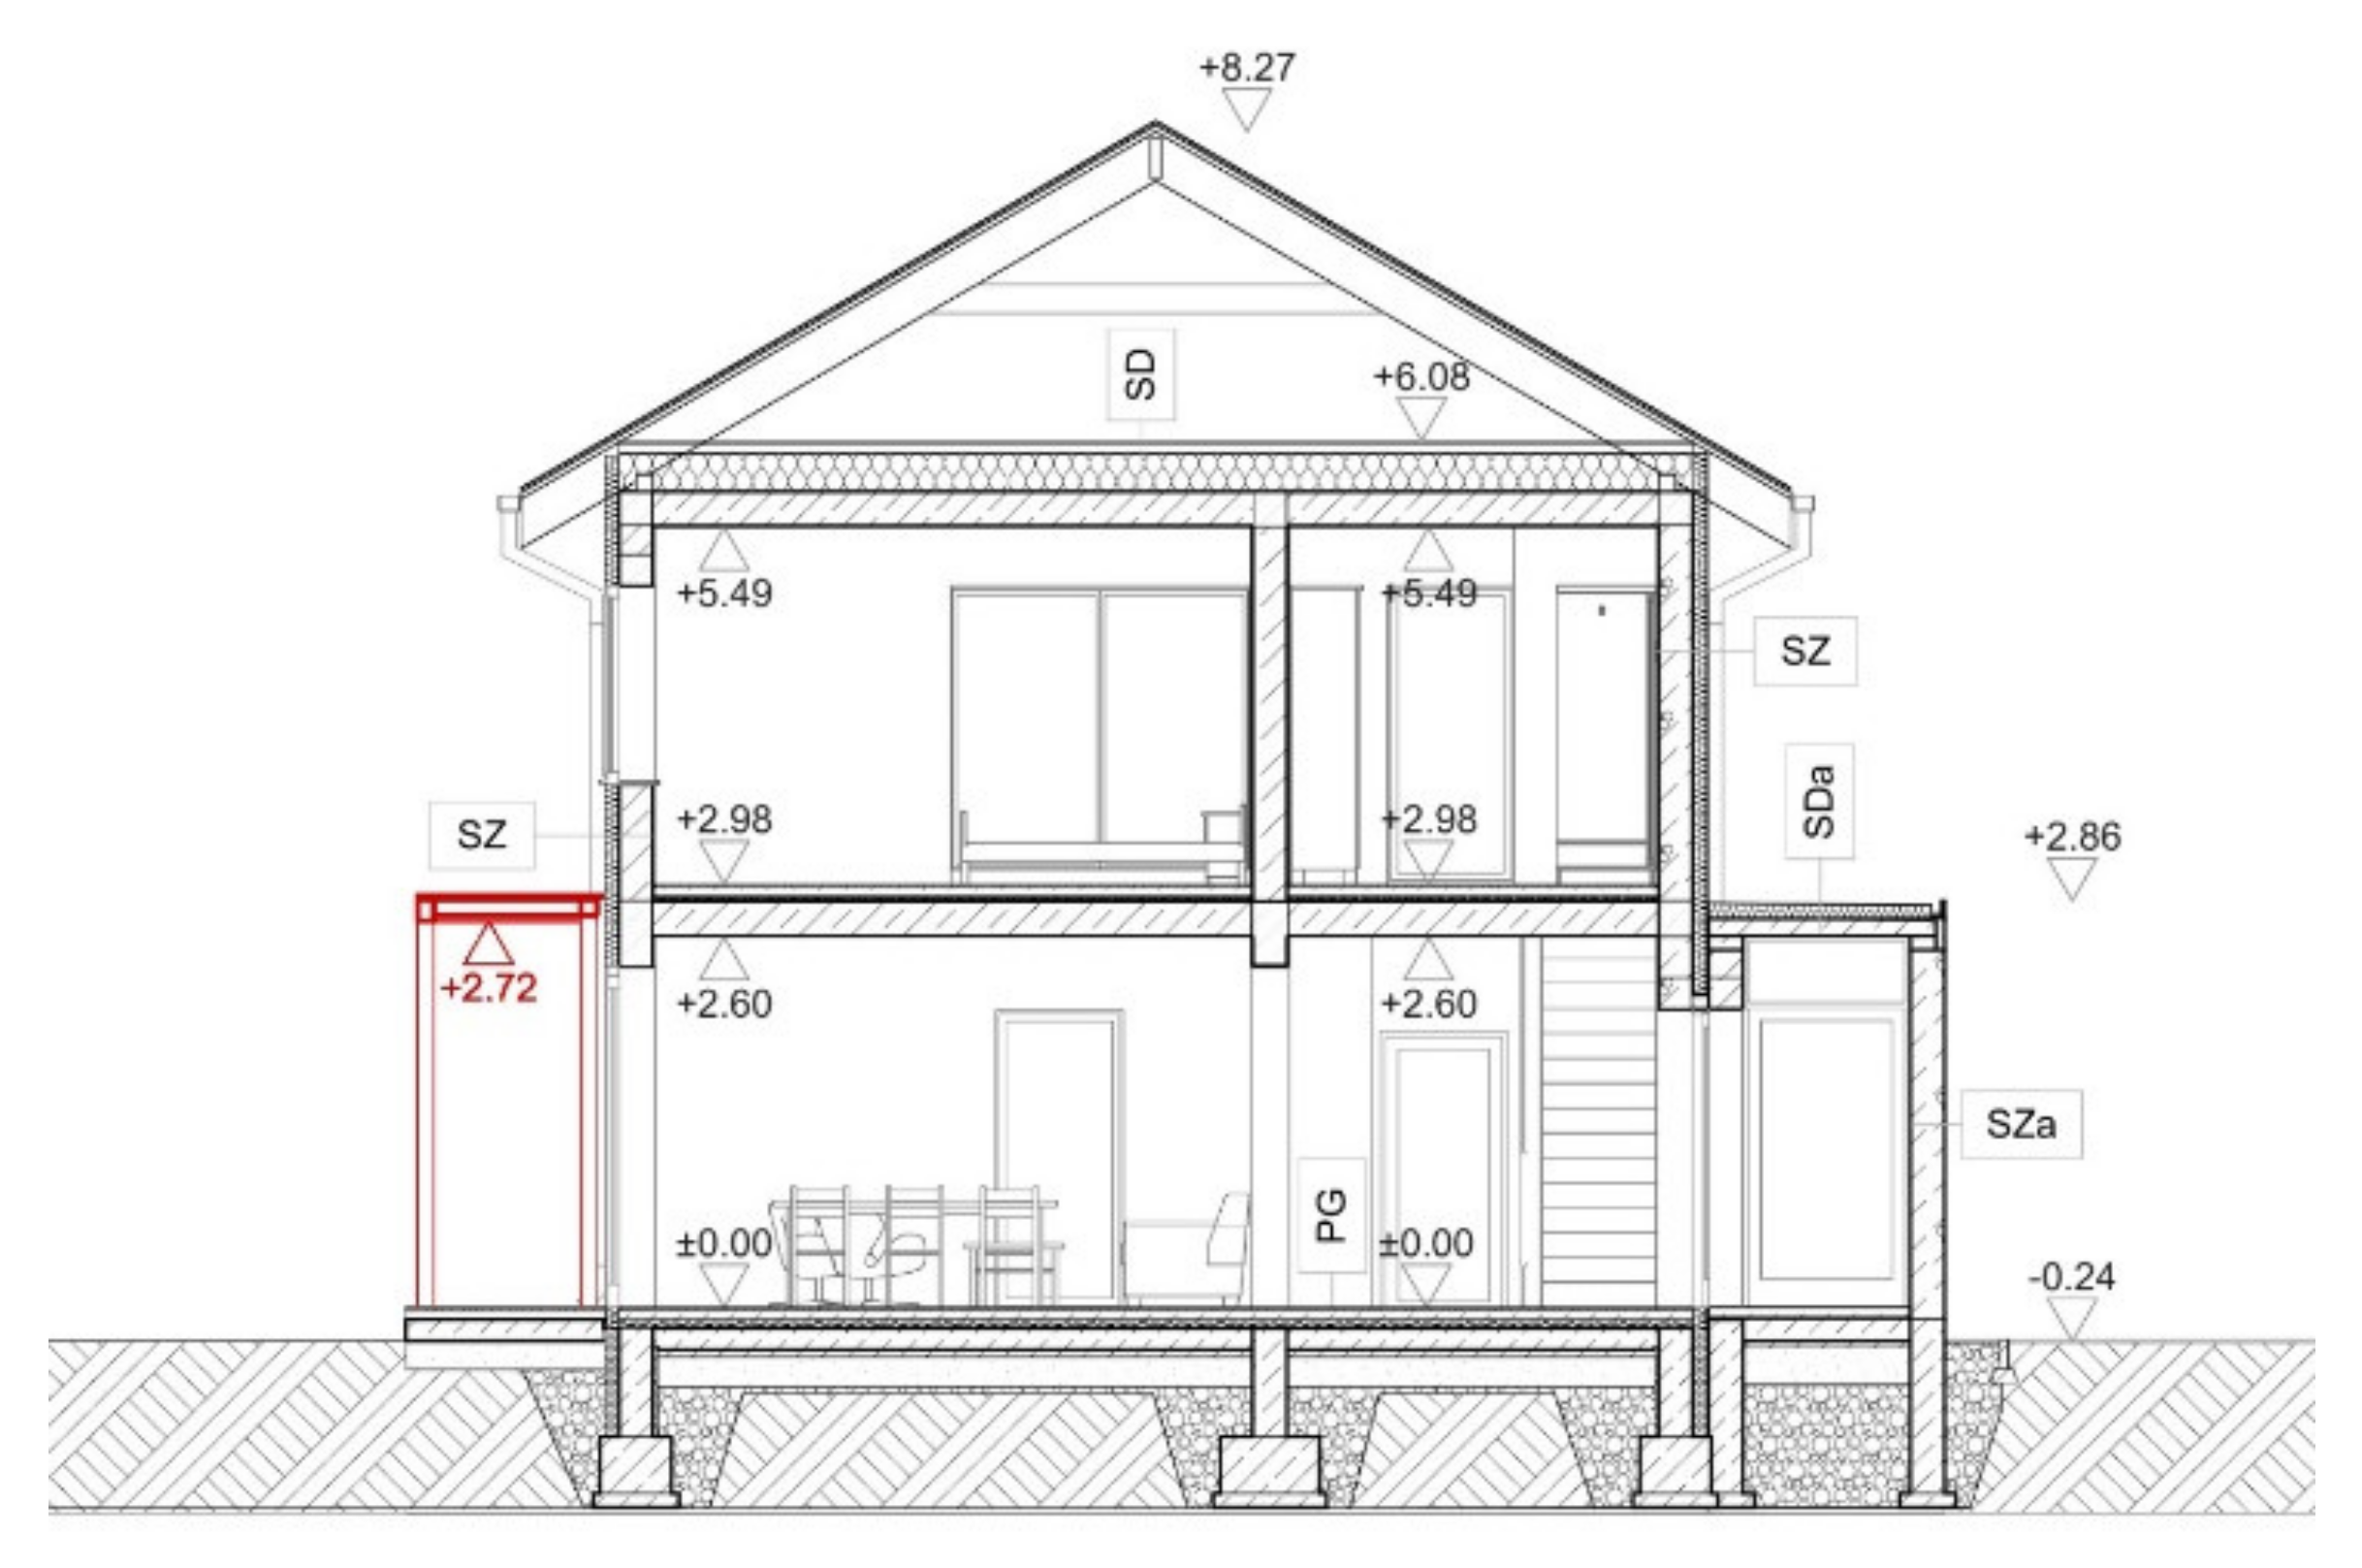
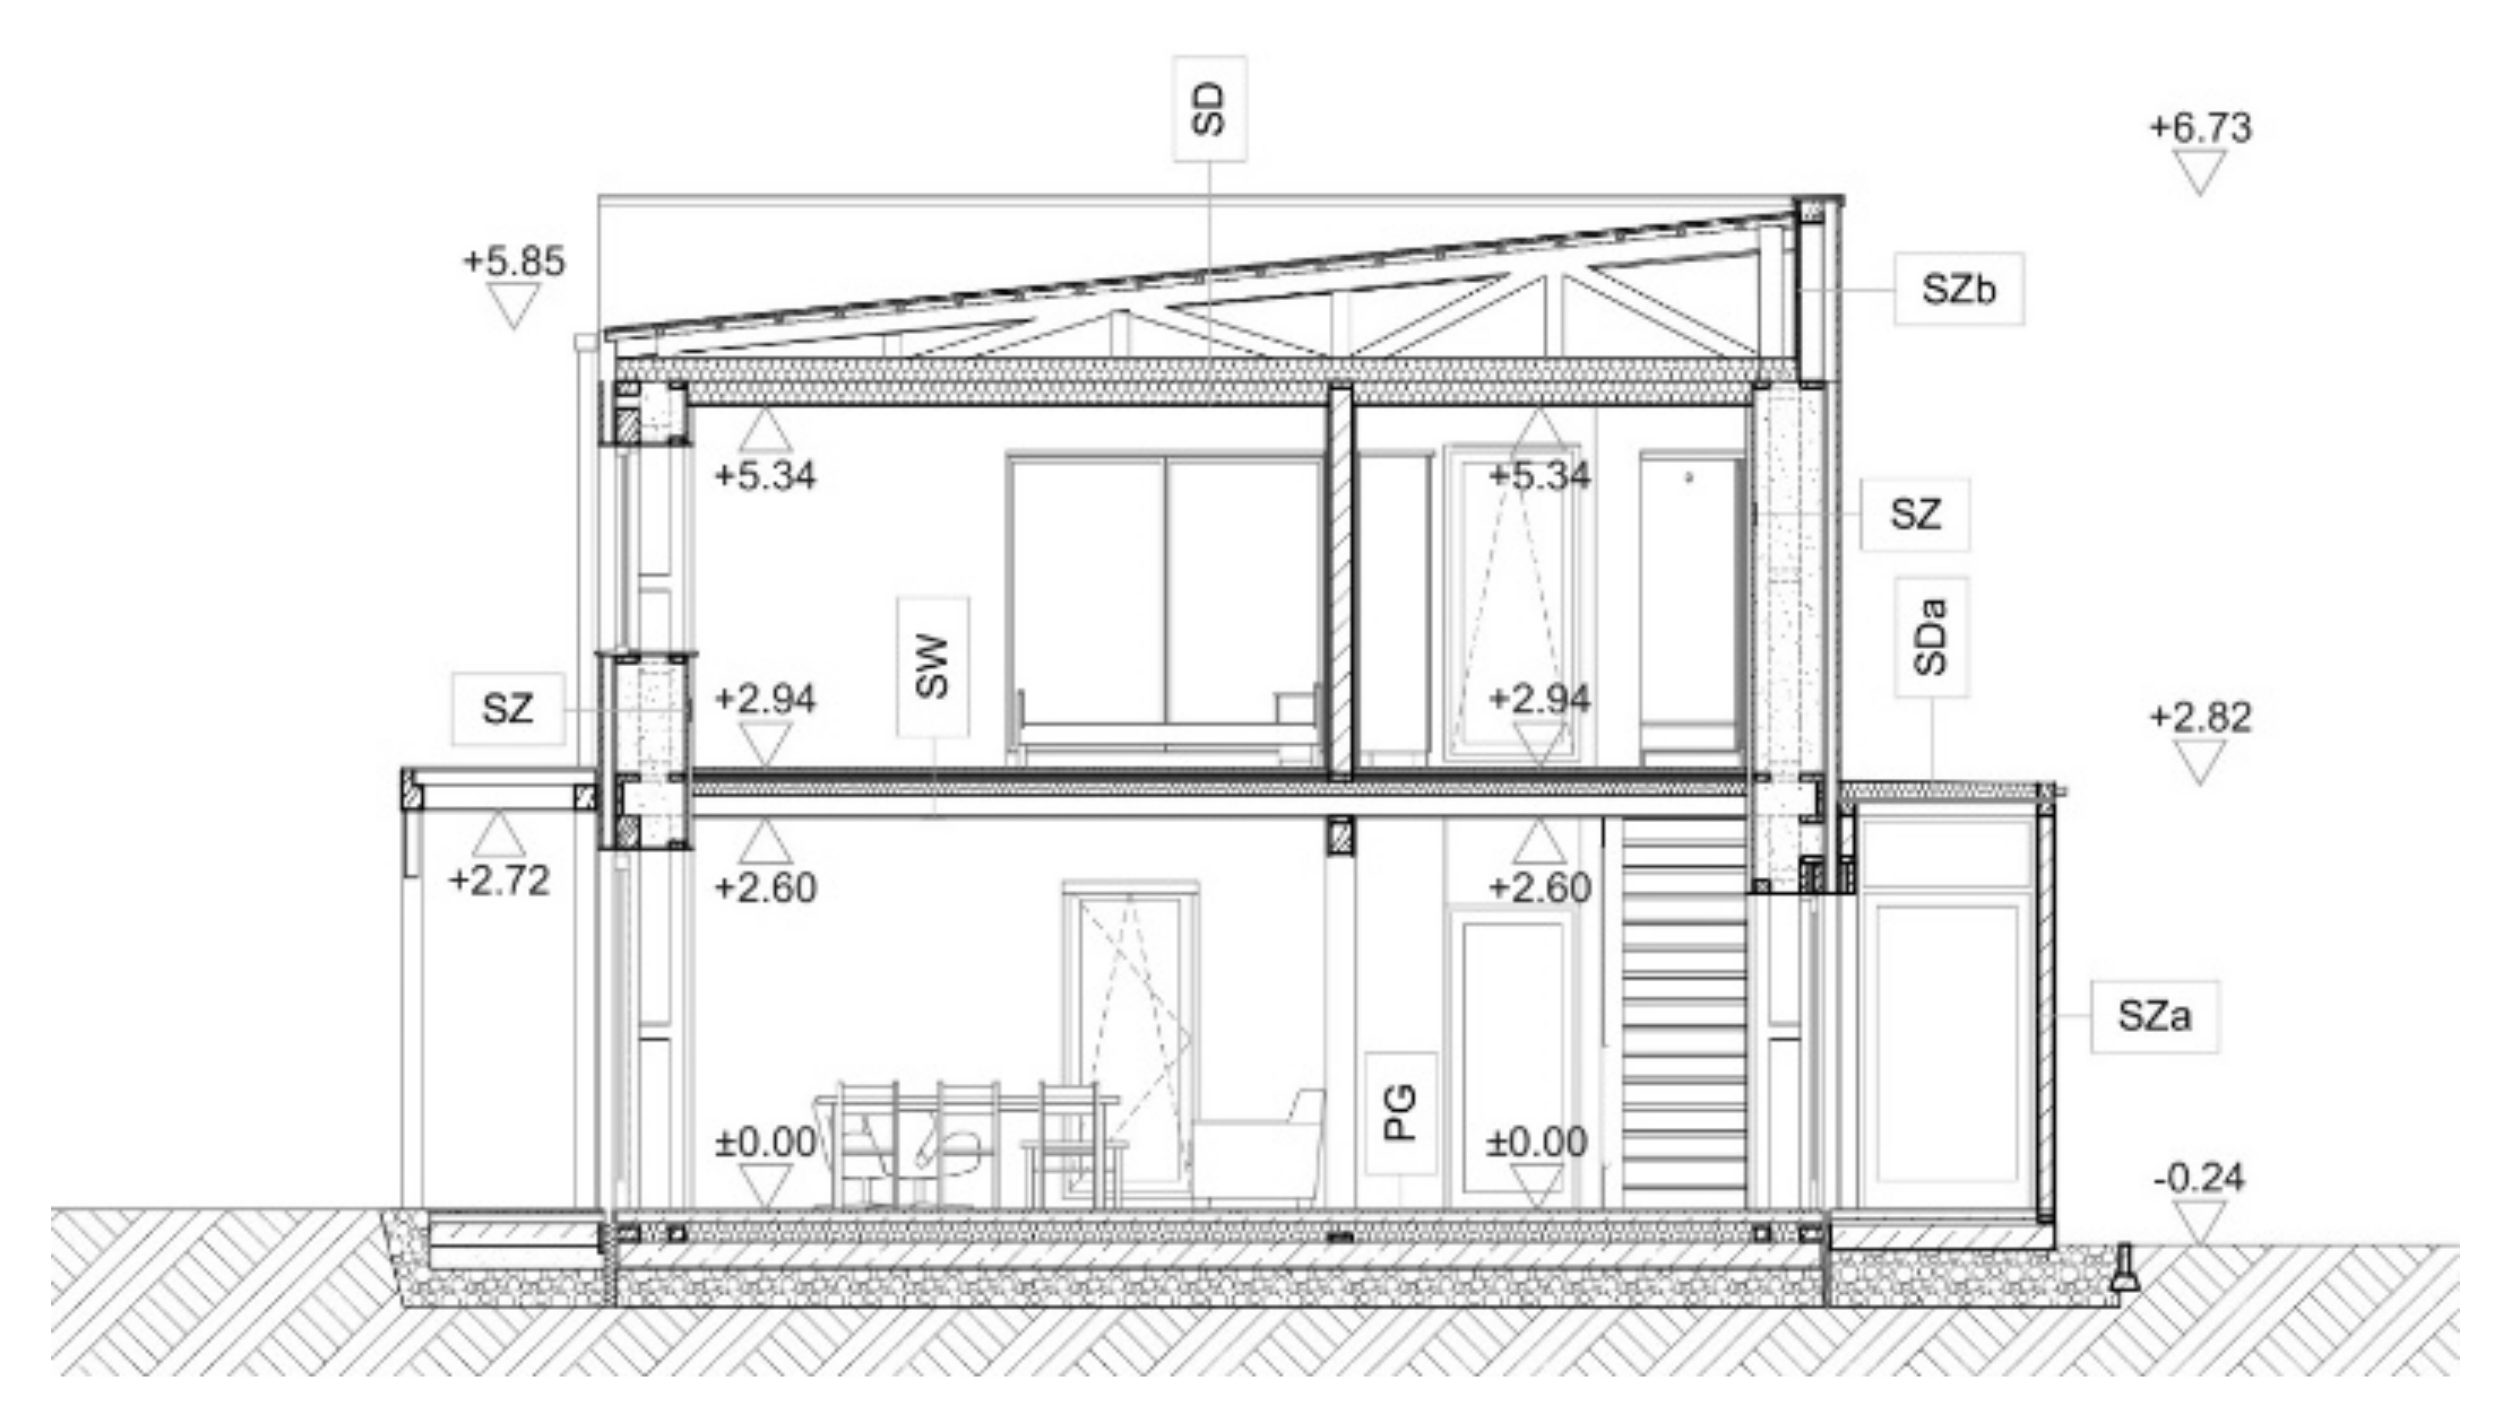
- Reduction in thermal bridges—non-heated vestibule (on the north side) and canopy made as an independent dilated structure;
- Ensuring that the building is compact;
- Warm and tight installation of windows in the thermal insulation layer;
- Overheating protection (canopy on the south side);
- Use of thermal storage masses;
- Mechanical supply and exhaust ventilation with recuperation.
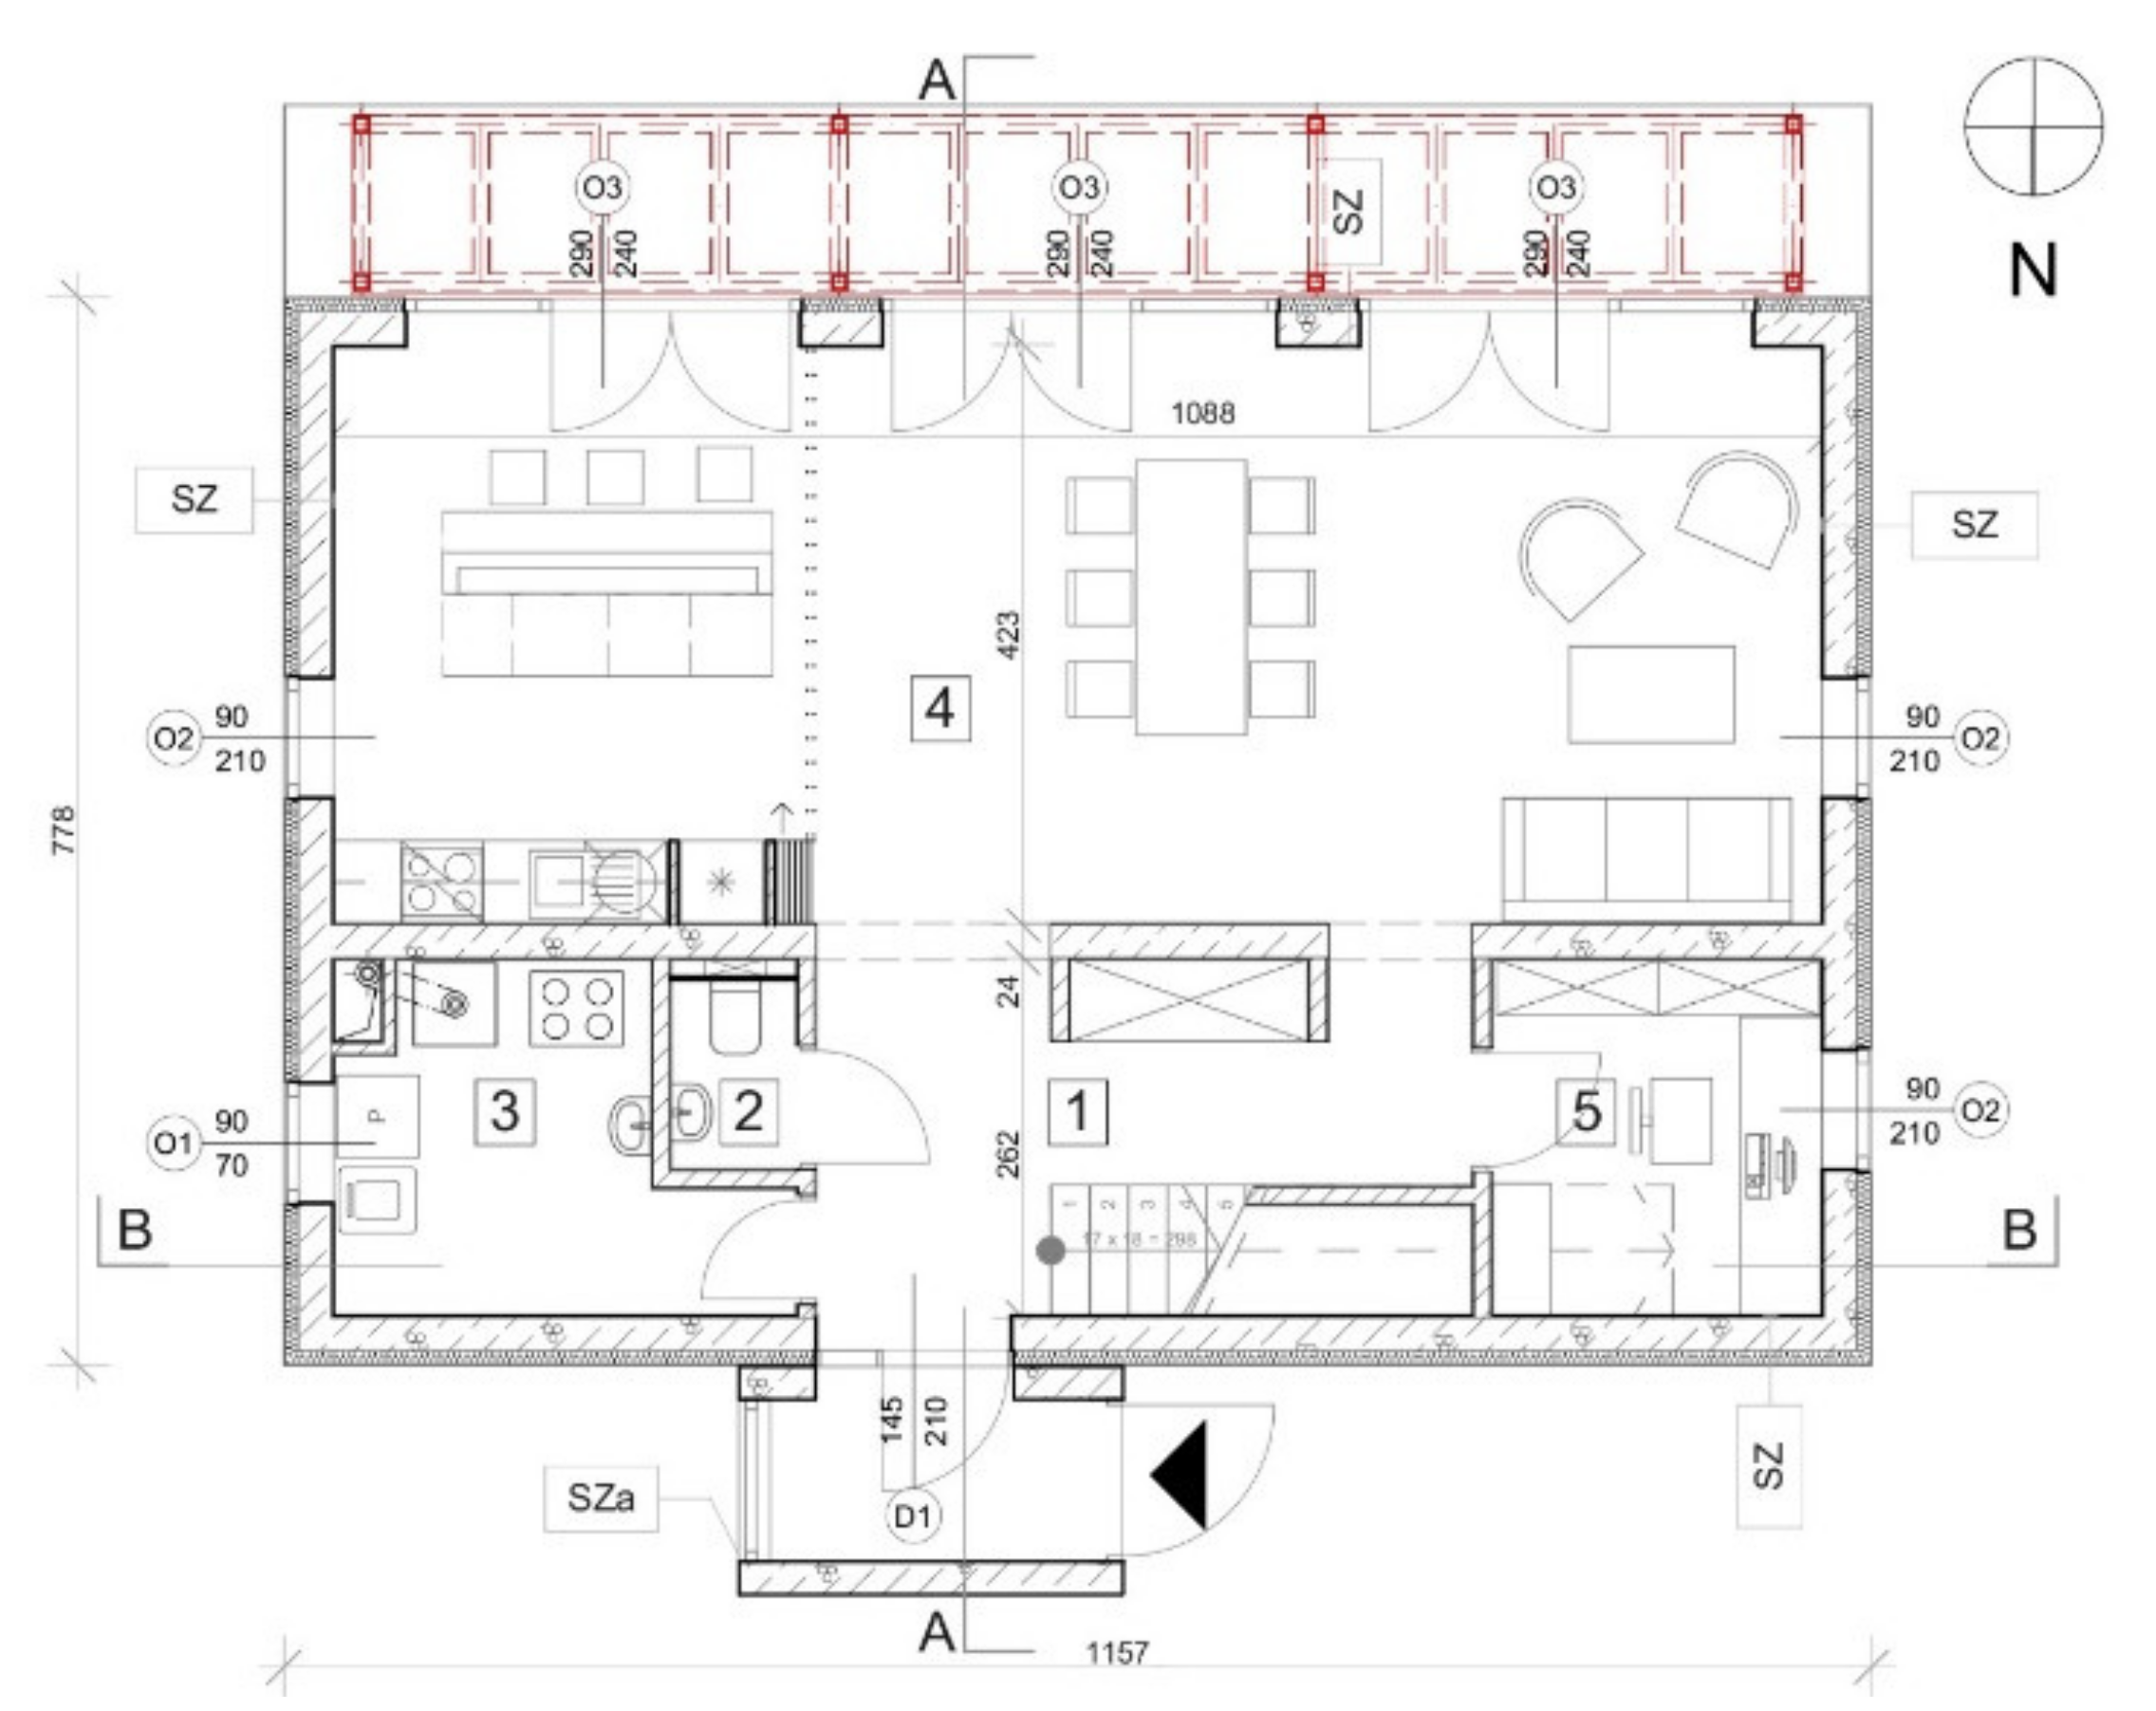
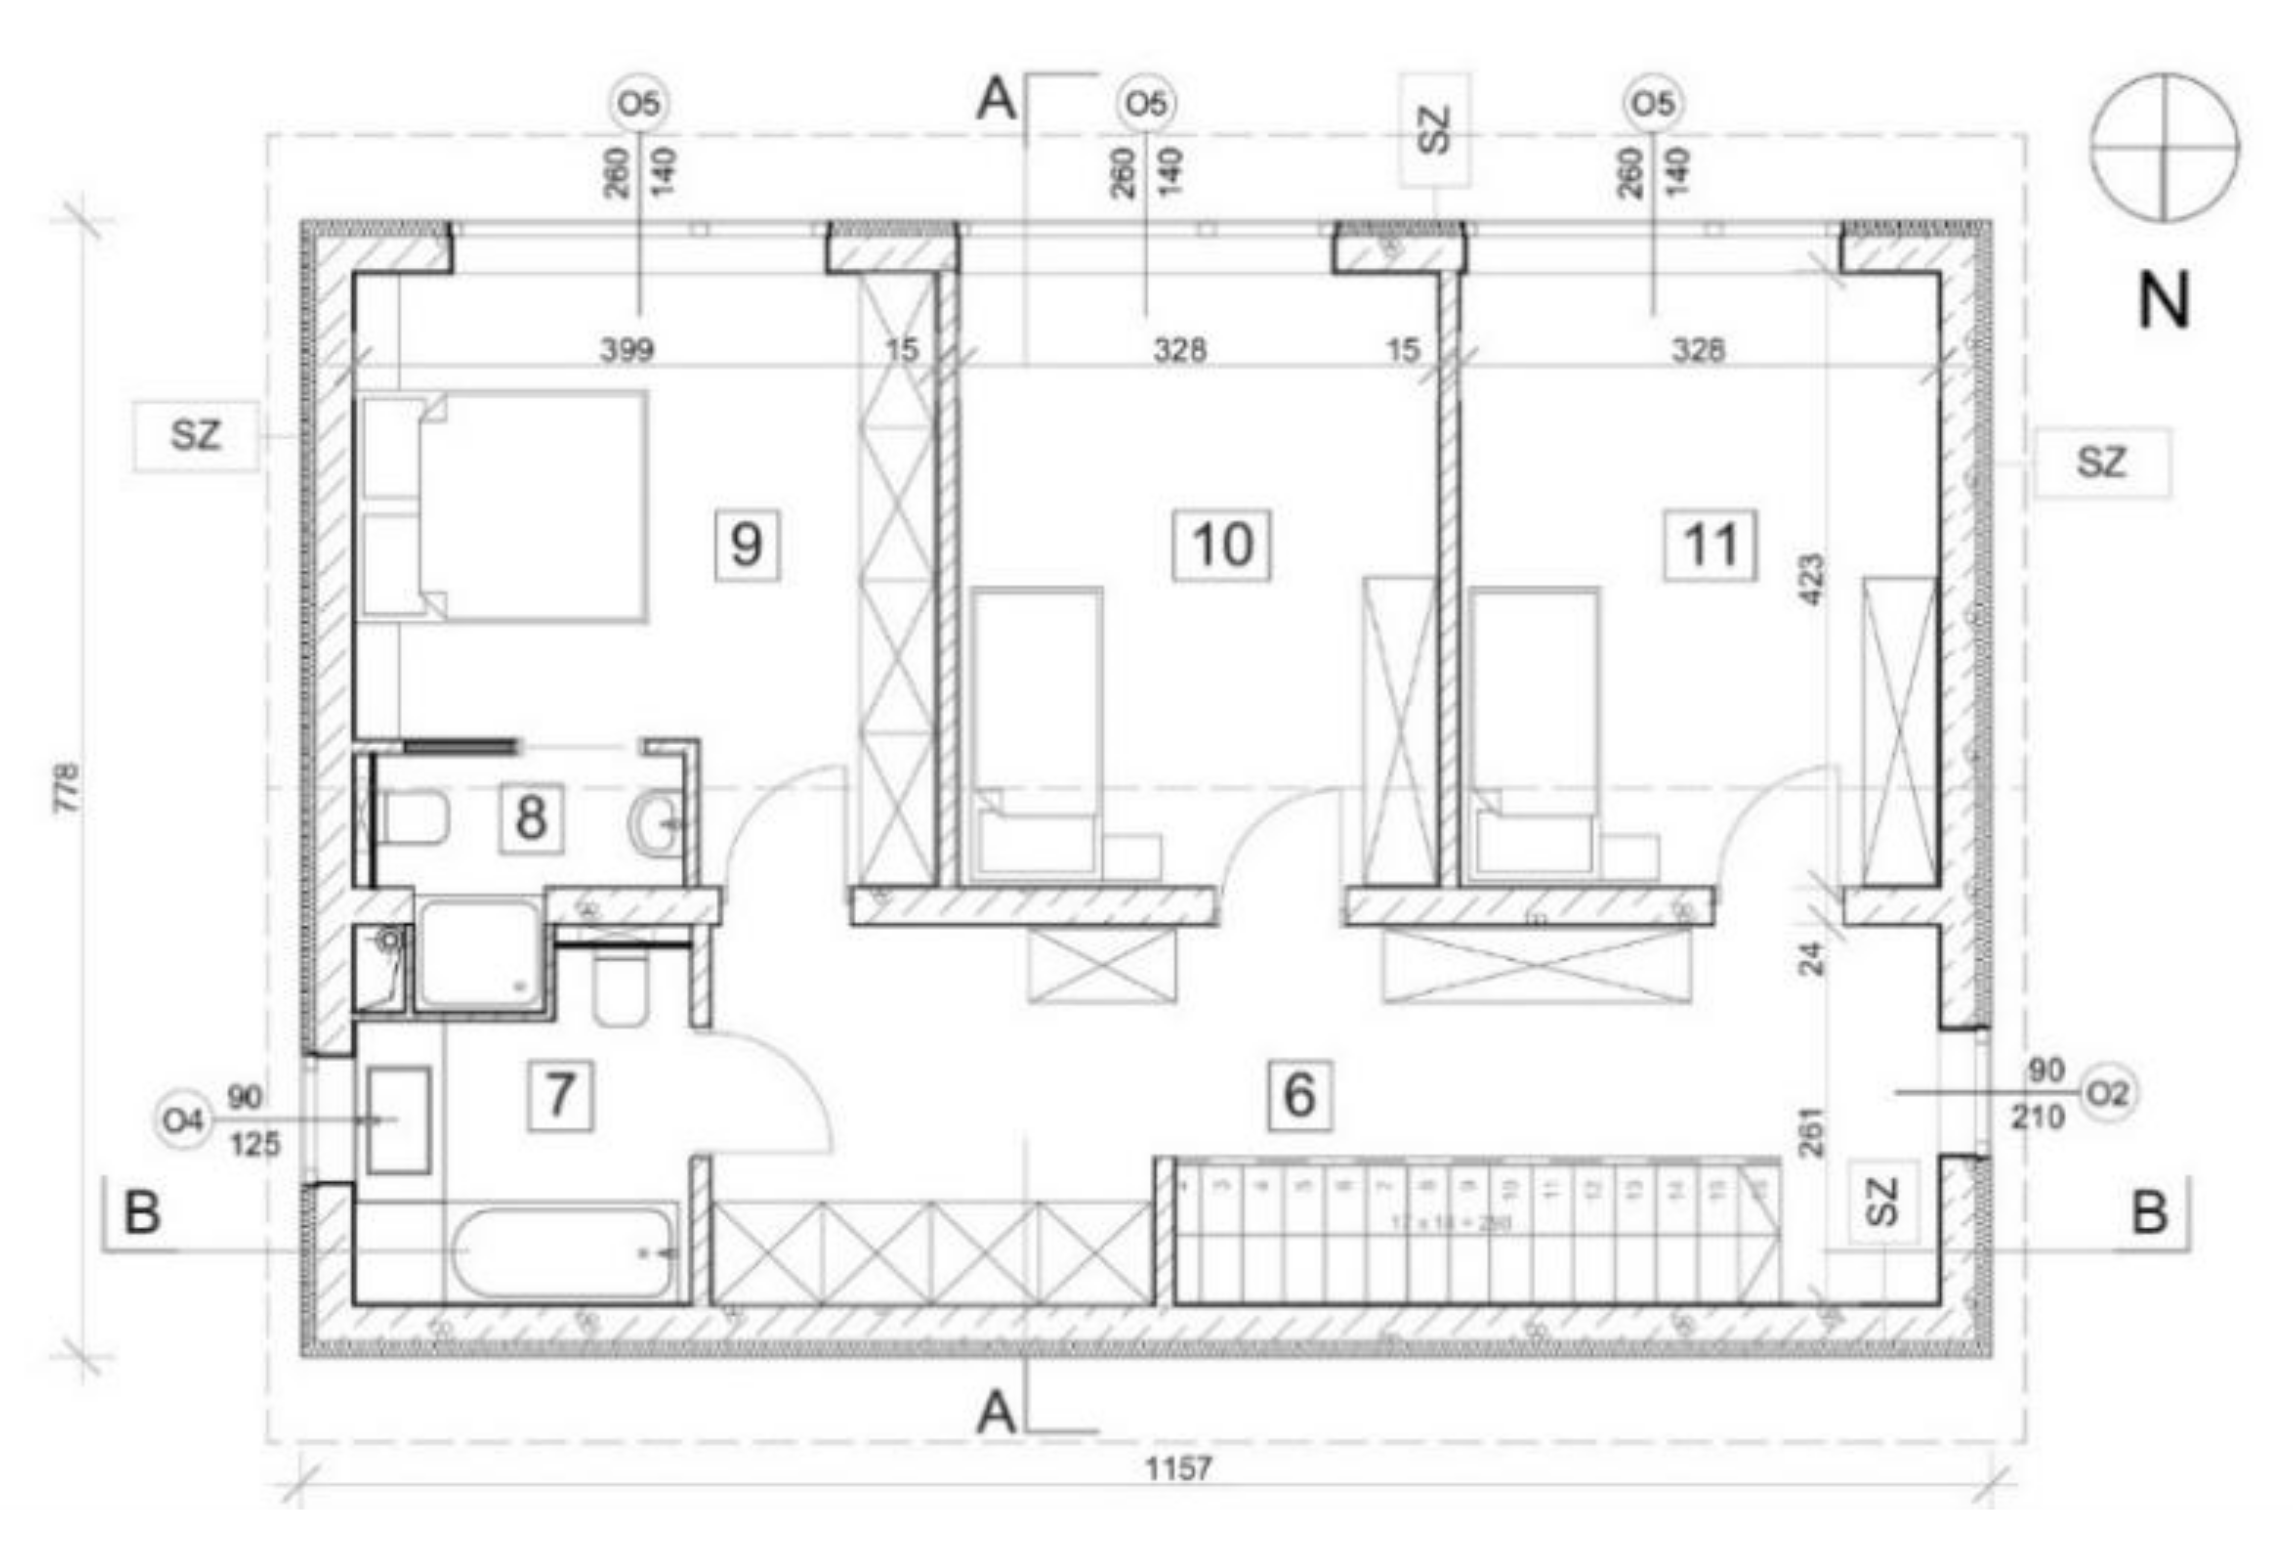
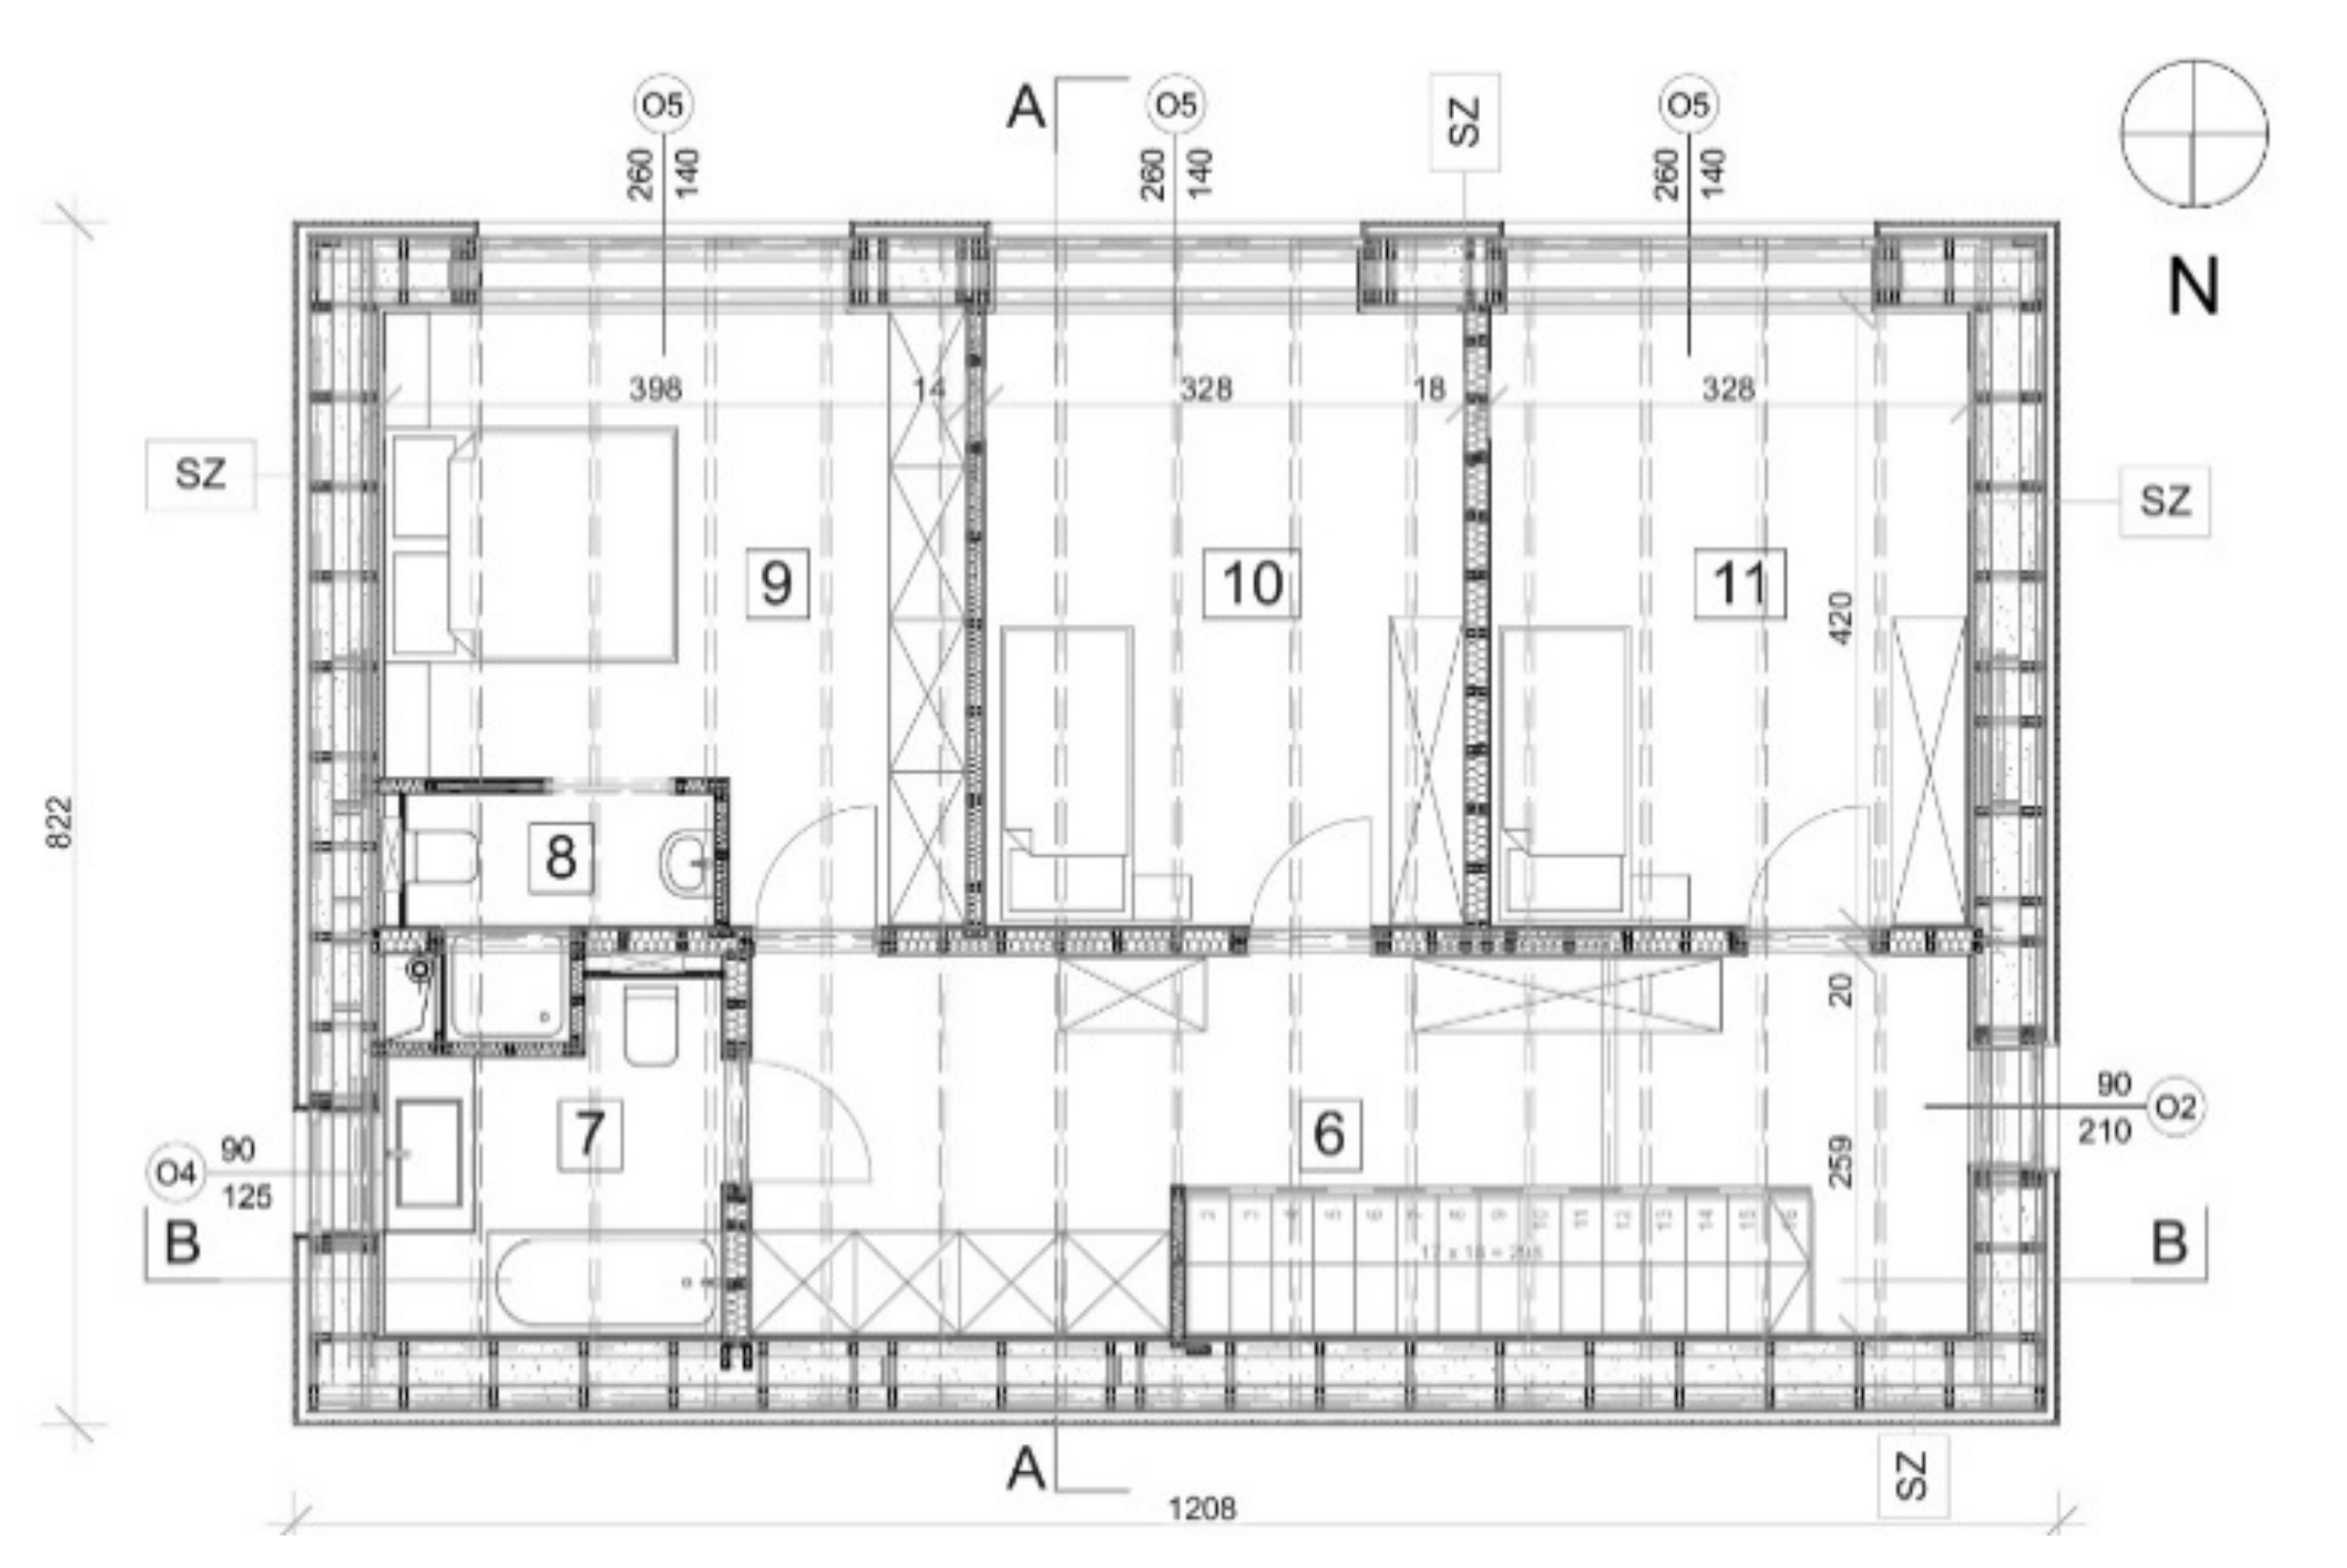
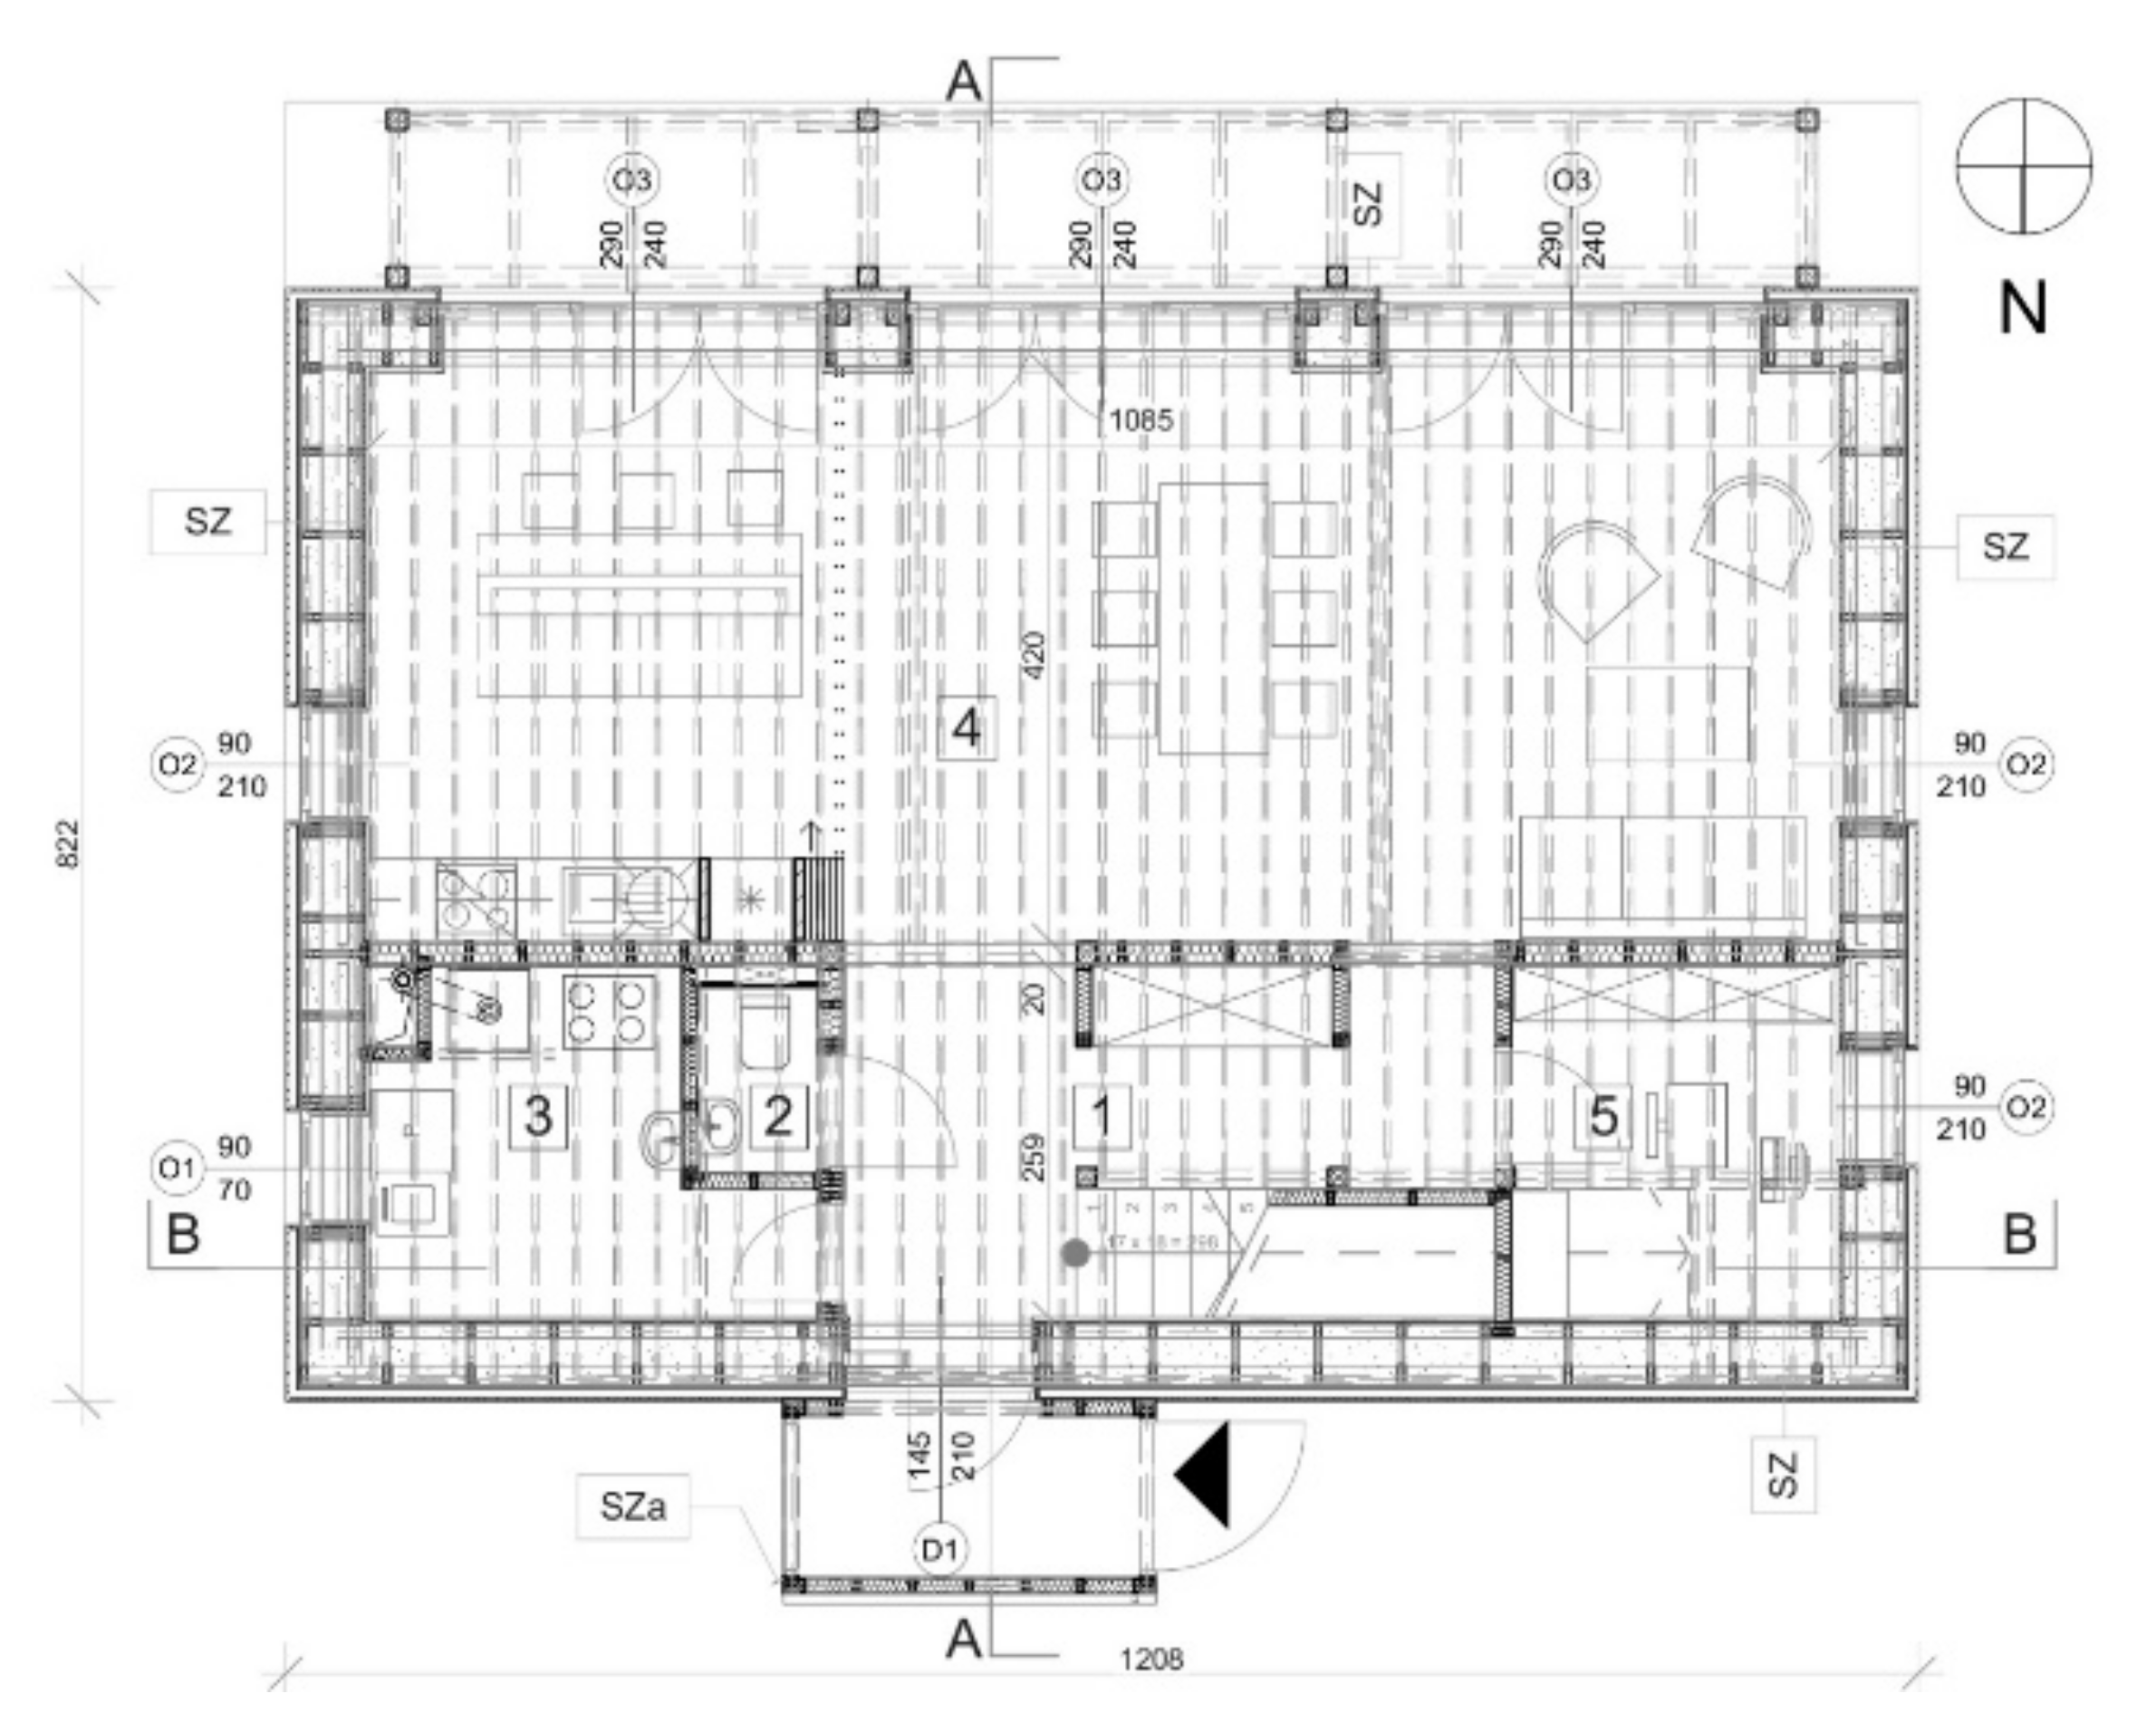
2.5.3. Models of Buildings
3. Results
3.1. Results of Calculations of Energy Performance Using the Monthly Method
3.2. Results of Calculations of Energy Performance Using the Dynamic (Hourly) Method
3.3. Selection of the Optimal Architectural Variant for a Single-Family Dwelling
- Criterion I—minimum cumulative primary energy, i.e., the sum of energy use necessary to complete the selected architectural variant of a building (E);
- Criterion II—minimum cumulative CO2 emissions, i.e., the sum of carbon dioxide emissions from processes that lead to the completion of the selected architectural variant of a building (C);
- Criterion III—minimum cost of completion of the selected architectural variant of a building (K).
4. Discussion
5. Conclusions
Author Contributions
Funding
Institutional Review Board Statement
Informed Consent Statement
Conflicts of Interest
References
- IEA; UNEP. 2019 Global Status Report for Buildings and Construction: Towards a Zero-Emissions, Efficient and Resilient Buildings and Constructi on Sector; IEA: Paris, France; UNEP: Nairobi, Kenya, 2019. [Google Scholar]
- Ibn-Mohammed, T.; Greenough, R.; Taylor, S.; Ozawa-Meida, L.; Acquaye, A. Operational vs. embodied emissions in buildings—A review of current trends. Energy Build. 2013, 66, 232–245. [Google Scholar] [CrossRef]
- Giordano, R.; Serra, V.; Tortalla, E.; Valentini, V.; Aghemo, C. Embodied Energy and Operational Energy Assessment in the Framework of Nearly Zero Energy Building and Building Energy Rating. Energy Procedia 2015, 78, 3204–3209. [Google Scholar] [CrossRef] [Green Version]
- Praseeda, K.; Reddy, B.V.; Mani, M. Embodied and operational energy of urban residential buildings in India. Energy Build. 2016, 110, 211–219. [Google Scholar] [CrossRef]
- Saade, M.R.M.; Guest, G.; Amor, B. Comparative whole building LCAs: How far are our expectations from the documented evidence? Build. Environ. 2020, 167, 106449. [Google Scholar] [CrossRef]
- Grazieschi, G.; Gori, P.; Lombardi, L.; Asdrubali, F. Life cycle energy minimization of autonomous buildings. J. Build. Eng. 2020, 30, 101229. [Google Scholar] [CrossRef]
- Sartori, I.; Hestnes, A.G. Energy use in the life cycle of conventional and low-energy buildings: A review article. Energy Build. 2007, 39, 249–257. [Google Scholar] [CrossRef]
- Copiello, S. Economic implications of the energy issue: Evidence for a positive non-linear relation between embodied energy and construction cost. Energy Build. 2016, 123, 59–70. [Google Scholar] [CrossRef]
- Parasonis, J.; Keizikas, A.; Kalibatiene, D. The relationship between the shape of a building and its energy performance. Arch. Eng. Des. Manag. 2012, 8, 246–256. [Google Scholar] [CrossRef]
- McLeod, R.; Mead, K.; Standen, M. Passivhaus Primer: Designer’s Guide A Guide for the Design Team and Local Authorities; BRE: Watford, UK, 2012. [Google Scholar]
- Hegger, M.; Fuchs, M.; Stark, T.; Zeumer, M. Energy Manual: Sustainable Architecture; Birkhauser AG: Basel, Switzerland; Boston, MA, USA; Berlin, Germany, 2008. [Google Scholar]
- Gonzalo, R.; Vallentin, R. Passive House Design: Planning and Design of Energy-Efficient Buildings; Detail Green Books; Institut für Internationale Architektur-Dokumentation: Munchen, Germany, 2014. [Google Scholar]
- Fenner, A.E.; Kibert, C.; Woo, J.; Morque, S.; Razkenari, M.; Hakim, H.; Lu, X. The carbon footprint of buildings: A review of methodologies and applications. Renew. Sustain. Energy Rev. 2018, 94, 1142–1152. [Google Scholar] [CrossRef]
- Pan, W.; Li, K.; Teng, Y. Rethinking system boundaries of the life cycle carbon emissions of buildings. Renew. Sustain. Energy Rev. 2018, 90, 379–390. [Google Scholar] [CrossRef]
- Teng, Y.; Pan, W. Building Life Cycle Carbon Emissions: A Review. In Proceedings of the World Sustainable Built Environment Conference Hong Kong, Hong Kong, 5–7 June 2017; pp. 1095–1101. [Google Scholar]
- Life Cycle Assessment Technical Committee ISO/TC 207; Environmental Management, Subcommittee SC 5. ISO 14040:2006 Environmental Management—Life Cycle Assessment—Principles and Framework; International Organization for Standardization: Geneva, Switzerland, 2006. [Google Scholar]
- Węglarz, A.; Pierzchalski, M. Comparing construction technologies of single family housing with regard of minimizing embodied energy and embodied carbon. E3S Web Conf. 2018, 49, 00126. [Google Scholar] [CrossRef] [Green Version]
- CEN. EN 15804 Sustainability of Construction Works—Environmental Product Declarations—Core Rules for the Product Category of Construction Products; CEN: Brussels, Belgium, 2012. [Google Scholar]
- Hammond, P.G.; Jones, C. Inventory of Carbon & Energy (ICE). Mech. Eng. 2006, 161, 1–49. [Google Scholar] [CrossRef] [Green Version]
- KOBiZE; IOŚ-PIB. Wskaźniki Emisyjności CO2, SO2, NOx, CO i TSP Dla Energii Elektrycznej na Podstawie Informacji Zawartych w Krajowej Bazie o Emisjach Gazów Cieplarnianych i Innych Substancji za Rok 2015; KOBiZE: Warsaw, Poland; IOŚ-PIB: Warsaw, Poland, 2017. [Google Scholar]
- KOBiZE; IOŚ-PIB. Wartości Opałowe (WO) i Wskaźniki Emisji CO2 (WE) w Roku 2013 do Raportowania w Ramach Wspólnotowego Systemu Handlu Uprawnieniami do Emisji za Rok 2016; KOBiZE: Warsaw, Poland; IOŚ-PIB: Warsaw, Poland, 2016. (In Polish) [Google Scholar]
- KOBiZE; IOŚ-PIB. Wskaźniki Emisji Zanieczyszczeń ze Spalania Paliw, Kotły o Nominalnej Mocy Cieplnej do 5 MW; KOBiZE: Warsaw, Poland; IOŚ-PIB: Warsaw, Poland, 2015. [Google Scholar]
- Krajowa Agencja Poszanowania Energii. Środowiskowe Aspekty Nowoczesnego Budownictwa Drewnianego; Krajowa Agencja Poszanowania Energii: Warsaw, Poland, 2019. [Google Scholar]
- Srinivasan, R.S.; Ingwersen, W.; Trucco, C.; Ries, R.; Campbell, D. Comparison of energy-based indicators used in life cycle assessment tools for buildings. Build. Environ. 2014, 79, 138–151. [Google Scholar] [CrossRef]
- Wȩglarz, A. Opis Metod Wspomagania Procesu Rewitalizacji Budynku pod Kątem Spełnienia zasad Zrównowazonego Rozwoju w Budownictwie. In Rewitalizacja Budynków Użyteczości Publicznej Według Kryteriów Zrównoważonego Rozwoju; CBI Pro-Akademia: Konstantynów Łódzki, Poland, 2014; pp. 33–57. [Google Scholar]
- Węglarz, A. Using Artificial Intelligence in energy efficient construction. E3S Web Conf. 2018, 49, 00125. [Google Scholar] [CrossRef] [Green Version]
- Węglarz, A.; Gilewski, P.G. Application of expert systems in the construction sector. MATEC Web Conf. 2017, 117, 00176. [Google Scholar] [CrossRef] [Green Version]
- Shi, X.; Tian, Z.; Chen, W.; Si, B.; Jin, X. A review on building energy efficient design optimization rom the perspective of architects. Renew. Sustain. Energy Rev. 2016, 65, 872–884. [Google Scholar] [CrossRef]
- Płoszaj-Mazurek, M.; Ryńska, E.; Grochulska-Salak, M. Methods to Optimize Carbon Footprint of Buildings in Regenerative Architectural Design with the Use of Machine Learning, Convolutional Neural Network, and Parametric Design. Energies 2020, 13, 5289. [Google Scholar] [CrossRef]
- Basbagill, J.; Flager, F.; Lepech, M.; Fischer, M. Application of life-cycle assessment to early stage building design for reduced embodied environmental impacts. Build. Environ. 2013, 60, 81–92. [Google Scholar] [CrossRef]
- Leoto, R.; Lizarraldea, G. Challenges in evaluating strategies for reducing a building’s environmental impact through Integrated Design. Build. Environ. 2019, 155, 34–46. [Google Scholar] [CrossRef]
- Foster, G. Circular economy strategies for adaptive reuse of cultural heritage buildings to reduce environmental impacts. Resour. Conserv. Recycl. 2020, 152, 104507. [Google Scholar] [CrossRef]
- Nemry, F.; Uihlein, A.; Colodel, C.M.; Wetzel, C.; Braune, A.; Wittstock, B.; Hasan, I.; Kreißig, J.; Gallon, N.; Niemeier, S.; et al. Options to reduce the environmental impacts of residential buildings in the European Union—Potential and costs. Energy Build. 2010, 42, 976–984. [Google Scholar] [CrossRef]
- De Klijn-Chevalerias, M.; Javed, S. The Dutch approach for assessing and reducing environmental impacts of building materials. Build. Environ. 2017, 111, 147–159. [Google Scholar] [CrossRef]
- Shadram, F.; Mukkavaara, J. An integrated BIM-based framework for the optimization of the trade-off between embodied and operational energy. Energy Build. 2018, 158, 1189–1205. [Google Scholar] [CrossRef]
- D’Agostino, D.; Parker, D.; Melià, P. Environmental and economic implications of energy efficiency in new residential buildings: A multi-criteria selection approach. Energy Strat. Rev. 2019, 26, 100412. [Google Scholar] [CrossRef]
- Hawila, A.A.W.; Merabtine, A. A statistical-based optimization method to integrate thermal comfort in the design of low energy consumption building. J. Build. Eng. 2021, 33, 101661. [Google Scholar] [CrossRef]
- Lu, Y.; Wang, S.; Zhao, Y.; Yan, C. Renewable energy system optimization of low/zero energy buildings using single-objective and multi-objective optimization methods. Energy Build. 2015, 89, 61–75. [Google Scholar] [CrossRef]
- Shah, A.S.; Nasir, H.; Fayaz, M.; Lajis, A.; Shah, A. A Review on Energy Consumption Optimization Techniques in IoT Based Smart Building Environments. Information 2019, 10, 108. [Google Scholar] [CrossRef] [Green Version]
- Kheiri, F. A review on optimization methods applied in energy-efficient building geometry and envelope design. Renew. Sustain. Energy Rev. 2018, 92, 897–920. [Google Scholar] [CrossRef]


| Product Stage | Construction Process Stage | Use Stage | End of Life Stage | Info | ||||||||||||
|---|---|---|---|---|---|---|---|---|---|---|---|---|---|---|---|---|
| A1 | A2 | A3 | A4 | A5 | B1 | B2 | B3 | B4 | B5 | B6 | B7 | C1 | C2 | C3 | C4 | D |
| Raw material supply | Transport | Manufacturing | Transport | Construction—installation process | Use | Maintenance | Repair | Replacement | Refurbishment | Operational energy use | Operational water use | Deconstruction or demolition | Transport | Waste processing | Disposal | Reuse, recovery, recycling potential |
| Energy Carrier or Energy | Sulphur Oxides (SOx/SO2) | Nitrogen Oxides (NOx/NO2) | Carbon Monoxide (CO) | Carbon Dioxide (CO2) | Total Suspended Particles (TSP) |
|---|---|---|---|---|---|
| Natural gas [g/m3] | 0.002 x s | 1.52 | 0.30 | 2000 | 0.0005 |
| Wood [g/Mg] | 110 | 1000 | 26,000 | 1,200,000 | 1500 |
| Electricity (for end users 1) [kg/MWh] | 1.516 | 0.954 | 0.234 | 798 | 0.062 |
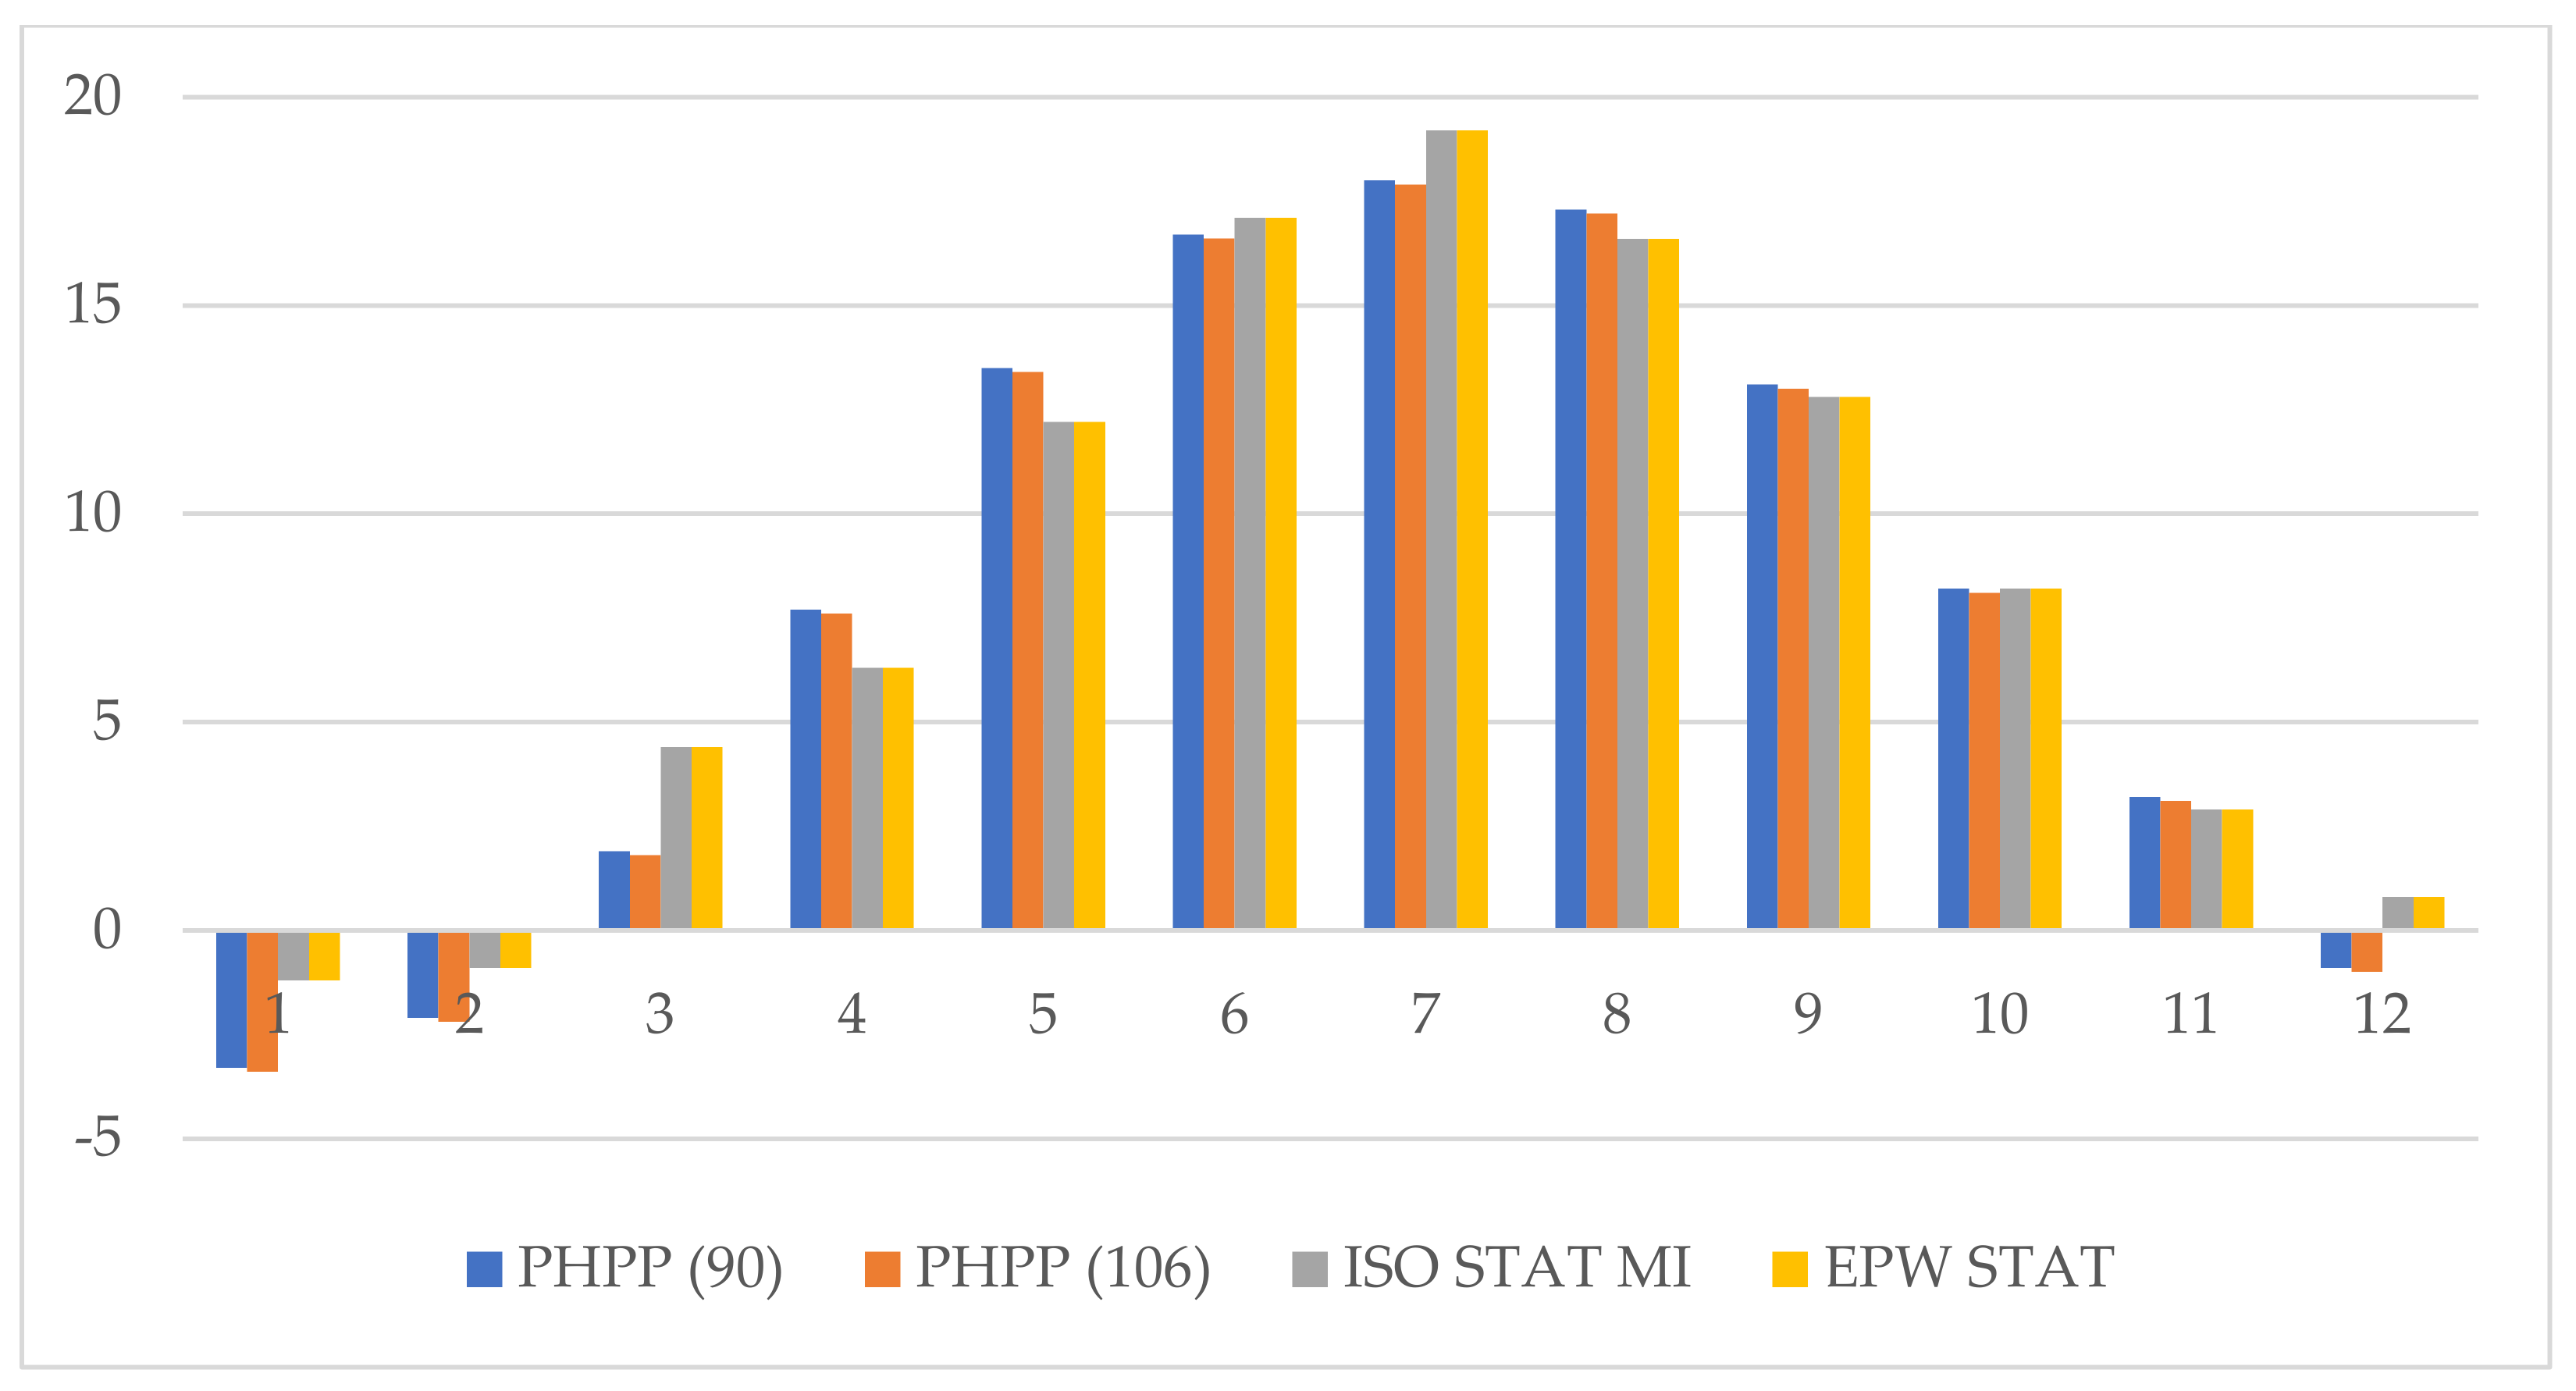
| Data Source | 1 | 2 | 3 | 4 | 5 | 6 | 7 | 8 | 9 | 10 | 11 | 12 |
|---|---|---|---|---|---|---|---|---|---|---|---|---|
| PHPP (90 1) | −3.3 | −2.1 | 1.9 | 7.7 | 14 | 16.7 | 18 | 17.3 | 13.1 | 8.2 | 3.2 | −0.9 |
| PHPP (106 2) | −3.4 | −2.2 | 1.8 | 7.6 | 13 | 16.6 | 17.9 | 17.2 | 13 | 8.1 | 3.1 | −0.996 |
| MIB | −1.2 | −0.9 | 4.4 | 6.3 | 12 | 17.1 | 19.2 | 16.6 | 12.8 | 8.2 | 2.9 | 0.8 |
| EPW STAT 3 | −1.2 | −0.9 | 4.4 | 6.3 | 12 | 17.1 | 19.2 | 16.6 | 12.8 | 8.2 | 2.9 | 0.8 |
| No. | Partition | Insulation | Heat Transfer Coefficient [W/m2 K] | Required by WT2017 [W/m2 K] |
|---|---|---|---|---|
| 1 | External wall | 0.038/10 cm | 0.22 | 0.23 |
| 2 | Floor on the ground | 0.036/12 cm | 0.26 | 0.30 |
| 3 | Roofs | 0.039/25 cm | 0.173 | 0.18 |
| Designation | View | Usable Heated Area [m2] | Heated Net Cubic Volume [m3] | Technology | Energy Standard (Modified Thermal Insulation Thickness) |
|---|---|---|---|---|---|
| A1 |  | 139.85 | 364.84 | A | WT2017 |
| A2 |  | 139.85 | 364.84 | A | WT2017 |
| A3 | 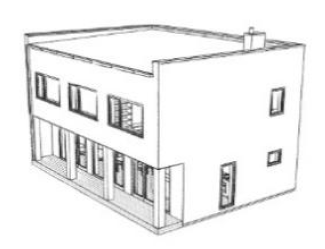 | 139.65 | 363.70 | A | WT2017 |
| A4 |  | 139.65 | 363.70 | A | WT2017 |
| B1 | 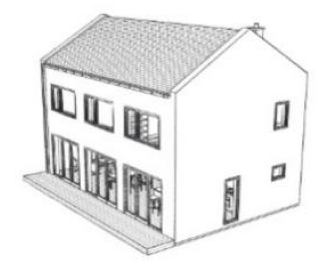 | 139.85 | 364.84 | B | WT2017 |
| B2 | 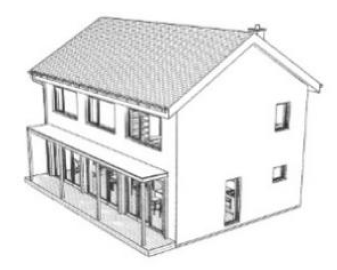 | 139.85 | 364.84 | B | WT2017 |
| B3 | 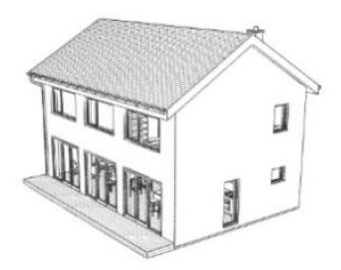 | 139.85 | 364.84 | B | WT2017 |
| B4 | 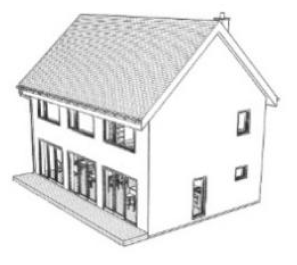 | 139.85 | 364.84 | B | WT2017 |
| C1 |  | 134.72 | 392.54 | C | WT2017 |
| C2 | 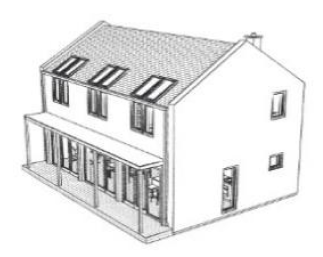 | 134.72 | 392.54 | C | WT2017 |
| D1 | 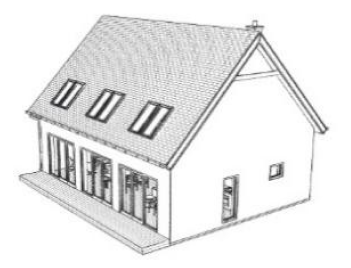 | 139.69 | 437.35 | D | WT2017 |
| D2 | 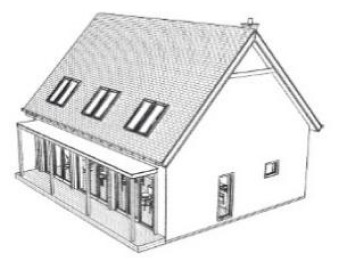 | 139.69 | 437.35 | D | WT2017 |
| D3 | 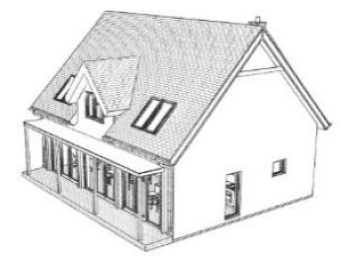 | 141.89 | 441.28 | D | WT2017 |
| E1 | 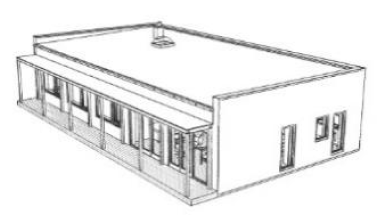 | 140.93 | 384.98 | E | WT2017 |
| E2 | 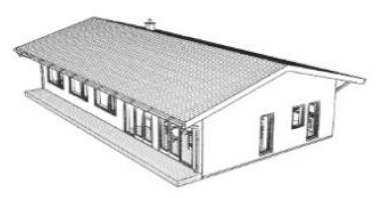 | 140.93 | 385.77 | E | WT2017 |
| F1 | 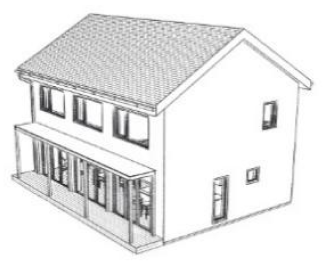 | 144.25 | 378.38 | F | WT2017 |
| F2 | 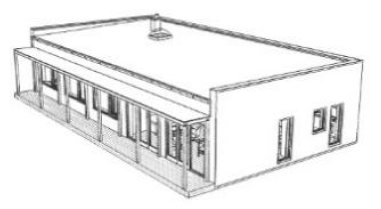 | 141.19 | 375.14 | F | WT2017 |
| PH | 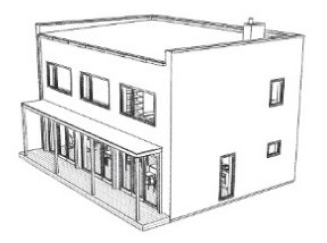 | 139.85 | 364.84 | PH | Passive House |
| SZ | 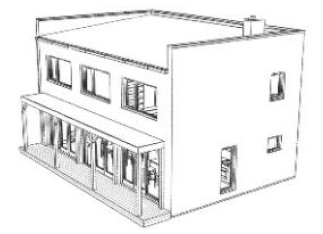 | 139.80 | 364.80 | SZ | No verification |
| SB | 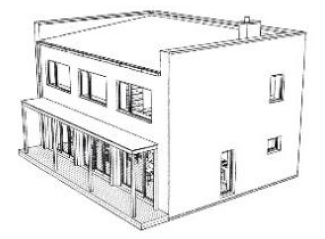 | 139.80 | 364.80 | SB | No verification |
| No. | Name | Floor | Usable Area [m2] | Net Cubic Volume [m3] |
|---|---|---|---|---|
| 1 | Non-heated vestibule | I | 2.75 | 7.19 |
| 2 | Hall | I | 10.46 | 27.25 |
| 3 | Toilet | I | 1.25 | 3.25 |
| 4 | Technical room | I | 6.64 | 17.29 |
| 5 | Living room/Kitchen | I | 14.71 + 30.79 | 38.32 + 80.20 |
| 6 | Study | I | 5.93 | 15.44 |
| 7 | Corridor | II | 20.80 | 52.20 |
| 8 | Bathroom | II | 4.93 | 12.39 |
| 9 | Small bathroom | II | 2.42 | 6.10 |
| 10 | Room 1 | II | 14.36 | 36.06 |
| 11 | Room 2 | II | 13.78 | 34.58 |
| 12 | Room 3 | II | 13.78 | 34.58 |
| TOTAL (non-heated) | 139.85 | 357.65 | ||
| TOTAL usable area | 142.60 | 364.84 |
| Designation | CO2 Emission—Stages: A1–A3 (Products) [kg CO2e.] | CO2 Emission—B6 (Use of 1 Year) [kg CO2e.] | Cumulative CO2 Emission—A1_A3 + B6 (50 Years) [Mg CO2e.] | Embodied Energy A1–A3 (Products) [MJ] | Operational (Primary) Energy B6, 1 Year [MJ] | Cumulative Primary Energy A1_A3 + B6 (50 Years) [GJ] | Construction Cost in EUR (8% VAT) |
|---|---|---|---|---|---|---|---|
| A1 | 59,983 | 3126.1 | 216 | 698,411.88 | 56,793.924 | 3538 | 101,993 |
| A2 | 65,851 | 3156.1 | 224 | 769,894.92 | 57,447.324 | 3642 | 109,617 |
| A3 | 63,373 | 3168.5 | 222 | 760,871.88 | 57,717.396 | 3647 | 110,453 |
| A4 | 62,076 | 3147.9 | 219 | 746,773.92 | 57,268.728 | 3610 | 108,721 |
| B1 | 60,068 | 3126.1 | 216 | 713,081.88 | 56,793.924 | 3553 | 100,714 |
| B2 | 65,943 | 3163.3 | 224 | 788,573.88 | 57,604.14 | 3669 | 103,425 |
| B3 | 60,076 | 3132.3 | 217 | 717,090.84 | 56,928.96 | 3564 | 97,886 |
| B4 | 60,767 | 3144.3 | 218 | 728,780.04 | 57,190.32 | 3588 | 98,695 |
| C1 | 57,297 | 3171.5 | 216 | 679,714.92 | 57,782.736 | 3569 | 98,105 |
| C2 | 63,165 | 3201.5 | 223 | 751,197.96 | 58,436.136 | 3673 | 103,886 |
| D1 | 62,856 | 3195.5 | 223 | 737,166.96 | 58,305.456 | 3652 | 111,849 |
| D2 | 68,724 | 3227.1 | 230 | 808,650 | 58,993.704 | 3758 | 117,738 |
| D3 | 71,090 | 3225.7 | 232 | 834,981.12 | 58,963.212 | 3783 | 115,658 |
| E1 | 82,259 | 3277.5 | 246 | 973,905.12 | 60,091.416 | 3978 | 125,892 |
| E2 | 71,417 | 3279.7 | 235 | 879,114.96 | 60,139.332 | 3886 | 112,702 |
| F1 | 68,994 | 3224.1 | 230 | 818,480.88 | 58,928.364 | 3765 | 113,414 |
| F2 | 83,795 | 3265.3 | 247 | 1,002,600 | 59,825.7 | 3994 | 126,053 |
| PH | 63,333 | 2982.5 | 212 | 833,329 | 53,666.316 | 3517 | 114,343 |
| SZ | 37,195 | 3299 | 202 | 510,352 | 60,548.796 | 3538 | 131,498 |
| SB | 35,677 | 3205.5 | 196 | 474,038 | 58,523.256 | 3400 | 105,541 |
| min. | 196 | 3400 | 97,886 |
| Designation | Standardisation of CO2 Emission | Standardisation of Cumulative Energy | Standardisation of Construction Cost | Result: Weights w1 = 0.4 w2 = 0.3 w3 = 03 | Result: Weights w1 = 0.8 w2 = 0.1 w3 = 0.1 | Result: Weights w1 = 0.1 w2 = 0.1 w3 = 0.8 | Result: Weights w1 = 0.3 w2 = 0.3 w3 = 0.4 |
|---|---|---|---|---|---|---|---|
| A1 | 0.875 | 0.886 | 0.776 | 0.849 | 0.867 | 0.797 | 0.839 |
| A2 | 0.905 | 0.912 | 0.834 | 0.886 | 0.899 | 0.849 | 0.879 |
| A3 | 0.898 | 0.913 | 0.840 | 0.885 | 0.894 | 0.853 | 0.879 |
| A4 | 0.888 | 0.904 | 0.827 | 0.875 | 0.884 | 0.841 | 0.868 |
| B1 | 0.876 | 0.890 | 0.766 | 0.847 | 0.866 | 0.789 | 0.836 |
| B2 | 0.907 | 0.919 | 0.787 | 0.874 | 0.896 | 0.812 | 0.862 |
| B3 | 0.877 | 0.892 | 0.744 | 0.842 | 0.865 | 0.772 | 0.829 |
| B4 | 0.882 | 0.898 | 0.751 | 0.848 | 0.871 | 0.779 | 0.834 |
| C1 | 0.874 | 0.894 | 0.746 | 0.841 | 0.863 | 0.774 | 0.829 |
| C2 | 0.904 | 0.920 | 0.790 | 0.874 | 0.894 | 0.814 | 0.863 |
| D1 | 0.901 | 0.915 | 0.851 | 0.890 | 0.897 | 0.862 | 0.885 |
| D2 | 0.931 | 0.941 | 0.895 | 0.923 | 0.929 | 0.904 | 0.920 |
| D3 | 0.941 | 0.947 | 0.880 | 0.924 | 0.935 | 0.892 | 0.918 |
| E1 | 0.996 | 0.996 | 0.957 | 0.985 | 0.992 | 0.965 | 0.981 |
| E2 | 0.953 | 0.973 | 0.857 | 0.930 | 0.945 | 0.878 | 0.921 |
| F1 | 0.932 | 0.943 | 0.862 | 0.914 | 0.926 | 0.877 | 0.907 |
| F2 | 1.000 | 1.000 | 0.959 | 0.988 | 0.996 | 0.967 | 0.983 |
| PH | 0.860 | 0.881 | 0.870 | 0.869 | 0.863 | 0.870 | 0.870 |
| SZ | 0.818 | 0.886 | 1.000 | 0.893 | 0.843 | 0.970 | 0.911 |
| SB | 0.793 | 0.851 | 0.803 | 0.813 | 0.800 | 0.807 | 0.814 |
| min. | 0.793 | 0.851 | 0.744 | 0.813 | 0.800 | 0.772 | 0.814 |
Publisher’s Note: MDPI stays neutral with regard to jurisdictional claims in published maps and institutional affiliations. |
© 2021 by the authors. Licensee MDPI, Basel, Switzerland. This article is an open access article distributed under the terms and conditions of the Creative Commons Attribution (CC BY) license (https://creativecommons.org/licenses/by/4.0/).
Share and Cite
Pierzchalski, M.; Ryńska, E.D.; Węglarz, A. Life Cycle Assessment as a Major Support Tool within Multi-Criteria Design Process of Single Dwellings Located in Poland. Energies 2021, 14, 3748. https://doi.org/10.3390/en14133748
Pierzchalski M, Ryńska ED, Węglarz A. Life Cycle Assessment as a Major Support Tool within Multi-Criteria Design Process of Single Dwellings Located in Poland. Energies. 2021; 14(13):3748. https://doi.org/10.3390/en14133748
Chicago/Turabian StylePierzchalski, Michał, Elżbieta Dagny Ryńska, and Arkadiusz Węglarz. 2021. "Life Cycle Assessment as a Major Support Tool within Multi-Criteria Design Process of Single Dwellings Located in Poland" Energies 14, no. 13: 3748. https://doi.org/10.3390/en14133748
APA StylePierzchalski, M., Ryńska, E. D., & Węglarz, A. (2021). Life Cycle Assessment as a Major Support Tool within Multi-Criteria Design Process of Single Dwellings Located in Poland. Energies, 14(13), 3748. https://doi.org/10.3390/en14133748