Article

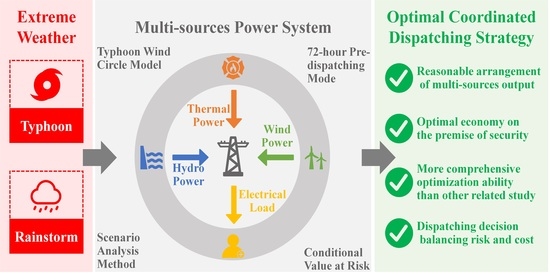
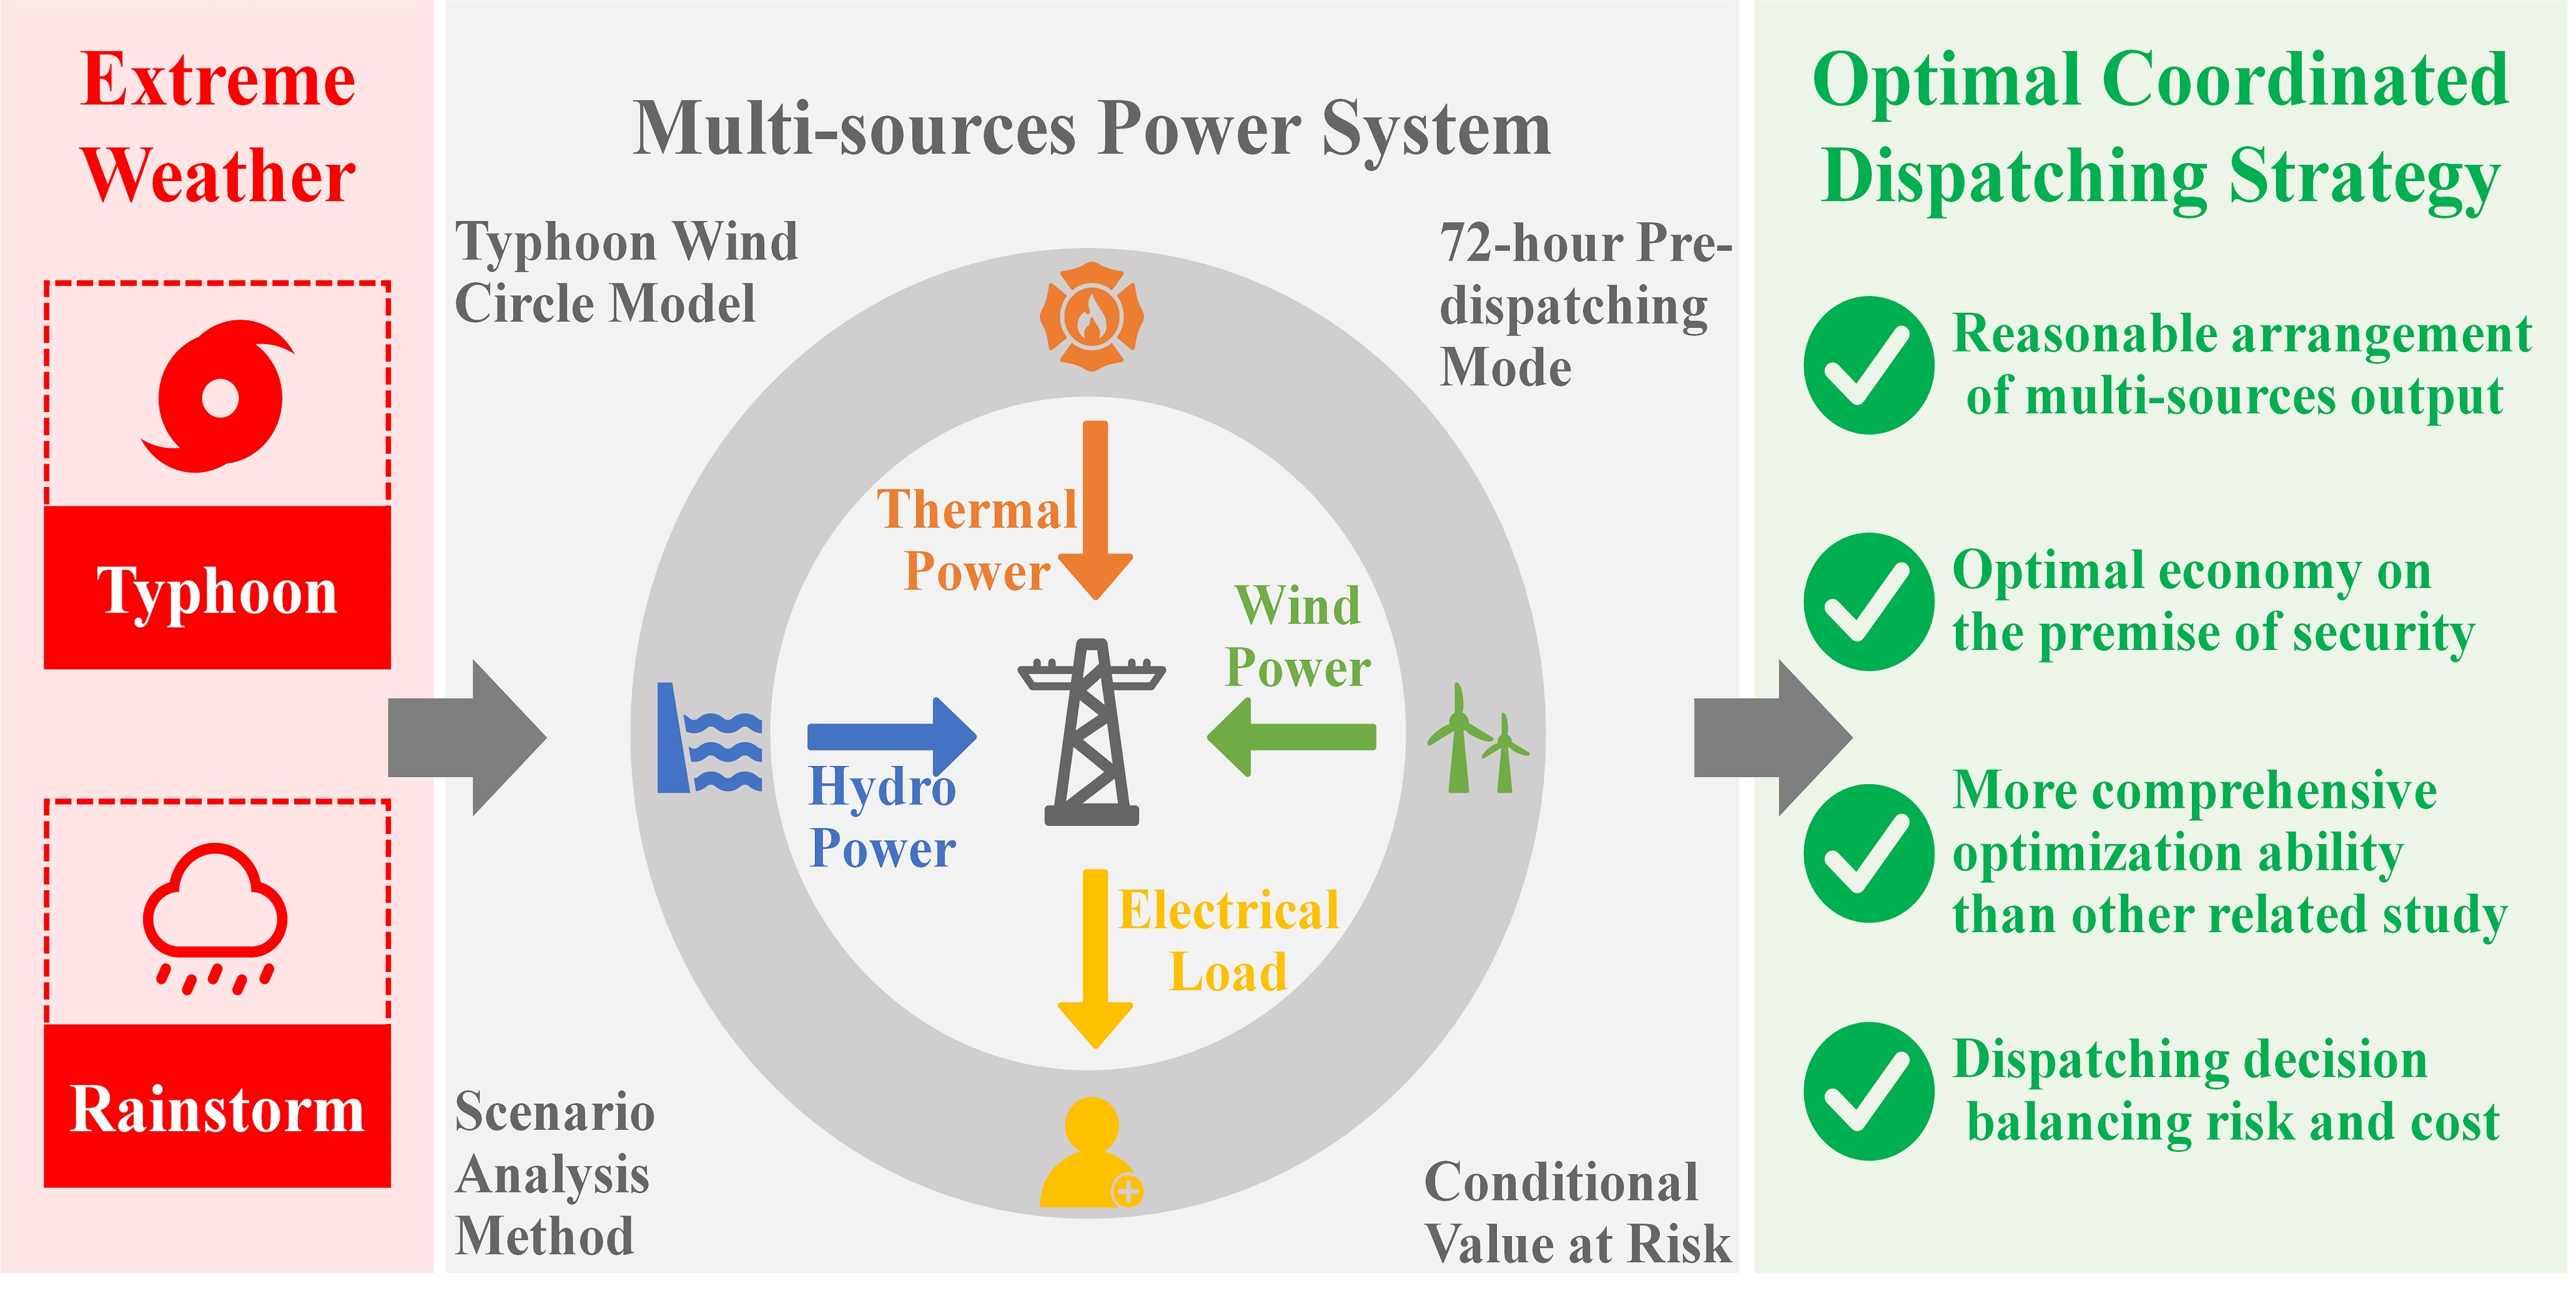
Optimal Coordinated Dispatching Strategy of Multi-Sources Power System with Wind, Hydro and Thermal Power Based on CVaR in Typhoon Environment

1
China Electric Power Research Institute Co., Ltd., Nanjing 210003, China
2
Polytechnic Institute, Zhejiang University, Hangzhou 310015, China
3
College of Electrical Engineering, Zhejiang University, Hangzhou 310027, China
*
Author to whom correspondence should be addressed.
Energies 2021, 14(13), 3735; https://doi.org/10.3390/en14133735
Submission received: 7 May 2021 / Revised: 10 June 2021 / Accepted: 16 June 2021 / Published: 22 June 2021
(This article belongs to the Special Issue Advanced Analytics in Renewable Energy)

Abstract

:
Typhoons and other natural disasters affect the normal operation of power systems thus it is an important goal for strong and intelligent power grid construction to improve the ability of power systems to resist typhoons and other natural disasters. Especially, an effective coordinated and optimized dispatching strategy for a multi-source power system is greatly helpful to cope with the impact of typhoons and other natural disasters on power system operation. Given this background, a typhoon wind circle model considering the temporal and spatial distribution of typhoons is established to obtain the input wind speed of the wind farm at first. Second, based on the initial input wind speed of wind farms, a typical scenario set of wind power output is constructed to reflect its fluctuation and uncertainty. Next, an optimal coordinated dispatching model of a multi-source power system with wind, hydro and thermal power based on the conditional value at risk (CVaR) is established with the target of minimizing the total cost of system dispatching, in which a 72 h pre-dispatching mode is studied to optimize the system operation for 72 h on the day before, on and after the typhoon. Finally, a revised 24-node transmission network system in a coastal area with typhoon is served as a case for demonstrating the effectiveness of the proposed model, and the simulation result shows that the proposed model could take the advantages of the coordination and complementarity of multi-sources power system and decrease the total cost of system dispatching and improve the renewable energy consumption level.

Graphical Abstract

1. Introduction

1.1. Impact of Natural Disasters on the Power Grid and the Increase in Installed Capacity of Renewable Energy Power Generation

As one of the most serious natural disasters, the typhoon is the strongest tropical cyclone in the tropical ocean and has the characteristics of strong, sudden, and destructive power. China is one of the countries suffering from the most severe global tropical cyclone disasters and there is an average of 7.2 typhoons landing in the southeast coastal areas of China every year, which causes a direct loss of about 0.4% of GDP [1]. Besides, the typhoon has a great impact on the operation security, stability, and economy of power systems. For the transmission network, the transmission line may be easily damaged, and the secure operation of power systems are threatened by storms and rainstorms. For the distribution network, large-scale distribution line tripping, tower collapse, disconnection, and other accidents caused by the typhoon are not uncommon [2]. For example, Typhoon Rammasun, which landed in Guangdong Province in July 2014, led to the outage of several 220 kV transmission lines; the super typhoon Mangkhut which landed in the coastal area of Guangdong Province on September 18th in 2018 led to the outage of more than 200 lines and the outage of nearly 6 million users [3,4]. The severe consequences of the typhoon on power systems indicate the vulnerability of the power system to the typhoon. Therefore, the urgent task to taking effective measures to improve the ability of power systems to resist typhoon disasters is an urgent one.
It is noteworthy that the global installed capacity of hydro and wind power is increased constantly every year [5]. For example, the installed capacity of renewable energy with wind and hydropower as the main installed capacity reached 7.94 million kilowatts by the end of 2019 in China, and their installed capacity increased by 9% year on year, which accounted for 39.5% of the total installed capacity [6]. However, in the context of the increasing installed capacity of renewable energy such as wind and hydropower, the operation security problem of power systems is more prominent [7]. Especially in extreme weather environments such as typhoons, wind farms and hydropower stations are affected to various degrees. For example, the storm or gale caused by a typhoon can lead to a short-term wind power increase, or force the wind turbine to stop, or even damage the wind turbine. If the sudden increase in wind power cannot be consumed by power systems in time, wind abandonment will occur, which can further lead to the decrease in power generation efficiency of power systems. While on the other hand, if the reserve capacity of power generation or the transmission capacity of a transmission line is not sufficient when the wind power suddenly decreases, the loss of load will occur, and further, the operation risk will increase. Meanwhile, a large amount of precipitation accompanied by the typhoon will also have a great impact on the output of hydropower stations and change the power generation proportion of various types of power sources in the system. It can be seen that the strong wind speed and heavy rainfall under typhoon disaster can both influence the output relationship of each power source and the system load level, which is extremely unfavorable to the secure, stable, and economic dispatching of a multi-source power system, so the research on relevant countermeasures is essential.

1.2. Research Status about Dispatching Strategies for Power Systems to Deal with Typhoon

At present, the research on dispatching strategies for power systems to deal with typhoon is mainly divided into two categories: prevention strategies before a typhoon occurs and recovery strategies after a typhoon occurs. For the stage before a typhoon occurs, reference [8] proposed a comprehensive response framework for the system under the preventive and emergency states, which was based on the two-stage robust mixed-integer optimization model. In [9], an online spatial risk analysis method was proposed, which can provide the regional damage risk of power systems affected by extreme events. In [10], a multi-objective dispatching strategy was optimized to improve the active disaster prevention ability of microgrids before typhoon occurs. For the stage after a typhoon occurs, a post-disaster system recovery strategy for the distribution network was proposed in [11]. By dividing multiple radial distribution systems which were powered by distributed generation in real-time dispatching, critical load recovery after a power failure was realized. Reference [12] proposed a power system model to simulate the passage of the hurricane and provided the restoration cost of the power grid. In [13], an optimal repair strategy was proposed to reduce the load loss during power supply restoration. To sum up, the current power system response strategy for the modeling of wind power generation scenarios under typhoon disasters is relatively simple and most of which are post fault execution strategies. Namely, few studies can comprehensively achieve the coordinated optimization of the entire process before, during, and after the occurrence of a typhoon. Therefore, the current dispatching method of power systems under typhoon disaster is not sufficient, and it is necessary to study the methods which can simultaneously construct the typical probabilistic scenario model and develop a dispatching strategy for the coordinated optimal dispatching of power systems with various power sources under typhoon disaster.

1.2.1. Overview of Typhoon Scenario Modeling

An effective coordinated optimal dispatching strategy for a power system in a typhoon environment emphasizes the accuracy of typhoon simulation. In typhoon simulation, according to the typhoon forecast information provided by the meteorological department, the distribution of the typhoon wind field is usually calculated by the predicted temporal and spatial evolution trend of typhoon through the existing empirical models [14,15,16,17]. Generally, the typhoon wind field calculation method of existing empirical models can be divided into two steps. One is the calculation of the gradient and moving wind speed which are the components of the typhoon wind field, and the other step is the modifying calculation for wind speed value according to geographical characteristics [15,16,17]. The existing technology on the modeling of the typhoon wind field has a certain degree of accuracy and is relatively mature. Based on this, some deterministic dispatching optimization methods for a certain forecast time of wind power forecasting curve have been proposed. The deterministic method is simple, practical, and easy to analyze, but the standby configuration is affected by subjective factors and lacks the principle of quantitative analysis, so it is unable to accurately balance the economy and reliability of the system [18]. With the gradual increase in the proportion of wind power integration, the uncertainty faced by the system scheduling is increasing, so it is necessary to change from the deterministic optimization method to the uncertain optimization method. Besides, there are few empirical models about the wind field of the typhoon, which can fully consider the fluctuation and uncertainty of wind power output and cannot accurately model the wind speed input of each wind farm under typhoon conditions.
The uncertain dispatching optimization method is analyzed from the perspective of wind power uncertainty modeling and the description of objective function and constraints. Additionally, the scenario analysis method is a technology that can take both the fluctuation and uncertainty of wind power output into account, which uses representative discrete scenarios to simulate the impact of wind power characteristics on system dispatching and consider the calculation efficiency and modeling accuracy at the same time. The key of the scenario analysis method is to obtain representative scenes, which mainly includes two aspects: scenario generation and scene reduction. Scenario generation can accurately model the uncertainty and volatility of wind power through sampling [19], the probability model [20], and the regression model [21,22], while scenario reduction can obtain representative scenarios with dual characteristics of the fluctuation and uncertainty of wind power through the elimination method based on probability distance [23] or elimination method based on clustering [24,25].
For the scene generation method, the existing literature either focuses on the modeling of volatility or focuses on the modeling of uncertainty, so it is difficult to give good consideration to the two characteristics. In the literature [26], Latin hypercube sampling is used to sample the wind power errors in different periods, and then the scene set is obtained. In the literature [27], the wind power error distribution is discretized based on Wasserstein probability distance to obtain the optimal quantile generating wind power scenario. Although this kind of scenario generation method can better reflect the uncertainty of wind power in a single time section, it ignores the fluctuation of wind power between periods, which also has statistical rules and cannot reflect the fluctuation characteristics of wind power. The historical prediction error statistics are estimated by the autoregressive moving average model in the literature [28], and then the wind power prediction error scene set is generated. Although this method considers the time series characteristics of wind power fluctuation and error, it sacrifices the fitting accuracy of single period error distribution to a certain extent. In contrast, the literature [29] proposed to use the multivariate normal distribution to represent the random process of wind power. By identifying the correlation of wind power between periods in the covariance matrix, the scenario generation method can well reflect the volatility and uncertainty. However, the fluctuation of wind power has the characteristics of the conditional distribution. Therefore, the problem of finding out how to generate a representative scenario considering both the fluctuation and uncertainty of wind power is still worthy of further study.
For the scene elimination method, it can be divided into probability distance-based elimination method [30] or clustering based elimination method [31] The two methods have their advantages and disadvantages; that is, the method based on probabilistic distance elimination includes the synchronous loop reduction method and the fast forward selection method, which will reduce the probability distance between the eliminated scene and the original scene by traversing the cables. When the number of original scenes is large, the amount of computation required will be very large, which will affect the computational efficiency. K-means clustering [32] and K-medoids clustering [33] are widely used in cluster-based subtraction methods, which have high computational efficiency and are suitable for the process of large-scale and high-dimensional data. The difference between the two methods lies in the choice of clustering. The calculated mean value of the scenes in the K-means clustering scene set is regarded as the central scene to form a clustering cluster. The clustering results do not come from the data and are highly sensitive to outliers; K-medoids clustering takes the scenes in the scene set as the clustering center, which can avoid the defect that K-means clustering is sensitive to extreme scenes. However, both of the two clustering algorithms randomly determine the initial clustering center, and it is easy to finally obtain the local optimal solution.
Therefore, a scenario reduction method can take into account both computational efficiency and accuracy. Namely, the application of the scenario analysis method in power system operation and dispatching still needs further discussion.

1.2.2. Overview of Wind Power Fluctuation and Uncertainty Modeling Based on Scenario Analysis Method

The existing literature has some research on modeling wind power fluctuation and uncertainty through scenario analysis methods. However, for the typhoon wind field model with spatial–temporal distribution, there is little research on the scenario analysis method considering the fluctuation and uncertainty of wind power output. Therefore, the issue of learning how to generate typical wind power scenarios that can accurately both reflect the fluctuation and uncertainty of wind power under typhoon environment is still the key to analyze the typhoon scenarios of wind farms by using the scenario analysis method. It is of great value to optimize scenario reduction efficiency and improve elimination accuracy to obtain representative scenarios that can accurately describe the characteristics of wind power. Aiming at the shortcomings of current research, a scenario generation, and scenario reduction method considering the conditional distribution characteristics of wind power fluctuation and the prediction error is established in this paper. To improve the elimination efficiency and make the scenarios more representative, an improved clustering algorithm is used to reduce the scenarios, and the typical representative scenarios of wind power fluctuation and uncertainty are generated efficiently and accurately. Finally, a multi-source power system optimal operation model considering the fluctuation and uncertainty of wind power under typhoon disasters is proposed, which can provide a reference for the system to deal with extreme disasters such as typhoons.
The high proportion of wind power integration brings operation risk and regulation costs to the system. Taking full account of the dispatching risk, a reasonable dispatching strategy is a key to coordinate the various kinds of power sources well. Reference [34] defines the degree of reserve tension caused by wind power stochastic scenarios and establishes a multi-objective optimal scheduling model considering the impact of wind power uncertainty on system reserve risk. Based on the method of scenario analysis, reference [35] established a quantitative analysis model for economic allocation of rotating reserve and non-rotating reserve, which comprehensively considered the loss of abandoned wind and loss of load. About [36], a standby decision-making model considering wind power and smart load prediction error and unit outage rate is established. The loss of load probability is used as the reliability evaluation index, and risk decision is made according to the risk attitude of system dispatching decision maker. Based on the method of scenario analysis, a two-stage stochastic optimization model including unit start-up and shutdown decision making and generation planning was established in reference [37]. The cost of wind curtailment and loss of load were included in the objective function. According to the probability density distribution of wind power and load, the economic cost of abandoning wind and losing load is estimated in reference [38].
It is not difficult to find from the above literature that under the condition of multi-source power integration, the system will inevitably face scheduling risk. It is necessary to consider the balance between the system risk loss and the cost of power generation dispatching when making the dispatching plan of a power system with wind power. It is of great significance to reasonably evaluate the economic risk of system dispatching and formulate the dispatching strategy to maintain the stable operation of a power system for the operation of a power system with a high proportion of renewable energy in the future. With the increasing proportion of renewable energy access, the risk of system operation is increasing. The idea of risk management in economics can be introduced into the optimal dispatching of the power system to realize better risk management and control. However, the existing literature rarely combines risk management with the cost–benefit analysis method to study the optimal dispatching of the multi-source power system. In this context, it is of significance to accurately quantify the output characteristics of wind power in the typhoon and reasonably model them, formulate a reasonable dispatching strategy, and deal with the operation risk brought by the random fluctuation characteristics of wind power.

1.3. Research Background, Significance and Task Summary

In summary, there are full studies on the theoretical research, model construction, and other aspects, which have a positive effect on improving the economy and reliability of the system operation. However, there are still some problems need to be studied further, which can include the following aspects: (1) the existing wind power scenario modeling methods cannot reflect the volatility and uncertainty of wind power under typhoons accurately, and the accurate expression of volatility and uncertainty is very important for the evaluation of dispatching strategy. The scenario generation and elimination method which takes into account the accuracy and calculation efficiency still needs to be studied in depth. (2) Most of the existing dispatching methods are based on the analysis of cost-effectiveness and expected mean value. However, this kind of method is difficult to accurately quantify the risk. With the grid-connected operation of wind power brings more uncertainty risk to the system, the risk control based on a combination of generation dispatching and risk management has become a problem that must be considered in system dispatching. (3) Few existing scheduling strategies for typhoons can consider the coordinated utilization of different operating characteristics in the three scheduling stages before, during, and after the occurrence of a typhoon. With the increase in demand for strong grid construction, a more comprehensive dispatching strategy to cope with a typhoon in the whole process should be studied more in-depth.
Therefore, given the shortcomings of the current research, a coordinated optimal dis-patching strategy of the multi-sources power system under typhoon disaster is constructed in this paper. Firstly, an improved scenario analysis method based on the typhoon wind circle model is proposed to obtain a probability scenario set of typical wind power output considering volatility and uncertainty accurately and efficiently. Secondly, the CVaR is introduced to optimize the model of economic risk loss caused by wind curtailment and load loss. The risk management and cost–benefit analysis method are combined, and the balance of unit generation cost and reserve cost and risk loss is comprehensively considered to formulate the dispatching strategy. Finally, a 72 h pre-dispatching model for 72 h on the day before, on, and after the typhoon is further constructed to achieve comprehensive optimization during the whole process of the system affected by the typhoon.
The rest of this paper is organized as follows. Based on the typhoon wind circle model, the scenario modeling considering wind power fluctuation and uncertainty is analyzed in Section 2. The coordinated optimal dispatching model of a multi-source power system with wind, hydro and thermal power based on CVaR in a typhoon environment is constructed in Section 3. The effectiveness of the model is verified by a regional transmission system in China in Section 4, and the main research results of the paper are summarized in Section 5.

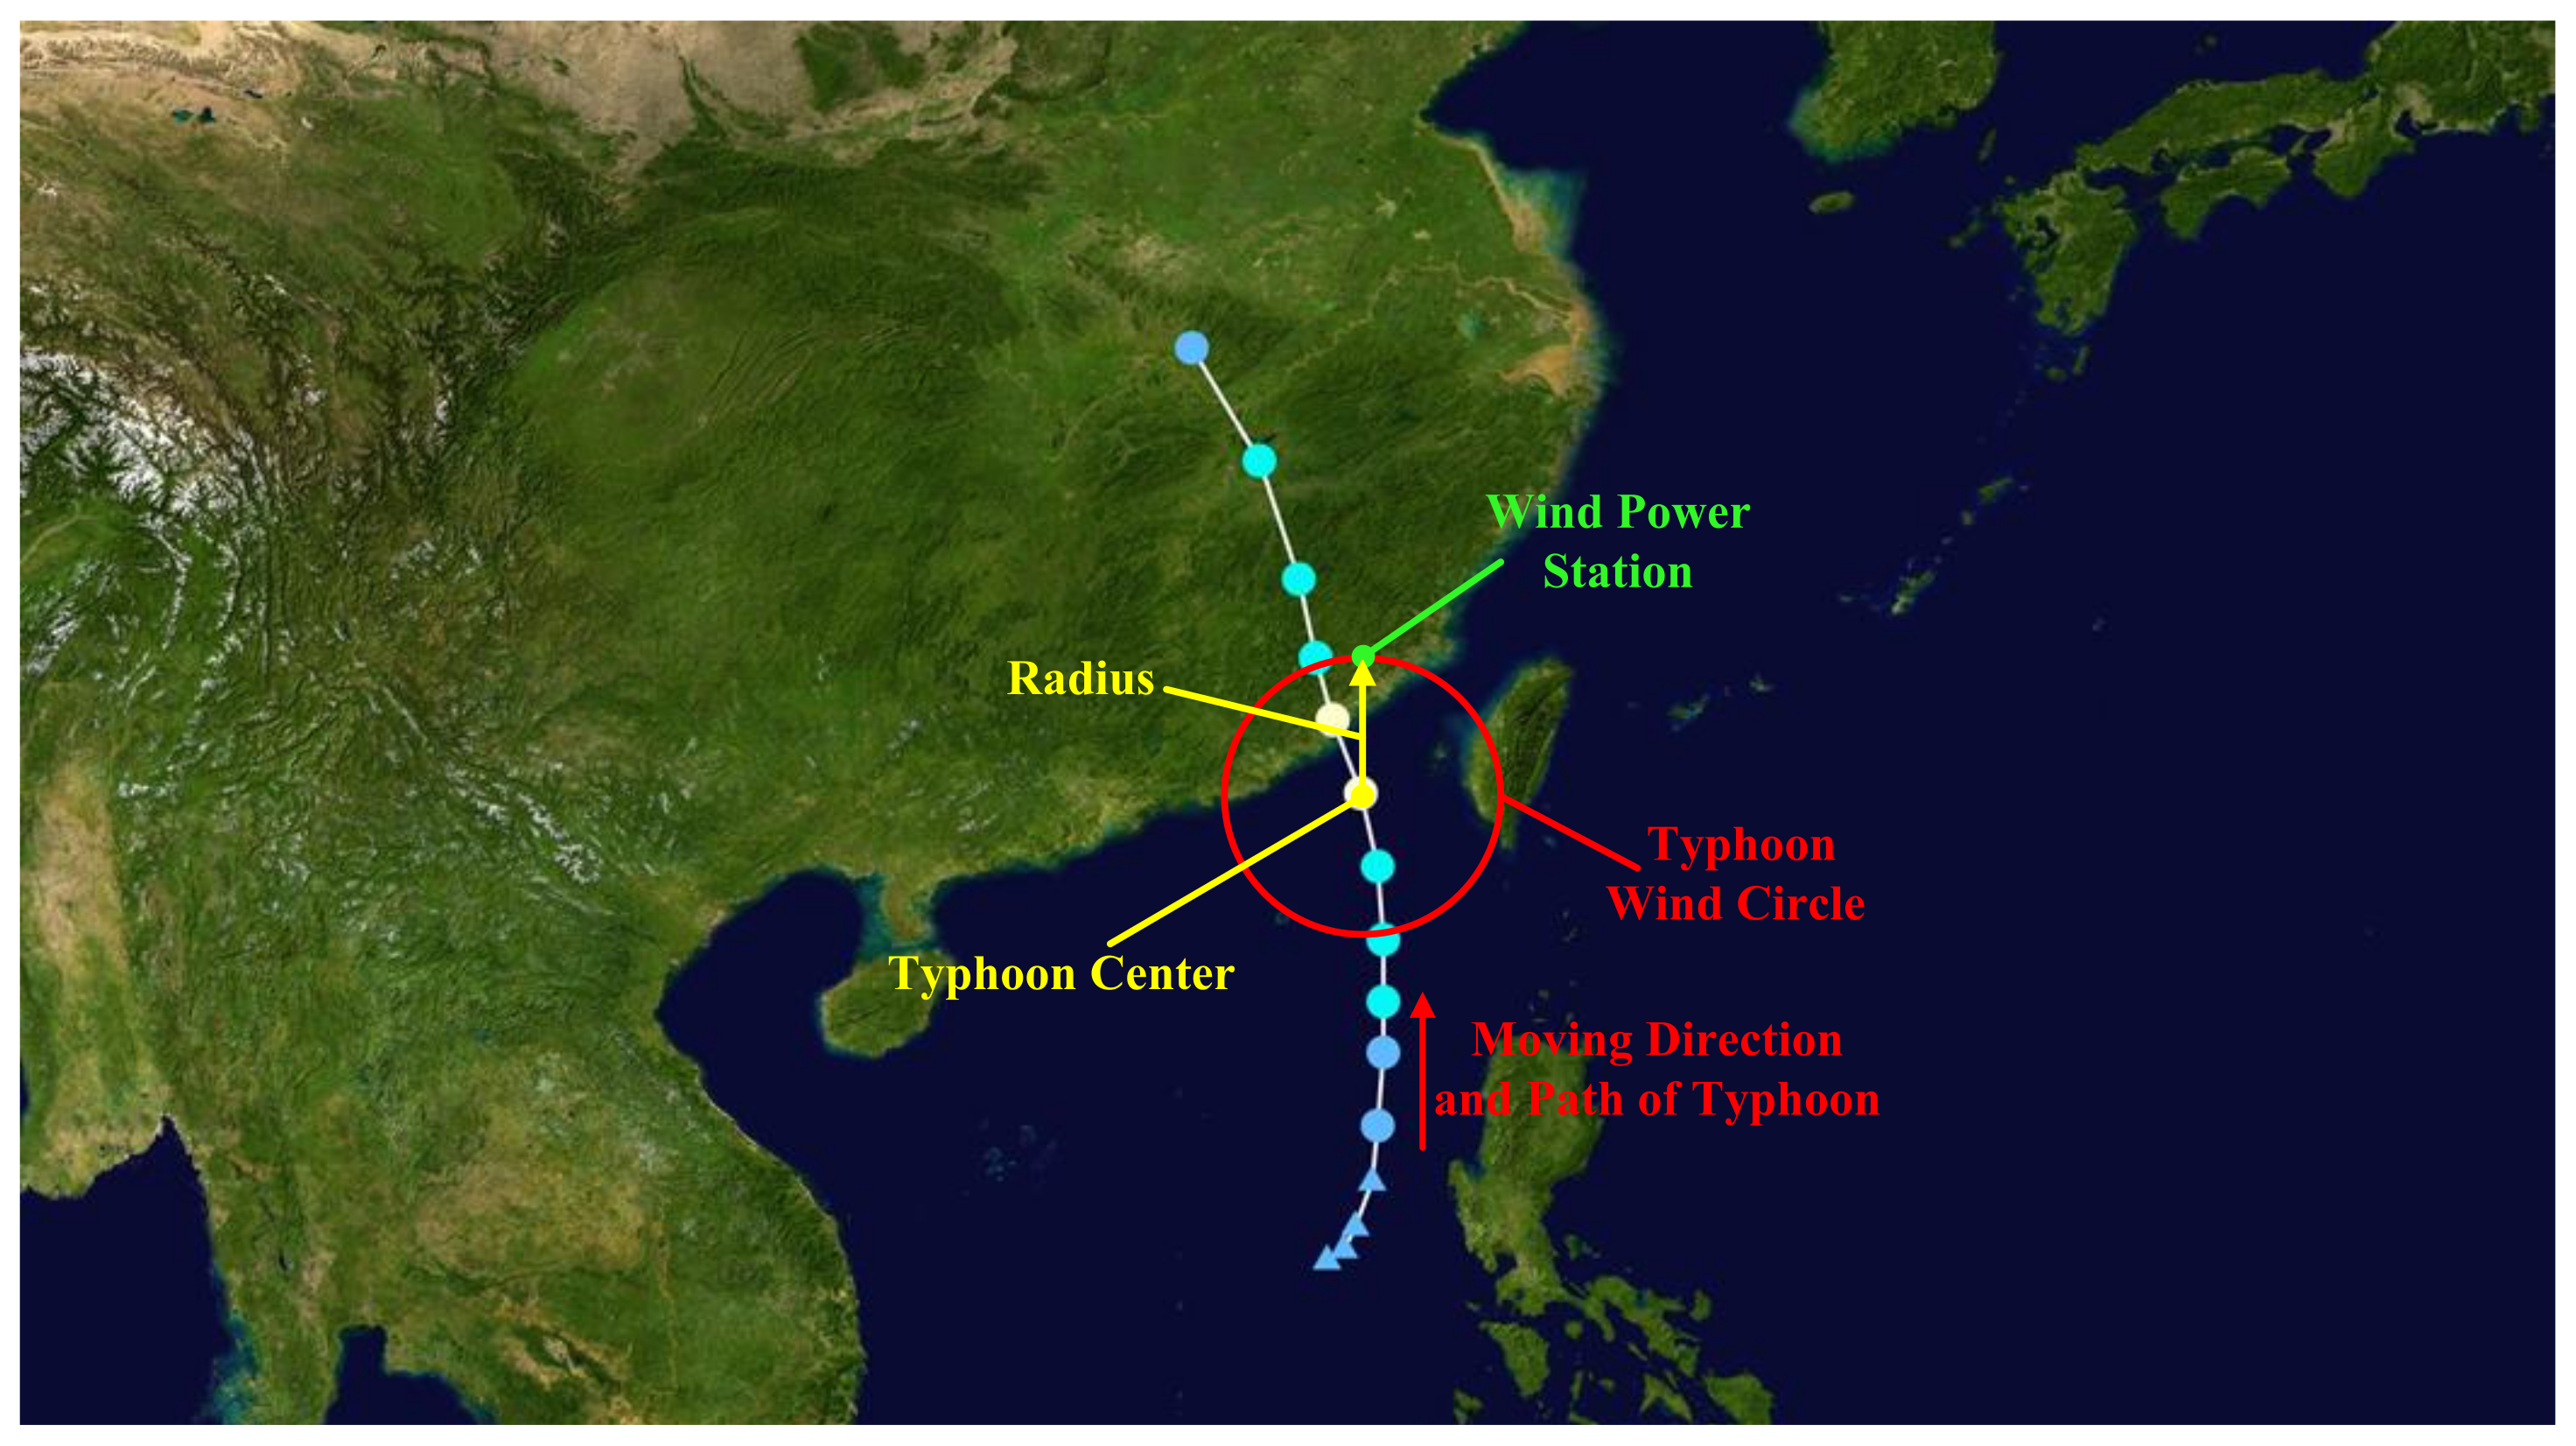
2. Scenario Modeling Considering Wind Power Fluctuation and Uncertainty Based on Wind Circle Model

2.1. Wind Circle Model

In a typhoon environment, the input wind speed of each wind farm depends on the time–space distribution model of the typhoon. To be more concrete, as shown in Figure 1, the output of the typhoon wind circle model is the wind speed of the point on the typhoon wind circle, whose center is the center of typhoon and radius is the distance from each power station to the center of typhoon, respectively. The initial wind speed scenario generated by the typhoon wind circle model reflects the dynamic characteristics of typhoons with time and can better reflect the impact of typhoons on system dispatching. Therefore, in this paper, the background wind speed of 10 m above the ground, which is based on the sum of the moving and circulation wind speed component vector, is constructed, and the modification of the typhoon wind circle model concerning the terrain of wind farms is also considered. The main modeling process is as follows.
  • Calculation of moving wind speed
According to Miyazaki’s model [30], the moving wind speed can be calculated by the following equation:
V d = V 0 exp π r 10 R max r = R arccos sin y 1 sin y 2 + cos y 1 cos y 2 cos x 1 x 2
where Vd is the moving wind speed of a certain point in the typhoon wind field; V0 is the moving wind speed of the typhoon center; r is the distance between the typhoon center and a certain point in the wind field; (x1, y1) and (x2, y2) are the longitude and latitude coordinates of the typhoon center and a certain point in the wind field, respectively; R is the average radius of the earth; Rmax is the maximum wind speed radius.
2.
Calculation of circulation wind speed
According to the Rankine model [31], the circulation wind speed can be calculated by the following equation:
V r = r R max V max r 0 , R max R max r V max r R max ,
where Vr is the circulation wind speed of the typhoon, and there is an internal declination angle between its direction and the counterclockwise tangential direction of the circular symmetric wind field; Vmax is the maximum wind speed of the typhoon, and 20 degrees is generally taken as the approximate value of it.
3.
Initial background wind speed vector synthesis calculation
The initial background wind speed is expressed as the vector sum of the moving and circulation wind speed, which is shown in Equation (3):
V = V d + V r
where V represents the initial background wind speed at a certain point in the wind field.
4.
Modifying calculation of background wind speed
The initial background wind speed only reflects the wind speed 10 m above the ground in the wind field, which cannot accurately reflect the actual impact of the wind farm’s terrain on the scenario wind speed. Therefore, the initial background wind speed needs to be corrected according to the actual micro terrain conditions of each power station. According to the wind direction and the micro topography of the power station, the wind borne by the power station can be divided into four types: front-slope wind, back-slope wind, along-slope wind, and transition-zone wind. In this paper, the modified wind speed of wind farm input under different terrain and different types of wind is expressed as the product of the initial background wind speed and the correction coefficient of the corresponding wind speed, which is shown in Table 1 [39].
As shown in Table 1, under the mountains and slopes terrain, the wind types of wind farms have a great difference in the modifying calculation method, in which the along-slope wind does not need to be corrected, the front-slope wind correction calculation is shown in Equation (4), the transition zone wind gets modified by decomposing into the along-slope wind and front-slope wind components, and the decomposition formula is shown in Equation (5). The flow components and vortices will appear on the back slope when the airflow crosses the top of the mountain. Therefore, the modifying calculation method of the back-slope wind is still inconclusive.
k = c 2 exp 0.07 Δ h
V t = V sin y tz V a = V cos y tz
where c is the slope angle coefficient, c = 0.8 when the slope angle is less than 20°, c = 0.9 when the slope angle is less than 30° but more than 20°, c = 1.0 when the slope angle is more than 30°; Δh is the height difference between the top and the foot of the mountain and if the correction coefficient at the top of the mountain is 1.0, the correction coefficient at the foot of the mountain is 0.5 (or 1.0), then the correction coefficient at other points can be determined by linear interpolation; V is the wind in the transition zone; ytz is the angle between the transition zone wind and the strike of the transition zone in the horizontal plane; Va and Vt denote the front and along with slope wind component which is decomposed by the wind in the horizontal plane, respectively.

2.2. Scenario Generation and Reduction Considering Uncertainty and Volatility of Wind Power

The rationality of the input wind speed dispatching scenario of wind turbine based on the wind circle model mainly depends on the prediction accuracy of the typhoon path and the accuracy of the wind circle model. In addition, the characteristics of wind power uncertainty and volatility have not been considered in the wind circle model. Therefore, the system dispatching strategy based on the wind circle model is not comprehensive and applicable. In this regard, the scenario analysis method is used to construct typical scenarios to reflect the uncertainty and fluctuation of wind power output. The optimal dispatching strategy is generated based on a typical scenario set, to obtain a more available and reasonable system dispatching strategy. This method mainly obtains a typical scenario set by scenario generation and scenario reduction. Between them, scenario generation generates a large number of scenarios to reflect the actual distribution of random variables using discrete sampling for continuously distributed random variables to complete the simulation of random events. Due to the redundancy of the generated scenarios, it is necessary to reduce the number of scenarios and obtain representative typical scenarios by clustering, to reduce the complexity of computing strategy and improve the efficiency of computing. The concrete scenario generation and reduction methods are described as follows.

2.2.1. Scenario Generation Considering Uncertainty and Volatility of Wind Power

As the wind power in each scenario is expressed as a multivariate random variable that follows a specific distribution, the method of multivariate normal distribution covariance matrix identification is used to generate a dynamic scenario that not only conforms to the uncertainty of wind power but also conforms to the volatility. The specific scenario generation method is as follows:
  • Partition of independent scenario generation segments
Due to the large difference in the distribution followed by the wind power prediction error in different wind power output intervals, it is necessary to divide several independent sub intervals according to the installed capacity of wind power, and, respectively, generate their wind power prediction error scenarios. After that, appropriate methods can be used to connect the independent scenario generation segments to form a more reasonable wind power prediction error scenario, which can reflect the realistic scenario of the electricity fluctuation better. Based on the output of the typhoon wind circle model in typhoon occurrence periods and the prediction information of wind power in the remaining dispatching periods, the power sequence is divided according to its output range as follows:
D s = D seg 1 , D seg 2 , , D segM
where Ds is the set of independent scenario segmentation sequences, Dseg1, Dseg2, …, DsegM are the independent scenarios under different wind power output intervals, respectively; M is the total number of segments.
B.
Determination of covariance matrix coefficients
The wind power error scenarios which reflect the fluctuation and time series characteristics of wind power can be obtained by the inverse transform sampling of the standard normal function values of each random variable in a series of random vectors which follow a multivariate normal distribution. Therefore, the mean value of the random vector following multivariate normal distribution is a zero vector, and the variance is expressed by the covariance matrix, as shown in Equations (7) and (8).
C = σ 1 , 1 σ 1 , 2 , , σ 1 , T σ 2 , 1 σ 2 , 2 , , σ 2 , T σ T , 1 σ T , 2 , , σ T , T
σ i , j = cov X i , X j = exp m n ε m = 1 , 2 , , T ; n = 1 , 2 , , T
where C is the covariance matrix of vector X; σ i , j is the covariance between variables Xi and Xj; ε is the covariance matrix coefficient, which reflects the time-series correlation of each variable; T is the dispatching cycle.
As the covariance matrix C reflects the correlation of wind power error time series, the larger the coefficient of the covariance matrix of adjacent random variables are, the smaller the fluctuation of the corresponding error scenario will be. Therefore, the correct selection of covariance matrix is the key to accurately reflect the fluctuation characteristic of wind power output. In this paper, the optimal covariance matrix for scenario generation is determined by minimizing the difference between the volatility distribution of wind power scenarios generated by different covariance matrices and the t location-scale distribution of historical wind power data. The specific expression of the objective function is as follows:
f e = min 1 N Z f pdf z f pdf _ e z
where he is the objective function for the identification of covariance matrix coefficients; Z is the set of equidistant points z on the fluctuation interval; N is the number of equidistant points; fpdf(z) and fpdf_e(z) are the function value of t location-scale distribution value of the generated scenario and historical wind power fluctuation data, respectively.
C.
Generation of segmented independent scenarios
Latin hypercube sampling is used to determine the optimal covariance matrix, and the matrix is used to generate random numbers which follow a multivariate normal distribution. The standard normal distribution function value of each random number is calculated, and the error scenario of each segment is obtained by inverse transformation of the prediction error’s cumulative distribution so that the obtained error scenario can follow the prediction error distribution of prediction value in each period and follow the joint probability distribution of the prediction error across periods. In addition, the segmented wind power scenario is the sum of the error scenario and the predicted power sequence.
D.
Connection of segmented independent scenarios
By connecting the adjacent scenarios in turn, the scenario generation considering the uncertainty and volatility of wind power is completed. The principle of connection is to sort the previous segmented scenarios set in descending order according to the value of wind power scenarios in the last column, and the latter segmented scenarios set is sorted in descending order according to the first column to connect the rearranged segmented scenarios adjacent to the sequence. The wind power scenarios obtained by this connection method can not only ensure that each segmented scenario can meet different holding points of volatility in different wind power output range, but also ensure that the fluctuation of the scenarios at the connection point is approximately equal to the fluctuation of the wind power forecast power in this period.

2.2.2. Scenario Reduction Considering Uncertainty and Volatility of Wind Power

Scenario reduction reduces a large number of original scenarios to a small number of typical scenarios which can reflect the fluctuation and uncertainty of wind power output. The main idea of the scenario reduction technology in existing research is the clustering method, in which K-means and K-medoids algorithms are widely used, and the K-medoids algorithm has better global optimization performance in the scenario reduction process. Therefore, the improved K-medoids algorithm is introduced to achieve the scenario reduction, which is based on the selection of the initial clustering centers and mainly composed of the selection of the initial scenarios and the refreshment of the clustering centers. The calculating steps of the K-medoids clustering algorithm are as follows:
(1).
Initialize the remaining scenarios set and start to count the clustering scenarios;
(2).
Select the remaining scenarios according to the principle of minimum distance variance and establish the cluster centers set;
(3).
Calculate the neighborhood scenarios set of each scenario in the cluster center and update the remaining scenarios set by eliminating the neighborhood scenarios set of the remaining scenarios set;
(4).
Judge whether the clustering scenarios’ counting value meets the preset clustering number K or not. If so, the initial scenarios generation ends; otherwise, return to step (2);
(5).
Calculate the Euclidean distance between each scenario and each cluster center and allocate the clusters according to the principle of minimum distance;
(6).
Determine the new cluster centers according to the principle of a least square sum of clustering error;
(7).
Redistribute all scenarios and recalculate the square sum of clustering errors under the new cluster;
(8).
Judge whether the sum of squares of clustering errors meets the convergence condition or not. If so, clustering ends; otherwise, return to step (6).

3. Coordinated Optimal Dispatching Model of Multi-Sources Power System with Wind, Hydro and Thermal Power Based on CVaR in Typhoon Environment

3.1. Objective Function of Coordinated Optimal Dispatching Model for Multi-Sources Power System with Wind, Hydro and Thermal Power in Typhoon Environment

In the optimal dispatching of the power system, the objective of optimal operation economy is usually used to implement optimal dispatching, while in the case of abnormal environmental phenomena such as typhoons, operation security is the premise of economic dispatch. Thus, for the purpose of network protection and the convenience of model solving, the cost of network protection is introduced as a security-related index into the objective function of the proposed optimization model in this paper. Additionally, for the remaining part of the objective function, clean energy, hydro, and wind power are generally considered to have very low economic consumption, so the wind and hydro dispatching cost can be ignored compared with thermal power. Namely, the minimum coal consumption of thermal power plants is considered as a significant part of the objective function in the joint optimal dispatching model of wind, hydro and thermal power systems. During the typhoon period, there is a probability that the short-term extreme operation scenarios caused by the typhoon will lead to serious wind and water abandonment, and further result in the waste of resources and bring the risk of secure and stable operation of the power system. Therefore, in order to cope with the adverse operating environment under typhoon disaster, the cost of network security protection, the coal consumption cost of thermal power, and the cost of wind and water abandonment should be taken into account in the optimal dispatching of power systems, so as to make the system optimization effectiveness more comprehensive. Then, the specific objective function expression is as follows.
f = f ope + f hab + f wab + f res + f sec f ope = t = 1 T i = 1 N T ( a i P T i , t 2 + b i P T i , t + c i ) f hab = t = 1 T j = 1 N H C H j P Q S H j , t f wab = t = 1 T k = 1 N W C W k P W a k , t f res = t = 1 T i = 1 N T C resu , i R restu , i , t + i = 1 N T C resd , i R resd , i , t f sec = C sec t = 1 T b = 1 N B ( | P l , b , t P l , b , sub max | + | P l , b , t + P l , b , sub max | 2 P l , b , sub max ) P l , b , sub max = P l , b , max ε l
where fope, fhab, fwab, fres and fsec, respectively represent the coal consumption cost of all thermal power plants, the water abandonment cost of all hydropower stations, the wind abandonment cost, the upper and lower rotating reserve cost of the system and the cost of network security protection during the dispatching period; f is the sum of the above five types of costs; ai, bi and ci, respectively represent the coefficients of the secondary, primary and constant terms of power generation in the coal consumption characteristics of thermal power unit i; CHj, CWk, Cresu,i, Cresd,i and Csec represent the unit price of water abandonment cost of hydropower station j, the unit price of wind abandonment cost of wind farm k, and the unit price of upper and lower reserve cost of thermal power plant i and network security protection cost, respectively; NT, NH and NW represent the number of thermal power, hydro and wind power units, respectively; PTi,t represents the generation power of thermal power plant i in the dispatching period t; PQSHj,t and PWak,t represent the hydropower abandonment of hydropower station j and the wind power abandonment of wind farm k in the dispatching period t, respectively; Rresu,i,t and Rresd,i,t represent the up and down rotation reserve power of thermal power unit i in the dispatching period t, respectively; Pl,b,t is the transmission power of branch b in DC power flow model in dispatching time t; Pl,b,max and Pl,b,submax are the upper and secondary upper limit of transmission power of branch b; εl is the reserved transmission power for the protection of network security.
According to the relationship between coal consumption and the thermal power output [40], the coal consumption can be expressed by the quadratic function of thermal power. Additionally, because the cost of coal consumption is the product of the coal consumption and its unit price, the coal consumption cost of thermal power turbines can also be expressed as a quadratic function of thermal power shown in Equation (10). Besides, because the system needs cost for rotating reserve, the upper and lower rotating reserve cost of the system should also be contained in the objective function. Additionally, about the form of upper and lower rotating reserve cost of reference [41], the upper and lower rotating reserve cost of the system can be expressed by the product of the upper and lower rotating reserve power and their unit price shown in Equation (10). Additionally, for the purpose of reducing hydro and wind power abandonment, the objective function in Equation (10) contains the cost of wind and hydropower abandonment that is linearly related to the power of the abandonment of wind and water [42]. Similarly, in order to limit the transmission power below the range allowed by network security, the cost of network security protection is introduced to the optimization goal of the proposed model. Additionally, the expression proportional to the over-limit transmission power is the most direct control method, so the cost of network security protection is defined as the product of the over-limit transmission power and its unit price. In addition, it should be noted that the transmission power limit in Equation (10) is a sub-limit, which is slightly less than the maximum transmission value. This is because a major impact on network security is strictly not allowed, and the network security constraint is taken as the guarantee of network security. In this situation, taking the security-related index as one of the optimization goals is equivalent to a strategy to protect the network with the guidance for transmission power being as far as possible from the safety boundary.
Considering the strong volatility and uncertainty of wind power output during a typhoon, the existence of prediction error will make the dispatching plan inaccurate. For example, when the actual value of wind power output is lower than the predicted value or the actual value of the load is higher than the predicted value, it is necessary to increase the power supply or reduce part of the load to ensure the power balance. Otherwise, wind abandonment will occur when the power prediction is too small and the load prediction is too large. Anyway, the system will suffer varying degrees of economic loss. Therefore, the CVaR theory is introduced to measure the economic loss risk which is caused by wind power output prediction error.
Quantitative risk assessment evaluates the probability and size of system loss, to accurately measure the risk of system operation. Value at Risk (VaR) refers to the maximum possible loss (gain) value of a portfolio under market uncertainty with normal market conditions and given confidence level. VaR can measure the investment risk, which is widely used in the financial field. However, it is not a consistent risk measurement and does not meet both the additivity and the convexity in mathematical calculation. Besides, CVaR can only reflect the risk situation under a certain confidence level and cannot consider the degree of economic loss when adverse circumstances occur. Therefore, given the shortcomings of VaR, the measurement method of CVaR was proposed in 2002 [43]. The definition of CVaR refers to the average loss value in a certain investment cycle when the risk loss of the portfolio is higher than the VaR value under a given confidence level [44]. The CVaR value can be expressed by Equation (11).
M CVaR ( Z Z ) = E [ f ( Z Z , λ ) f ( Z Z , λ ) > M VaR ( Z Z ) ]
where Zz is the optimization variable matrix of the model established in this paper, including thermal and hydropower, abandoned wind and abandoned water, and other related variables; MCVaR(Zz) and MVaR(Zz) are CVaR and VaR values corresponding to Zz, respectively; f(Zz, l) is the corresponding loss function of Zz, and in this paper, it refers to the total cost of wind power output prediction error in each scenario; λ is the continuous random variable that may affect the loss function, and in this paper, it refers to the actual value of wind power output; E[·] represents the mathematical expectation.
In practical application, the calculation of CVaR can be transformed into a linear constraint with discrete variables, which is convenient for calculation. The calculation formula of CVaR in discrete scenarios is shown in Equation (12).
F α ( x , h ) = h + 1 S 1 α s = 1 S f x d , y s h +
where Fa(x,h) and h represent CVaR and VaR in discrete scenarios, respectively; α represents confidence level; xd represents the decision variable; S is the number of all discrete scenarios; ys is the value of the random variable in the sth discrete scenario. It is assumed that the probability of all discrete scenarios is the same.
The above loss calculation method based on expectation homogenizes all losses and tends to ignore the serious losses caused by extreme scenarios. Therefore, CVaR is used to measure the loss of wind power output probability scenario in a multi-source power system coordinated optimization when considering wind power output volatility and uncertainty in typhoon environment in this paper. The loss refers to the economic loss of wind abandonment and load loss corresponding to the probability scenarios in system dispatching. The CVaR of economic loss of abandoning wind and losing load is as follows [45].
F α ( x d , η ) = η + 1 1 α s = 1 S P s z s s . t .   η f x d , y s z s , z s 0
where Ps is the probability of scenario s, zs is an auxiliary variable, which represents the system’s loss exceeding part contract VaR in scenario s.
In conclusion, on the basis of conventional multi-source power system optimal dispatching, which takes the dispatching cost of thermal power units as the objective function, this paper comprehensively considers the possible wind and water abandonment process during a typhoon and adds the wind and water abandonment cost into the objective function to mobilize the coordination and complementarity ability of each power source in the system, so as to ensure the system can maximize the consumption of renewable energy output on the condition of ensuring the normal operation of the unit. Besides, the fluctuation and uncertainty of wind power is considered, and the CVaR theory is used to model the tail risk of the system caused by the uncertain dispatching scenario of wind power output, and the system optimization decision model based on expectation is transformed into the multi-source coordinated optimization model based on CVaR, which can be expressed as follows:
F = min f + 1 λ s = 1 S P s C W , s + λ C W C V a R , s C W , s = t = 1 T c aban Δ P s , t , Δ P s , t > 0 t = 1 T c loss Δ P s , t , Δ P s , t < 0 C W C V a R , s = η + 1 1 α s = 1 S P s z s s . t .   η C W , s z s , z s 0
where F is the objective function of the coordinated optimal dispatching model for a multi-source power system with wind, hydro and thermal power based on CVaR in typhoon environment, and the value range of λ is λ∈[0, 1], which indicates the decision makers’ risk attitude when making decisions. The larger the value is, the more risk-averse the decision maker is. CW,s, and CWCVaR,s represent the economic loss and CVaR of system wind power abandonment and load loss under different scenarios, respectively. caban and class denote the penalty price of system wind power abandonment and load loss, respectively; ΔPs,t indicates the difference between the predicted power output and the scenario output of the system in scenario s at the time of t, ΔPs,t > 0 means the abandoned wind power occurs when the wind power output at dispatching time t is greater than the predicted value in scenario s, and ΔPs,t < 0 means the load loss power occurs when the wind power output at dispatching time t is less than the predicted value in scenario s.

3.2. Constraints of Coordinated Optimal Dispatching Model for Multi-Sources Power System with Wind, Hydro and Thermal Power in Typhoon Environment

The constraints of the model are composed of the system constraints in the initial scenario and the generated probability scenarios. In the initial scenario, the system constraints include thermal power dispatching constraints, hydropower dispatching constraints, wind power operation constraints, and system power balance and secure operation constraints, while in the generated probability scenarios, system constraints include thermal power reserve constraints and system power balance constraints. The concrete constraint expressions are analyzed below.

3.2.1. Thermal Power Units Constraints

Limited by the inherent generating capacity and technical conditions of the generator set, the thermal power units shall meet the limitations of minimum and maximum technical output during normal operation, which is expressed as Equation (15). At two adjacent dispatching moments, the output variation of the thermal power unit has a maximum value, which is expressed by Equation (16). Considering the physical properties of thermal power units and the needs of the operation, maintenance, and overhaul, only when the thermal power units meet the minimum continuous running or shutdown time can the operation state be switched, which is shown in Equation (17) [46].
A.
Technical power output constraint:
u i , t P i , min P T i , t u i , t P i , max
where Pi,max, and Pi,min are the upper and lower power output limitations of thermal power unit I, respectively. ui,t is the operational status of the ith thermal power unit at the tth dispatching time, and ui,t = 1 refers to the running state while ui,t = 0 refers to the shutdown state.
B.
Upper and lower limitations of power variation:
R D i P T i , t P T i , t 1 R U i
where RUi and RDi are the upper and lower power variation limitations of thermal power unit i, respectively.
C.
Minimum startup as well as shutdown time constraint:
T o n i , t 1 T o n i , min u i , t 1 u i , t 0 T o f f i , t 1 T o f f i , min u i , t u i , t 1 0
where Toni,min, and Toffi,min are the minimum value of continuous operation and outage time of thermal units i, respectively.

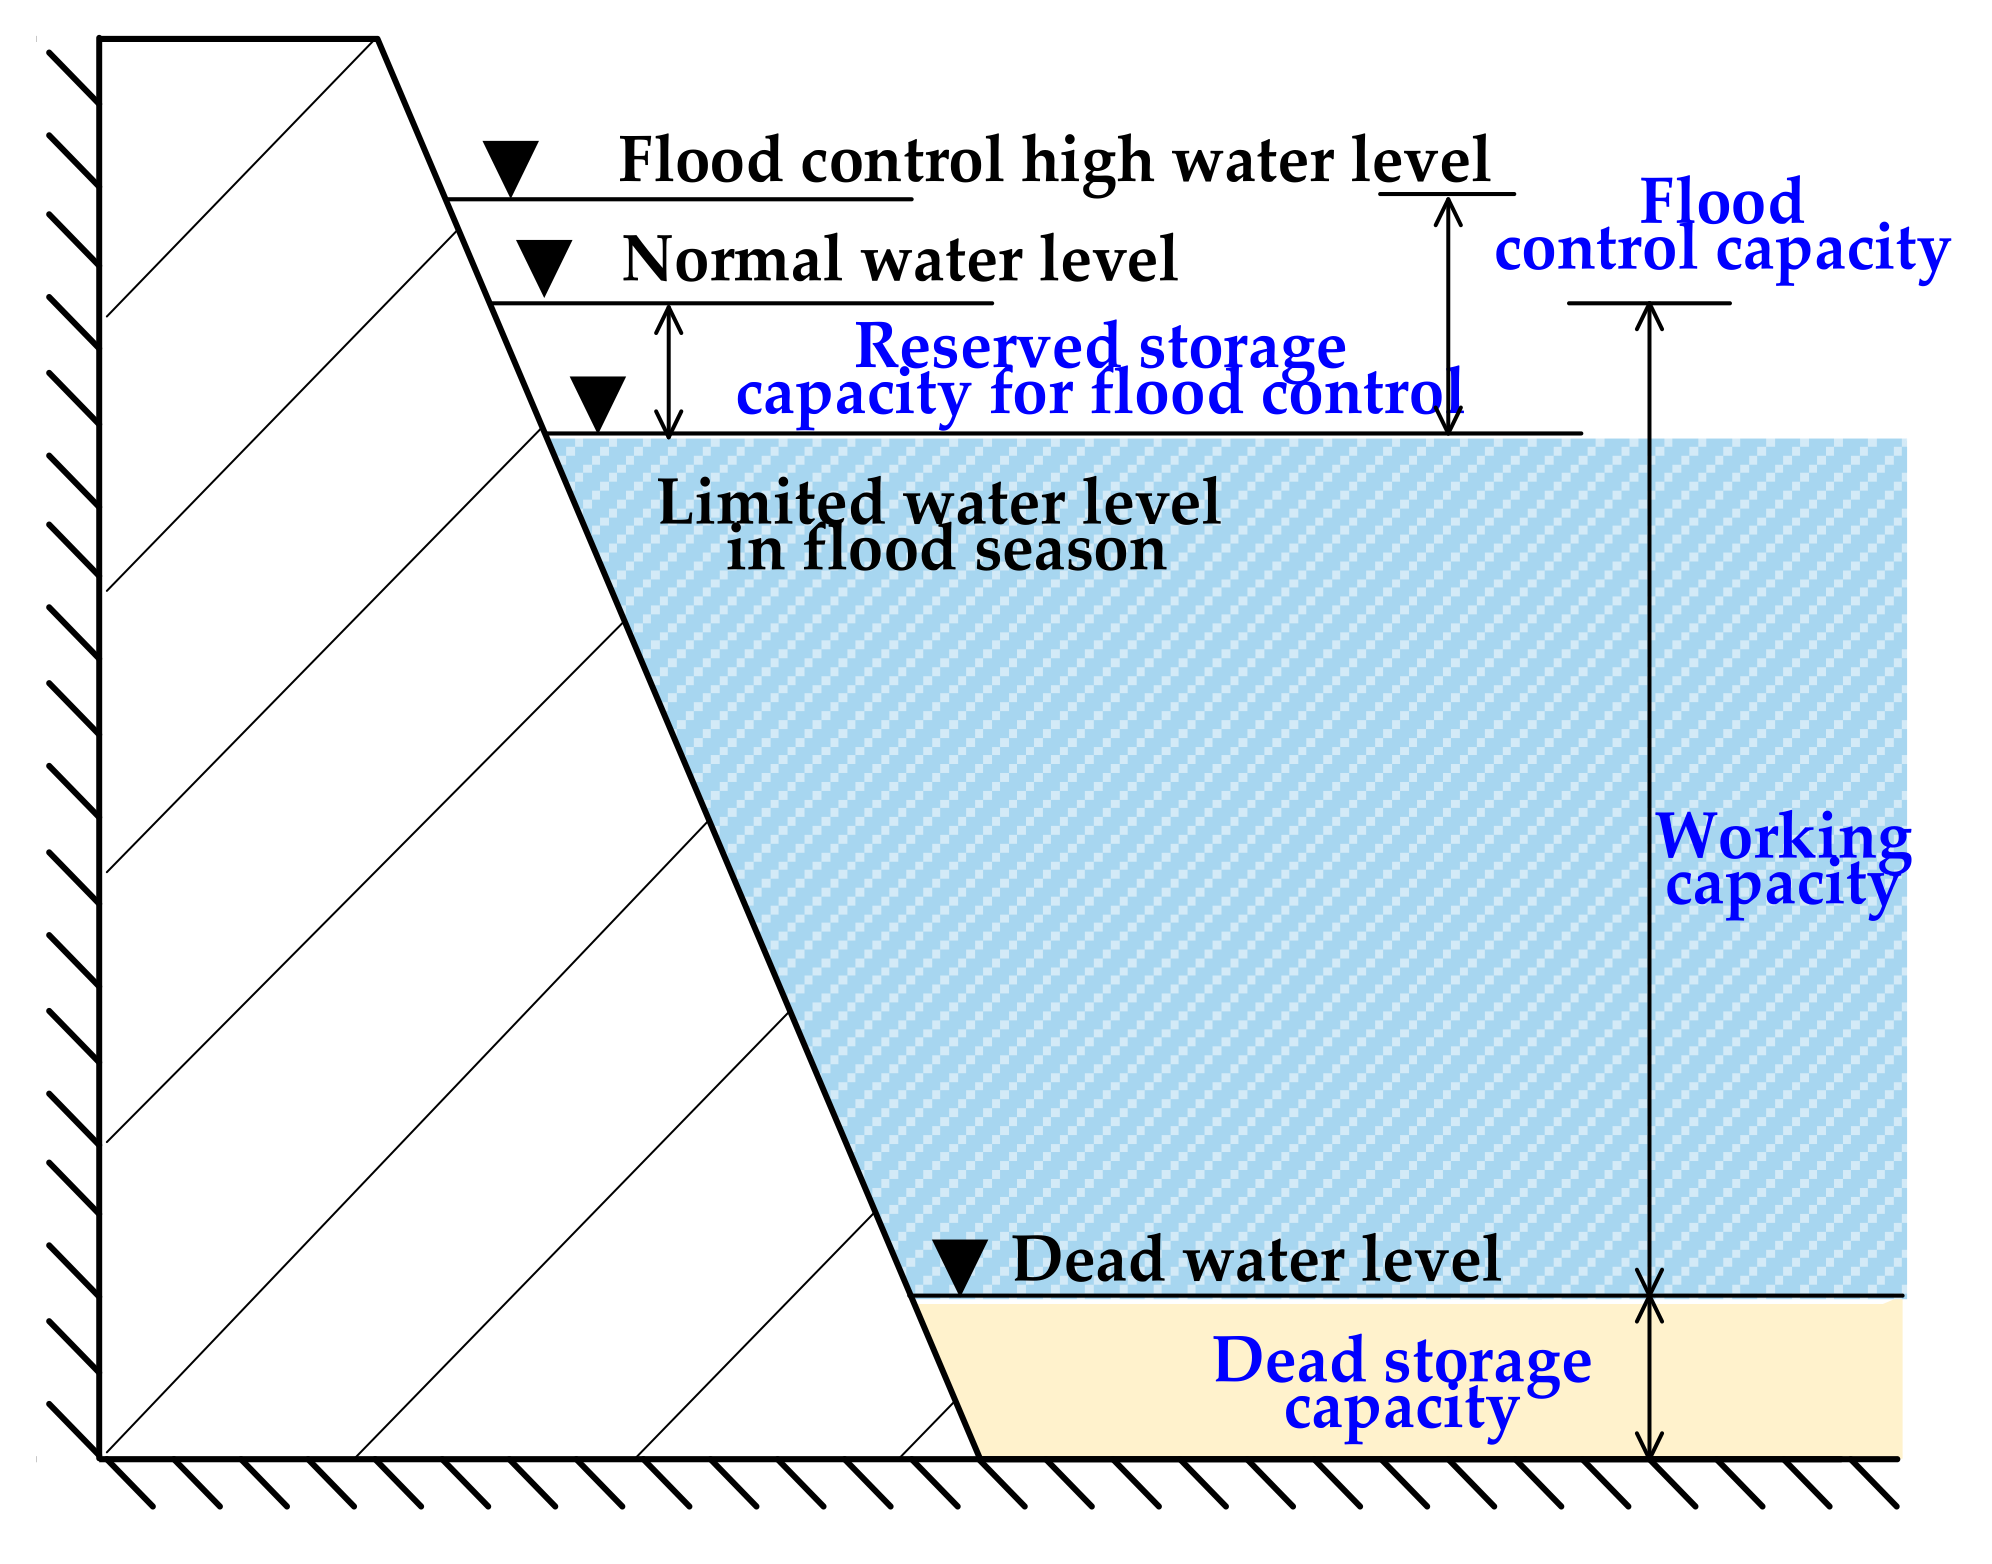
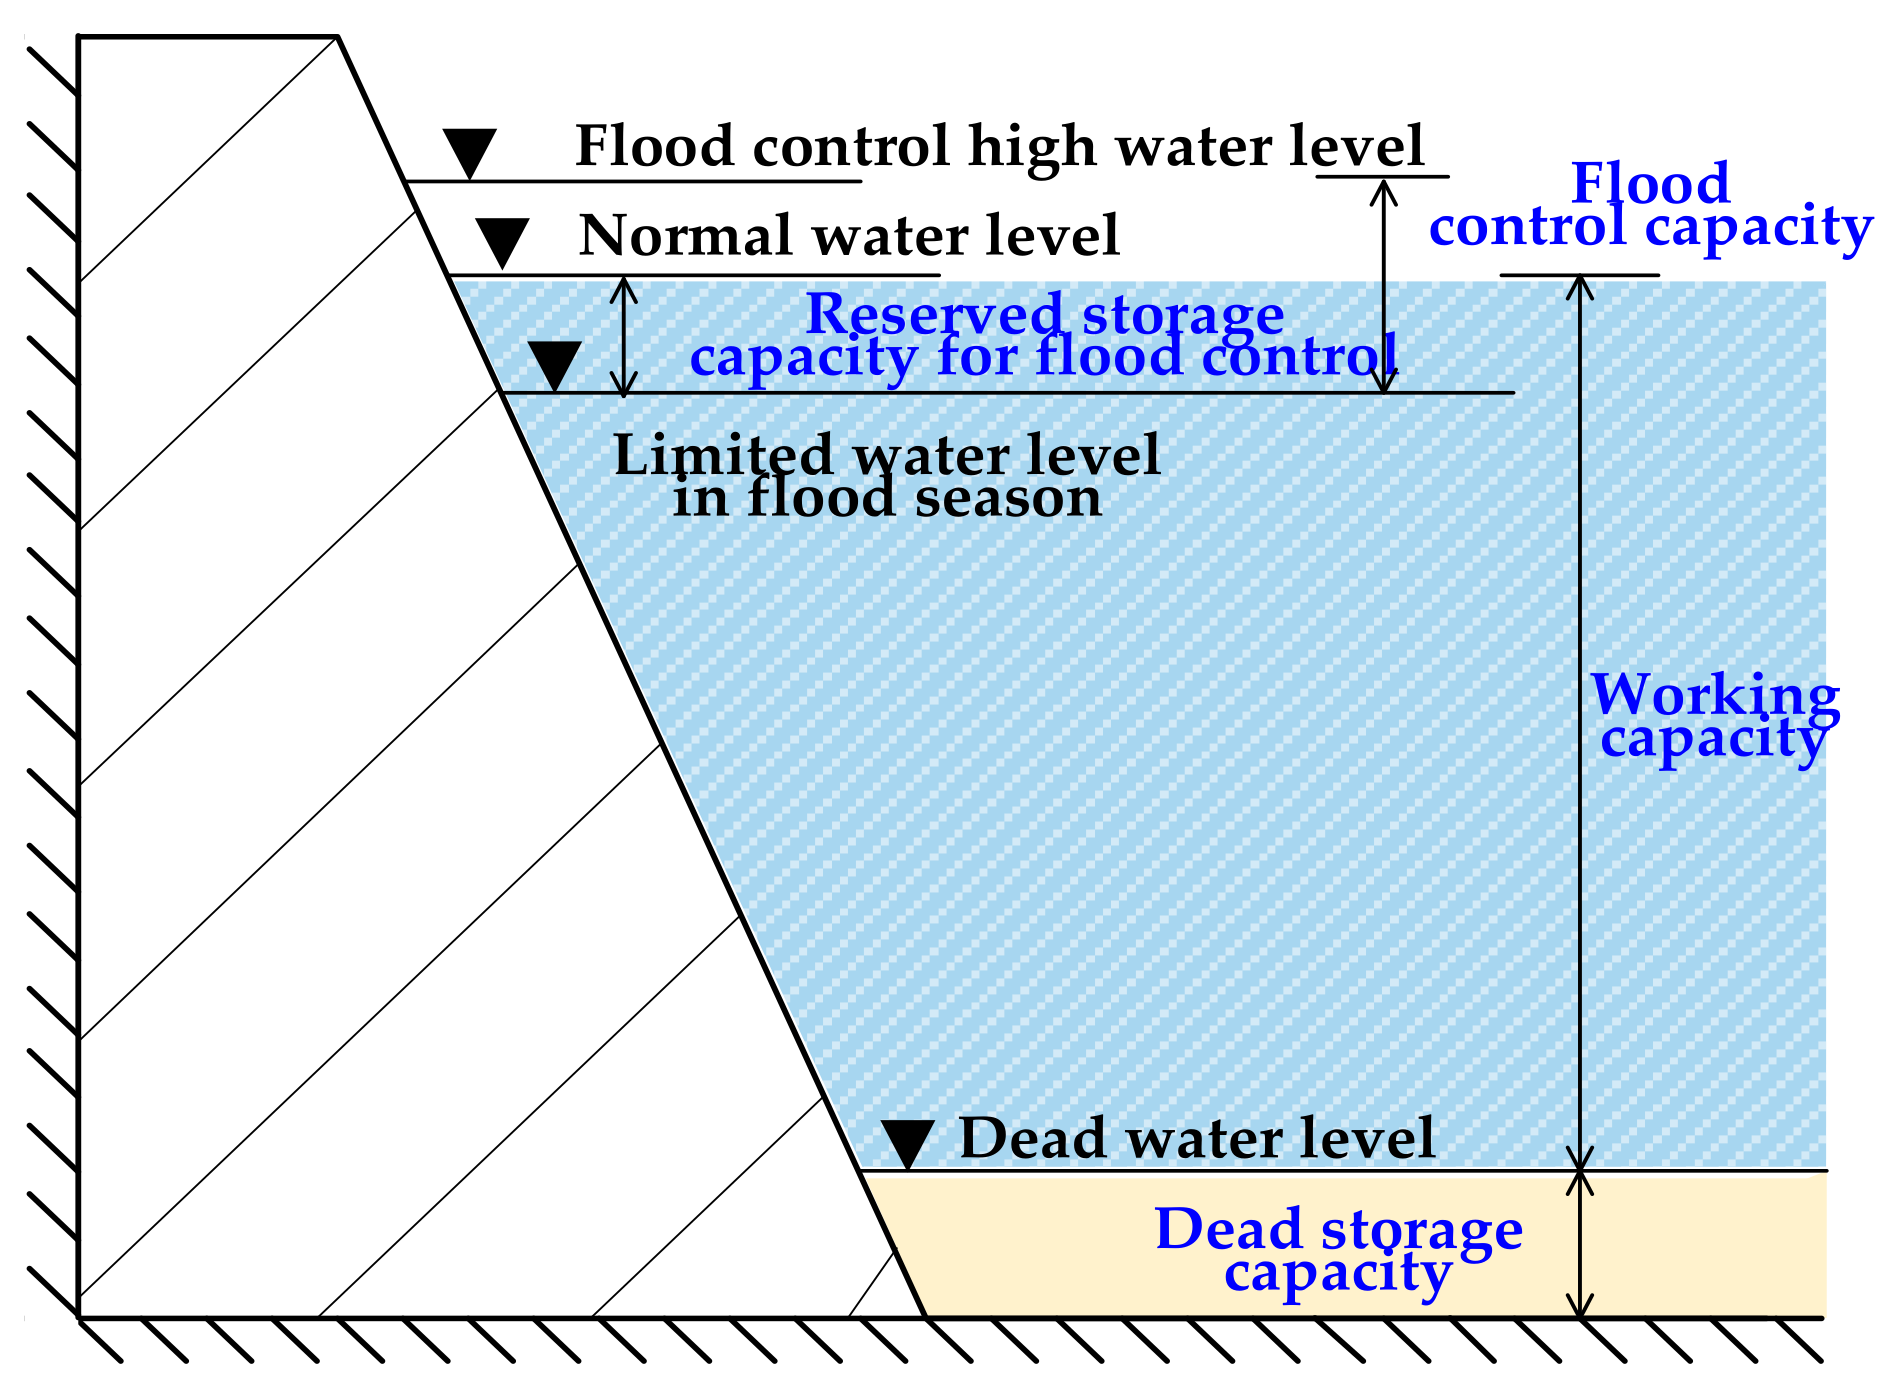
3.2.2. Hydropower Units Constraints

The hydropower output is considered as the fitting function related to reservoir capacity and generation flow, and the specific expression is shown in Equation (18). The upper and lower limitations of storage capacity and power output are shown in Equations (19) and (20), respectively. The reservoir capacity of the hydropower station is dynamically adjusted with natural runoff, discharge volume of upstream reservoirs, and reservoir discharge volume at each dispatching time, and the dynamic change process of reservoir capacity is shown in Equaiton (21) [47].
A.
Power conversion relationship of hydropower:
P H j , t = h 1 j V H j , t q H j , t + h 2 j V H j , t + h 3 j q H j , t + h 4 j
where VHj,t and HQ,t, respectively, represent the reservoir capacity and power generation flow of hydropower station j at dispatching time t; h1j, h2j, h3j, and h4j are the hydropower conversion coefficients of hydropower station j.
B.
Reservoir capacity constraint of hydropower station:
V j , min V H j , t V j , max
where Vj,max, and Vj,min are the upper and lower capacity limitations of reservoir j, respectively.
C.
Power output constraint of hydropower station:
P j , min P H j , t P j , max
where Pj,max, and Pj,min are the upper and lower power output limitations of hydropower unit j, respectively.
D.
Dynamic balance constraint of reservoir capacity:
V H j , t = V H j , t 1 + Q H j , t + k = 0 N H u p j R H u p k , t R H j , t Δ t H R H u p j , t = q H u p j , t + q s H u p j , t ,   R H j , t = q H j , t + q s H j , t
where QHj,t, and RHj,t represent the natural and discharge flow of hydropower station j at operation time t, respectively; Δ t H represents the dispatching time interval; RHupj,t, qsHupj,t and qHupj,t represent the discharge flow, abandoned water flow and power generation flow of upstream reservoir k of hydropower station j at dispatching time t, respectively.

3.2.3. Wind Power Operation Constraint

According to the basic principle of wind power generation, the wind power segment function is used to fit the wind power conversion relationship, as shown in the following Equation [48]:
P W k , t = 0 , v k , t v k , i n   o r   v k , o u t v k , t v k , t v k , i n v k , s v k , i n P W k , N , v k , i n < v k , t < v k , s P W k , N , v k , s v k , t < v k , o u t
where vk,t is the wind speed of the kth wind power unit at the tth period; PWk,N, vk,s, vk,in and vk,out are the rated power, the cut-in, rated as well as cut-out wind speed of the kth wind power unit, respectively.

3.2.4. Network Security Constraint

Considering that the secure operation of the system is the premise of the economic operation in the typhoon environment, the network security constraint based on the DC power flow model is added in the proposed optimization model. Correspondingly, the transmission power calculation is shown in Equation (23), and the network security constraint considering transmission power limitation is shown in Equation (24) [49].
P l , k m , t = i ψ X k i X m i X k m P i , t s L X k s X m s X k m D s , t
P l , k m , max P l , k m , t P l , k m , max
where Xki, Xmi, and Xkm are the elements of network node impedance matrix; Pi,t and Ds,t are the node power generation and load power at dispatching time t, respectively; ψ and L is the set of system’s generator and load nodes, respectively; Pl,km,t is the transmission power of branch km in DC power flow model at dispatching time t; Pl,km,max is the upper limit of transmission power of branch km.

3.2.5. Power Balance Constraints

When the system takes the initial scenario of wind power output, namely, the prediction value of wind power output from the wind circle model, as the operation condition, the system is allowed to have abandoned wind, but the load should be fully supplied. Therefore, the power balance constraint is shown in Equation (25). When the system takes the generated wind power output probability scenarios as the operation conditions, the risk of system load loss and wind curtailment is considered, so the load loss and wind curtailment power are considered in the system power balance constraint, as shown in Equation (26).
i = 1 N T P T i , t + j = 1 N H P H j , t + k = 1 N W P W k , t P W a k , t = P L , t
i = 1 N T P T i , t , s + j = 1 N H P H j , t + k = 1 N W P W k , t , s Δ P s , t = P L , t
where PL,t is the system’s load power in the dispatching time t; PTi,t,s and PWk,t,s are the generation power of thermal generator group I and wind farm k in the dispatching time t under scenario s, respectively.

3.2.6. Reserve Constraints of Thermal Power Units in Probabilistic Scenarios

In each probability scenario, thermal power units can suppress the uncertainty of wind power output by increasing or decreasing the unit output; that is, they need to reserve sufficient rotating reserve capacity. However, due to the positive correlation between the reserve capacity and the reserve cost, the excessive reserve capacity is not conducive to the economic operation of the system. Therefore, the form of Equations (27)–(30) is taken as the operating constraints of thermal power units in the probability scenarios, so as to obtain the reasonable value of thermal power units’ rotating reserve [50].
u i , t P i , min P T i , t , s u i , t P i , max
R D i P T i , t , s P T i , t 1 , s R U i
P T i , t , s = P T i , t + R u p , i , t , s R down , i , t , s
R resu , i , t R u p , i , t , s ,   R resd , i , t R down , i , t , s
where Rup,I,t,s and Rdown,I,t,s, respectively, represent the up and down rotation reserve power of thermal power unit I in the operation period t under scenario s; Rresu,I,t and Rresd,I,t, respectively, represent the up and down rotation reserve power of thermal power unit I in the dispatching time t.

3.3. 72 h Pre-Dispatching Strategy

In order to make the power system cope with the typhoon disaster better, a 72 h pre-dispatching strategy is used to optimize the dispatching of the multi-sources power system for 72 h with the day before, on, and after the typhoon. In the pre-dispatching model, the constraints are consistent with the day-ahead dispatching model. The difference lies in the setting of the upper and lower limitations of the reservoir capacity of hydropower. Firstly, the lower limit of the water level of each reservoir should be kept above the dead water level. Secondly, on the day before the typhoon, in order to cope with a large amount of precipitation that may be brought by the typhoon and avoid excessive overflow and waste of water in the hydropower station, the water level should be reduced to the level that can not only accommodate the increased precipitation but also guarantee the power generation. According to the design principle of the reservoir, it is feasible to reduce the water level of the hydropower station reservoir to the upper limitation of water level that the reservoir is allowed to reach during the flood season; that is, the limited water level in flood season. Thirdly, on the day of the typhoon, from the perspective of the dispatching security of the reservoir itself, the water level of the reservoir should be controlled below the flood control high water level, which is determined in the reservoir design. Fourthly, on the day after the typhoon, the system is in normal dispatching, so the water level of the reservoir should be kept below the normal water level. Finally, according to the corresponding relationship between the water level and the reservoir, the upper and lower limitations of the reservoir capacity can be set to realize the hydropower constraint model under the typhoon environment established by the 72 h pre-dispatching method. The set of reservoir capacity limitations for the day before, on, and after typhoon is shown in Figure 2, Figure 3 and Figure 4, respectively. Additionally, the corresponding calculation expression is shown in Equations (31)–(33), respectively.
V j , max = V 1 , j + V 2 , j V 3 , j
V j , max = V 1 , j + V 2 , j V 3 , j + V 4 , j
V j , max = V 1 , j + V 2 , j
where V1,j, V2,j, V3,j, and V4,j represent the dead storage capacity, working capacity, reserved storage capacity for flood control, and flood control capacity of reserve j, respectively.

4. Results and Discussion

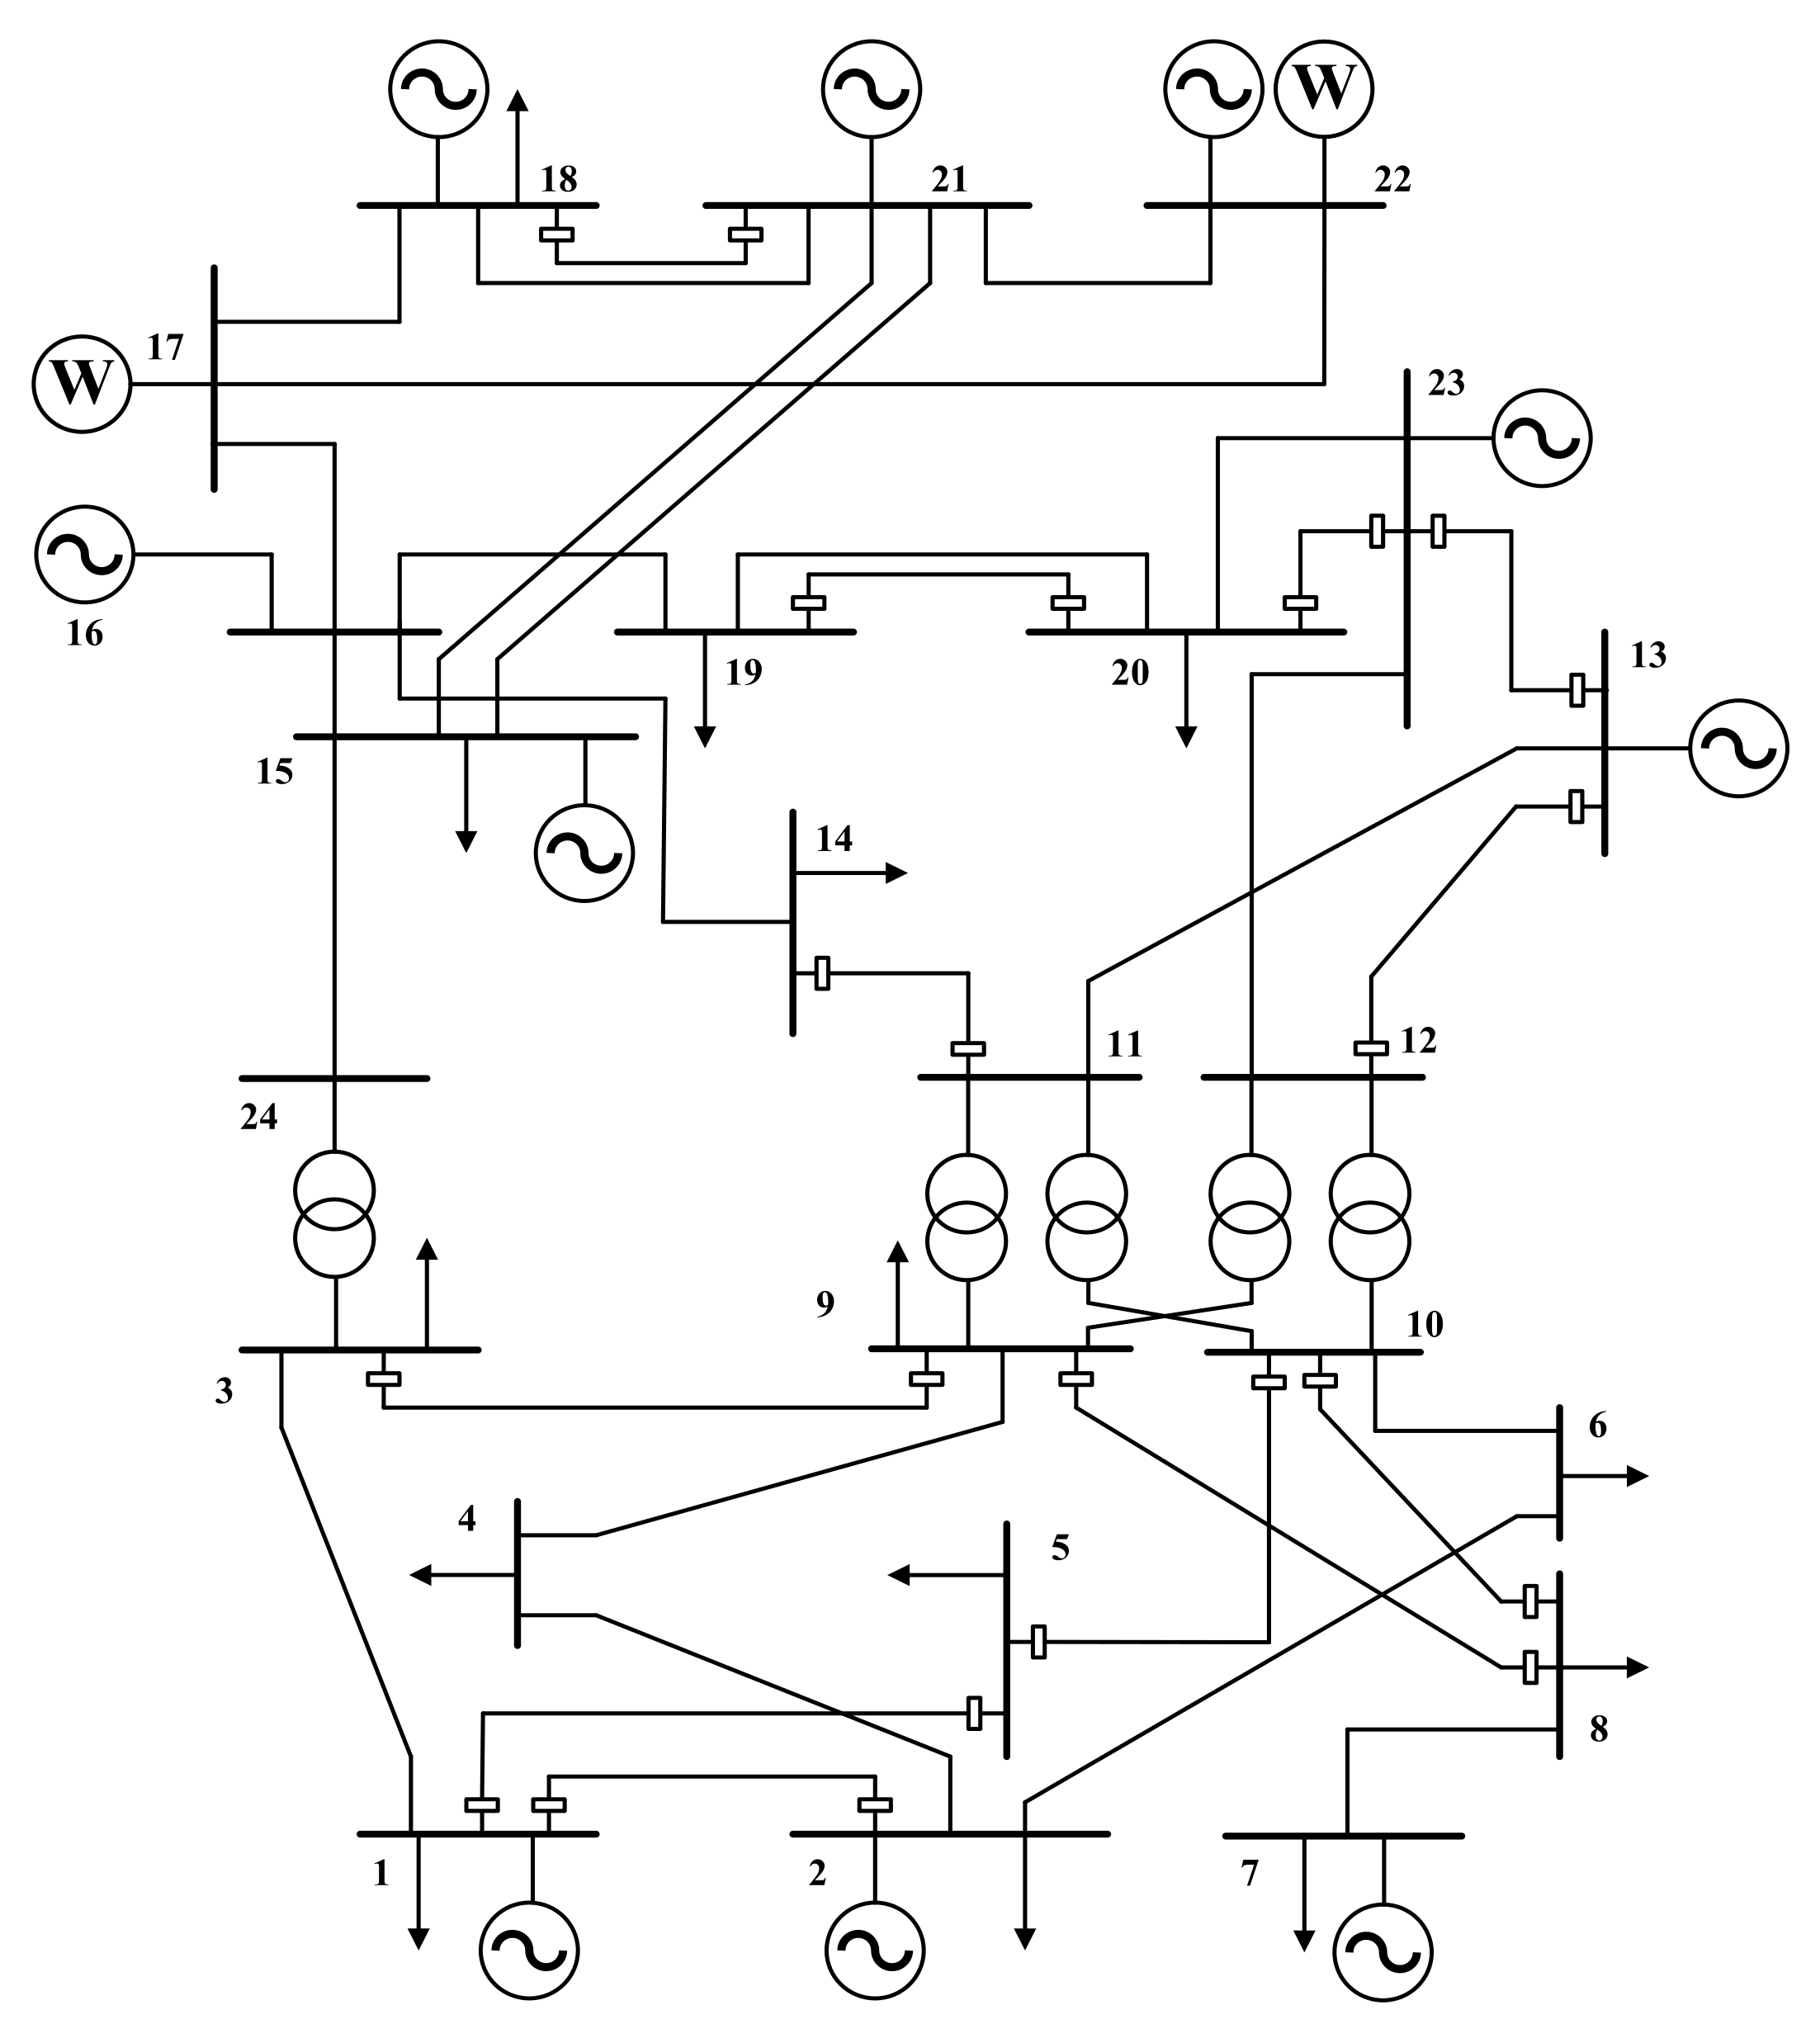
4.1. Introduction to the Example System

A revised 24-node transmission network system serves as a case to verify the effectiveness of the proposed strategy in this paper. The multi-sources power system based on the 24 nodes transmission network system is shown in Figure 5 [51]. Additionally, the data of various power sources in the case study comes from a typhoon disaster warning and response demonstration project under construction in Fujian Province. As a coastal mountainous province located in south-eastern China, Fujian Province has abundant hydropower resources and great potential for offshore wind power development. Thus, Fujian Electric Power Co., Ltd. (Fuzhou, China) plans to start from the construction of the typhoon disaster warning and response demonstration project to optimize and upgrade the power grid of Fujian Province. At present, the dispatchable resources in the demonstration project include wind farms, hydropower stations, and thermal power plants with a total installed capacity of 5475 MW. The basic parameters and the topological locations of various types of power sources are shown in Table 2, Table 3 and Table 4, respectively. In Table 2, Table 3 and Table 4, the thermal, hydro, and wind power stations are defined as T1–T8, H1–H2, and W1–W2, respectively. It can be seen from Table 2, Table 3 and Table 4 that there are eight thermal power plants at nodes 1, 2, 7, 13, 15, 18, 21, and 22, respectively, two hydropower stations at nodes 16 and 23, respectively and two wind farms at nodes 17 and 22, respectively. The historical data of typhoon Mekkhala, which landed near this area on 11 August 2020, are taken as the input of the typhoon wind circle model, and the input wind speed of the wind farm for 10 h of the typhoon is generated. The wind speed input data for the remaining 14 h of the typhoon day and the day before and after the typhoon is directly taken from the historical data recorded by the wind farm. Based on the initial background wind speed generated by the typhoon wind circle model, considering the uncertainty and volatility of wind power output prediction, the scenario analysis technology is used to generate a typical wind speed probability scenarios set, and the 200 generated scenarios and 10 typical reduced scenarios are shown in Figure 6 and Figure 7, respectively. Among them, the dispatching period from 25–34 is the time interval of typhoon occurrence.

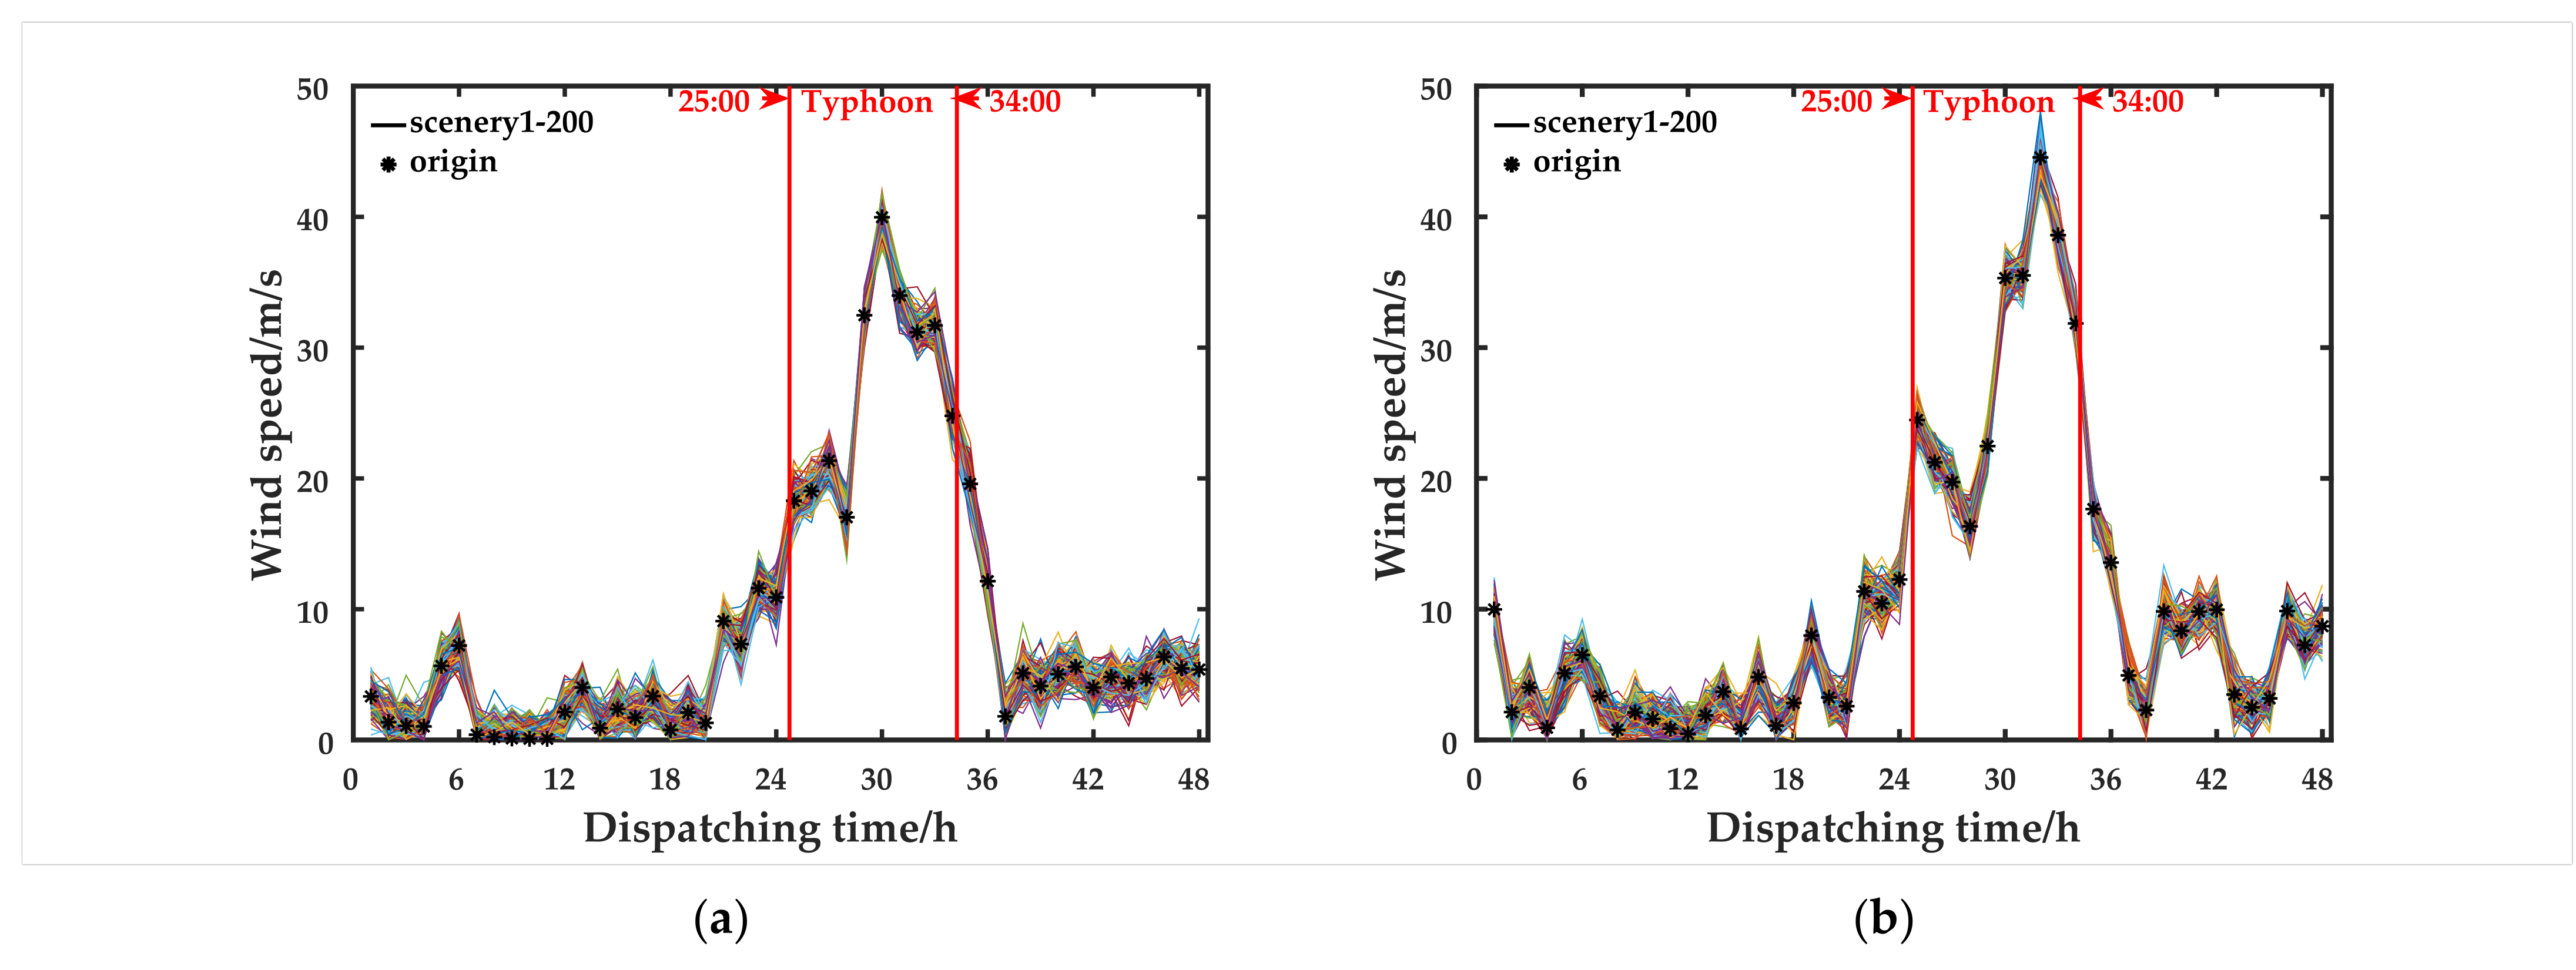
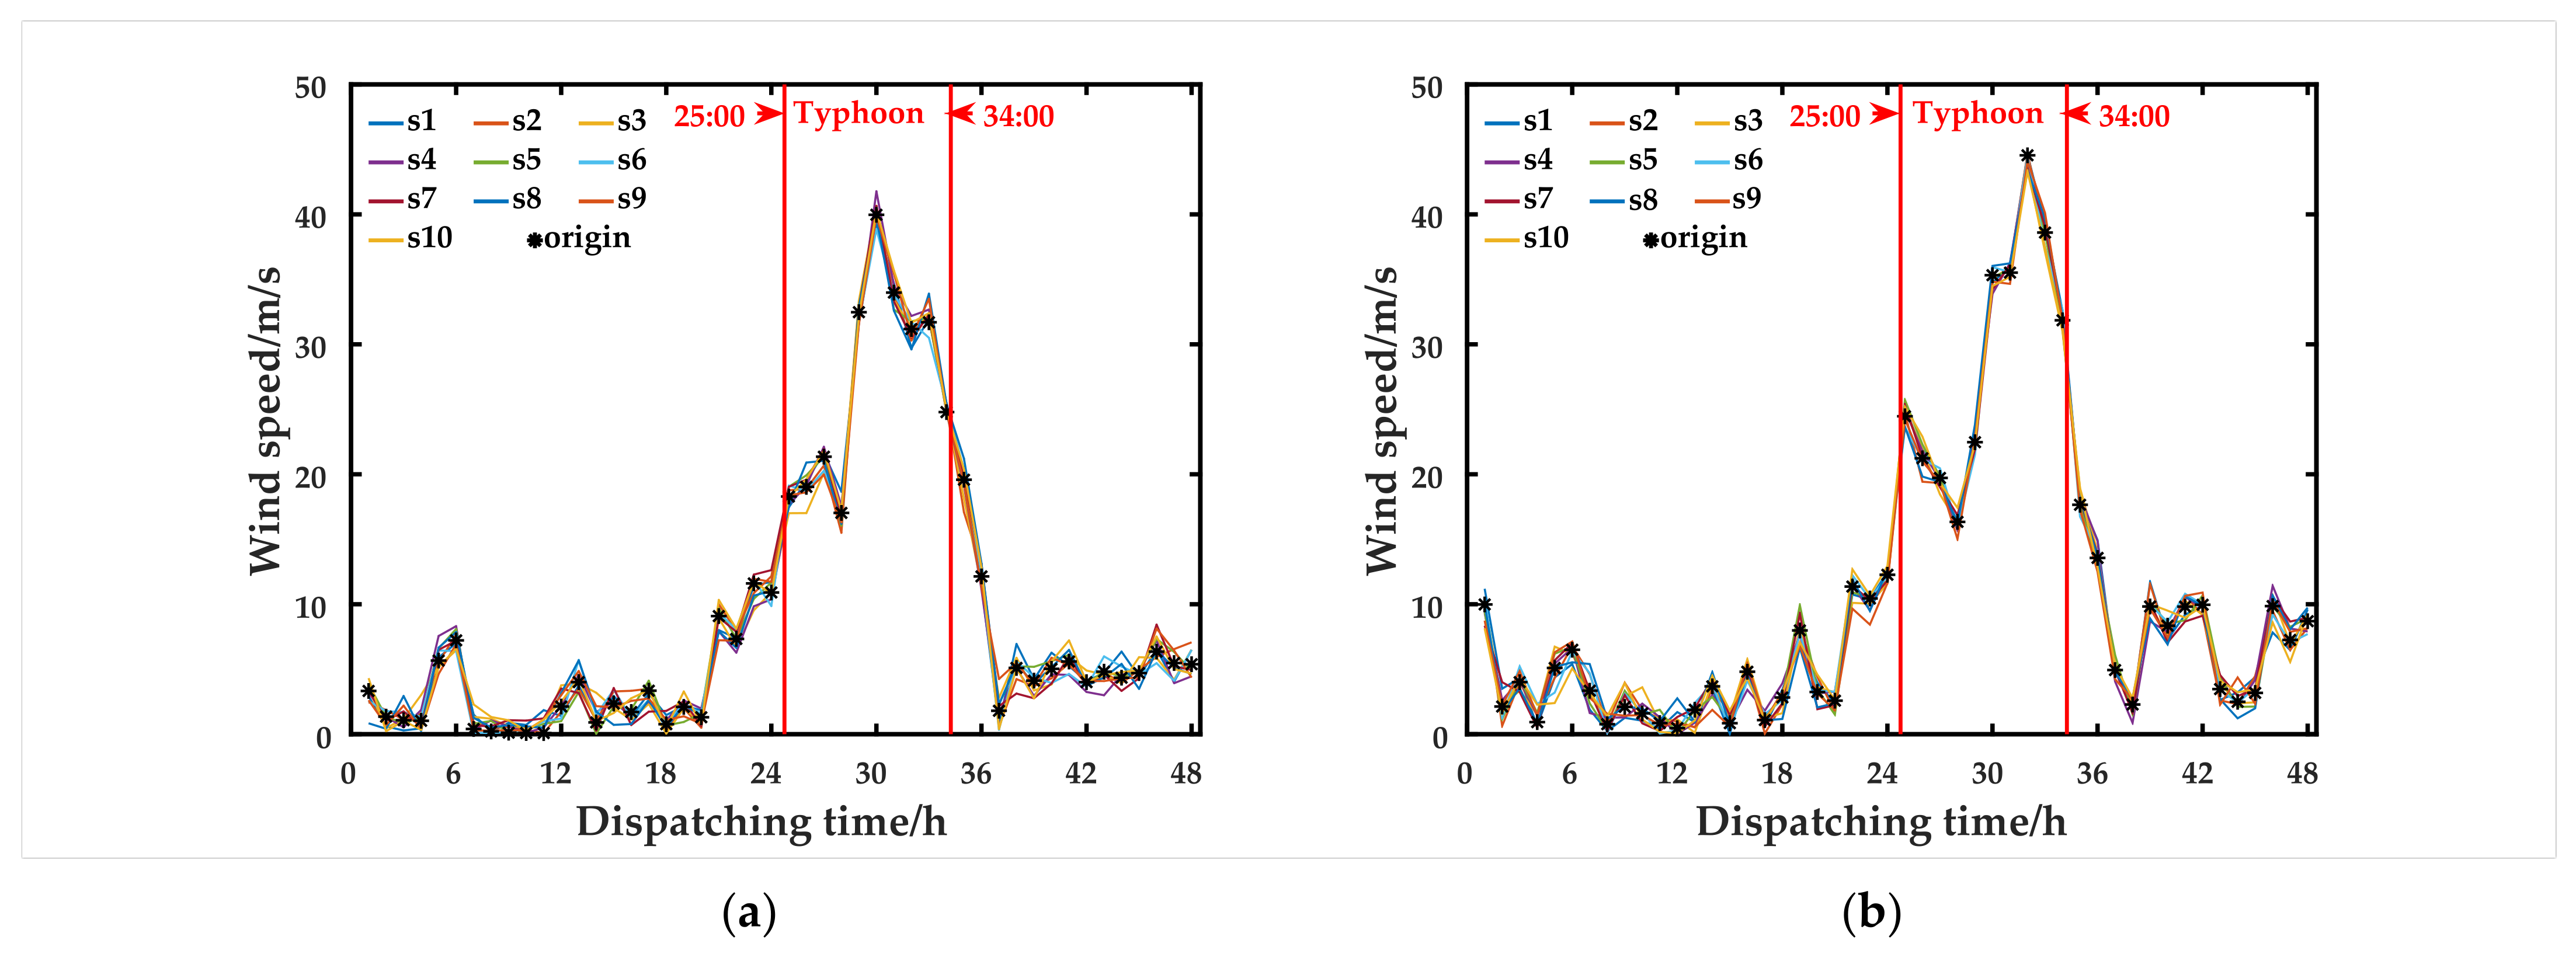
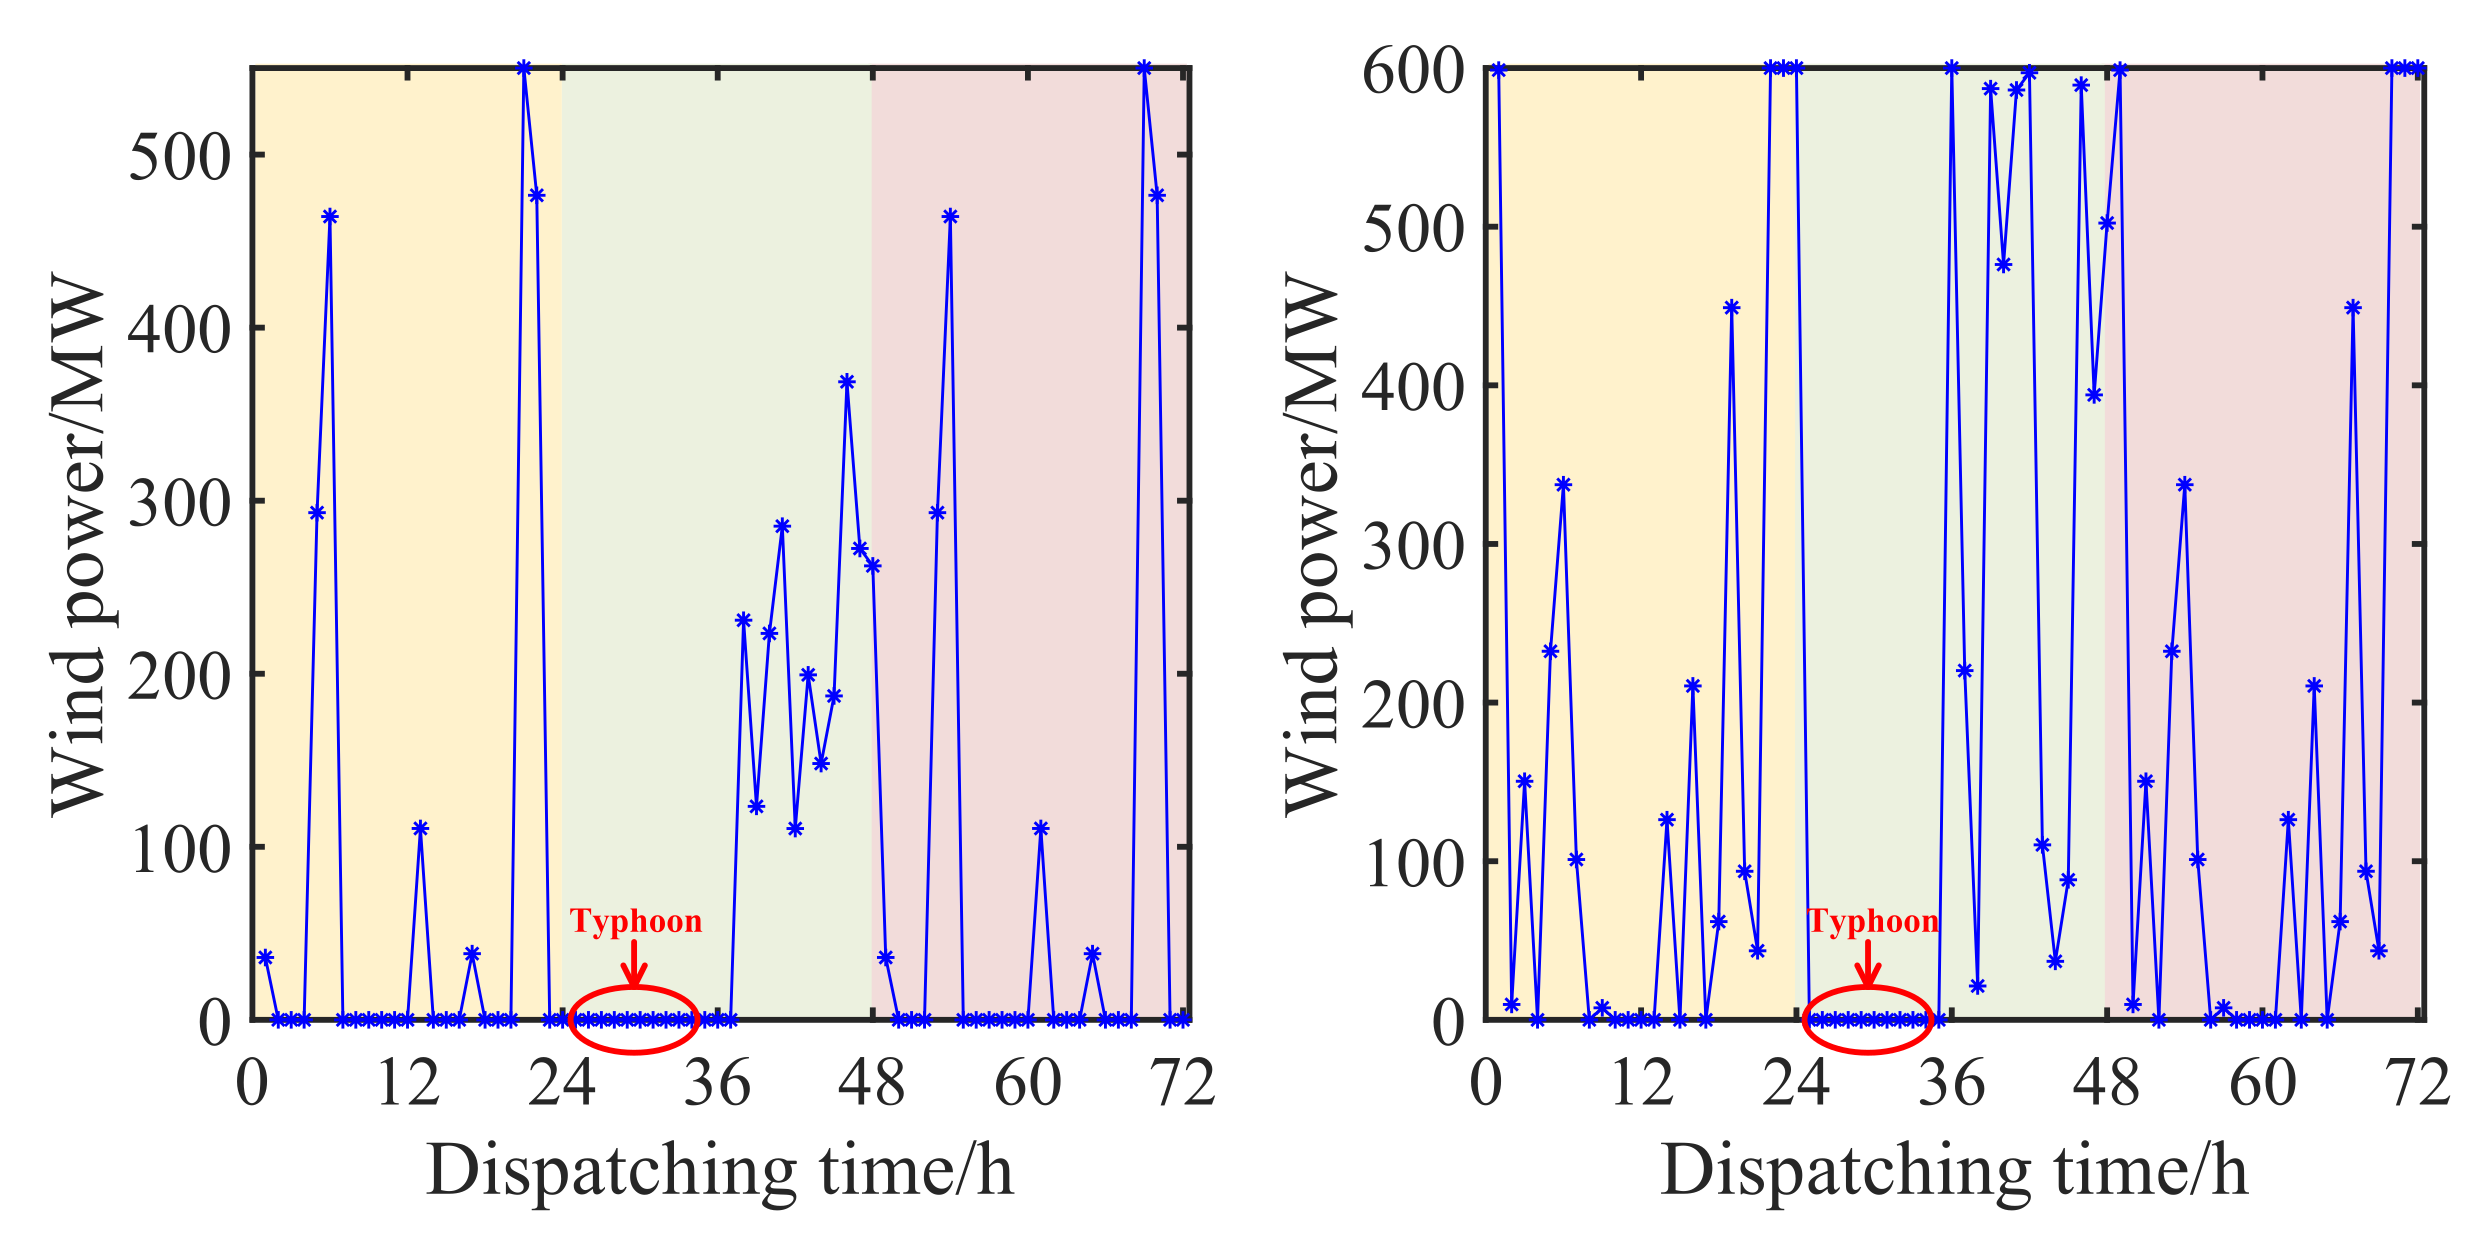
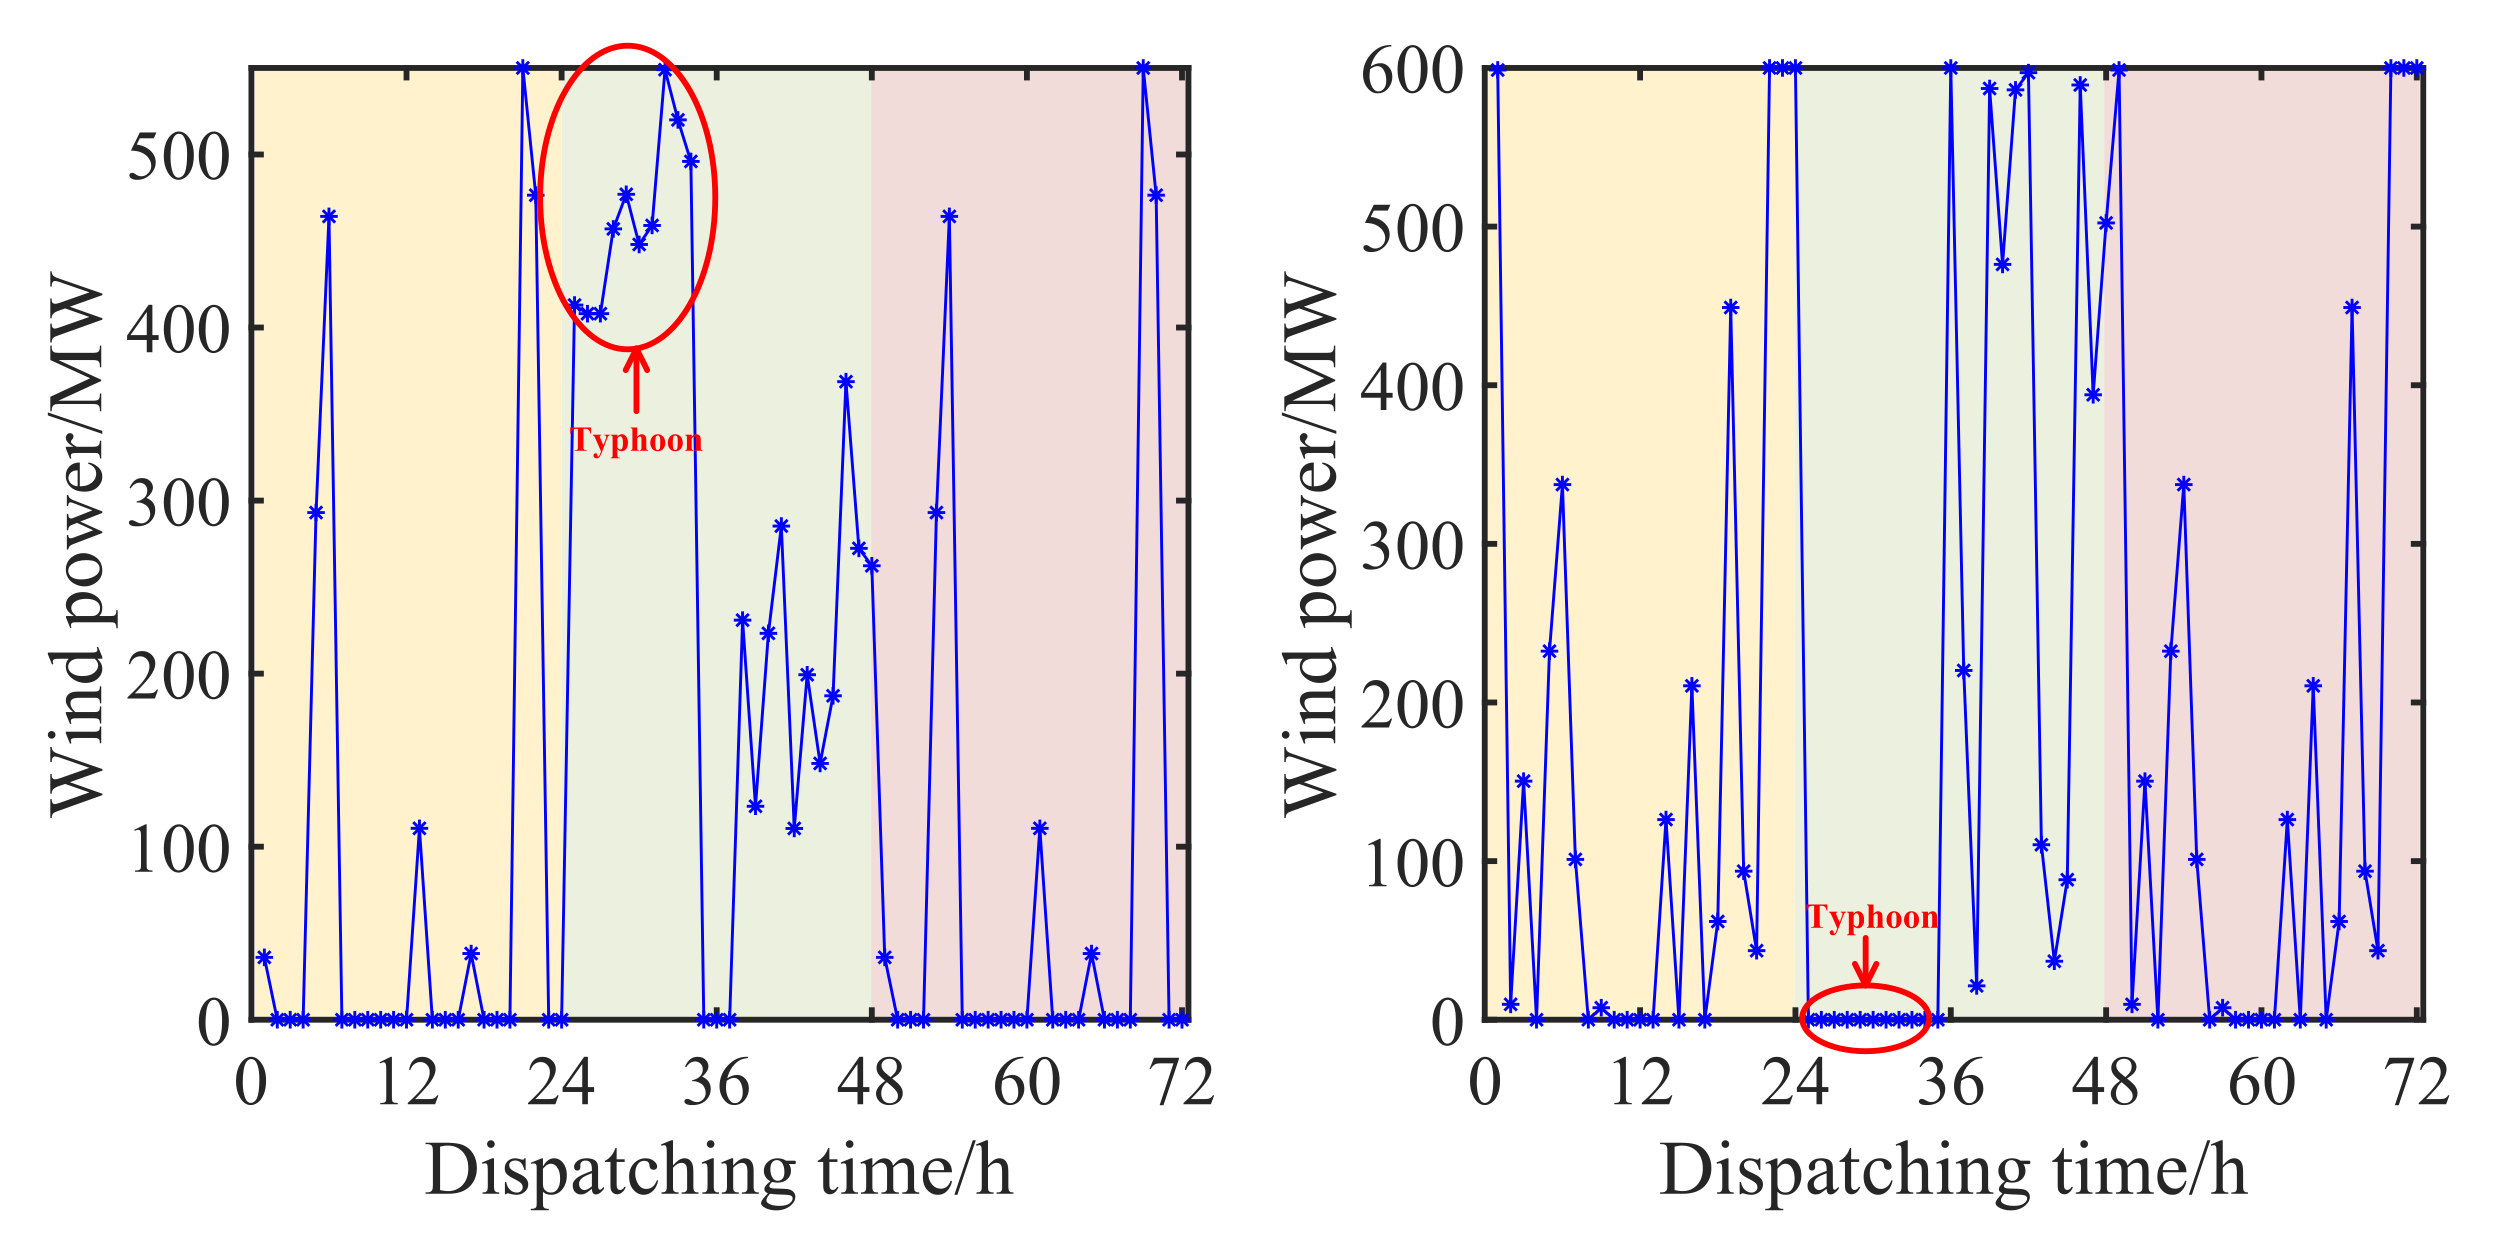
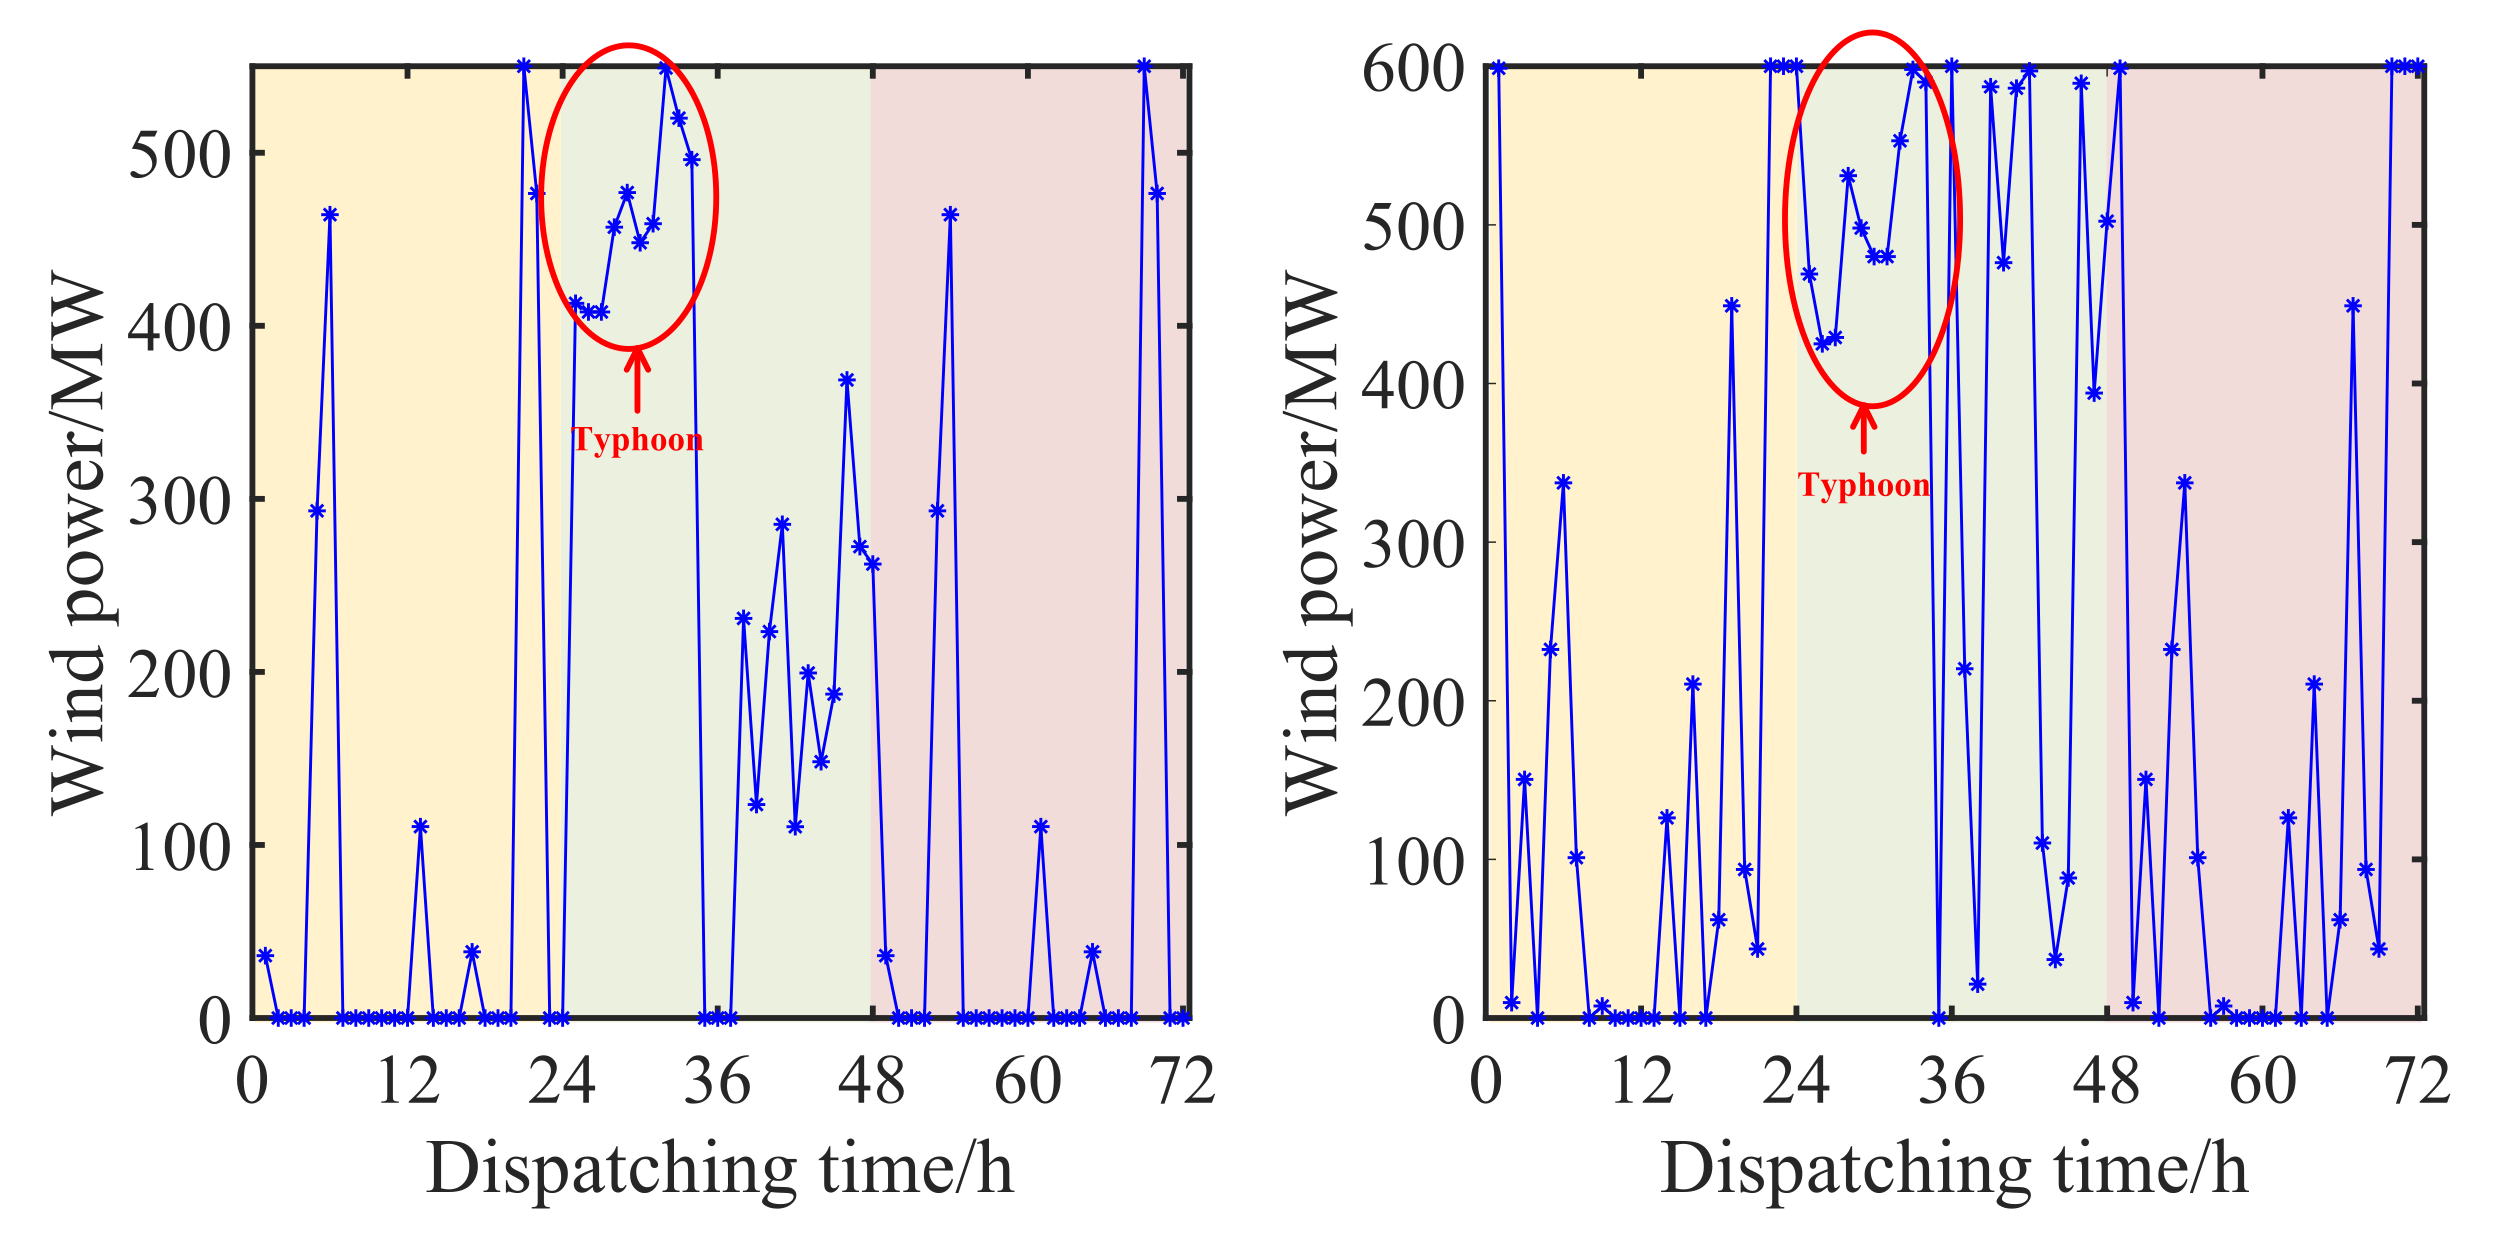
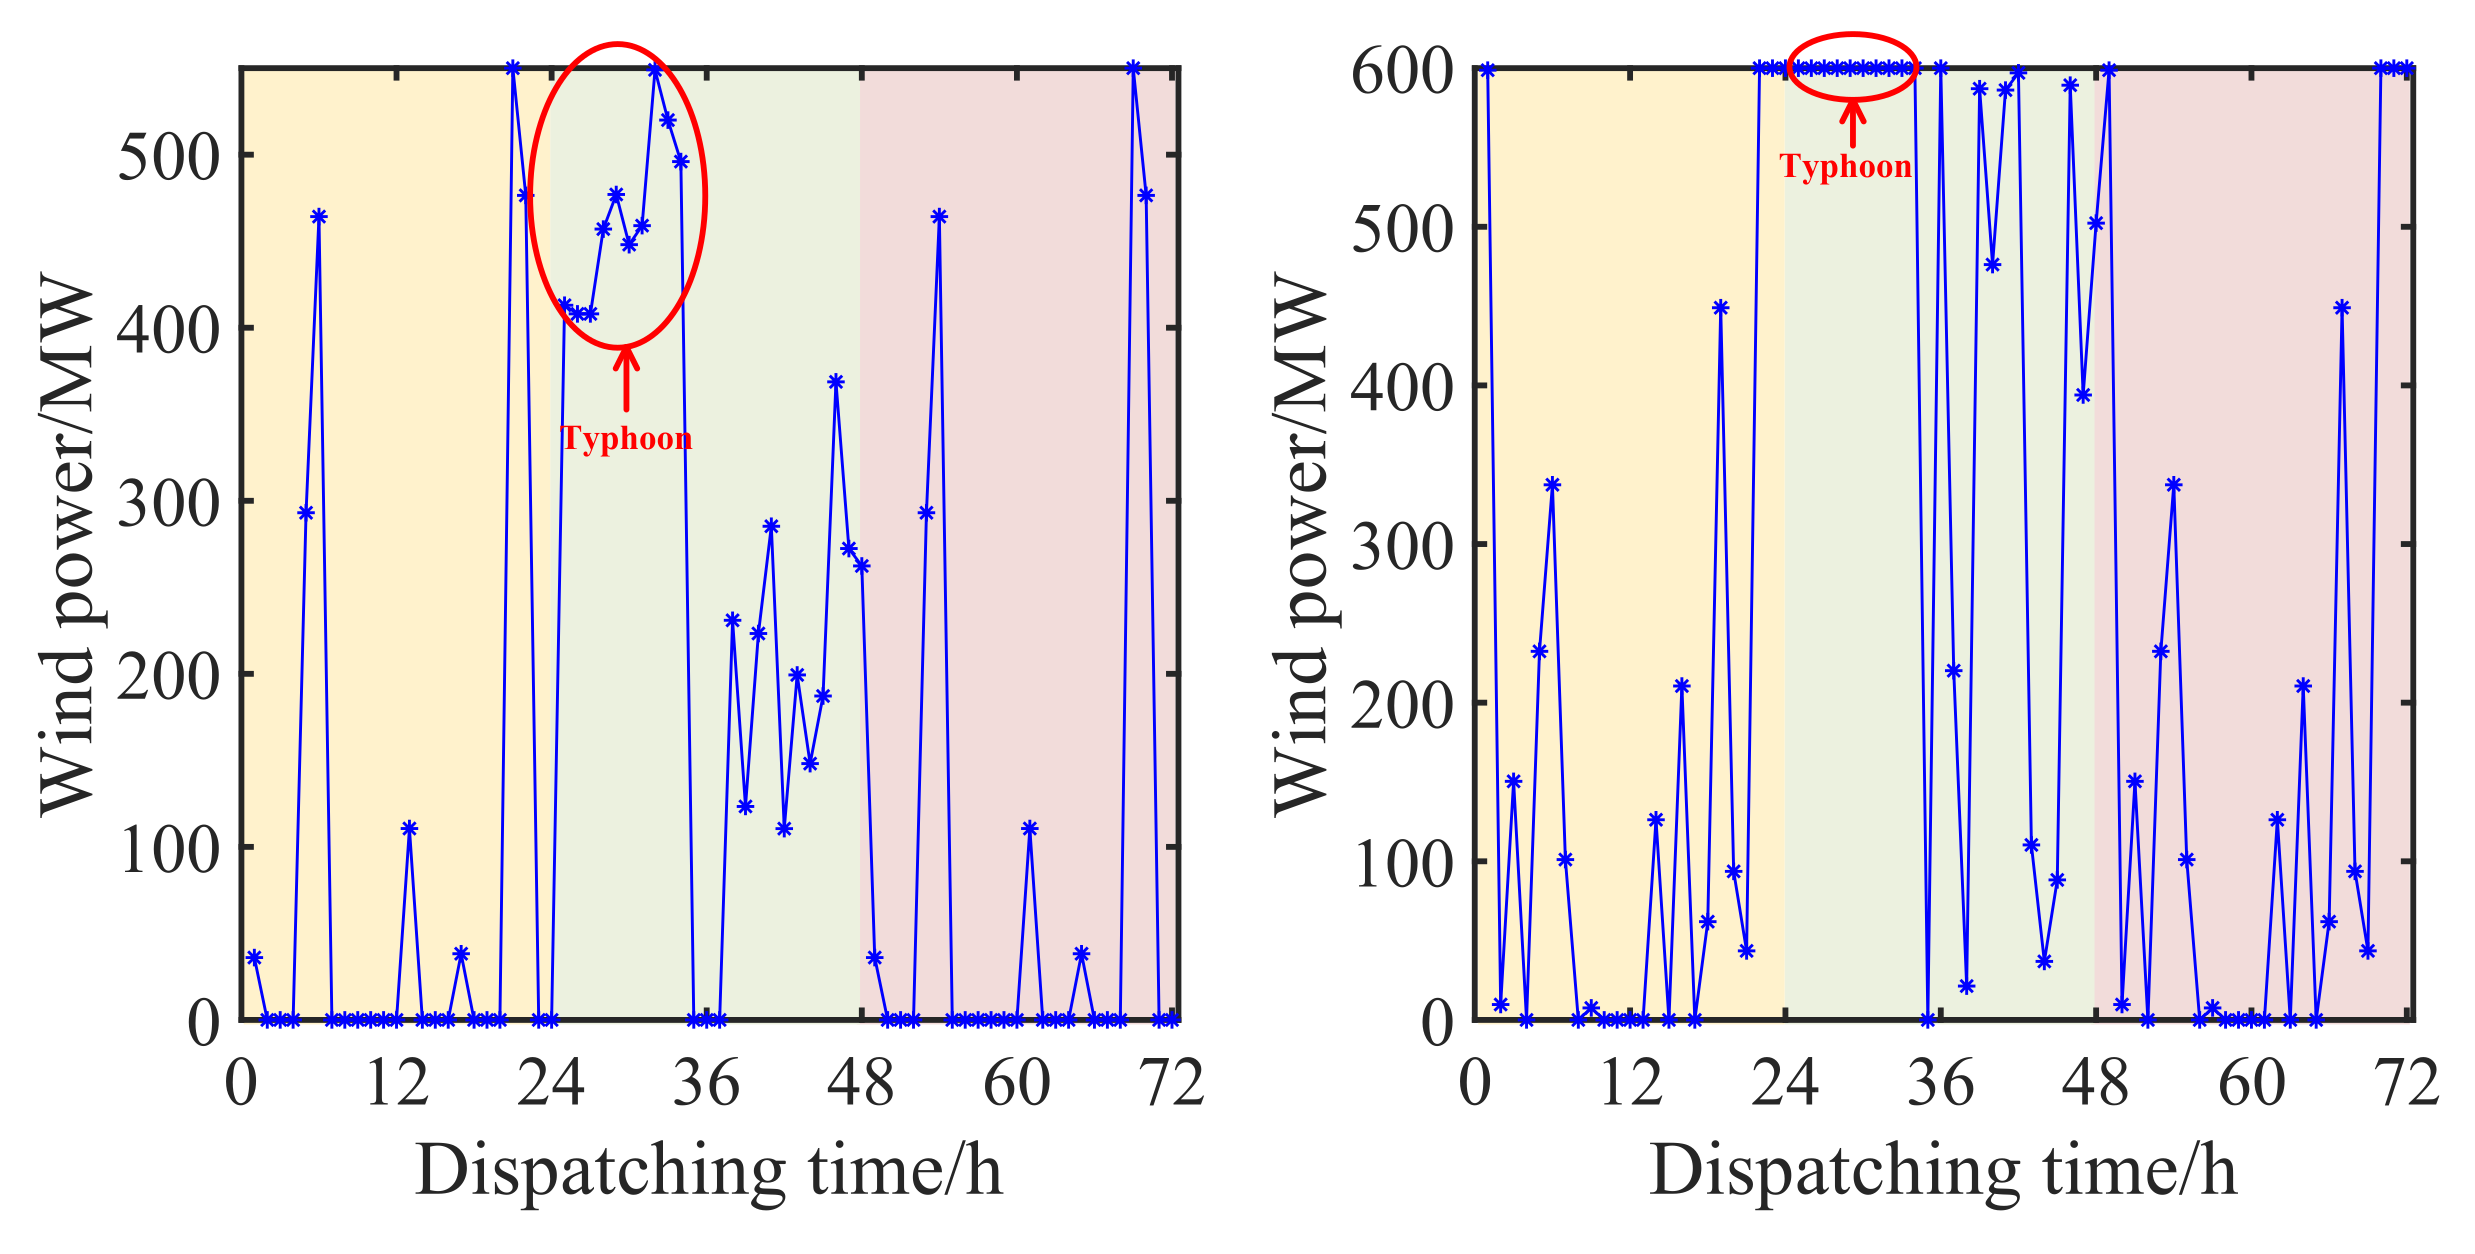
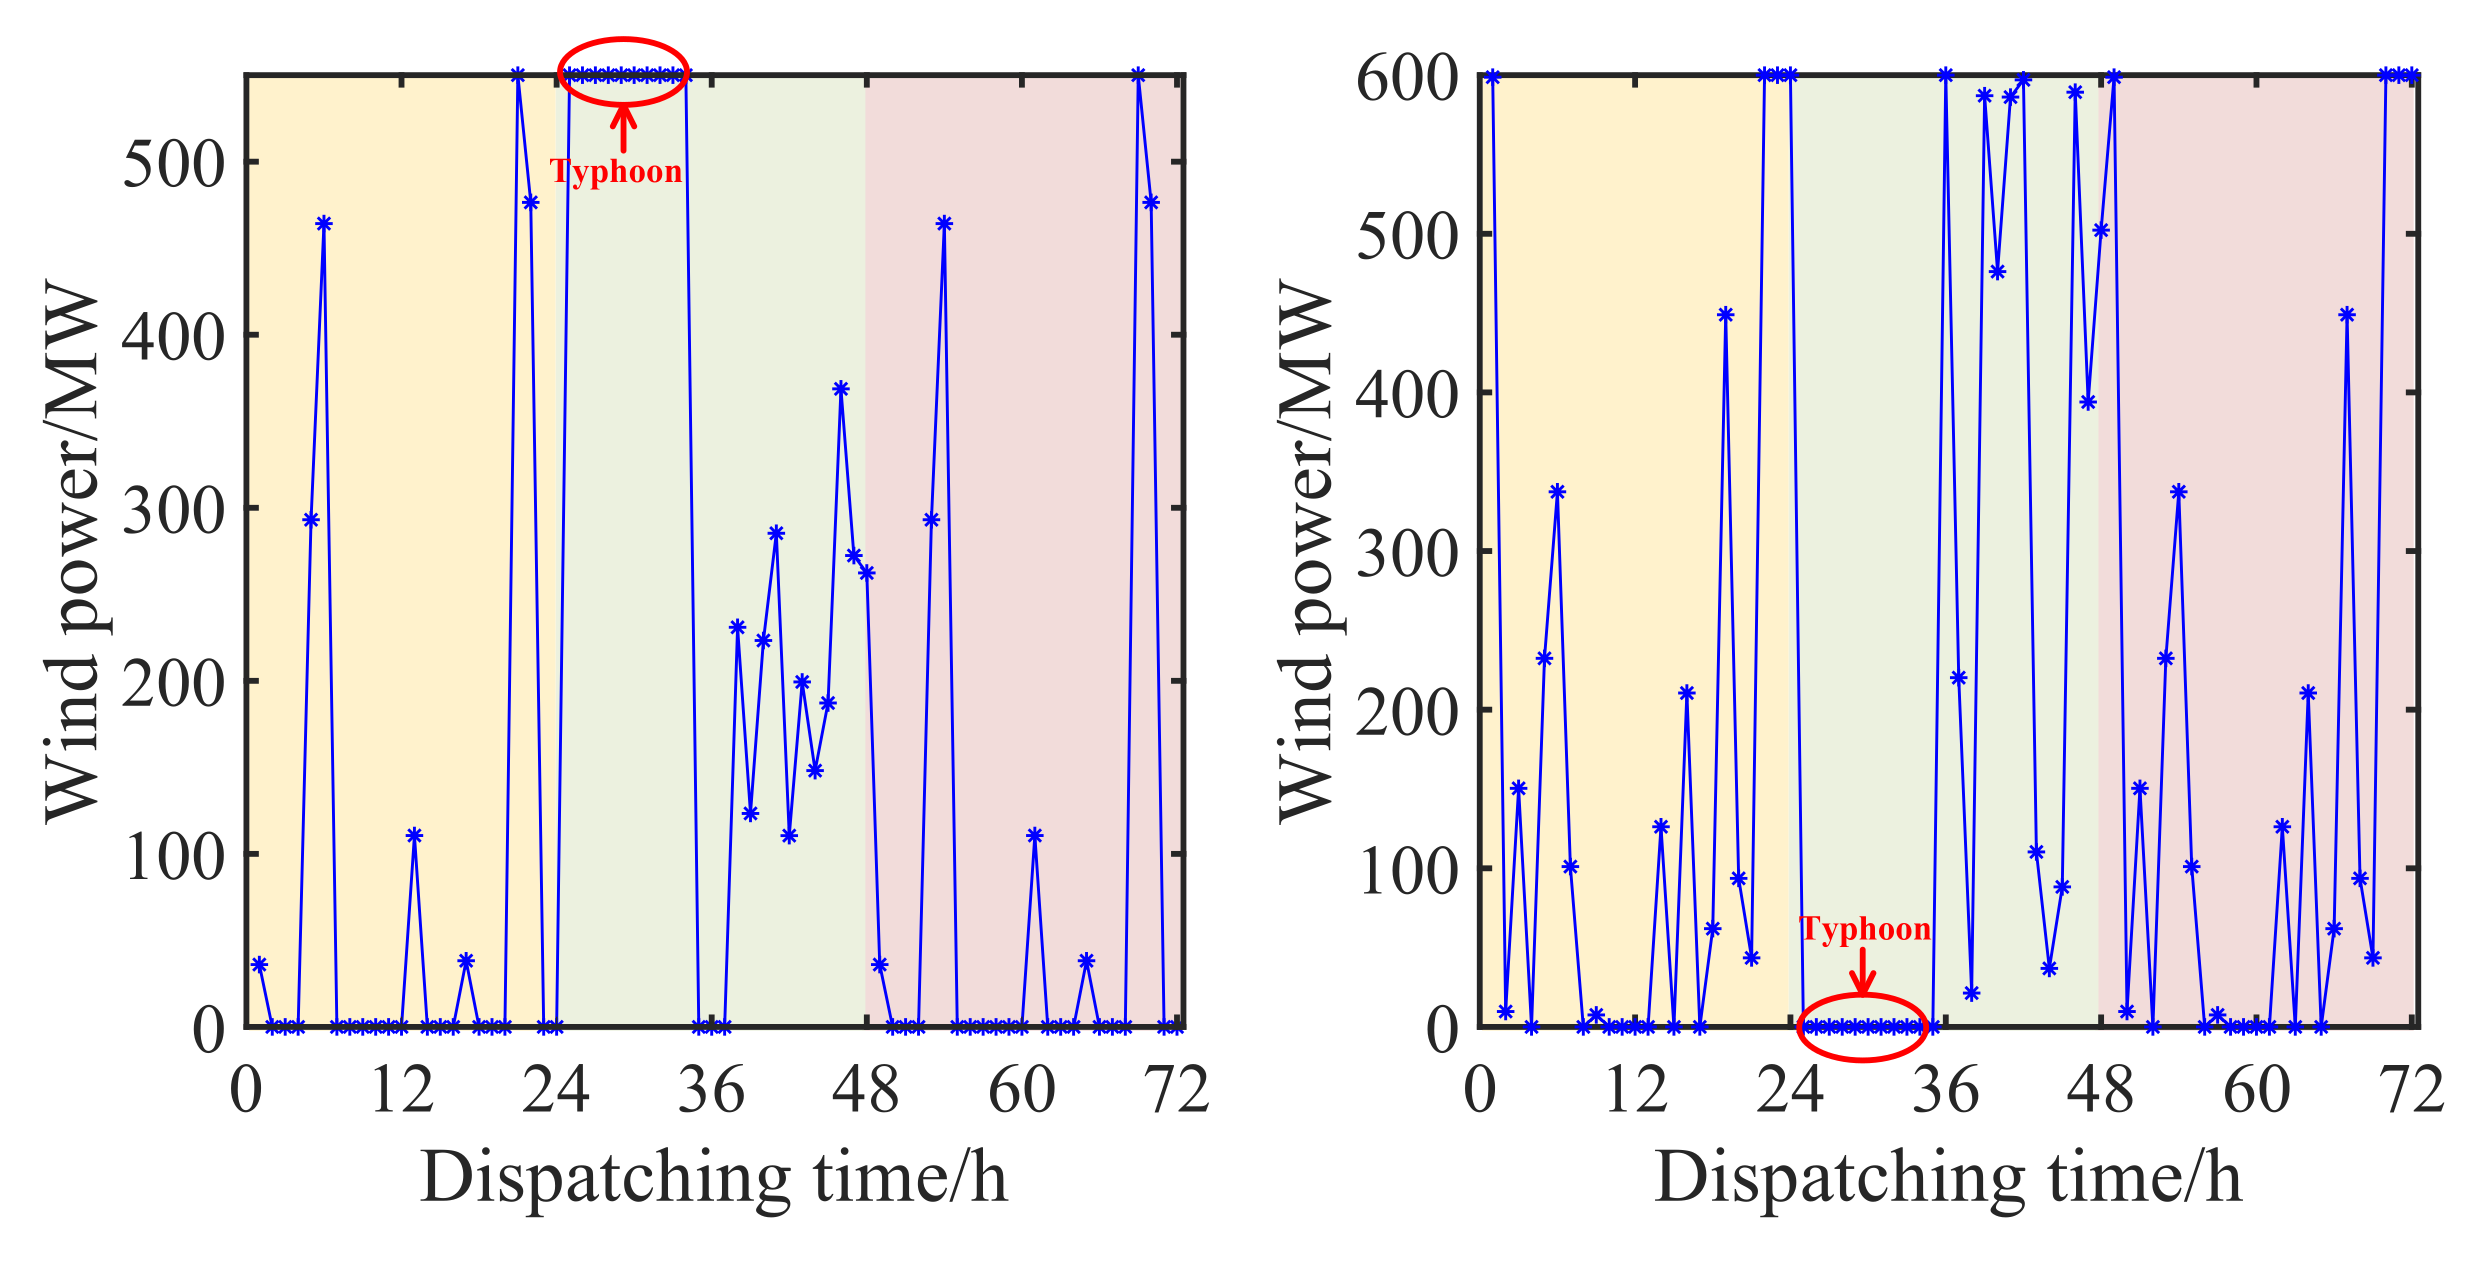
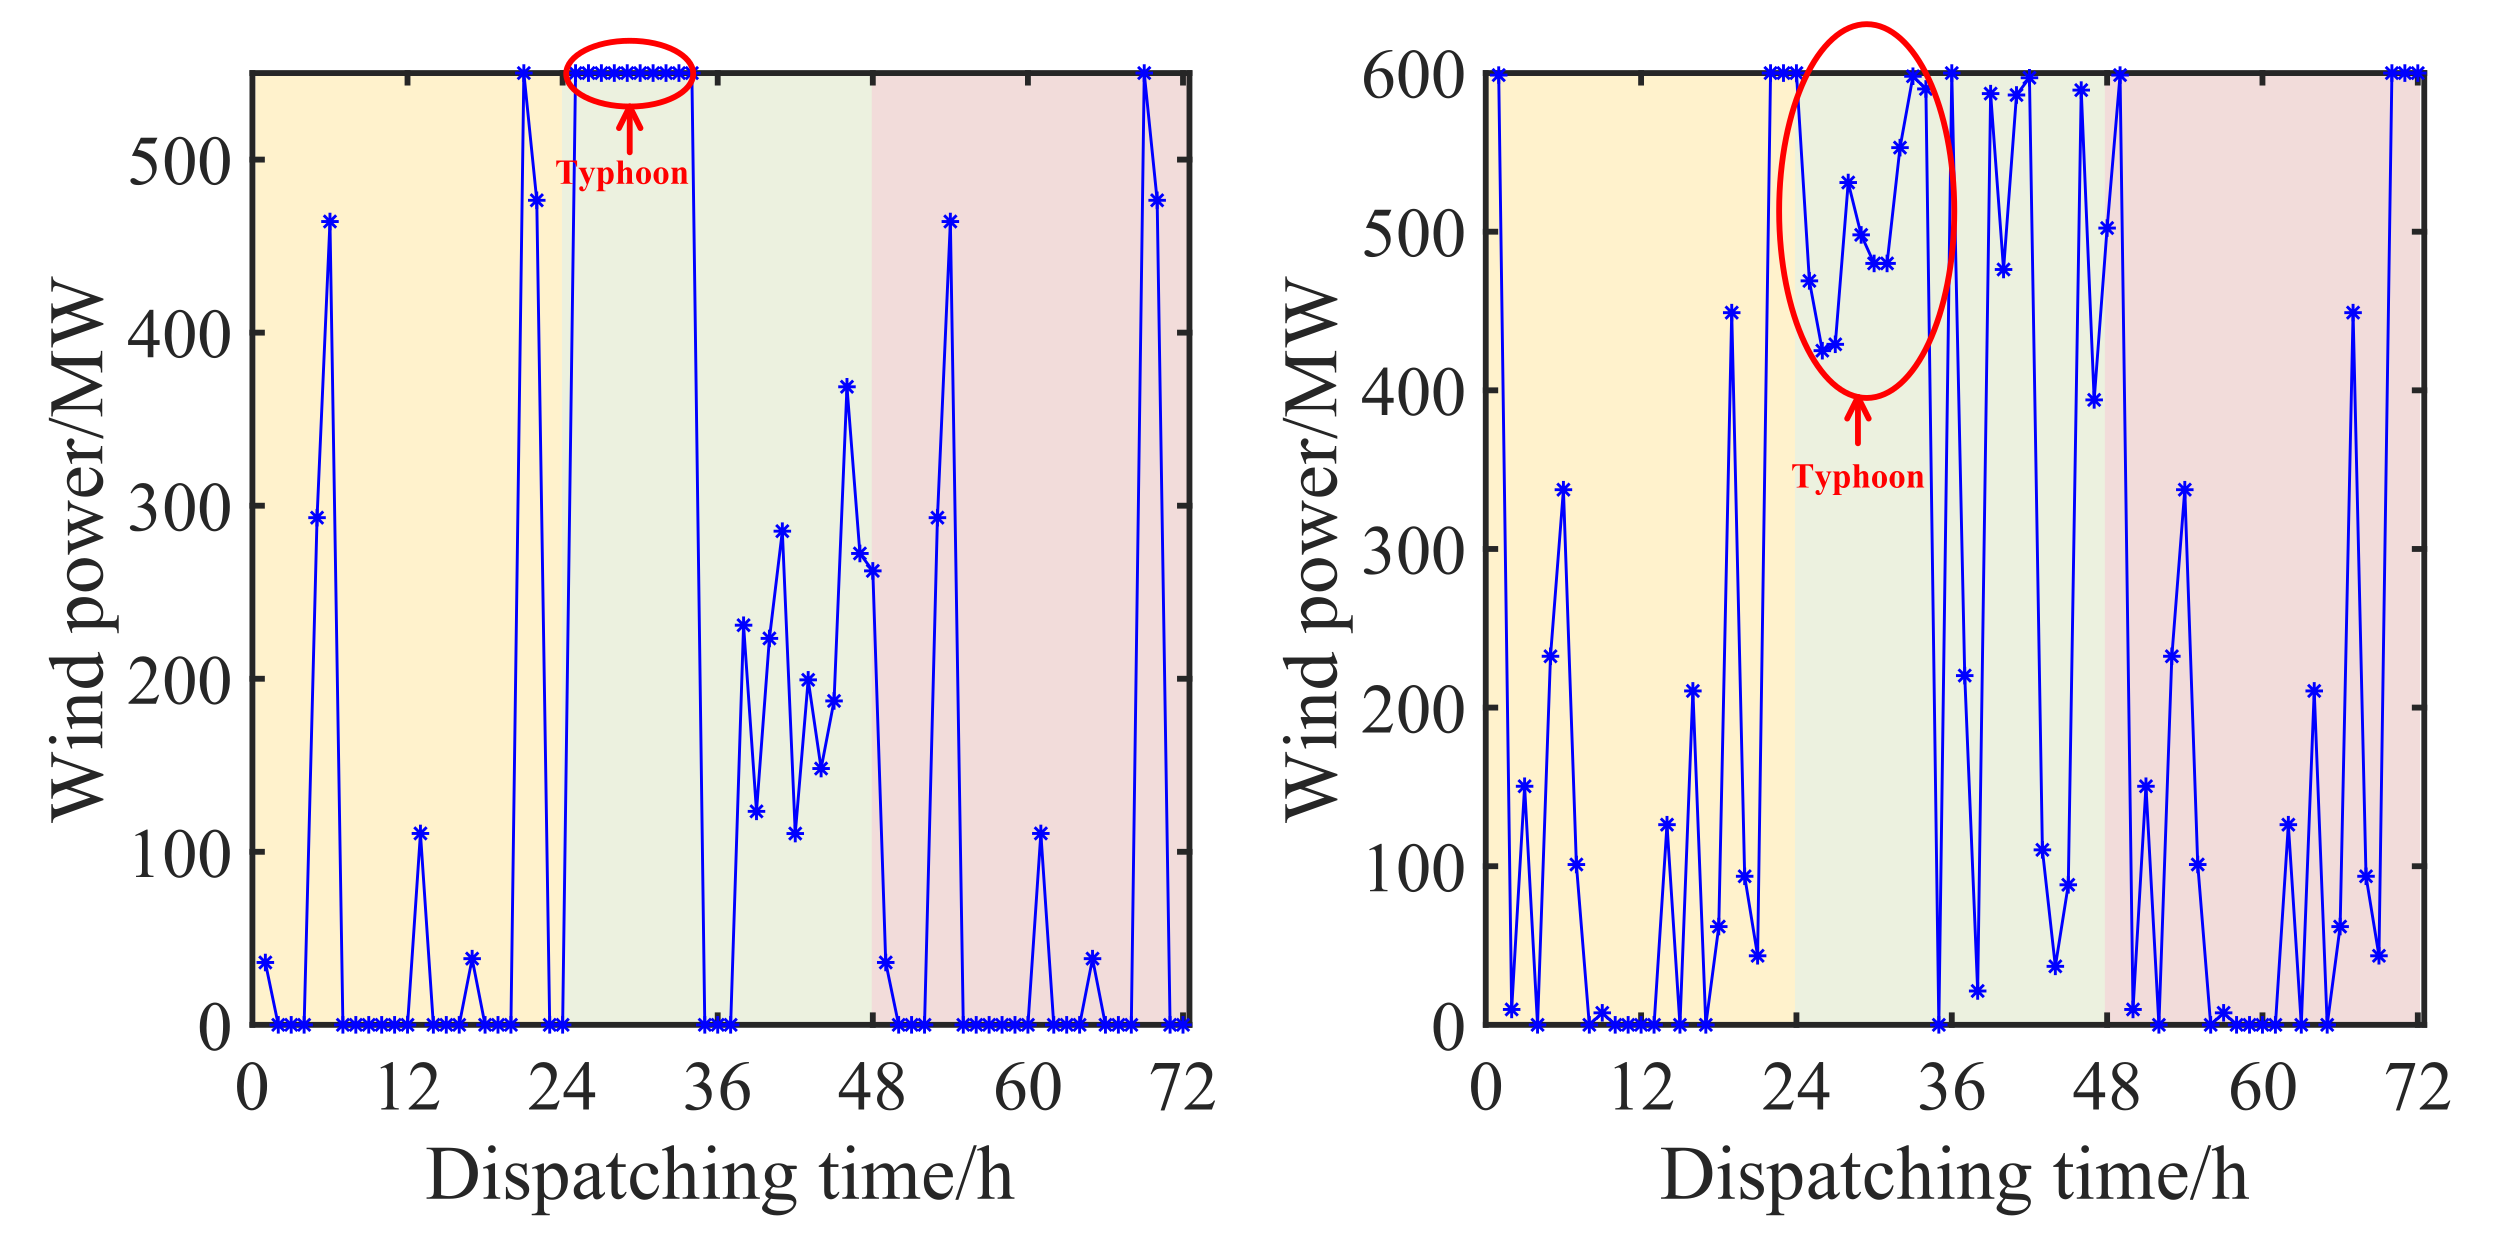
4.2. Analysis for the Results of Scenario Generation and Scenario Elimination

Based on the initial scenario wind speed from the output of the typhoon wind circle model during typhoon periods from 25–34 and the output of wind speed prediction data in the remaining 62 non-typhoon periods, 200 possible scenarios are generated, as shown in Figure 6. Additionally, 10 typical probability scenarios eliminated from the 200 generated scenarios are shown in Figure 7. It can be observed that the fluctuation of wind speed is different in different wind speed range. Namely, the fluctuation is smaller when the wind speed is higher than the cut-out speed at periods such as 25–34 or when it is lower than the cut-in speed at periods such as 2–4 and 7–11. Additionally, a larger fluctuation can be found when the input speed value varies between the cut-in and cut-out speed at periods such as 13–24 and 37–48. This difference of wind speed fluctuation in different power range reflects the real wind power scenario because the range where the input wind speed is higher than the cut-out wind speed and is lower than the cut-in speed is far larger than that of the speed–power linear section. Additionally, only when the relationship between wind speed and wind power is linear will the wind power be sensitive to the input wind speed. Thus, when the wind speed lies in the range between the cut-in and cut-out speed, a larger fluctuation setting is reasonable for the modeling accuracy of wind power volatility. Correspondingly, the smaller range of fluctuation for the modeling of wind power with constant zero and rated value is also feasible.

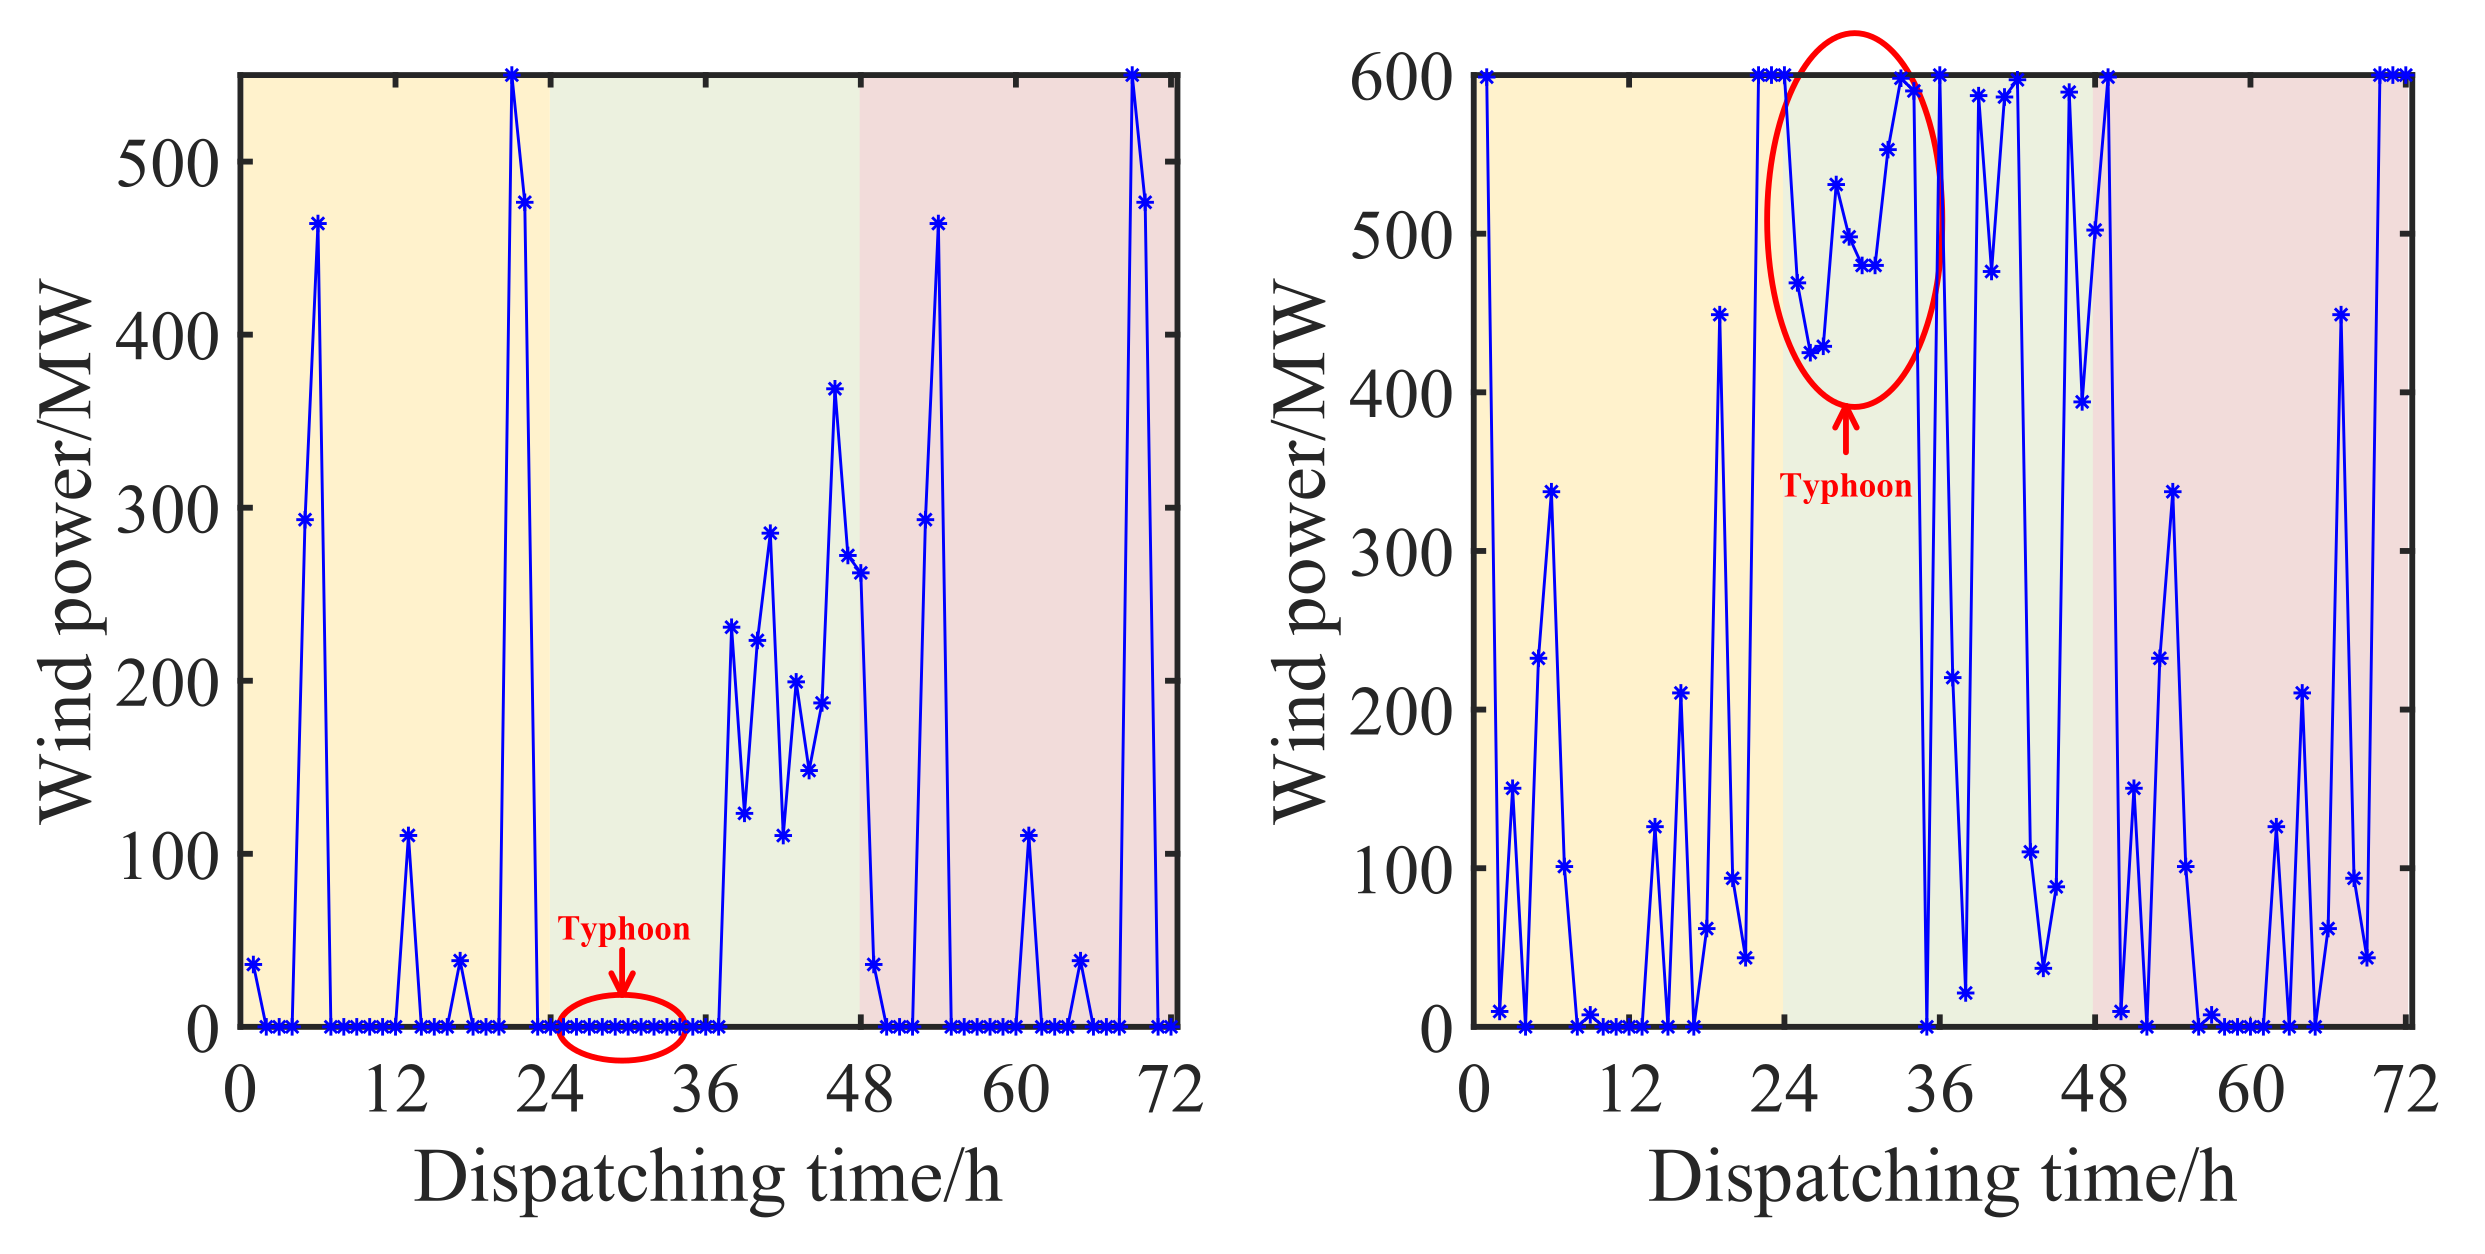
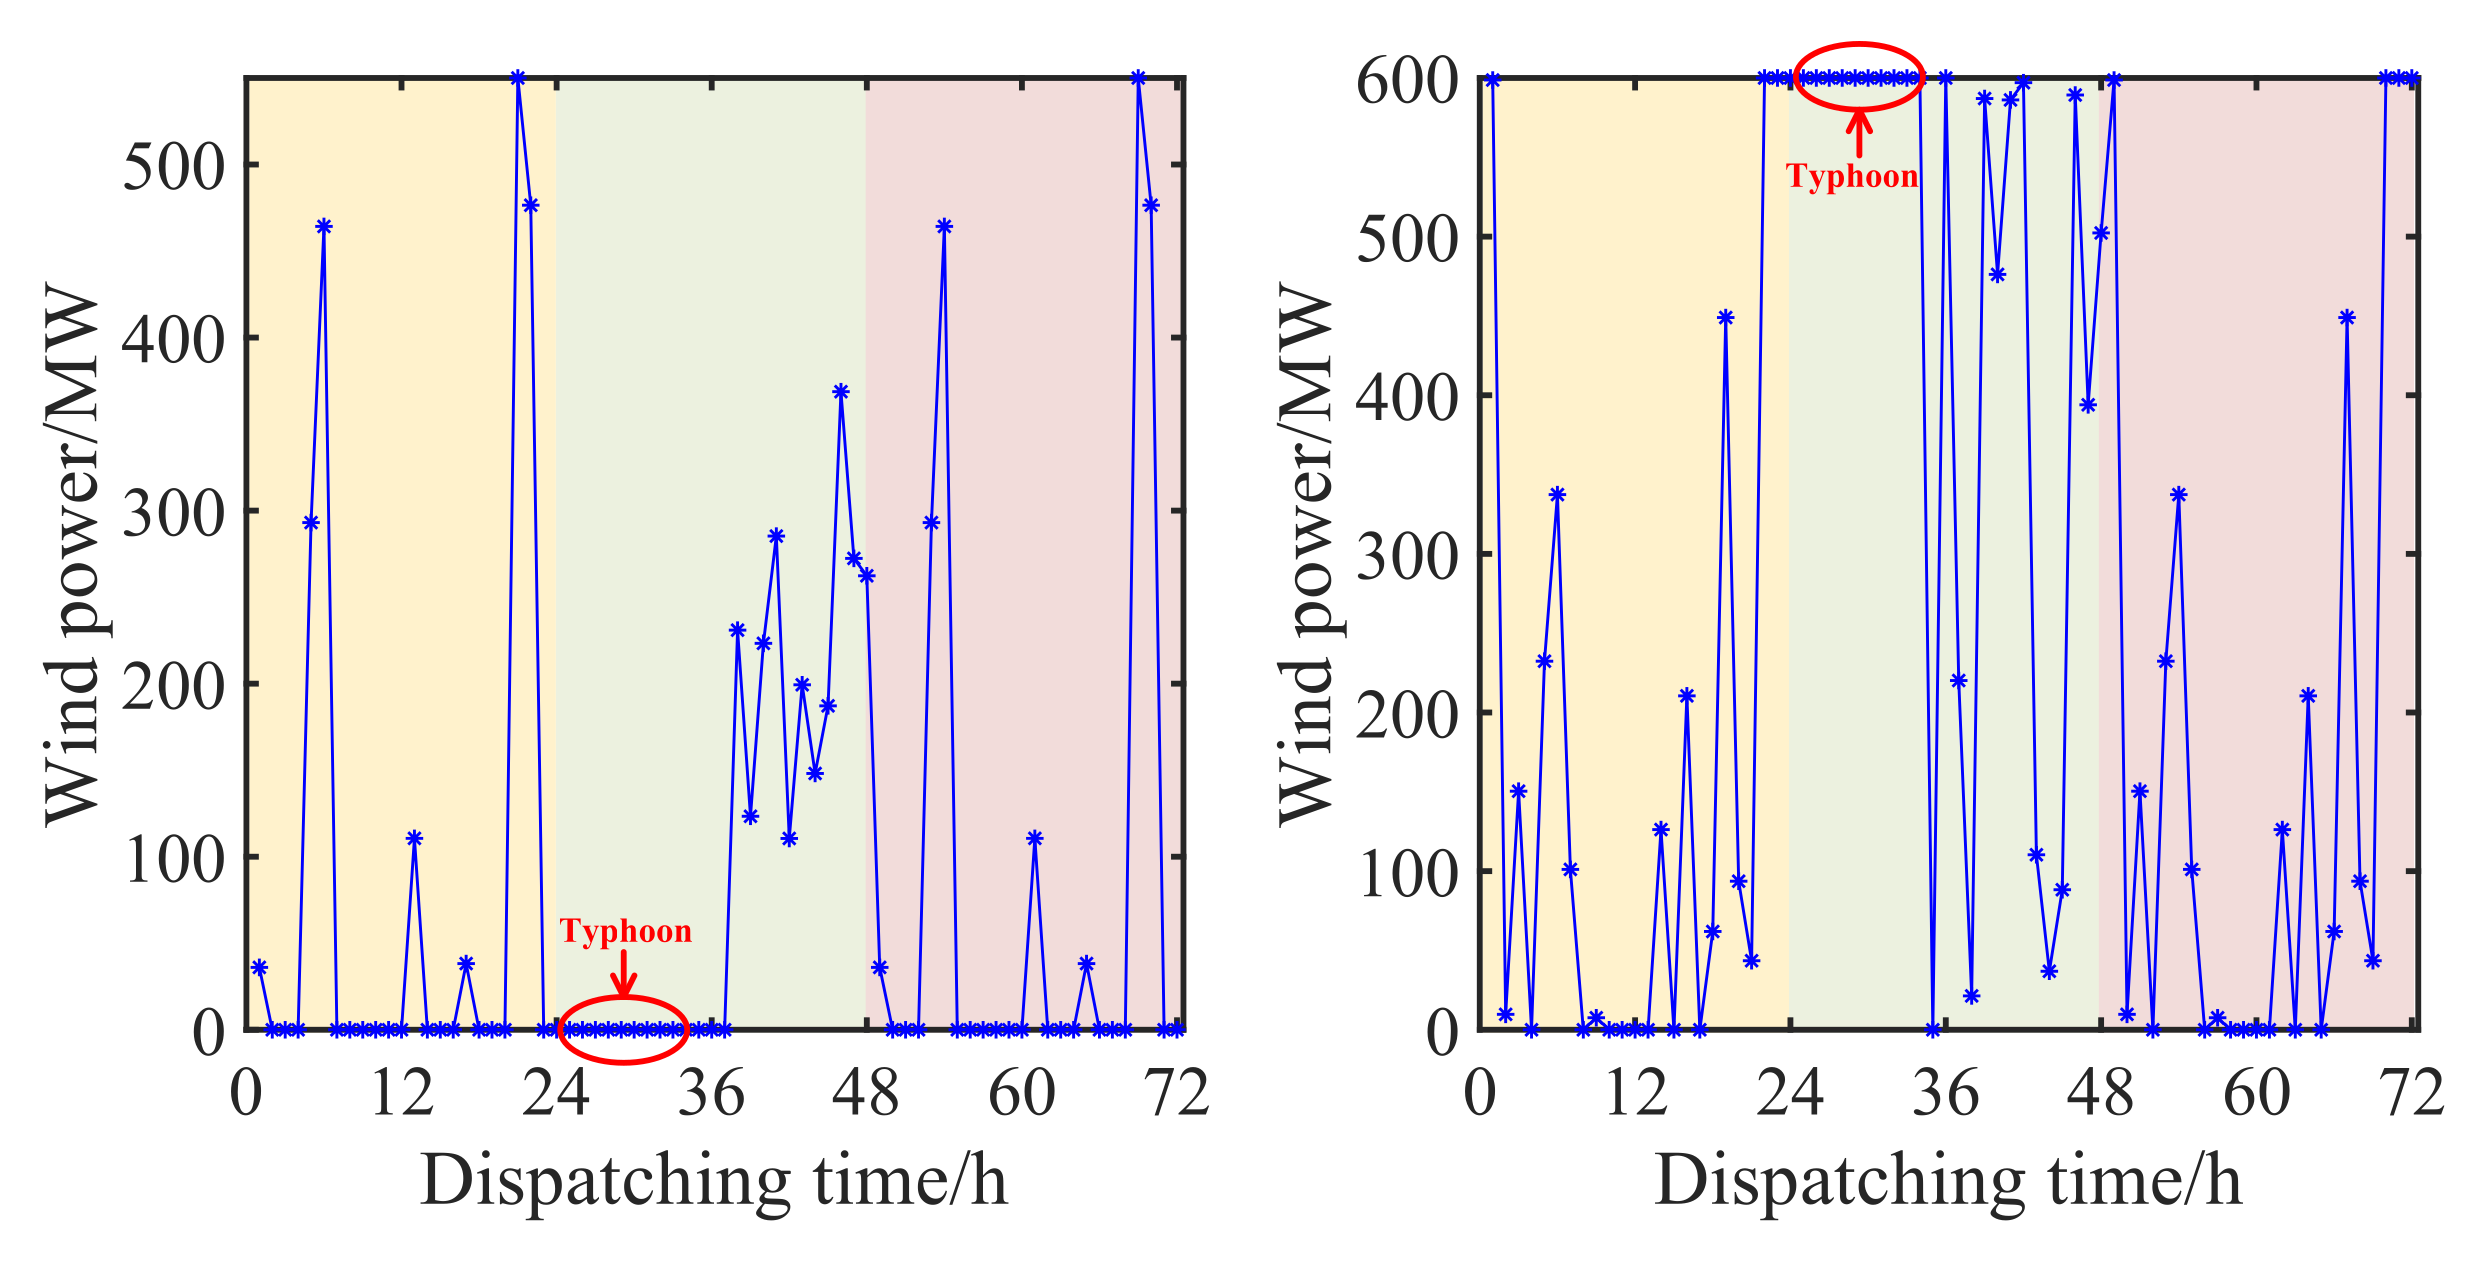
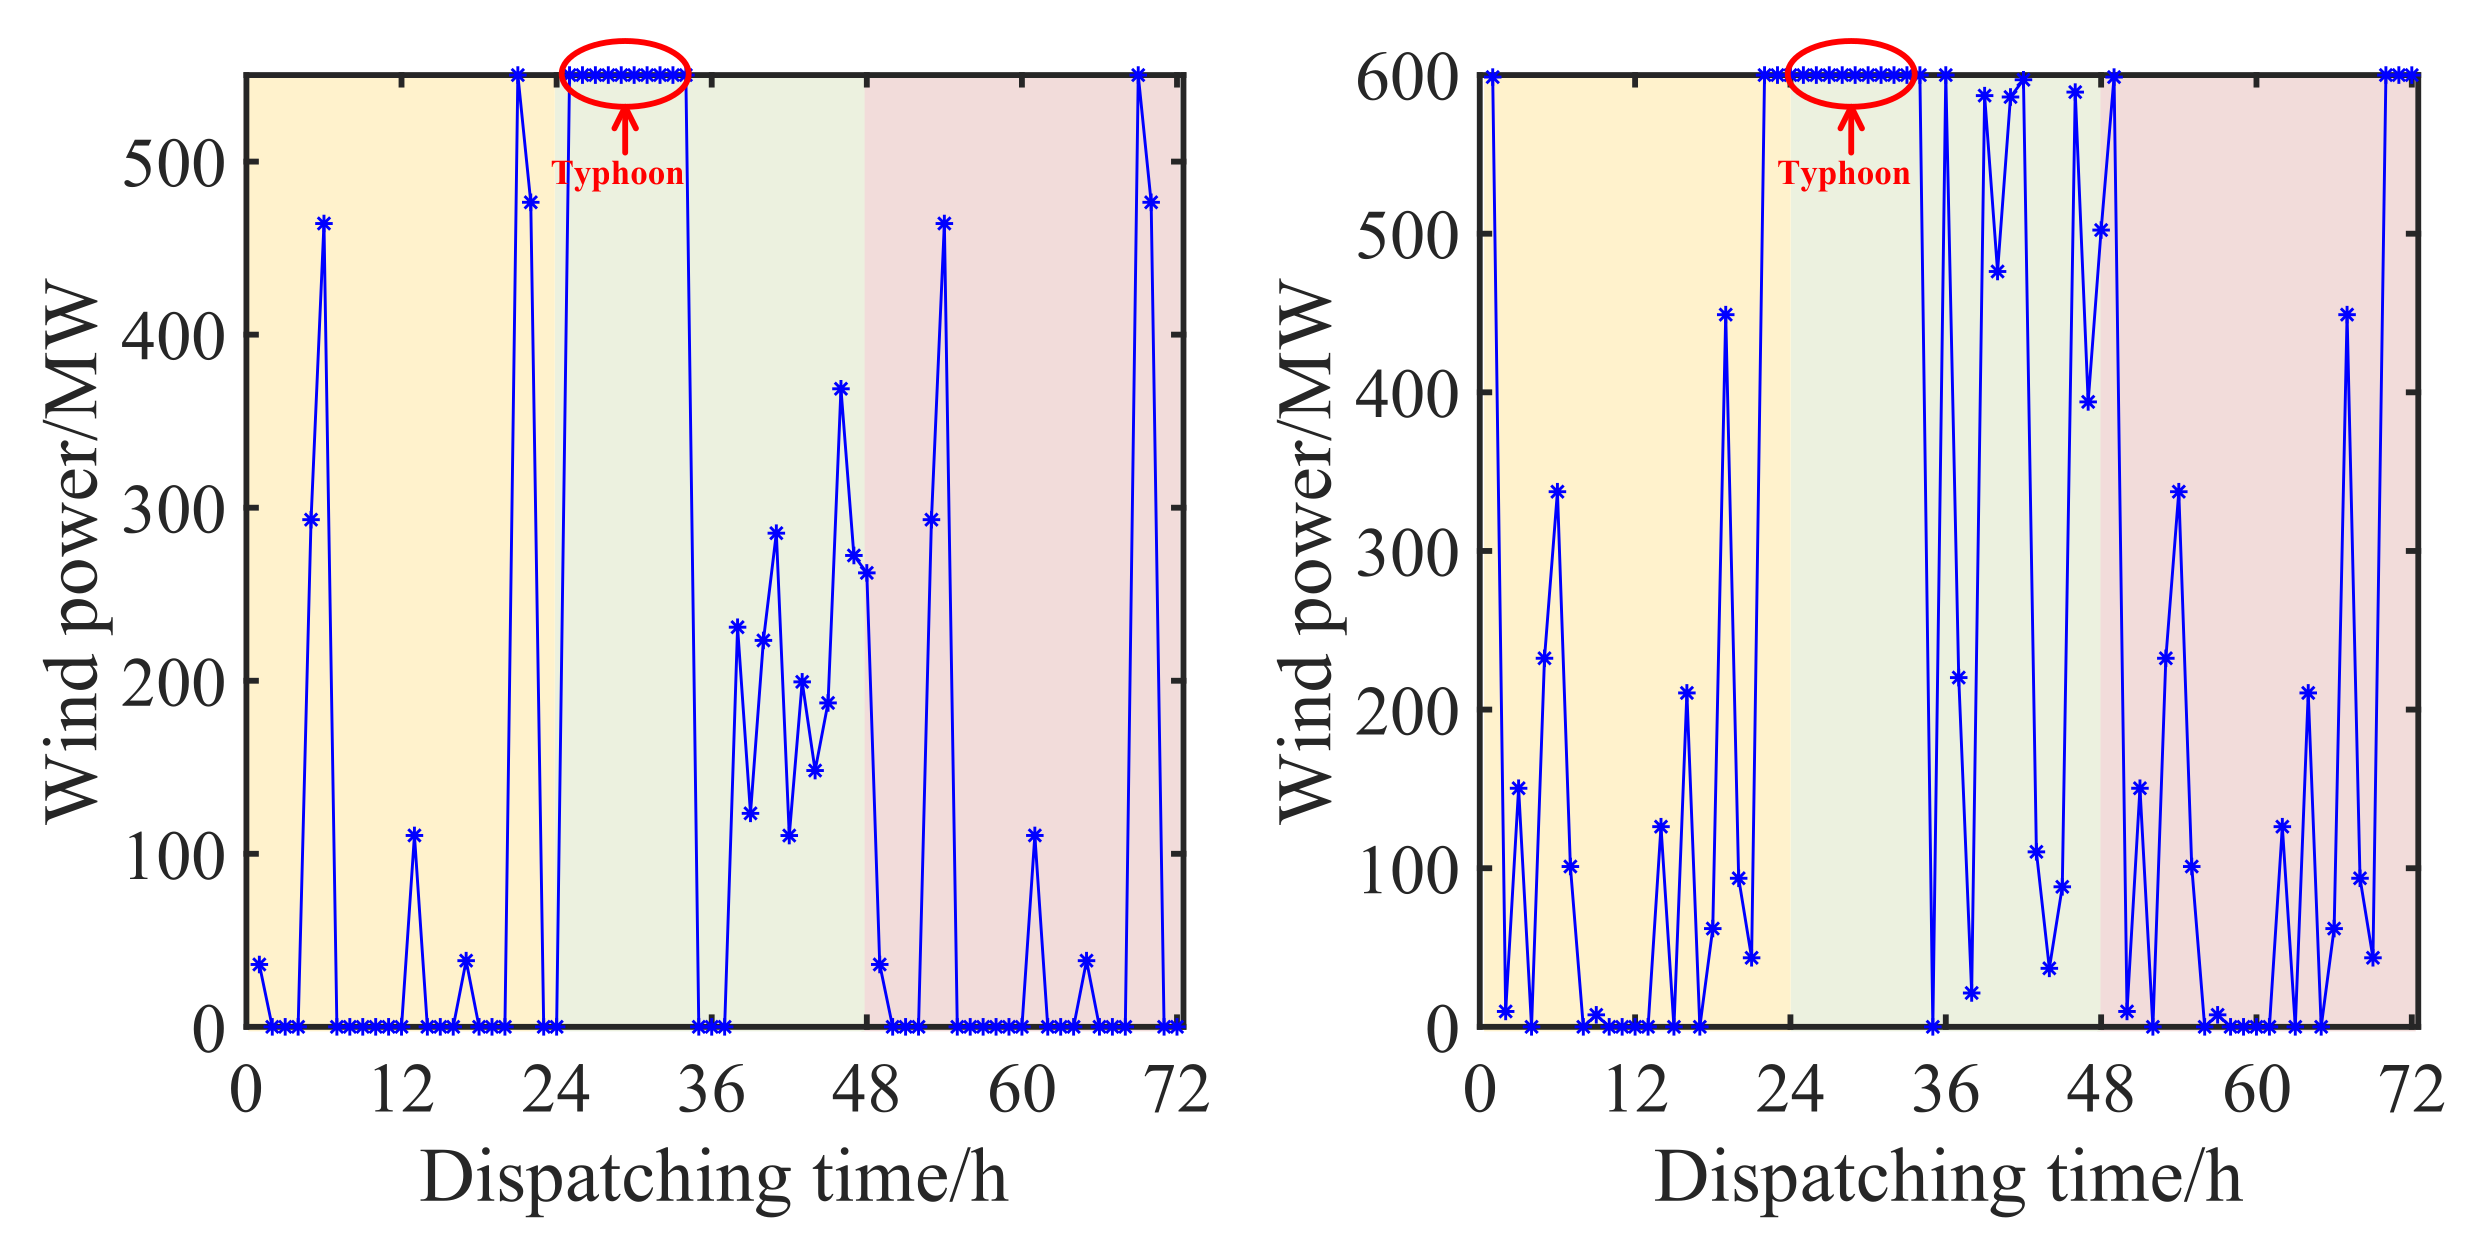
4.3. Analysis for Dispatching Results of Nine Possible Combined Scenarios during Typhoon Periods

In order to reflect the impact of the typhoon on wind power, as shown in Table 5, nine combined scenarios of wind farms output under the action of the typhoon are established, in which two wind farms are running at off-line, heavy and full capacity during the typhoon periods and the scenario generation and reduction techniques are used for each combined scenario to obtain 10 representative scenarios which reflect the fluctuation and uncertainty of wind power output. It should be noted that the heavy power generation in this paper refers to the situation that the wind power output is greater than 70% of the rated value. The data setting rule of system load is that the load ratio of the day before, on, and after the typhoon is 1:0.7:1.2, which means that the user’s electricity consumption behavior meets the typical daily load curve before a typhoon occurs, and it is very likely to stop production and classes on the typhoon day, so the load value on the typhoon day is generally 70% of the typical daily load. Due to the loss of shutdown on the typhoon day, some factories may increase electricity consumption to increase production, so the daily load after typhoon may be greater than the typical daily load. Further, in order to use the wind power output combined scenarios example in the typhoon environment in the paper more intuitively, the initial scenario wind power of nine combined scenarios are shown in Figure 8, Figure 9, Figure 10, Figure 11, Figure 12, Figure 13, Figure 14, Figure 15 and Figure 16, respectively.
Here, the analysis for the output distribution results of the system power supply under each scenario after the 72-h pre-dispatching is presented. The optimization results of the two wind farms with nine combined scenarios in Table 5 are shown in Figure 8, Figure 9, Figure 10, Figure 11, Figure 12, Figure 13, Figure 14, Figure 15 and Figure 16, respectively. According to the results of optimization in each scenario, it can be seen that during the dispatching time of 0–24, the hydropower is dominant and the wind power is almost completely consumed, which means the 72- hour pre-dispatching model can make the hydropower generate power as fast as possible on the day before a typhoon under the premise of sufficient wind power dissipation to make sure the hydropower station has sufficient flood storage capacity on the day of the typhoon. Additionally, during 25:00–34:00 of the typhoon, the heavy rainfall and wind power output accompanied by the typhoon makes the thermal operate at the minimum output. With the increase in wind power, that is, the wind output raise from scenario A1 to B2 and to C3, the hydropower also decreases to a smaller value, and the wind abandonment increases to a larger value. This reflects the fact that the power system will face the dual dispatching risk of wind curtailment and hydropower abandonment with some adverse operating conditions such as lower load and more unexpected wind power output. However, between 35:00 and 48:00, that is, the remaining dispatching period of the typhoon day, the wind power output gradually returns to a normal level, and the hydropower begins to coordinate with the wind power. Finally, on the day after the typhoon at 49–72 of dispatching time, it is easy to find that the hydropower station has priority over thermal power in the case of wind power consumption, so that the water accumulated on the day of the typhoon can be consumed in time and the daily dispatching of the reservoir capacity can be restored. Wind abandonment only can be found at 70:00, which means the improvement of wind consumption. Therefore, the proposed optimal dispatching strategy of the multi-source power system in a typhoon environment can reasonably arrange the unit output in different typhoon scenarios to ensure the secure and economic dispatching of the system.
In Figure 17, due to the extremely high wind speed caused by the typhoon, the wind power in typhoon periods is zero, which can be observed from 25:00 to 34:00. Besides, it is obvious that the hydropower output almost reaches its limits during the typhoon periods, which means that the zero value of wind power output can help the consumption of hydro with a possible capacity increase from the rainfall companied by the typhoon. Additionally, the in-time adjustment for the capacity of hydropower stations can keep its flexibility for later coordinated dispatching. For instance, compared with the day before the typhoon, the wind abandonment has a smaller value than the day after the typhoon with the elimination and decrease in wind power abandonment, respectively at 5:00 and 22:00 of the day after typhoon. Besides, as shown in Figure 8, the wind abandonment mainly concentrates at 39:00–42:00 and 46:00–48:00 on the day of the typhoon. The wind power will become larger when the typhoon passes through, and the power load is smaller due to the possible suspension of production and classes. Thus, due to the dual impact on wind power consumption, wind power curtailment is likely to occur.
In Figure 18, with both of the wind farms at the state of heavy capacity, the wind abandonment becomes much larger than that of the results of combined scenario A1. As the output of hydro and thermal power is extremely low, it is impossible to make further consumption for wind power. Meanwhile, as there is the largest fluctuation of wind power in combined scenario B2, the thermal power has to undertake the burden of wind power tracking when the hydropower is limited by the concession for wind power consumption.
The combined scenario C3 has the largest wind power output during the typhoon periods from 25:00 to 34:00, which leads to the worst results for wind power consumption, as shown in Figure 19. Additionally, the thermal power units have to run at the minimum technology output value to avoid wind abandonment as much as possible.
Figure 20 and Figure 21 show the results of combined scenarios with the two wind farms being offline and heavy capacity because of typhoon disaster, respectively. It can also be seen from the comparison that the wind farm with larger installed capacity will lead to more wind power abandonment. In particular, the wind curtailment will occur at 25:00, 28:00, and 31:00–34:00 in combined scenario A2 when the 600 MW installed wind farm is in a heavy capacity state, while the wind curtailment can only be found at 32:00–34:00 in combined scenario A2 when the 550 MW installed wind farm is in a heavy capacity state. Therefore, it is necessary to pay more attention to further study on the impact of large installed capacity wind power. Figure 22 and Figure 23 show the results of combined scenarios with the two wind farms being offline and full capacity because of typhoon disaster, respectively. Additionally, it can also be seen from the comparison that the wind farm with larger installed capacity will lead to more wind power abandonment. In particular, the wind curtailment of combined scenario A3 when the 600 MW installed wind farm is in a full capacity state is larger than that of the combined scenario C1 when the 550 MW installed wind farm is in a full capacity state. Therefore, the contrast above reflects the necessity to pay more attention to further study on the impact of large installed capacity wind power again. Figure 24 and Figure 25 show the results of combined scenarios with the two wind farms being heavy and full capacity because of typhoon disaster, respectively. Additionally, the phenomenon still can be found that the wind farm with larger installed capacity will lead to more wind power abandonment. In particular, the wind curtailment of the combined scenario C3 when the 600 MW installed wind farm is in a full capacity state is larger than that of the combined scenario B3 when the 550 MW installed wind farm is in a full capacity state at 25:00, 28:00, 33:00 and 34:00. Anyway, the necessity of more research on the dispatching strategy for the larger installed capacity still can be verified.

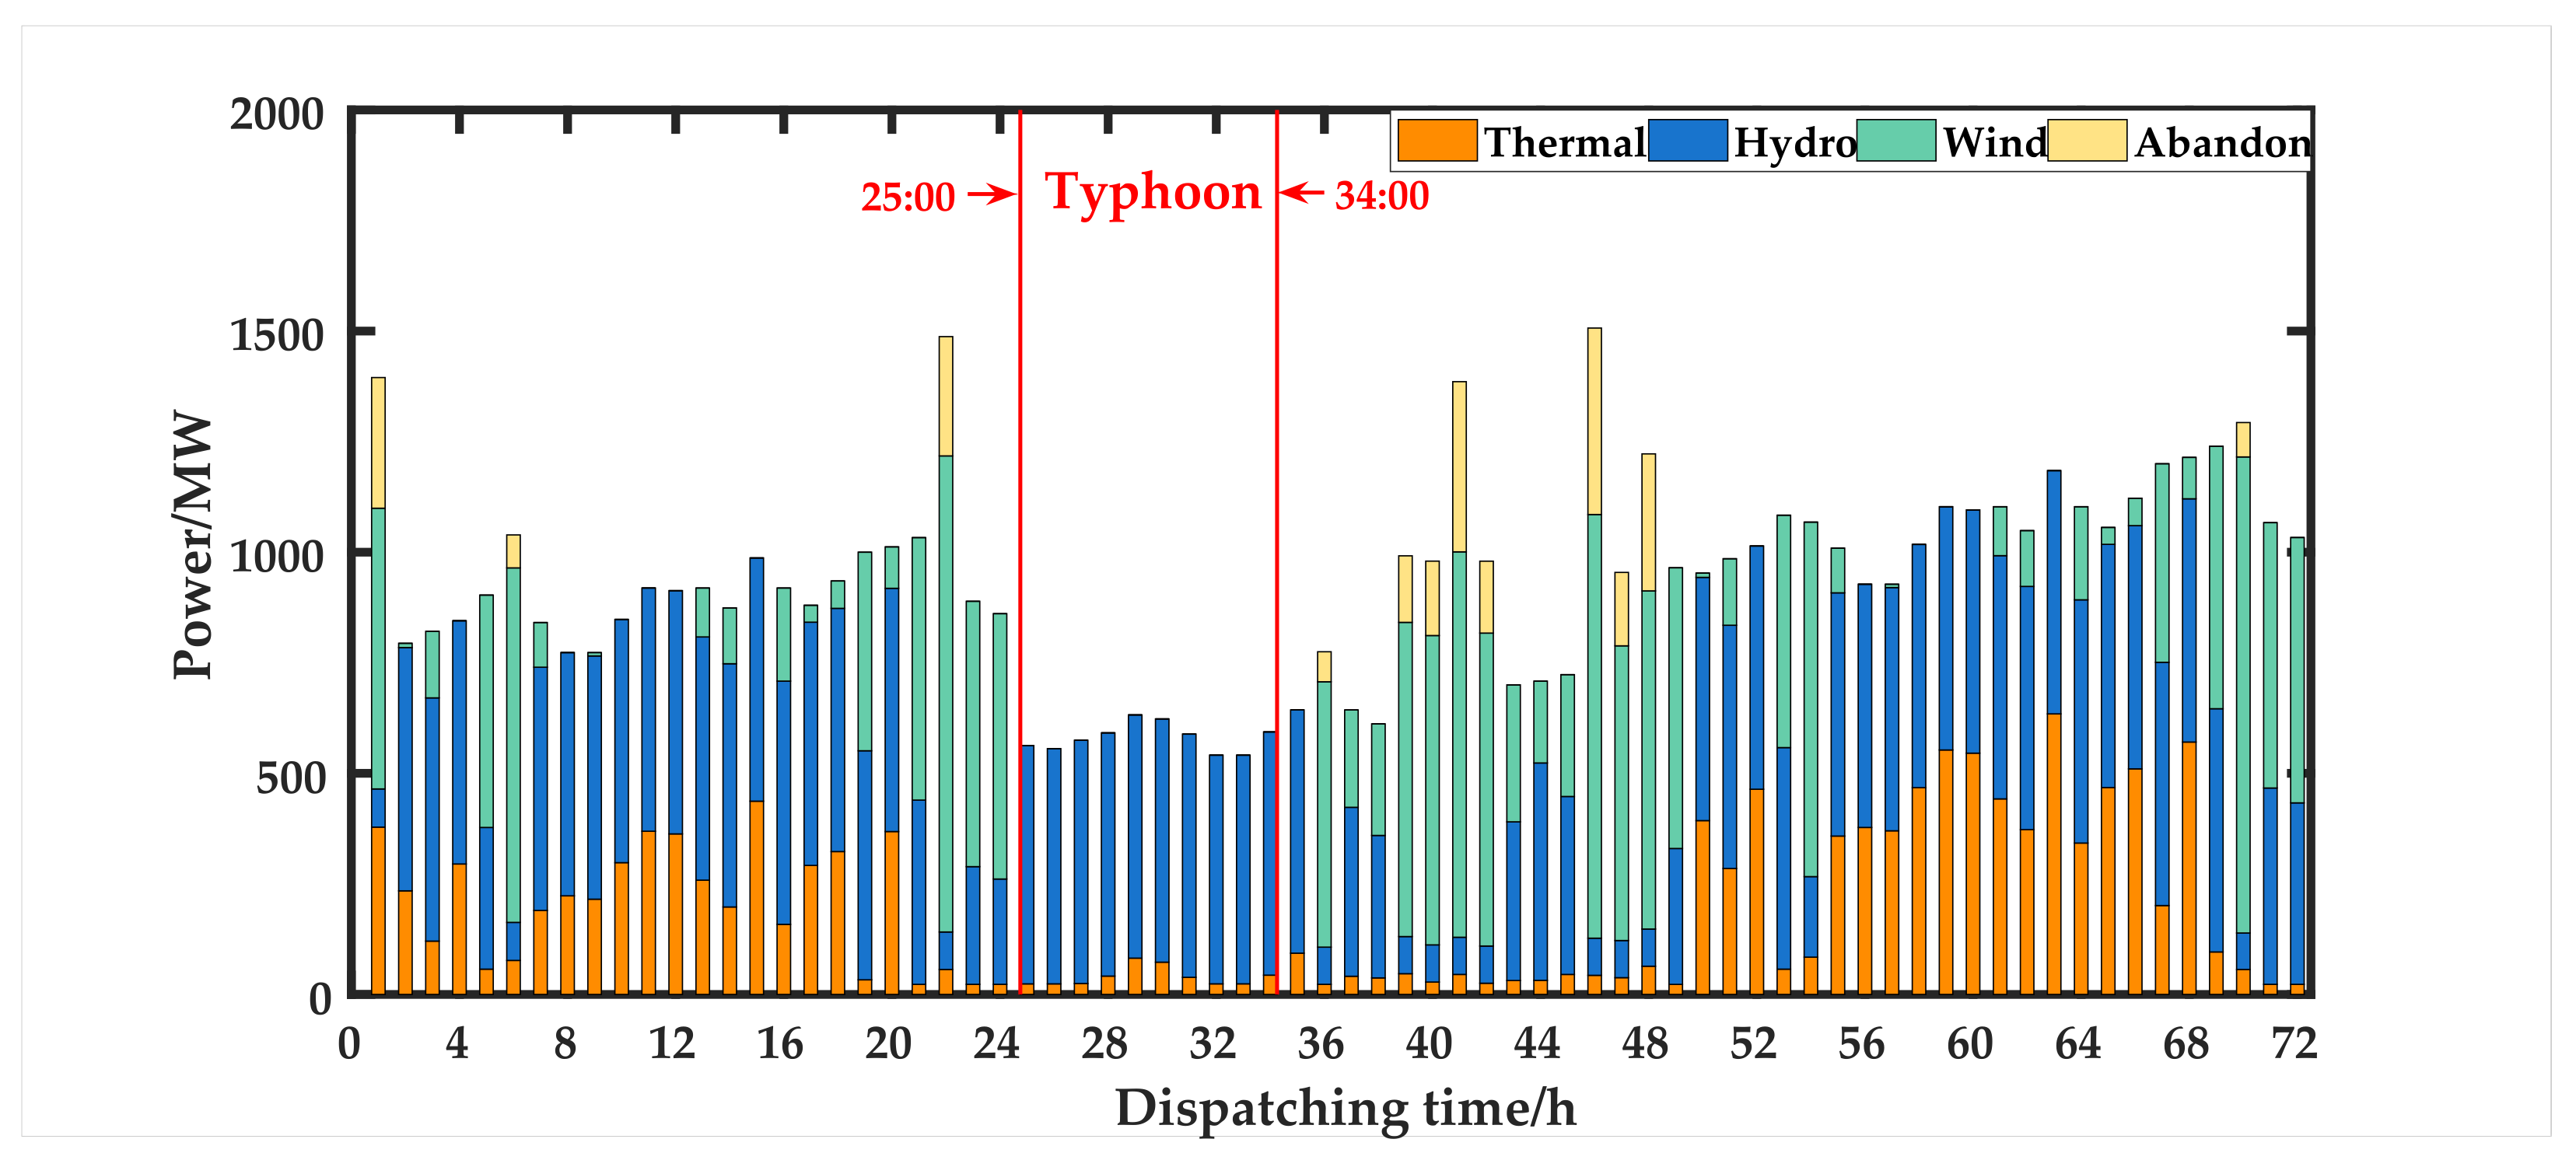
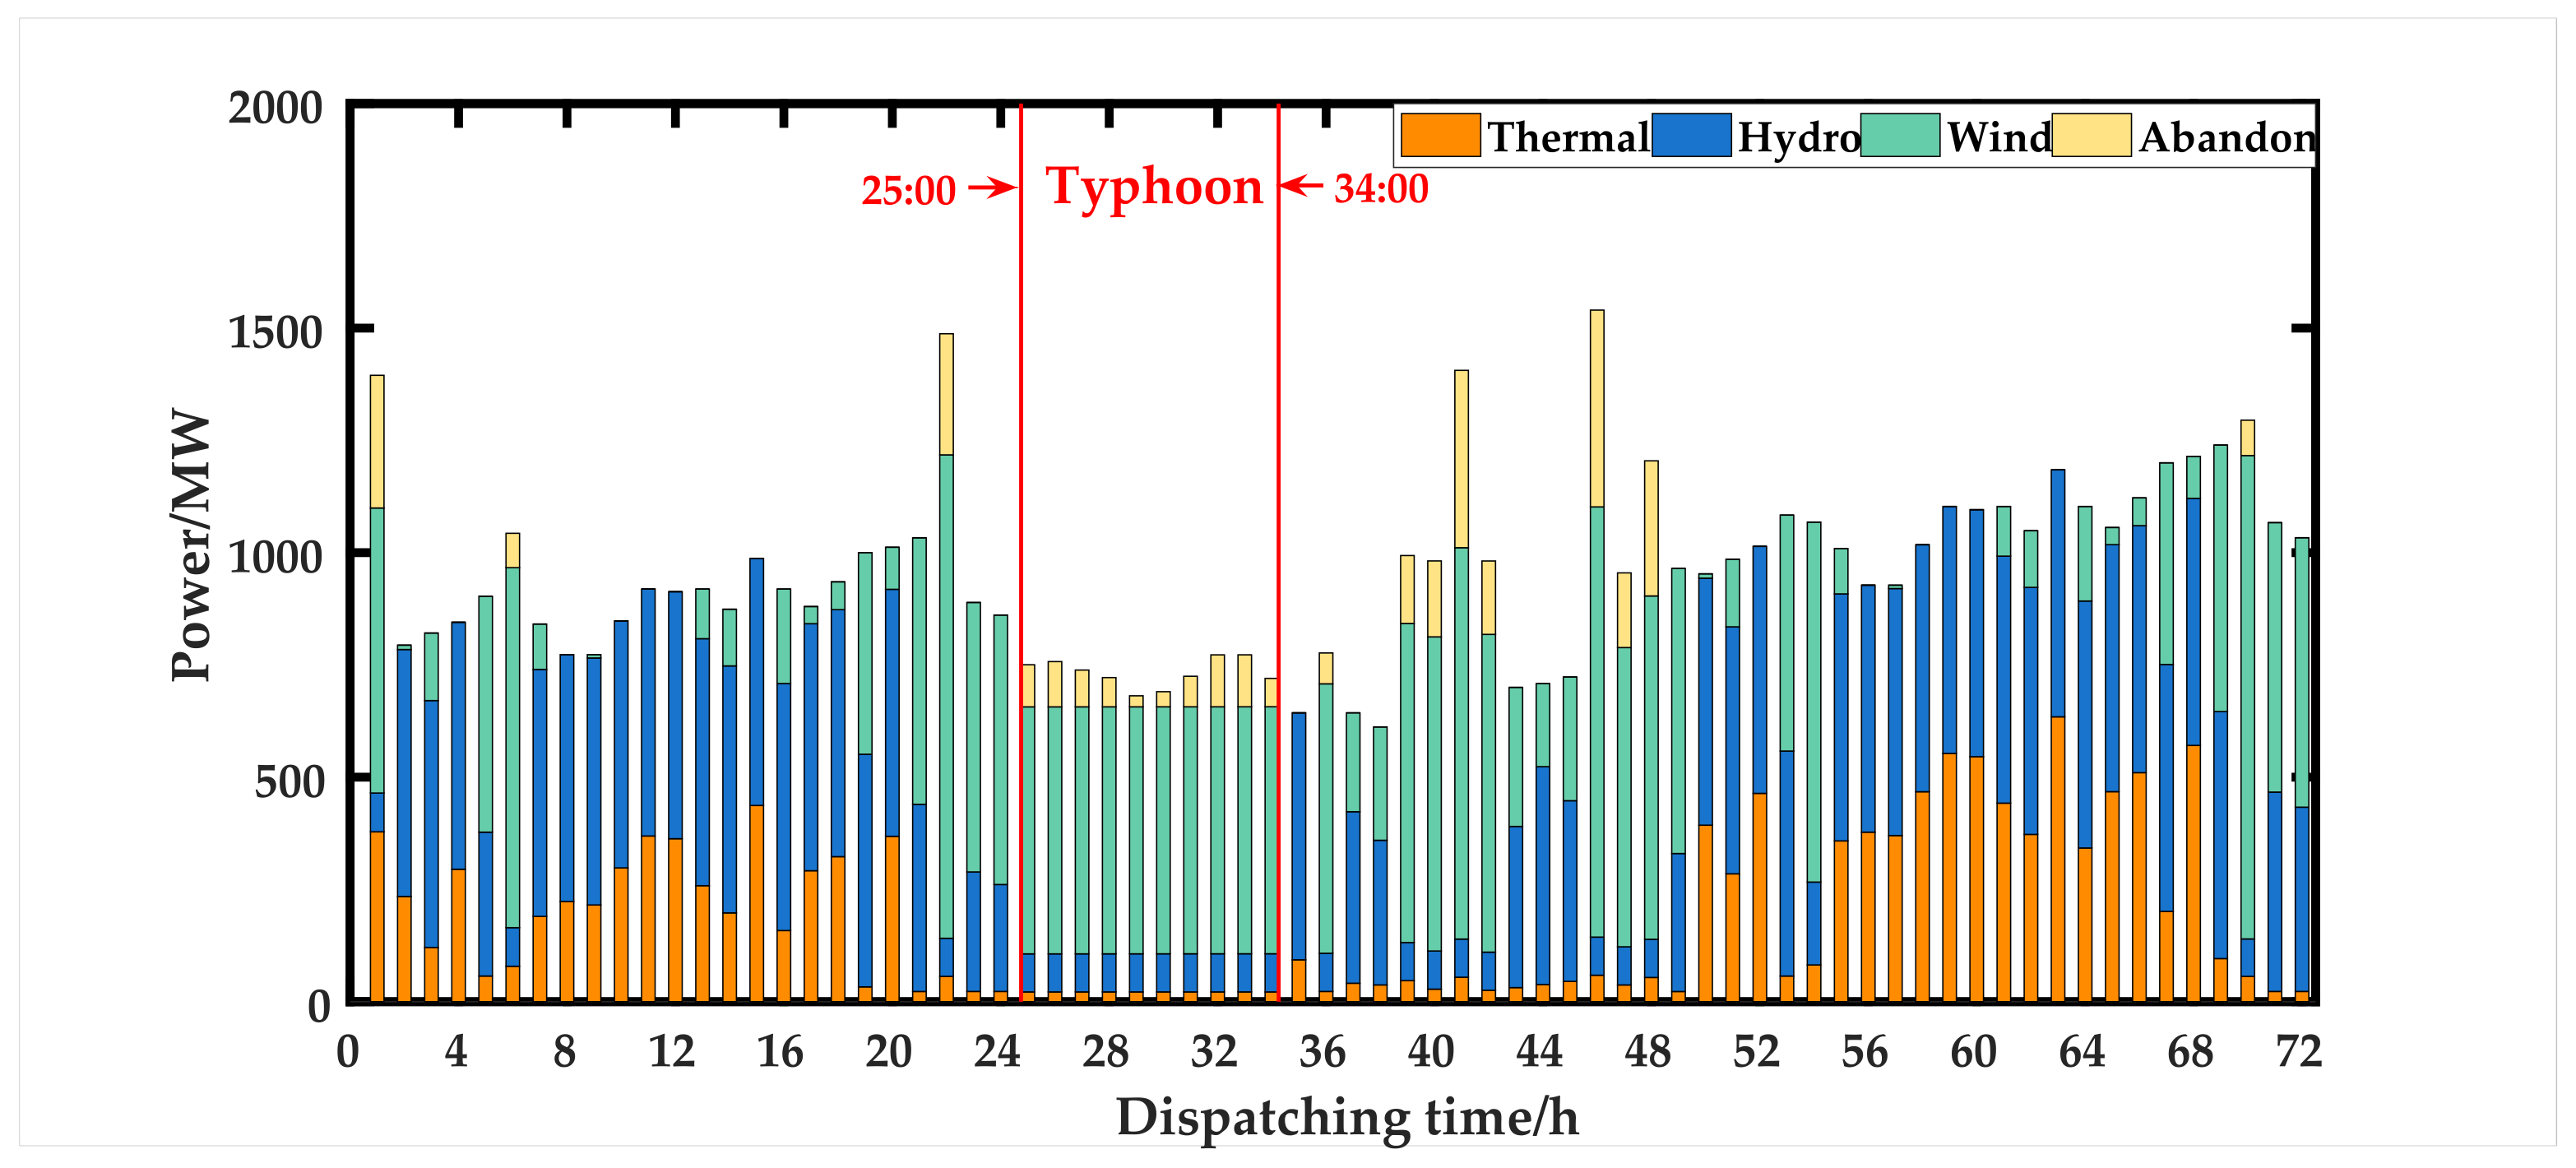
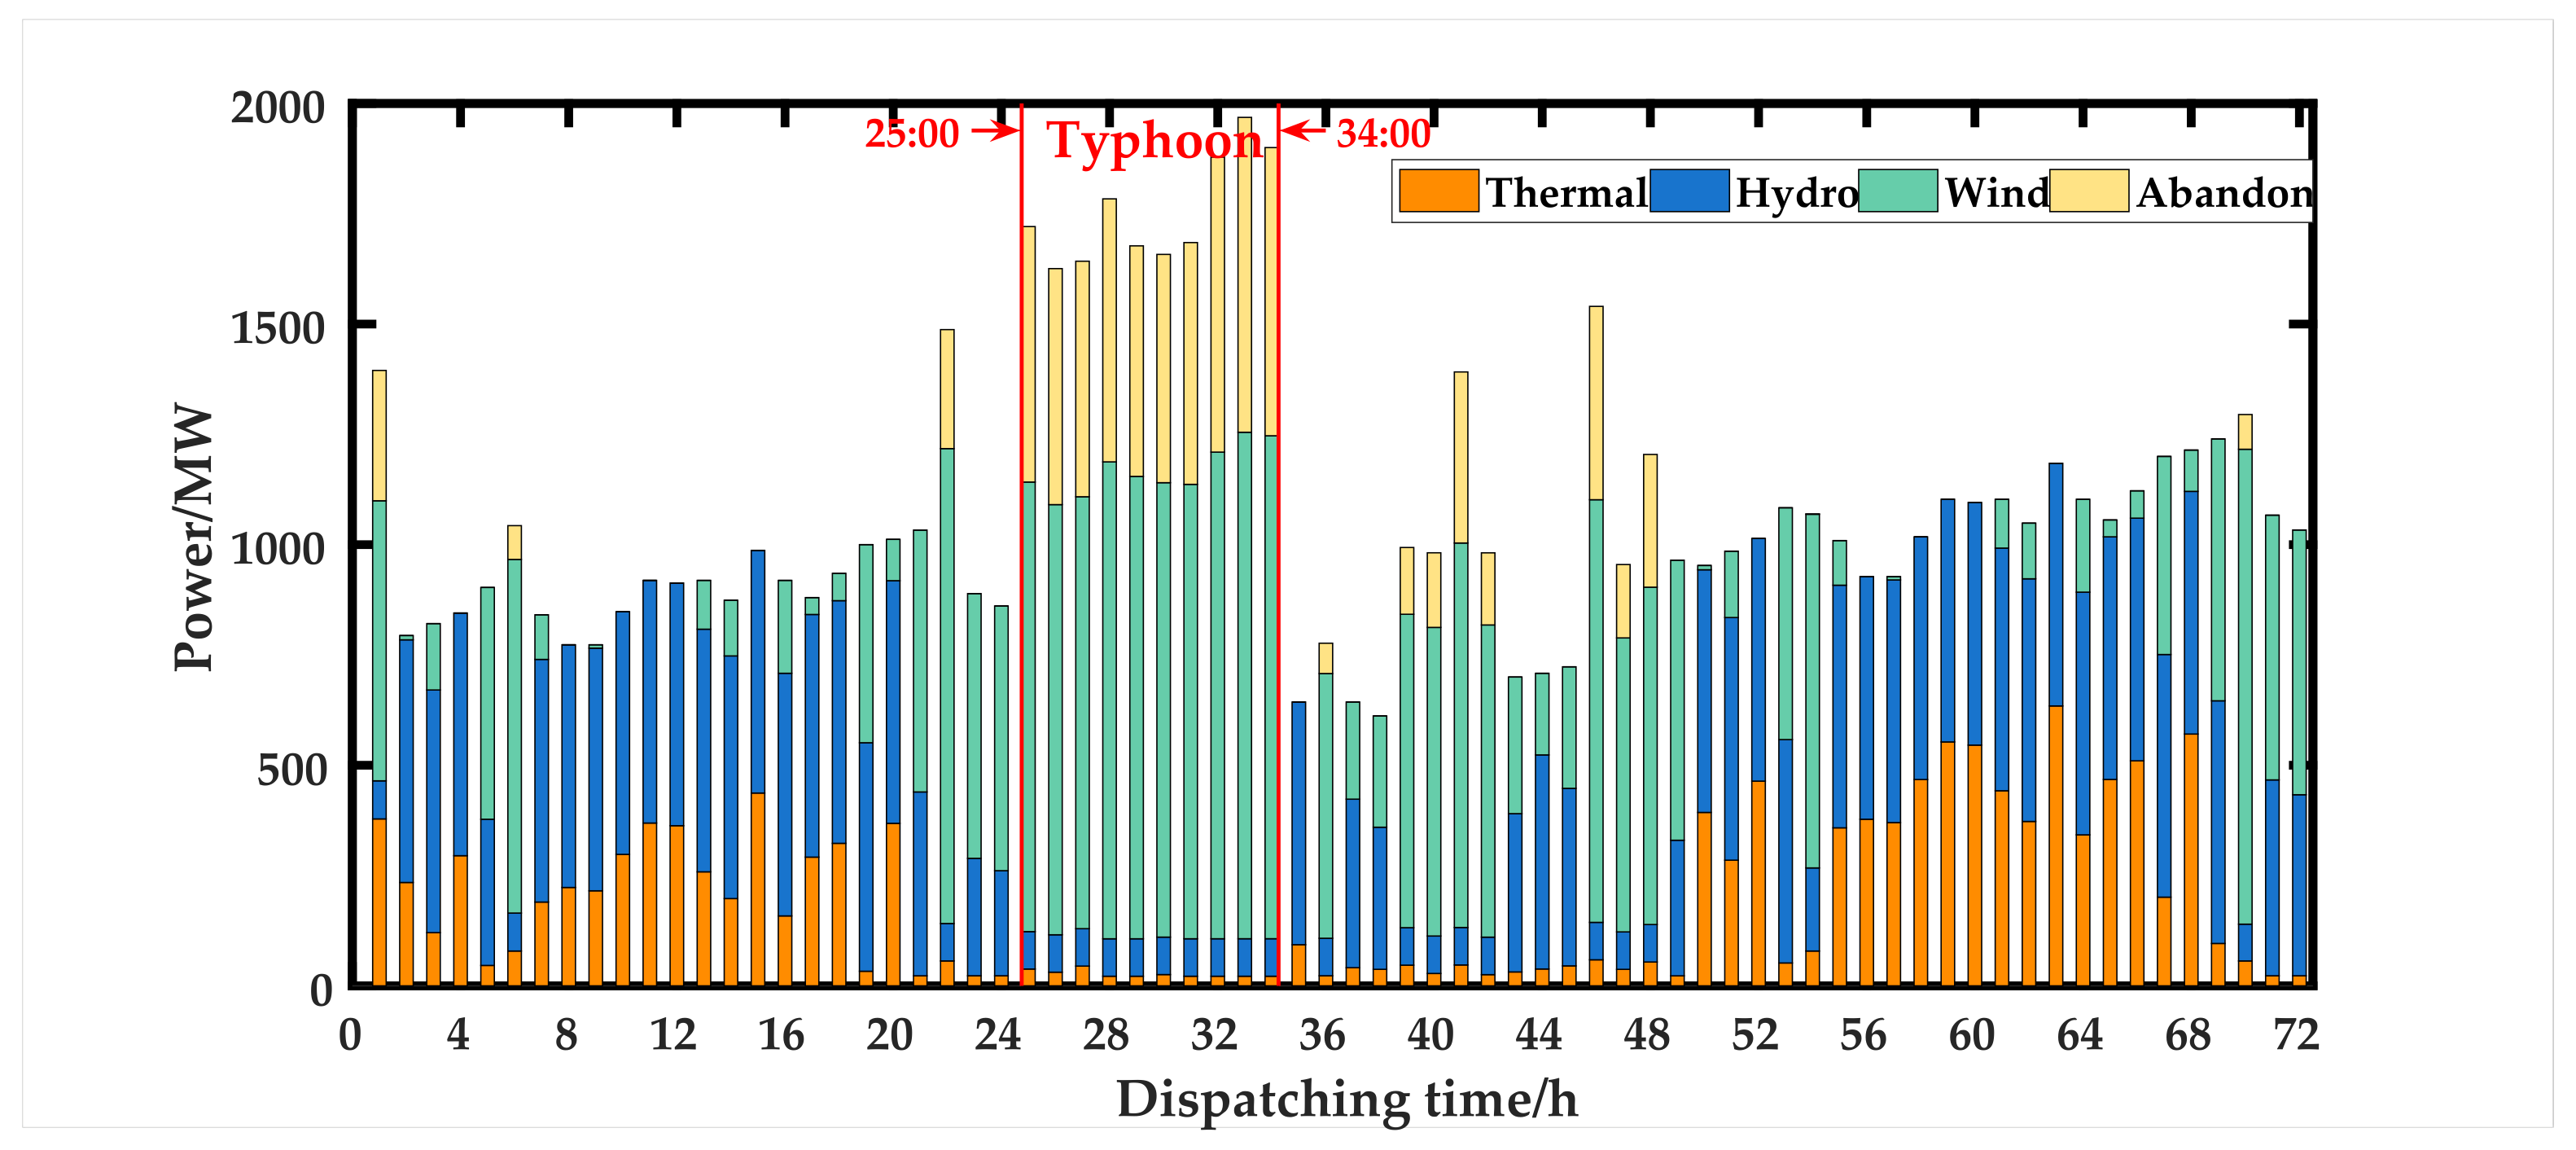
4.4. Analysis for Optimization Results of Worse Case Based on Combined Scenario B2 during Typhoon Periods

In conditions of abnormal environmental such as typhoons, the sudden and large-scale changes of wind power scenarios will occur more easily. Therefore, it is necessary to study the dispatching strategy for some worse cases. The optimization results of worse cases with the scenario analysis method, respectively based on 0%, 25%, 50%, and 75% initial scenarios wind power for combined scenario B2, are shown in Table 6. It should be noted that the initial scenario wind speed of two wind farms in combined scenario B2 both can output more than 70% of their rated power, which is very common in both daily and typhoon days. Additionally, the occurrence of the typhoon can bring both sudden and large-scale changes to the wind speed, which corresponds to a certain percentage change of the initial scenarios for the scenario analysis method. Therefore, the results based on the combined scenario B2 with heavy wind power capacity is representative and reasonable for the analysis about worse cases such as single or multiple wind power changing dramatically due to such abnormal environmental conditions.
As shown in Table 6, it is obvious that the reserved power increases with the increase in the severity of the environment, which corresponds to the results that the reserved cost, respectively, increases from CNY 8271 to CNY 37,233, to CNY 57,284, and to CNY 87,870 when the percentage of initial scenario power for the scenario analysis method decreases from 100% to 0% in three conditions. This is because a smaller percentage of that corresponds to a larger scale of wind power change due to a typhoon. Additionally, the most direct and effective way to deal with the changes is to increase the reserve cost, as other items in objective function have been closed to their limit of optimization with minor value variation, shown in Table 6. Additionally, it can also be observed that more system dispatching costs will be needed when the change of installed capacity is larger. This phenomenon reflects the network protection will become more important and meanwhile, the system’s economy will be sacrificed when the abnormal scenarios caused by typhoons become worse. Therefore, the proposed optimal dispatching strategy for a multi-source power system can realize the optimization of the dispatching economy on the premise of ensuring the safety of system operation by setting suitable reserve costs.

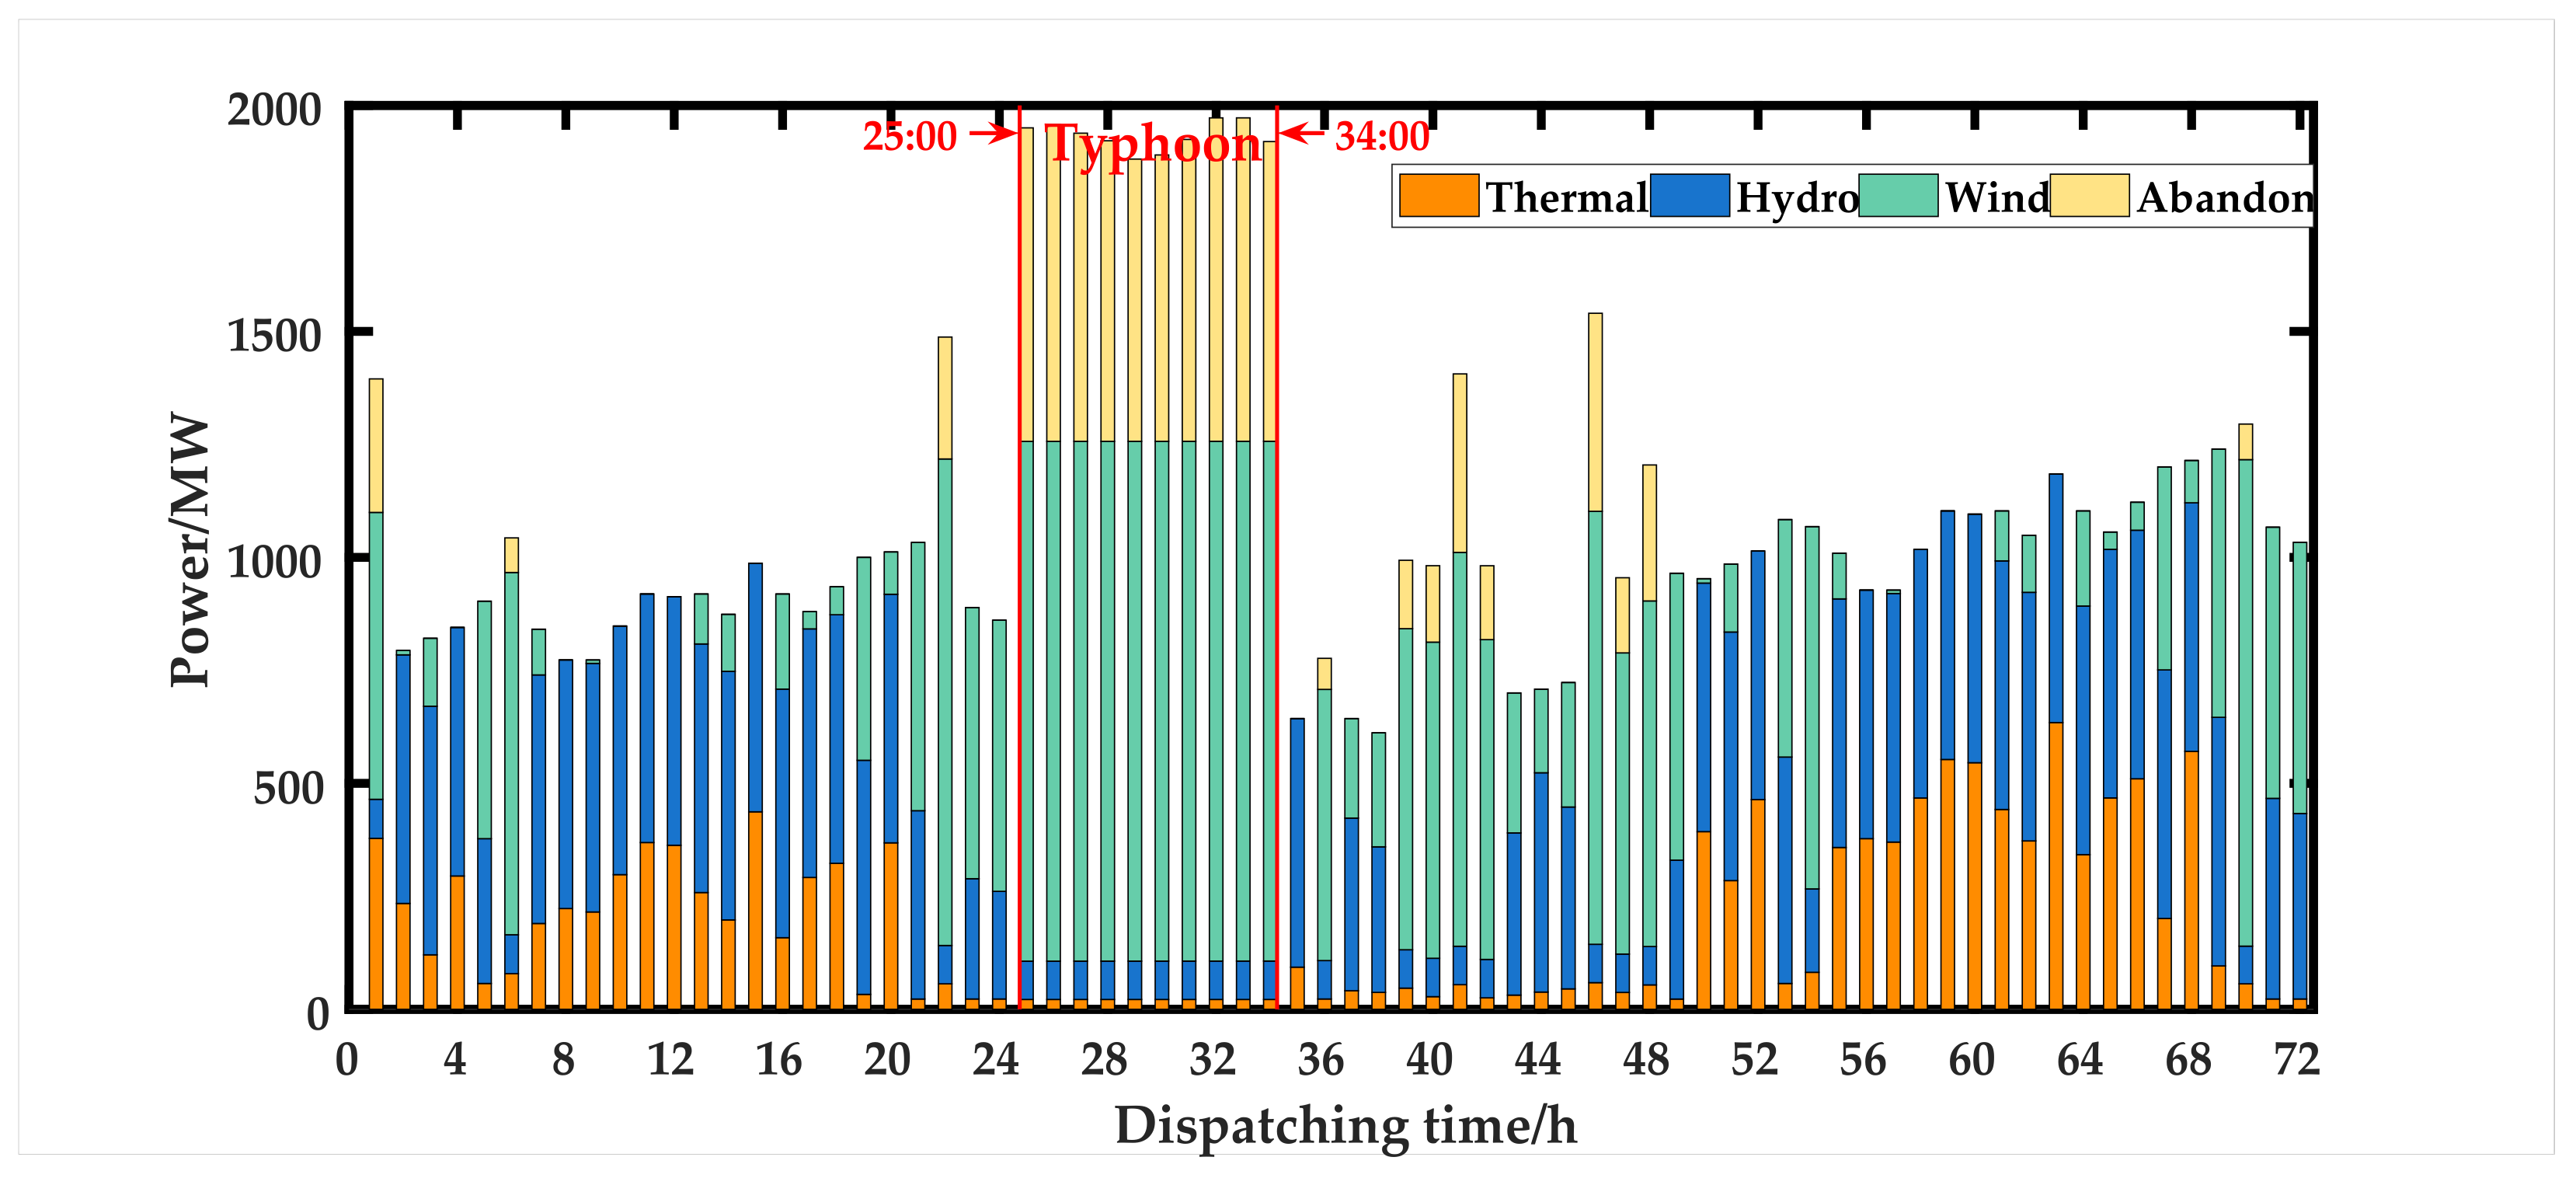
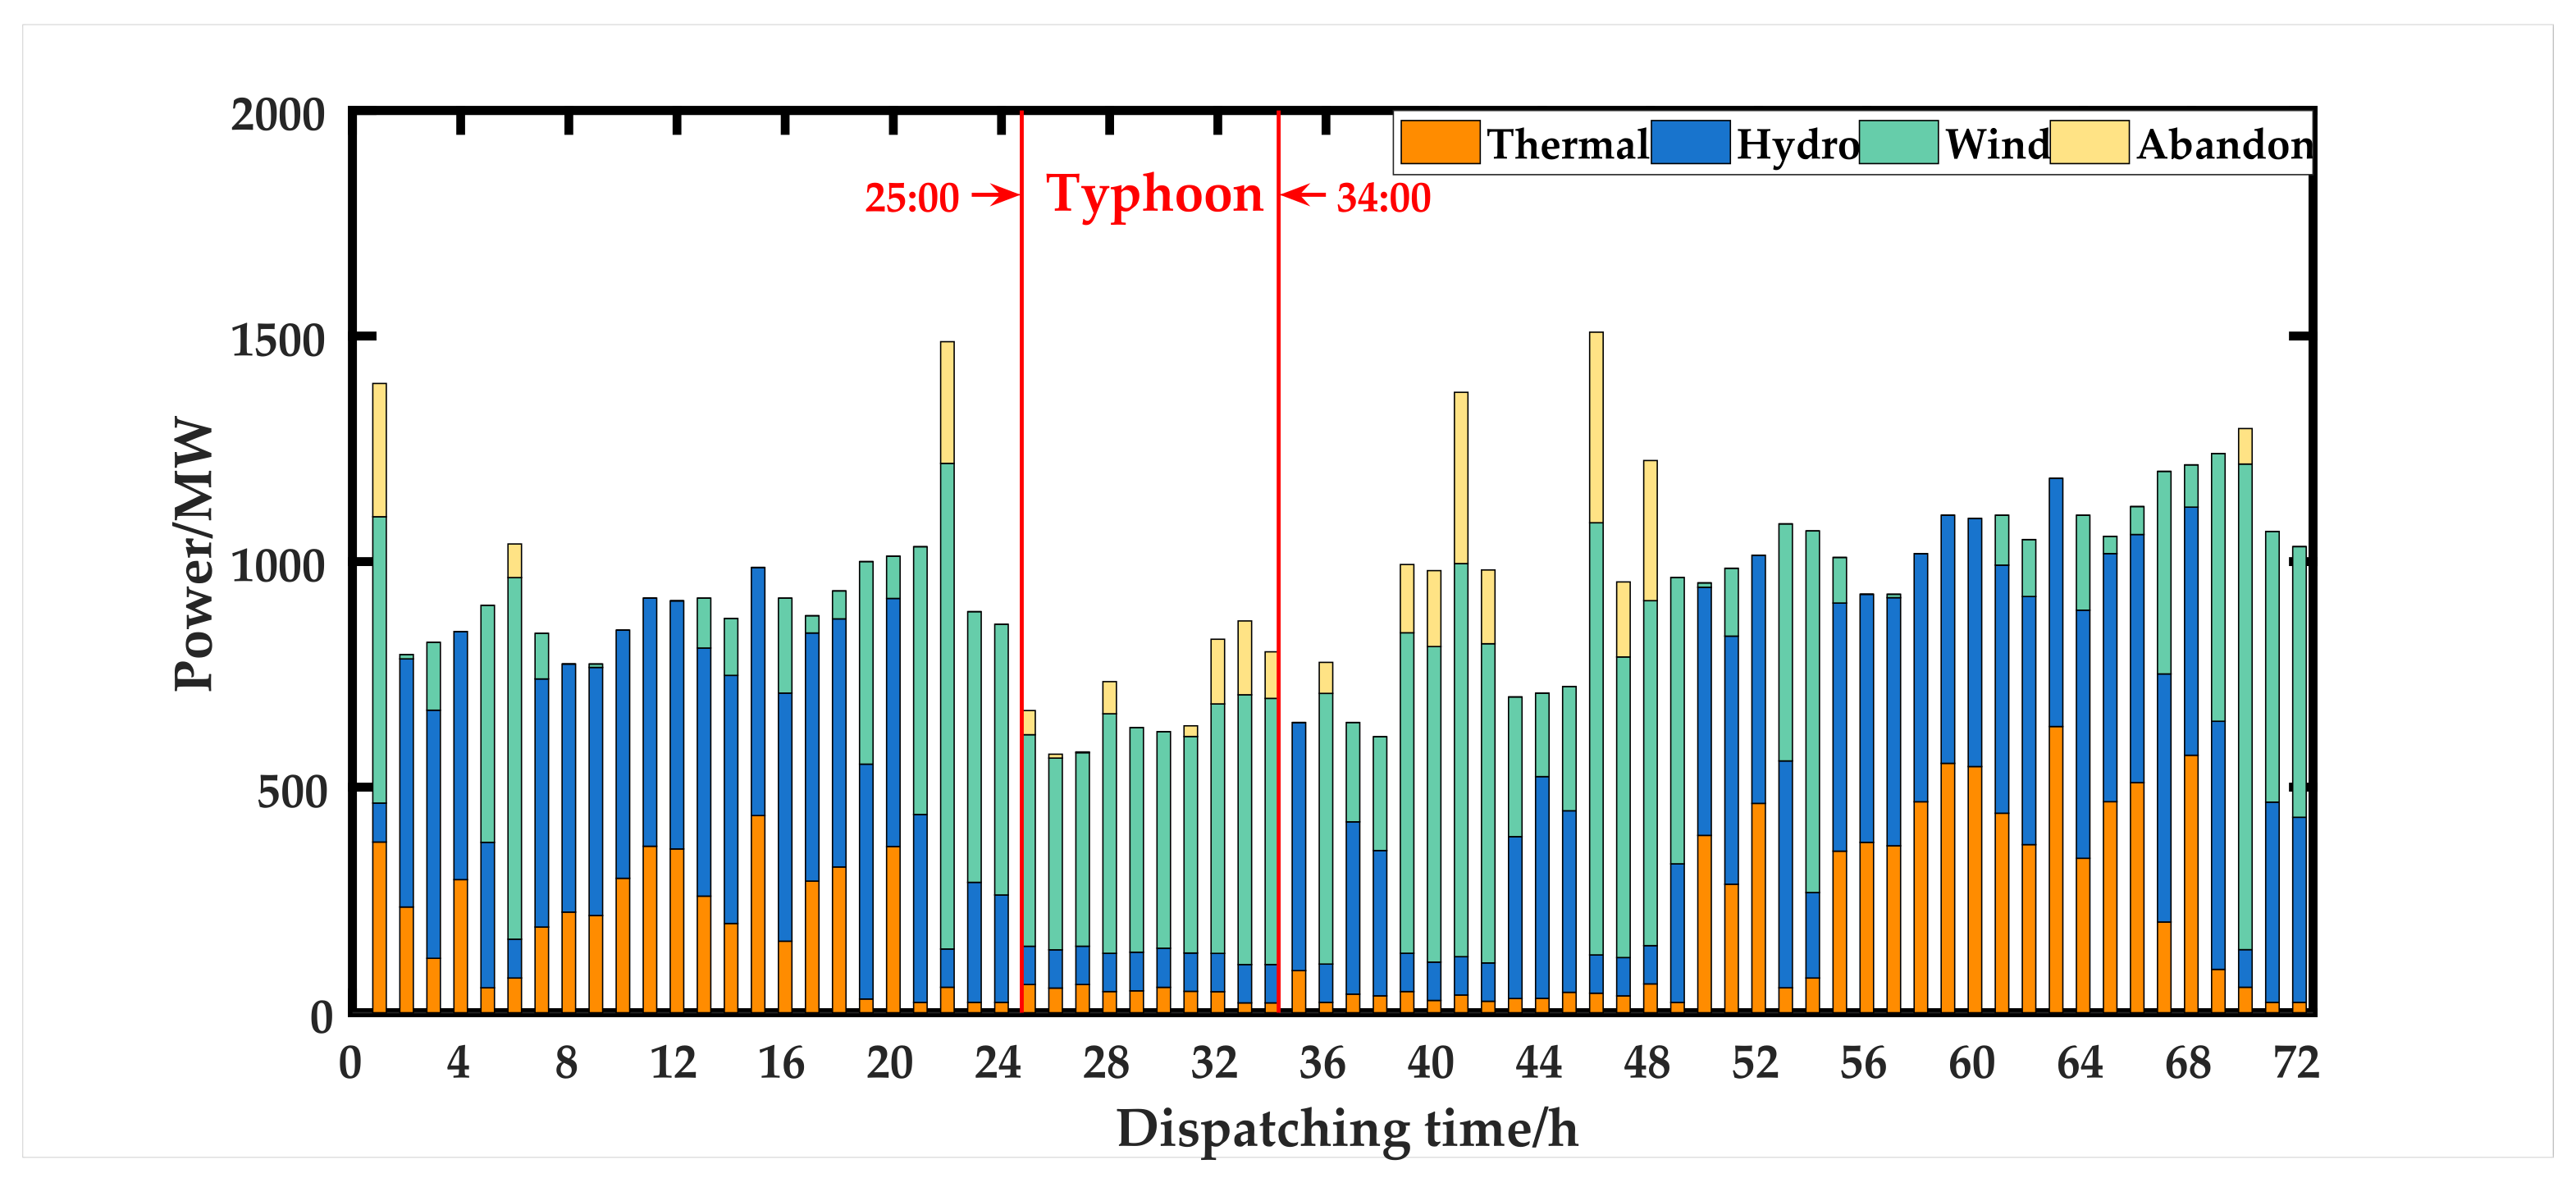
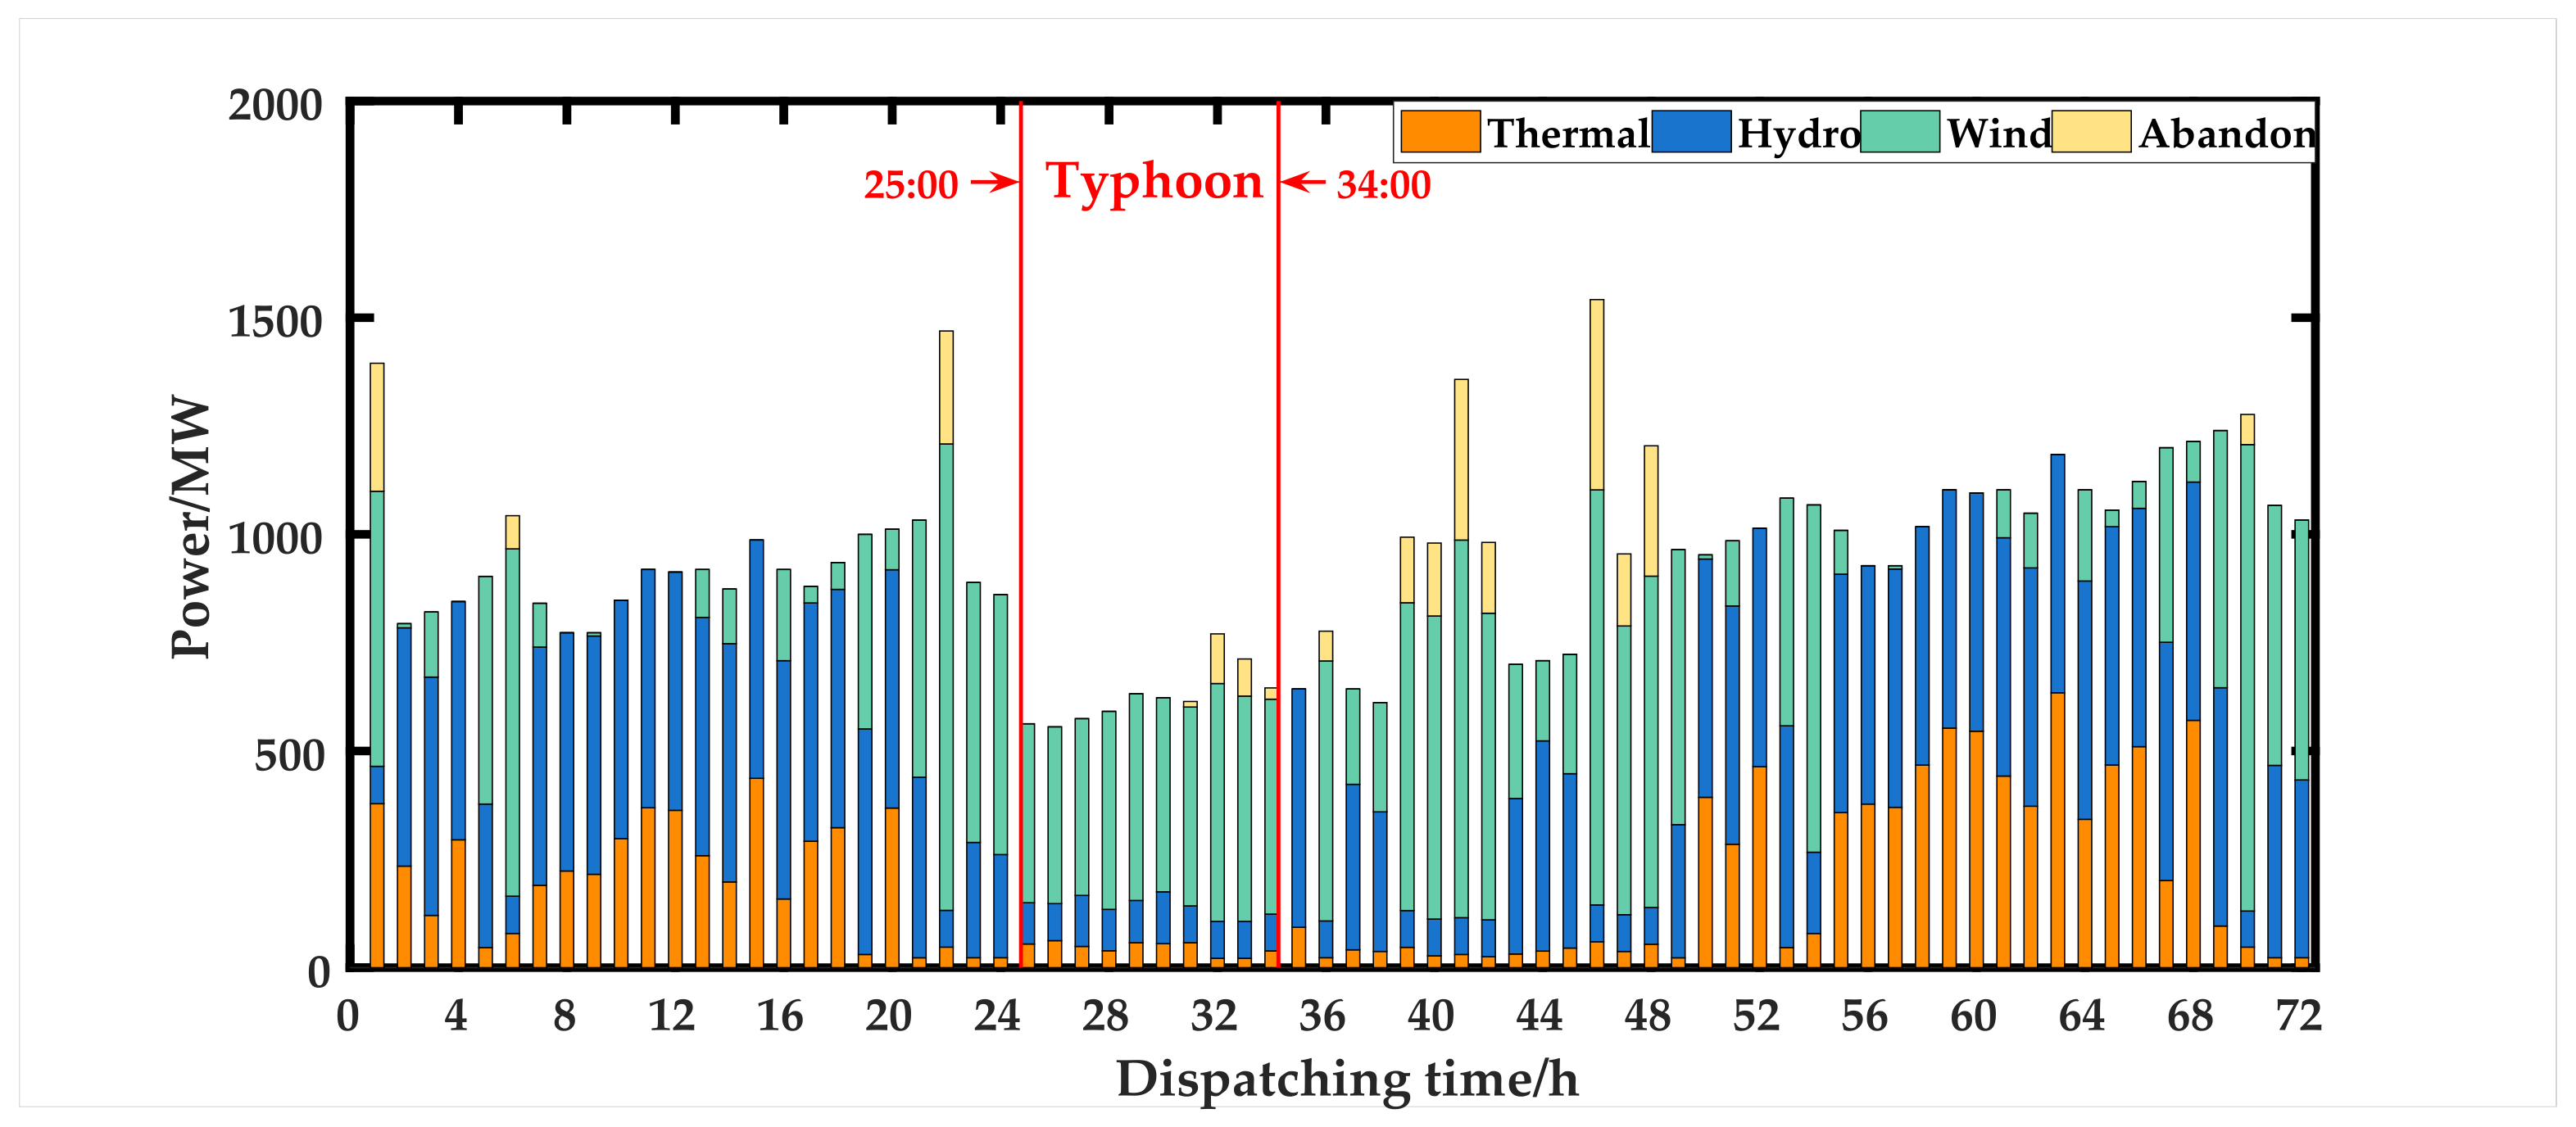
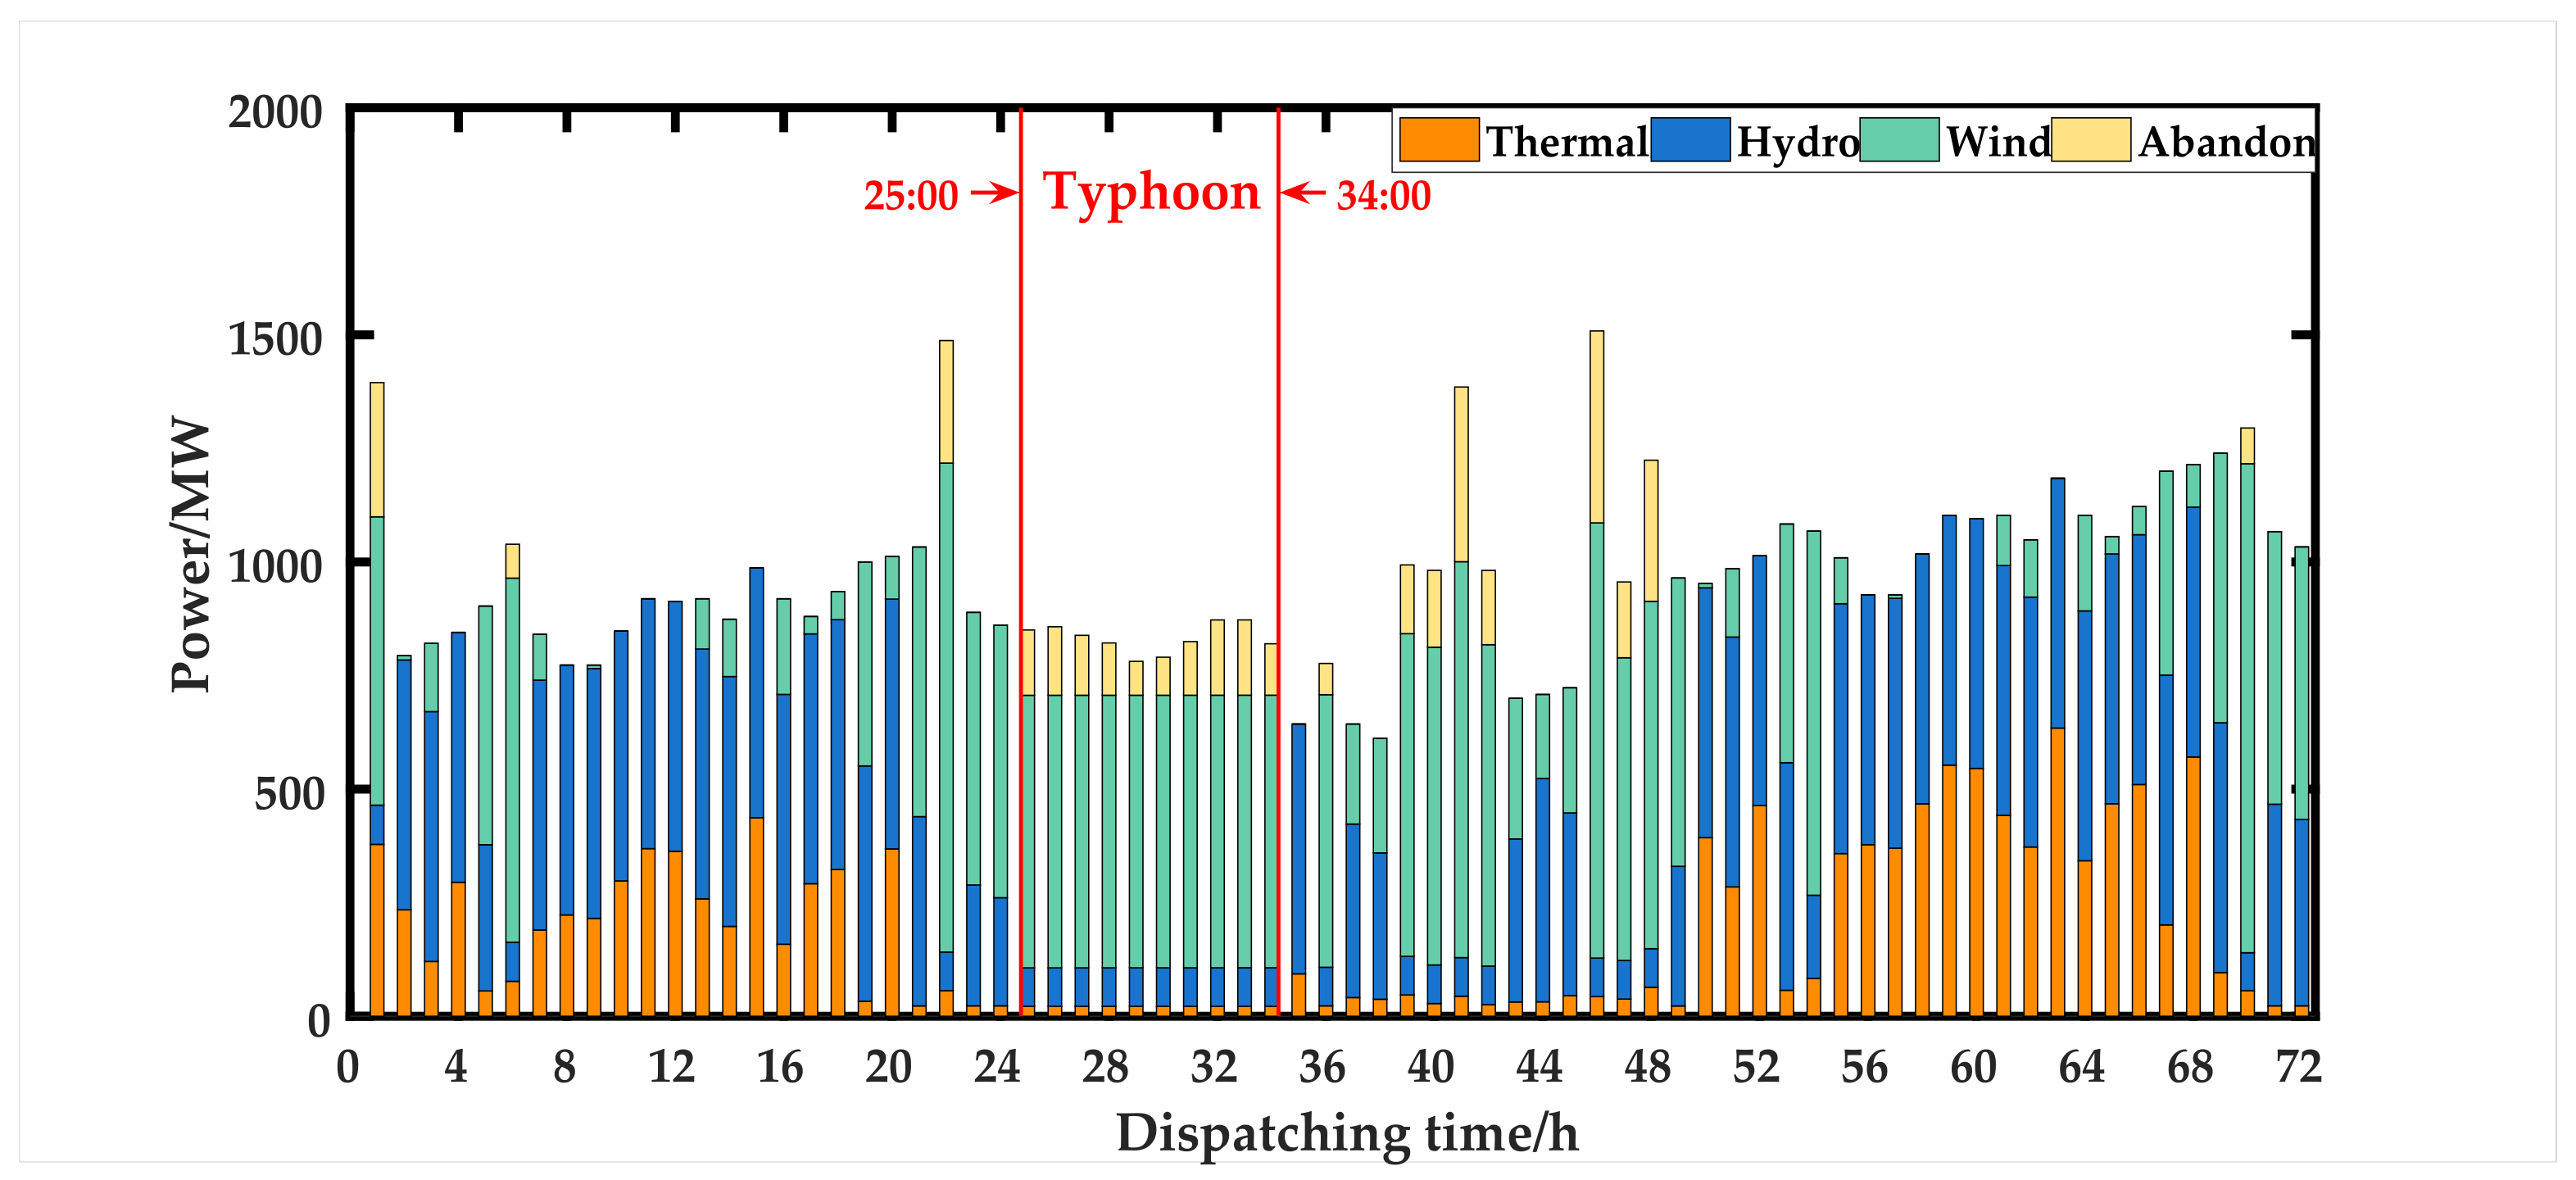
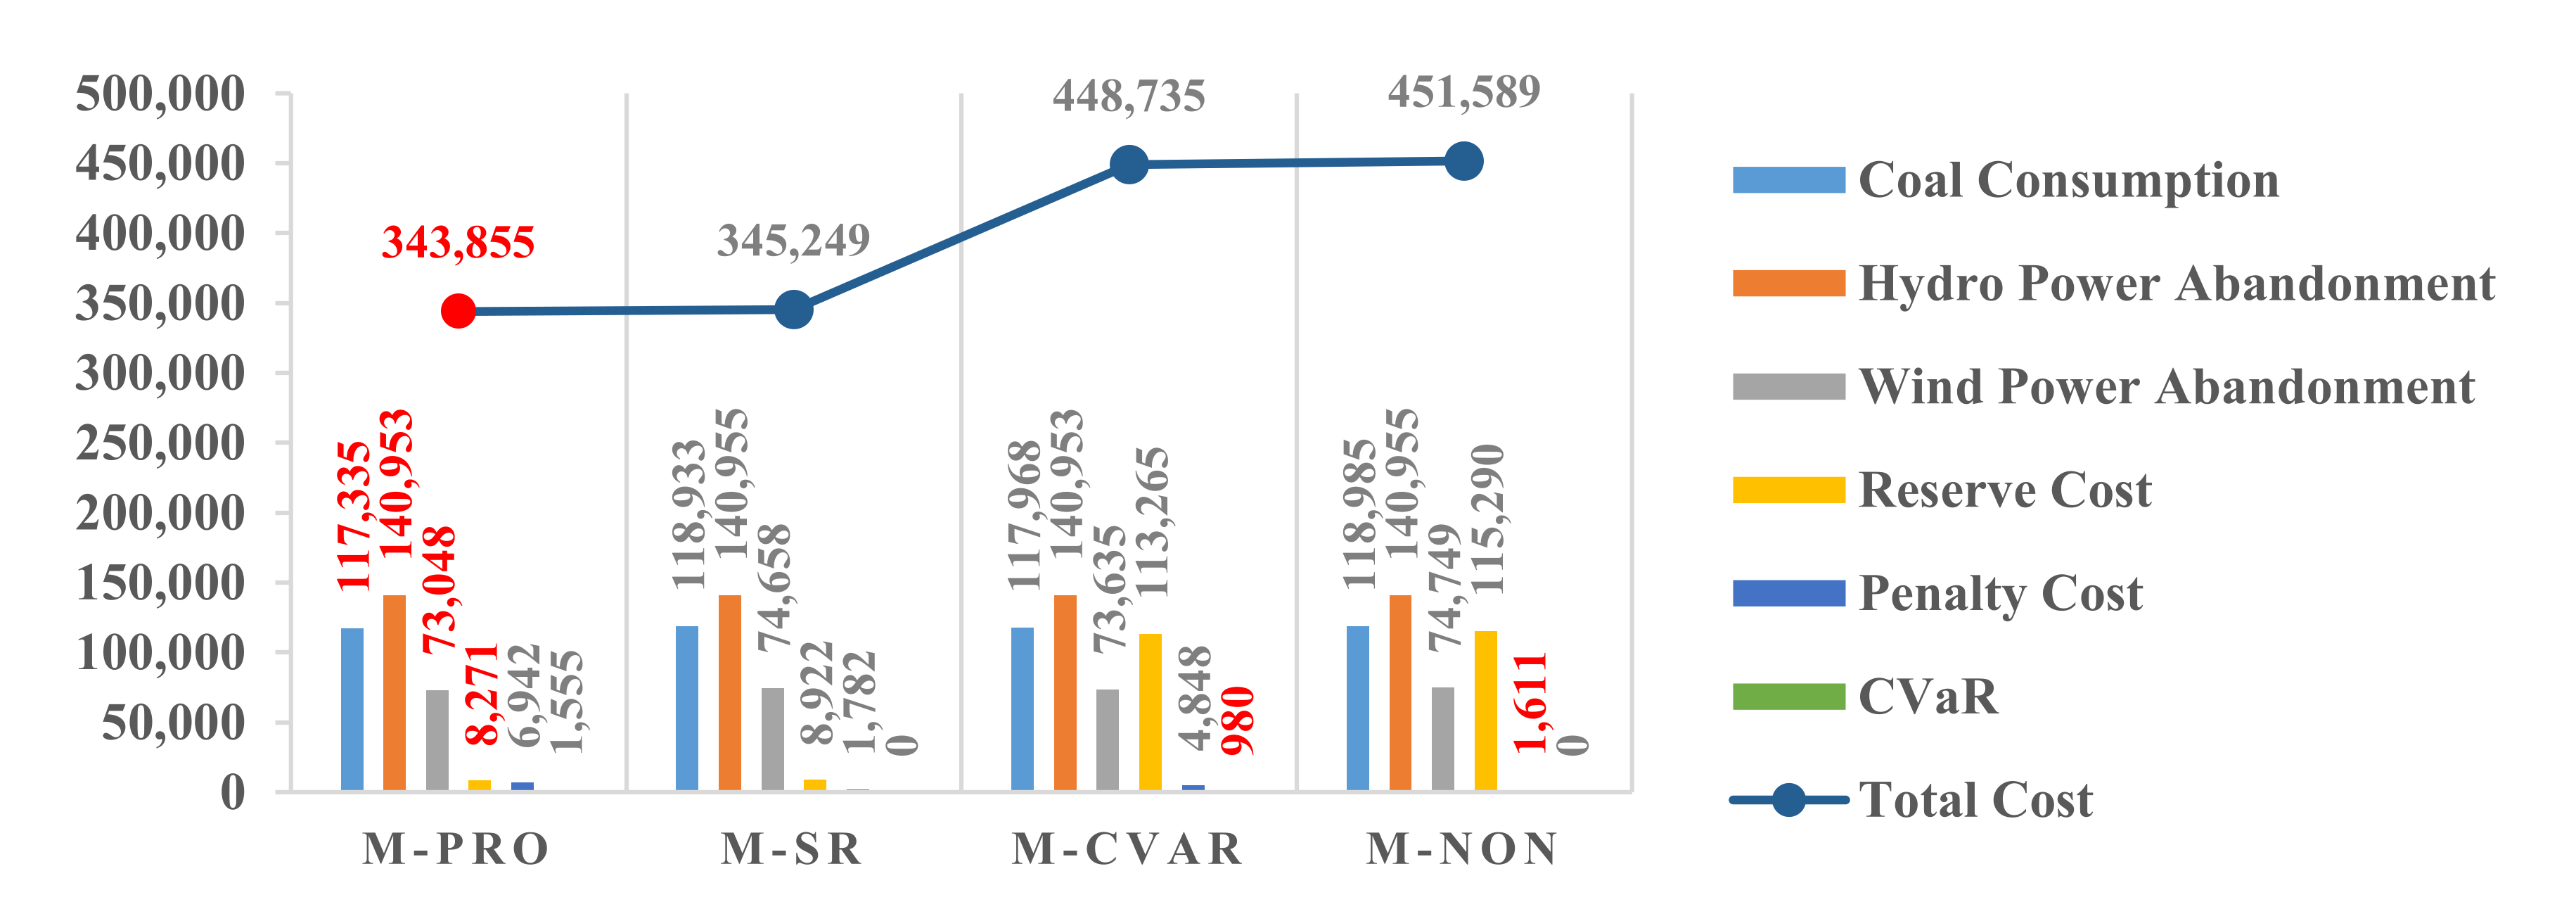
4.5. Comparison among Four Kinds of Multi-Source Power System Dispatching Model

In this section, four kinds of existing multi-source power system dispatching models are compared with their optimization results, which are shown in Figure 26. Additionally, the definition of each model is as follows:
  • M-Pro: M-Pro refers to the proposed dispatching model with the objective function considering both the spinning reserve and CVaR;
  • M-SR: M-Pro refers to the dispatching model with the objective function not considering the CVaR [50];
  • M-CVaR: M-Pro refers to the dispatching model with the objective function not considering the spinning reserve [52];
  • M-Non: M-Non refers to the dispatching model with the objective function not considering the spinning reserve and CVaR [53].
As shown in Figure 6, the proposed multi-source power system coordinated optimal dispatching model based on the objective function considering CVaR and spinning reserve cost has the lowest total system operation cost of CNY 343,855, which means the proposed model can achieve the highest comprehensive performance of scheduling optimization among four methods. Besides, it can also be observed that the proposed model can obtain the lowest cost of the coal consumption of thermal units, the hydro and wind power abandonment, and the spinning reserve, which reflects the advantages for the improvement of the economy, clean energy utilization, and network protection of proposed model.

4.6. Comparison of Optimization Results between the 72 h Integrated Planning Method and Three-Day Dispatching at the Same Time

The system optimization results of the 72 h pre-dispatching method and the three times 24 h day-ahead dispatching are compared at the same time. According to Table 7, when the system takes a 72 h pre-dispatching model to optimize the system dispatching in a typhoon environment, the total running cost of the system under each scenario is about 1.98% lower than that of the three times day-ahead dispatching, that is, the system operation economy is better. In addition, comparing the optimization results of coal consumption cost, hydro and wind power abandonment cost under two dispatching modes, it is known that the 72 h pre-dispatching method can give full play to the advantages of multi-source coordination and complementary of the system, make the replacement effect of clean energy on traditional thermal power more obvious, improve the level of renewable energy consumption, and can reduce coal consumption of system thermal power to make dispatching more economical with about 4.73% and 0.11% lower coal consumption and wind abandonment than that of the three times day-ahead dispatching, respectively.
Besides, it can be observed that the reserve cost and penalty cost of scenario deviation cannot have lower values in the same dispatching method at the same time. For example, the reserve cost of scenario in M2 is lower than that in M1 with 8230 smaller than 8289, while the relationship of their penalty cost of scenario deviation is opposite with 1670 larger than 1342. Similarly, M1 has a lower reserve cost with 7910 smaller than 7969 but a higher penalty cost of scenario deviation with 3364 larger 2887 in scenario C2. This is because the system standby level has a negative correlation with the power deviation of each scenario, that is, the higher the system standby level is, the smaller the deviation power and the lower the deviation penalty cost will be, which is at the cost of raising the reserve cost of thermal power. Finally, by comparing the CVaR of the system, it can be seen that the 72 h’ pre-dispatching has almost half CVaR of the three times day-ahead dispatching, which means the 72 h’ pre-dispatching is more comprehensive in terms of the CVaR. While the three times day-ahead dispatching is determined by the conditional risk value every 24 h, so the daily determined CVaR is the local optimal solution of the day, and the dispatching result is more conservative.
Furthermore, it is obvious that the highest total cost of 72-h pre-dispatching is in scenario C3 with CNY 312,199, and the renewable consumption ability in scenario C3 is worst with the cost of hydro and wind power abandonment are CNY 140,954 and CNY 46,680, respectively. On the contrary, the system can both obtain the optimal dispatching economy and renewable consumption in scenario A1, which reflects the fact that wind and hydropower abandonment has a great impact on the system dispatching economy. It is noteworthy that scenario B3 has the highest coal consumption coat of thermal power, reserve cost, and penalty cost of scenario deviation with CNY 117,796, CNY 8530, and CNY 4683, respectively and its total cost of system dispatching takes the second-highest place. Compared with scenario C3, scenario B3 has wind power fluctuation, so its scenario power deviation is larger and the corresponding penalty and reserve cost is larger. The thermal power output is also increased to deal with the wind power volatility.
Finally, the influence of the risk coefficient on the dispatching results of the system is discussed. As shown in Table 8, when the risk coefficient increases from 0.1 to 0.9, the total dispatching cost of the system increases from CNY168,753 to CNY 209,334. When the system risk coefficient is larger, the system adopts a risk aversion strategy to reduce the tail risk loss caused by the system uncertainty scenario by improving the system reserve level, that is, the system reserve cost increases from CNY 944 to CNY 1808 with the increase in the risk coefficient. At this time, the system can reduce the penalty of wind abandonment and load loss deviation from CNY 62,096 to CNY 59,903 by setting a small adjustment cost. Therefore, in the actual dispatching process, the dispatchers can decide the specific dispatching strategy according to the risk preference, so as to realize the trade-off between the system dispatching cost and risk.

5. Conclusions

In this paper, based on the time-space modeling and scenario analysis of typhoon wind field, considering the uncertainty and volatility of wind power, a 72-h pre-dispatching strategy for multi-sources power system with thermal, hydro, and wind power strategy which can make use of the multi-source complementary advantages to coordinate the day before, on and after the occurrence of the typhoon, so as to realize the strategy deployment from the dispatching level to deal with the impact of typhoon disaster is proposed. The proposed strategy is analyzed with the 24-node transmission network system with eight thermal power plants, two hydropower stations, and two wind farms for the day before, on, and after typhoon Mangkhut occurred. According to the results of the case study, the main conclusion is summarised below.
The generated typical wind power probability scenarios have different volatility in each output interval. The results show that the scenario proposed in this paper is oriented to the volatility and uncertainty of the segmented wind power interval and is oriented to the complete wind power output. The eliminated scenario analysis method can take into account the dual characteristics of wind power volatility and uncertainty, reasonable and accurate modeling, which is conducive to the improvement of the effectiveness of power system dispatching decision making.
The proposed 72 hour pre-dispatching strategy can reasonably arrange the unit output in different typhoon scenarios to ensure the secure and economic dispatching of the system through making the adjustment for hydropower generates power and utilizing the supplementary effect of the thermal and hydropower.
The dispatching strategy proposed in this paper adopts the method of increasing system spinning reserve and the concession of dispatching economy to operational safety as the system’s response in the case of more severe wind power changes caused by the typhoon. Namely, the proposed optimal dispatching strategy for multi-source power systems can realize the optimization of dispatching economy on the premise of ensuring the safety of system operation by setting suitable reserve costs.
According to the comparison of related research in the case study, the optimization strategy proposed in this paper has more comprehensive optimization ability than other related research, whether from the selection of model time scale or from the factors considered in model optimization.
The total dispatching cost increases, while the wind abandonement and load loss deviation penalty decreases with the increase in risk coefficient, which means that the proposed model can reflect the decision maker’s risk attitude by setting different risk coefficients and confidence levels and can better simulate the impact of tail risk on generation and reserve planning in extreme scenarios, to realize the dispatching decision of balancing risk and cost.
The further consumption of wind power by considering the optimal dispatching research of flexible resources such as energy storage devices and demand-side response should be considered as further work.

Author Contributions

Conceptualization, M.Q., N.C. and Z.L.; methodology, Y.C., C.C. and W.Q.; software, M.Q., Y.C. and C.C.; validation, Y.C., C.C. and W.Q.; investigation, M.Q.; resources, M.Q., D.Z. and Z.L.; data curation, Y.C.; writing—original draft preparation, M.Q., C.C. and W.Q.; writing—review and editing, Y.C., C.C., W.Q. and Z.L.; visualization, Y.C.; supervision, M.Q. and N.C.; project administration, M.Q., N.C. and D.Z.; funding acquisition, M.Q. and Z.L. All authors have read and agreed to the published version of the manuscript.

Funding

This research was funded by the Science and Technology Project of the State Grid Corporation of China (research on risk assessment and coordinated operation technology of coastal wind power multi-point integrated access system under typhoon environment).

Institutional Review Board Statement

Not applicable.

Informed Consent Statement

Not applicable.

Data Availability Statement

Not applicable.

Acknowledgments

This research was funded by the Science and Technology Project of the State Grid Corporation of China (research on risk assessment and coordinated operation technology of coastal wind power multi-point integrated access system under typhoon environment).

Conflicts of Interest

The authors declare no conflict of interest.

References

  1. Luo, Y.L.; Sun, J.S.; Li, Y.; Xia, R.D.; Du, Y.; Yang, S.; Zhang, Y.C.; Chen, J.; Dai, K.; Shen, X.S.; et al. Science and prediction of heavy rainfall over China: Research progress since the reform and opening-up of new China. J. Meteorol. Res. 2020, 34, 427–459. [Google Scholar] [CrossRef]
  2. Guo, J.; Feng, T.; Cai, Z.L.; Lian, X.L.; Tang, W.H. Vulnerability Assessment for power transmission lines under typhoon weather based on a cascading failure state transition diagram. Energies 2020, 13, 3681. [Google Scholar] [CrossRef]
  3. Feng, L.; Hu, S.; Liu, X.T.; Xiao, H.; Pan, X.; Xia, F.; Ou, G.H.; Zhang, C. Precipitation microphysical characteristics of typhoon Mangkhut in southern China using 2D video dendrometers. Atmosphere 2020, 11, 975. [Google Scholar] [CrossRef]
  4. Ma, X.C. Impact of winter meteorological disasters on wind farms. In Proceedings of the 2018 5th International Conference on Key Engineering Materials and Computer Science, Vancouver, BC, Canada, 10–12 January 2018. [Google Scholar]
  5. Duong, M.Q.; Pham, T.D.; Nguyen, T.T.; Doan, A.T.; Hai, V.T. Determination of optimal location and sizing of solar photovoltaic distribution generation units in radial distribution systems. Energies 2019, 12, 174. [Google Scholar] [CrossRef] [Green Version]
  6. Husin, H.; Zaki, M. A critical review of the integration of renewable energy sources with various technologies. Prot. Control Mod. Power Syst. 2021, 6, 37–54. [Google Scholar]
  7. Chen, H.; Zhang, J.Z.; Tao, Y.B.; Tan, F.L. Asymmetric GARCH type models for asymmetric volatility characteristics analysis and wind power forecasting. Prot. Control Mod. Power Syst. 2019, 4, 356–366. [Google Scholar] [CrossRef] [Green Version]
  8. Ding, T.; Yao, L.; Li, F. A multi-uncertainty-set based two-stage robust optimization to defender–attacker–defender model for power system protection. Reliab. Eng. Syst. Saf. 2018, 169, 179–186. [Google Scholar] [CrossRef]
  9. Trakas, D.N.; Panteli, M.; Hatziargyriou, N.D.; Mancarella, P. Spatial risk analysis of power systems resilience during extreme events. Risk Anal. 2019, 39, 195–211. [Google Scholar] [CrossRef] [Green Version]
  10. Amirioun, M.H.; Aminifar, F.; Shahidehpour, M. Resilience-promoting proactive scheduling against hurricanes in multiple energy carrier microgrids. IEEE Trans. Power Syst. 2019, 3, 1. [Google Scholar] [CrossRef]
  11. Nezhad, A.A.; Fotuhi-Firuzabad, M.; Moeini-Aghtaie, M.; Safdarian, A.; Wang, F. Modeling and optimizing recovery strategies for power distribution system resilience. IEEE Syst. J. 2020, 1–10. [Google Scholar] [CrossRef]
  12. Huang, W.; Yin, K.; Ozguven, E.; Burns, S.; Ghorbanzadeh, M. Evaluation of parametric wind models for more accurate modeling of storm surge: A case study of hurricane Michael. Nat. Hazards 2021, 106, 1–22. [Google Scholar]
  13. Yang, L.; Lyu, X.; Li, D.; Wang, M.; Yu, Q. Coordinated optimization strategy of multi-fault repair and recovery for distribution network with distributed generators. Autom. Electr. Power Syst. 2016, 40, 13–19. [Google Scholar]
  14. Zhu, S.H.; Hou, H.; Zhu, L.L.; Liang, Y.; Wei, R.Z.; Huang, Y.; Zhang, Y.B. An optimization model of power emergency repair path under typhoon disaster. Energy Rep. 2021, 7, 204–209. [Google Scholar] [CrossRef]
  15. Vickery, P.J.; Wadhera, D.; Twisdale, L.A.; Lavelle, F.M. U.S. hurricane wind speed risk and uncertainty. J. Struct. Eng. 2009, 135, 301–320. [Google Scholar] [CrossRef]
  16. Fazlul, K.; Mohammed, M.; Masud, H.; Mac, K. Assessing the potential impacts of climate changes on rainfall and evapotranspiration in the northwest region of Bangladesh. Climate 2020, 8, 94. [Google Scholar] [CrossRef]
  17. Yan, M.; Masahiro, M.; Kazuki, H. An analytical model for simulation of the wind field in a typhoon boundary layer. J. Wind Eng. Ind. Aerodyn. 1995, 56, 291–310. [Google Scholar]
  18. Ge, W.; Liu, D.; Liu, T.; Wang, S.; Hu, L. Multi-domains dispatching method for power system considering energy storage. IOP Conf. Ser. Earth Environ. Sci. 2021, 675, 012146. [Google Scholar] [CrossRef]
  19. Li, Y.Z.; Zhao, T.Y.; Liu, C.; Zhao, Y.; Yu, Z.Y.; Li, K.C.; Wu, L. Day-ahead coordinated scheduling of hydro and wind power generation system considering uncertainties. IEEE Trans. Ind. Appl. 2019, 55, 2368–2377. [Google Scholar] [CrossRef]
  20. An, Z.; Shen, C.; Zheng, Z.T.; Liu, F.; Chang, X.Q.; Wei, W. Scenario-based analysis and probability assessment of sub-synchronous oscillation caused by wind farms with direct-driven wind generators. J. Mod. Power Syst. Clean Energy 2019, 7, 243–253. [Google Scholar] [CrossRef] [Green Version]
  21. Gan, D.H.; Wang, Y.; Yang, S.; Kang, C.Q. Embedding based quantile regression neural network for probabilistic load forecasting. J. Mod. Power Syst. Clean Energy 2018, 6, 244–254. [Google Scholar] [CrossRef] [Green Version]
  22. Figaj, R.; Sornek, K.; Podlasek, S.; Żołądek, M. Operation and sensitivity analysis of a micro-scale hybrid trigeneration system integrating a water steam cycle and wind turbine under different reference scenarios. Energies 2020, 13, 5697. [Google Scholar] [CrossRef]
  23. Heitsch, H.; Werner, R. Scenario reduction algorithms in stochastic programming. Comput. Optim. Appl. 2003, 24, 187–206. [Google Scholar] [CrossRef]
  24. Liu, S.Y.; Lin, Z.Z.; Zhao, Y.X.; Liu, Y.L.; Ding, Y.; Zhang, B.; Yang, L.; Wang, Q.; White, S.E. Robust system separation strategy considering online wide-area coherency identification and uncertainties of renewable energy sources. IEEE Trans. Power Syst. 2020, 35, 3574–3587. [Google Scholar] [CrossRef]
  25. Liu, S.Y.; Cui, X.Y.; Lin, Z.Z.; Lian, Z.K.; Lin, Z.A.; Wen, F.S.; Ding, Y.; Wang, Q.; Yang, L.; Jin, R.Y.; et al. Practical method for mitigating three-phase unbalance based on data-driven user phase identification. IEEE Trans. Power Syst. 2020, 2, 1653–1657. [Google Scholar] [CrossRef]
  26. Pokhrel, J.; Seo, J. Statistical model for fragility estimates of offshore wind turbines subjected to aero-hydro dynamic loads. Renew. Energy 2021, 163, 1495–1507. [Google Scholar] [CrossRef]
  27. Li, Q.S.; Tang, X.H.; Chen, C.M.; Liu, X.Y.; Liu, S.Y.; Shi, X.J.; Li, Z.; Lin, Z.Z.; Yang, L.; Wen, F.S. BIRCH algorithm and Wasserstein distance metric based method for generating typical scenarios of wind power outputs. In Proceedings of the 2019 IEEE Innovative Smart Grid Technologies, Beijing, China, 21–24 May 2019. [Google Scholar]
  28. Singh, P.K.; Singh, N.; Negi, R. Short-term wind power prediction using hybrid auto regressive integrated moving average model and dynamic particle swarm optimization. Int. J. Cogn. Inform. Nat. Intell. 2021, 15, 111–138. [Google Scholar] [CrossRef]
  29. Liu, S.; Zhu, Y.L.; Gao, J.C.; Zhang, K. Short term wind power scenarios forecast based on multivariate normal distribution. IOP Conf. Ser. Earth Environ. Sci. 2018, 170, 042038. [Google Scholar] [CrossRef]
  30. Hou, H.; Geng, H.; Huang, Y.; Wu, H.; Wu, X.X.; Yu, S.W. Damage probability assessment of transmission line-tower system under typhoon disaster, based on model-driven and data-driven views. Energies 2019, 12, 3681. [Google Scholar] [CrossRef] [Green Version]
  31. Fang, G.S.; Pang, W.C.; Zhao, L.; Rawal, P.; Cao, S.Y.; Ge, Y.J. Toward a refined estimation of typhoon wind hazards: Parametric modeling and upstream terrain effects. J. Wind. Eng. Ind. Aerodyn. 2021, 209, 104460. [Google Scholar] [CrossRef]
  32. Chowdhury, K.; Chaudhuri, D.; Pal, A.K. An entropy-based initialization method of K-means clustering on the optimal number of clusters. Neural Comput. Appl. 2021, 33, 1–18. [Google Scholar] [CrossRef]
  33. Ushakov, A.V.; Vasilyev, I. Near-optimal large-scale K-medoids clustering. Inf. Sci. 2021, 545, 344–362. [Google Scholar] [CrossRef]
  34. Panda, R.; Tiwari, P.K. Risk assessment by security-constrained unit commitment for hybrid wind-thermal by pair copula approach in reserve power market: A stochastic approach. IET Gener. Transm. Distrib. 2021, 14, 6639–6649. [Google Scholar] [CrossRef]
  35. Zare, M.; Narimani, M.R.; Malekpour, M.; Azizipanah-Abarghooee, R.; Terzija, V. Reserve constrained dynamic economic dispatch in multi-area power systems: An improved fireworks algorithm. Int. J. Electr. Power Energy Syst. 2021, 126, 106579. [Google Scholar] [CrossRef]
  36. Ardakan, M.A.; Rezvan, M.T. Multi-objective optimization of reliability-redundancy allocation problem with cold-standby strategy using NSGA-II. Reliab. Eng. Syst. Saf. 2018, 172, 225–238. [Google Scholar] [CrossRef]
  37. Dong, J.; Yang, P.; Nie, S. Day-ahead scheduling model of the distributed small hydro-wind-energy storage power system based on two-stage stochastic robust optimization. Sustainability 2019, 11, 2829. [Google Scholar] [CrossRef] [Green Version]
  38. Turk, A.; Wu, Q.; Zhang, M.; Stergaard, J. Day-ahead stochastic scheduling of integrated multi-energy system for flexibility synergy and uncertainty balancing. Energy 2020, 196, 117130. [Google Scholar] [CrossRef] [Green Version]
  39. Yan, B.; Chan, P.W.; Li, Q.S.; He, Y.C.; Shu, Z.R. Characterising the fractal dimension of wind speed time series under different terrain conditions. J. Wind Eng. Ind. Aerodyn. 2020, 201, 104165. [Google Scholar] [CrossRef]
  40. Nguyen, T.T.; Nguyen, T.T.; Duong, M.Q.; Doan, A.T. Optimal operation of transmission power networks by using improved stochastic fractal search algorithm. Neural Comput. Appl. 2020, 32, 9129–9164. [Google Scholar] [CrossRef]
  41. Yang, S.B.; Tan, Z.F.; Gou, S.Y.; Li, P.; Ju, L.W.; Zhou, F.A.; Tong, X. Optimization model of WPO-PVO-ESO cooperative participation in day-ahead electricity market transactions considering uncertainty and CVaR theory. Int. J. Electr. Power Energy Syst. 2021, 129, 106718. [Google Scholar] [CrossRef]
  42. Kaur, S.; Brar, Y.S.; Dhillon, J.S. Real-time short-term hydro-thermal-wind-solar power scheduling using meta-seuristic optimization technique. J. Renew. Energy Dev. 2021, 10, 635–651. [Google Scholar] [CrossRef]
  43. Moritz, N.; Carlo, S.; Ralf, S.; Armin, S. Pan-European CVaR-constrained stochastic unit commitment in day-ahead and intraday electricity markets. Energies 2020, 13, 2339. [Google Scholar]
  44. Fu, Y.; Sun, Q.; Wennersten, R. Effectiveness of the CVaR method in risk management in an integrated energy system. Energy Rep. 2020, 6, 1010–1015. [Google Scholar] [CrossRef]
  45. Canelas, E.; Pinto-Varela, T.; Sawik, B. Electricity portfolio optimization for large consumers: Iberian Electricity Market Case Study. Energies 2020, 13, 2249. [Google Scholar] [CrossRef]
  46. Feng, Z.W.; Sun, M.Y.; Wang, Z.H.; Jin, X.M.; Zhang, Y.; Zhao, B. Optimal dispatching based on electric thermal coupling characteristics analysis and wind power consumption. J. Phys. Conf. Ser. 2020, 1578, 012244. [Google Scholar] [CrossRef]
  47. Mehrjerdi, H.; Hemmati, R.; Shafie-khah, M.; Catalão, J.P.S. Zero energy building by multicarrier energy systems including hydro, wind, solar, and hydrogen. IEEE Trans. Ind. Inform. 2019, 17, 5474–5484. [Google Scholar] [CrossRef]
  48. Xia, S.W.; Ding, Z.Z.; Du, T.; Zhang, D.Y.; Shahidehpour, M.; Ding, T. Multitime scale coordinated scheduling for the combined system of wind power, photovoltaic, thermal generator, hydro pumped storage, and batteries. IEEE Trans. Industry Appl. 2020, 56, 2227–2237. [Google Scholar] [CrossRef]
  49. Li, Y.; Wang, X.L.; Zhang, W.T.; Zuo, Y.; Zhang, Q.W. Scheduling model of power system with renewable energy and transaction mode of direct electricity purchase by large consumers considering network security constraints. J. Eng. 2019, 2019, 899–904. [Google Scholar] [CrossRef]
  50. Khaloie, H.; Abdollahi, A.; Shafie-Khah, M.; Anvari-Moghaddam, A.; Nojavan, S.; Siano, P.; João, P.S.C. Coordinated wind-thermal-energy storage offering strategy in energy and spinning reserve markets using a multi-stage model. Appl. Energy 2019, 259, 114168. [Google Scholar] [CrossRef]
  51. Zhang, L.; Zhou, Q.; Gao, Q.; Cheng, H.; Zhang, S. Multistage fuzzy-robust transmission network expansion planning under uncertainties. Int. Trans. Electr. Energy Syst. 2019, 29, 1–12. [Google Scholar] [CrossRef]
  52. Huang, F.Y.; He, J.; Qian, L. Coordination in a retailer-dominated supply chain with a risk-averse manufacturer under marketing dependency. Int. Trans. Oper. Res. 2019, 27, 3056–3078. [Google Scholar] [CrossRef]
  53. Xu, H.L.; Meng, Z.Y.; Wang, Y.S. Economic dispatching of microgrid considering renewable energy uncertainty and demand side response. Energy Rep. 2020, 6, 196–204. [Google Scholar] [CrossRef]
Figure 1. Typhoon wind circle model.
Energies 14 03735 g001
Figure 2. Set of reservoir capacity limitation before the day of the typhoon.
Energies 14 03735 g002
Figure 3. Set of reservoir capacity limitation on the day of the typhoon.
Energies 14 03735 g003
Figure 4. Set of reservoir capacity limitation after the day of the typhoon.
Energies 14 03735 g004
Figure 5. 24-node transmission network system.
Energies 14 03735 g005
Figure 6. 200 generated scenarios: (a) wind farm 1; (b) wind farm 2.
Energies 14 03735 g006
Figure 7. 10 typical probability scenarios: (a) wind farm 1; (b) wind farm 2.
Energies 14 03735 g007
Figure 8. Initial scenario wind power of A1.
Energies 14 03735 g008
Figure 9. Initial scenario wind power of A2.
Energies 14 03735 g009
Figure 10. Initial scenario wind power of A3.
Energies 14 03735 g010
Figure 11. Initial scenario wind power of B1.
Energies 14 03735 g011
Figure 12. Initial scenario wind power of B2.
Energies 14 03735 g012
Figure 13. Initial scenario wind power of B3.
Energies 14 03735 g013
Figure 14. Initial scenario wind power of C1.
Energies 14 03735 g014
Figure 15. Initial scenario wind power of C2.
Energies 14 03735 g015
Figure 16. Initial scenario wind power of C3.
Energies 14 03735 g016
Figure 17. Optimization results of the power output of scenario A1.
Energies 14 03735 g017
Figure 18. Optimization results of the power output of scenario B2.
Energies 14 03735 g018
Figure 19. Optimization results of the power output of scenario C3.
Energies 14 03735 g019
Figure 20. Optimization results of the power output of scenario A2.
Energies 14 03735 g020
Figure 21. Optimization results of the power output of scenario B1.
Energies 14 03735 g021
Figure 22. Optimization results of the power output of scenario A3.
Energies 14 03735 g022
Figure 23. Optimization results of the power output of scenario C1.
Energies 14 03735 g023
Figure 24. Optimization results of the power output of scenario B3.
Energies 14 03735 g024
Figure 25. Optimization results of the power output of scenario C2.
Energies 14 03735 g025
Figure 26. Optimization results of four kinds of multi-source power system dispatching model.
Energies 14 03735 g026
Table 1. Wind farm input wind speed correction coefficient under different terrain and different types of wind.
Terrains of Wind FarmsWind Types of Wind FarmsCorrection Coefficients
Mountains and slopesAlong-slope wind1
Mountains and slopesFront-slope windEquation (4)
Mountains and slopesTransition-zone windFront-slope wind component: Equation (4)
Along-slope wind component: 1
Mountains and slopesBack-slope windNo definite conclusion
River bank, lake, etc.All types1.00–1.20
Mountain basin, valley, and another closed terrainAll types0.75–0.85
Table 2. Parameters of thermal power units.
ParametersT1T2T3T4T5T6T7T8
Installation Capacity/MW240250400290625625625720
Minimum Technical Output/MW2025403060604050
Coal consumption coefficient a/(kg/(MW)2h)0.00690.20280.09420.11420.03570.04920.05730.0606
Coal consumption coefficient b/(kg/MWh)6.737.078.188.058.036.996.6012.9
Coal consumption coefficient c/(kg)94.705309.54369.03222.33287.71391.98455.76722.82
Maximum Upward Power/(MW/h)90100185120200150180300
Maximum Downward Power/(MW/h)90100185120200150180300
Minimum Running Time/h44335246
Minimum Shutdown Time/h44335246
Initial Running Time/h00355101
Initial Shutdown Time/h31000010
nitial Power/h50709080120150150200
Node Number1271315182122
Table 3. Parameters of hydropower units.
ParametersH1H2
Installation Capacity/MW250300
Dead Storage Capacity/billion m30.05980.074
Working Capacity/billion m30.09420.142
Initial Capacity/billion m30.1140.1379
Reserved Storage Capacity for Flood Control/billion m30.1360.011
Flood Control Capacity of Reserve/billion m30.0060.004
Power Output Coefficient c1 × 10831.4
Power Output Coefficient c2 × 10795.5
Power Output Coefficient c3105.5
Power Output Coefficient c4−50−40
Node Number1623
Table 4. Parameters of wind power units.
ParametersW1W2
Cut-in Wind Speed/(m/s)32
Cut-out Wind Speed/(m/s)810
Rated Wind Speed/(m/s)1015
Rated Power/MW550600
Number of Units/unit100100
Node Number1722
Table 5. Nine combined scenarios of wind farm output under the action of the typhoon.
Scenario NameState of Wind Farm 1State of Wind Farm 2
A1off-lineoff-line
A2off-lineheavy capacity
A3off-linefull capacity
B1heavy capacityoff-line
B2heavy capacityheavy capacity
B3heavy capacityfull capacity
C1full capacityoff-line
C2full capacityheavy capacity
C3full capacityfull capacity
Table 6. Optimization results of the worse case scenarios based on the combined scenario B2.
Conditions of Wind Power ChangePercentage of Initial Scenario Power for Scenario Analysis MethodTotal Cost
of System
Dispatching/CNY
Coal
Consumption
Cost of Thermal
Power/CNY
Hydropower
Abandonment/CNY
Wind Power
Abandonment Cost/CNY
Reserve
Cost/CNY
Penalty Cost
of Scenario
Deviation/CNY
CVaR/CNY
Only Wind Farm 1 (550 MW Installed Capacity) Changes0%358,327112,180140,94867,90837,2331.511115.65
25%350,430121,927140,94867,91129,3202.123115.85
50%342,621112,205140,94867,91321,4942.736116.05
75%334,860112,219140,94867,91613,7173.352116.25
Only Wind Farm 2 (600 MW Installed Capacity) Changes0%378,174111,977140,94867,90857,2840115
25%365,182112,015140,94867,90844,2540.100115
50%352,299112,056140,94867,90831,3300.100115
75%339,505112,144140,94867,90818,4461.474116
Both Wind Farm 1 And Wind Farm 2 Change0%409,238112,454140,94967,90887,8700115
25%388,139111,977140,94867,90867,2480115
50%367,517111,977140,94867,90846,6270115
75%346,896111,977140,94867,90826,0050115
Table 7. Comparison of optimization results between the 72-h integrated, planning method (M1) and three-day dispatching (M2) at the same time.
ScenarioMethodTotal Cost
of System
Dispatching/CNY
Coal
Consumption
Cost of Thermal
Power/CNY
Hydropower
Abandonment/CNY
Wind Power
Abandonment Cost/CNY
Reserve
Cost/CNY
Penalty Cost
of Scenario
Deviation/CNY
CVaR/CNY
A1M1276,824116,568140,76312,74556531794397
M2282,751122,256140,76312,76456441857792
A2M1282,922116,904140,95415,59273013574770
M2288,843122,565140,95515,522728038391202
A3M1283,534115,225140,95419,09171151879419
M2289,461120,947140,95519,12071191849792
B1M1280,825116,620140,94713,85171073823777
M2286,816122,592140,94713,941721530441197
B2M1308,666115,326140,95342,44577933445853
M2314,589121,225140,95342,515787128751172
B3M1309,401117,796140,95339,39685304683770
M2315,385123,756140,95339,506863238931182
C1M1281,104115,402140,95416,68071851360405
M2286,992120,966140,95316,65971261688889
C2M1308,701115,579140,95342,17479103364807
M2314,602121,431140,95342,249796928871115
C3M1312,199115,402140,95446,68082891342405
M2318,087120,966140,95346,65982301670889
Table 8. Optimization results under different risk coefficients.
Item0.10.20.30.40.50.60.70.80.9
Total cost of system dispatching/CNY168,753173,959179,134184,252189,324194,350199,351204,343209,334
Reserve cost/CNY9449461101121614081697178417841808
Penalty cost of scenario
deviation/CNY
62,09661,97961,38761,04960,60060,06459,93259,93259,903
Upper standby power/MW120123142157195247264264269
Lower standby power/MW340341390427433460460460460
Publisher’s Note: MDPI stays neutral with regard to jurisdictional claims in published maps and institutional affiliations.

