1. Introduction
Road traffic accidents are a significant social problem and it is estimated that, depending on the country, their costs amount to 1% up to 3% of gross domestic product [
1]. Although road safety is improving in most European countries, the progress remains slow and misaligned with the established targets. This slow progress is partially due to the dynamic and complex nature of road traffic, and safety performance depends on a number of interconnected factors related to roadway environment, vehicles and humans.
In the past decade, with new technological breakthroughs, a significant effort has been devoted to improving vehicle safety systems. These safety systems can be divided into two categories: passive safety systems and active safety systems. A passive safety system reduces injuries sustained by passengers when an accident occurs, while active ones try to keep a vehicle under control and avoid accidents [
2,
3].
In general, Advanced Driver Assistance System (ADAS) is a collection of numerous intelligent units integrated into the vehicle itself that perform different tasks and assist the human driver in driving. Common ADAS functions include adaptive speed control, lane departure warning, forward collision warning, automatic high beam assist, traffic sign recognition, pedestrian and object detection, automatic emergency braking, etc. All these functions base their operations on different cameras, RADARs, LIDARs and other sensors which “scan” the environment around the vehicle in order to gather the needed information. Since the efficiency of such systems majorly depends on the data collected from the surrounding environment, it is clear that different road infrastructure elements, such as traffic signs or road markings, provide necessary cues not only to human drivers but also to built-in vehicle technologies.
Traffic Sign Recognition System (TSRS) is designed to detect and interpret roadside information in the form of signage. Its basic infrastructure can be generalized into three specific components: visual sensor, image processor and vehicle display [
4]. Acquiring information from traffic signs involves traffic sign detection (TSD), which consists of finding the location, orientation and size of traffic signs in natural scene images, and traffic sign recognition (TSR), or classifying the detected traffic signs into types and categories in order to extract the information they are providing to drivers [
5]. In order to detect and recognize traffic signs, as mentioned before, vehicles are equipped with different technologies. Cameras are the most common sensors and can be used for TSR, TSD or both at the same time. LIDAR sensors have been used for TSD. Their 3D perceptive capabilities are useful to determine the position of a sign and its shape, and can also use the intensity of reflected light to improve detection accuracy based on the high reflectivity of traffic signs [
5]. Potentially, the best solution presents the combination of LIDAR and cameras. Such fusion enables the collection of information from different sources, their comparison and analysis, and thus better detection and recognition of signs. Besides detecting and recognizing road signs, TSRS also use digital maps with already implemented signs (mainly related to the speed limit signs).
After sensors and front-facing cameras collect data, algorithms are used to segment and analyze the stimuli. This process includes shape, color and symbol detection as well as classification of signs based on the aforementioned characteristics [
4]. A vast body of literature has analyzed the efficiency of different algorithms for segmentation and classification of signs [
6,
7,
8,
9]. Several review papers on this subject have also been published in the past few years [
10,
11,
12,
13]. Besides the overall review of the working procedures, studies identified main issues and challenges regarding the accuracy of TSRS. They are generally related to fading and blurring of traffic signs, visibility levels of signs in comparison to the environment, differences between existing traffic sign systems, multiple appearances of signs, damaged or partially obscured signs, correct location of signs, unavailability of public databases, electronic signs, etc. An on-road study conducted in Australia and New Zealand confirmed some of the aforementioned issues [
4]. For the purpose of this study, authors used five cars with TSRS and drove a number of trials designed and conducted in order to identify key issues existing in the current TSRS and to investigate potential causes of the found issues. The study highlighted several applicable changes that could improve traffic sign readability, including electronic signs, installation and maintenance, sign positioning and location, sign face design, vehicle-mounted signs and other advisory and information signs.
From the literature review, one can conclude that general problems regarding TSRS are well known. However, different car manufacturers use different hardware and software solutions that may differ in traffic sign detection and readability accuracy. In addition, there are some differences between the signs being detected and presented to the driver. Namely, some cars can only read “speed limit” signs, while others in addition to “speed limit” signs can read other signs such as “prohibition of overtaking”, “end of all restrictions”, “start and end of highway”, etc.
For this reason, the main aim of this study is to determine whether differences between detection and readability accuracy of market-ready TSRS exist, and to what extent. Moreover, since the problem of partially obscured signs was identified in literature as one of the main challenges of TSRS, the objective of the study was to test how simulated “graphical changes” affect their detection accuracy.
2. Materials and Methods
In this section, the research methodology is presented. The section consists of four subsections each describing a part of the methodology, from the testing track, vehicles, scenarios and test procedures to data analysis.
2.1. Testing Track
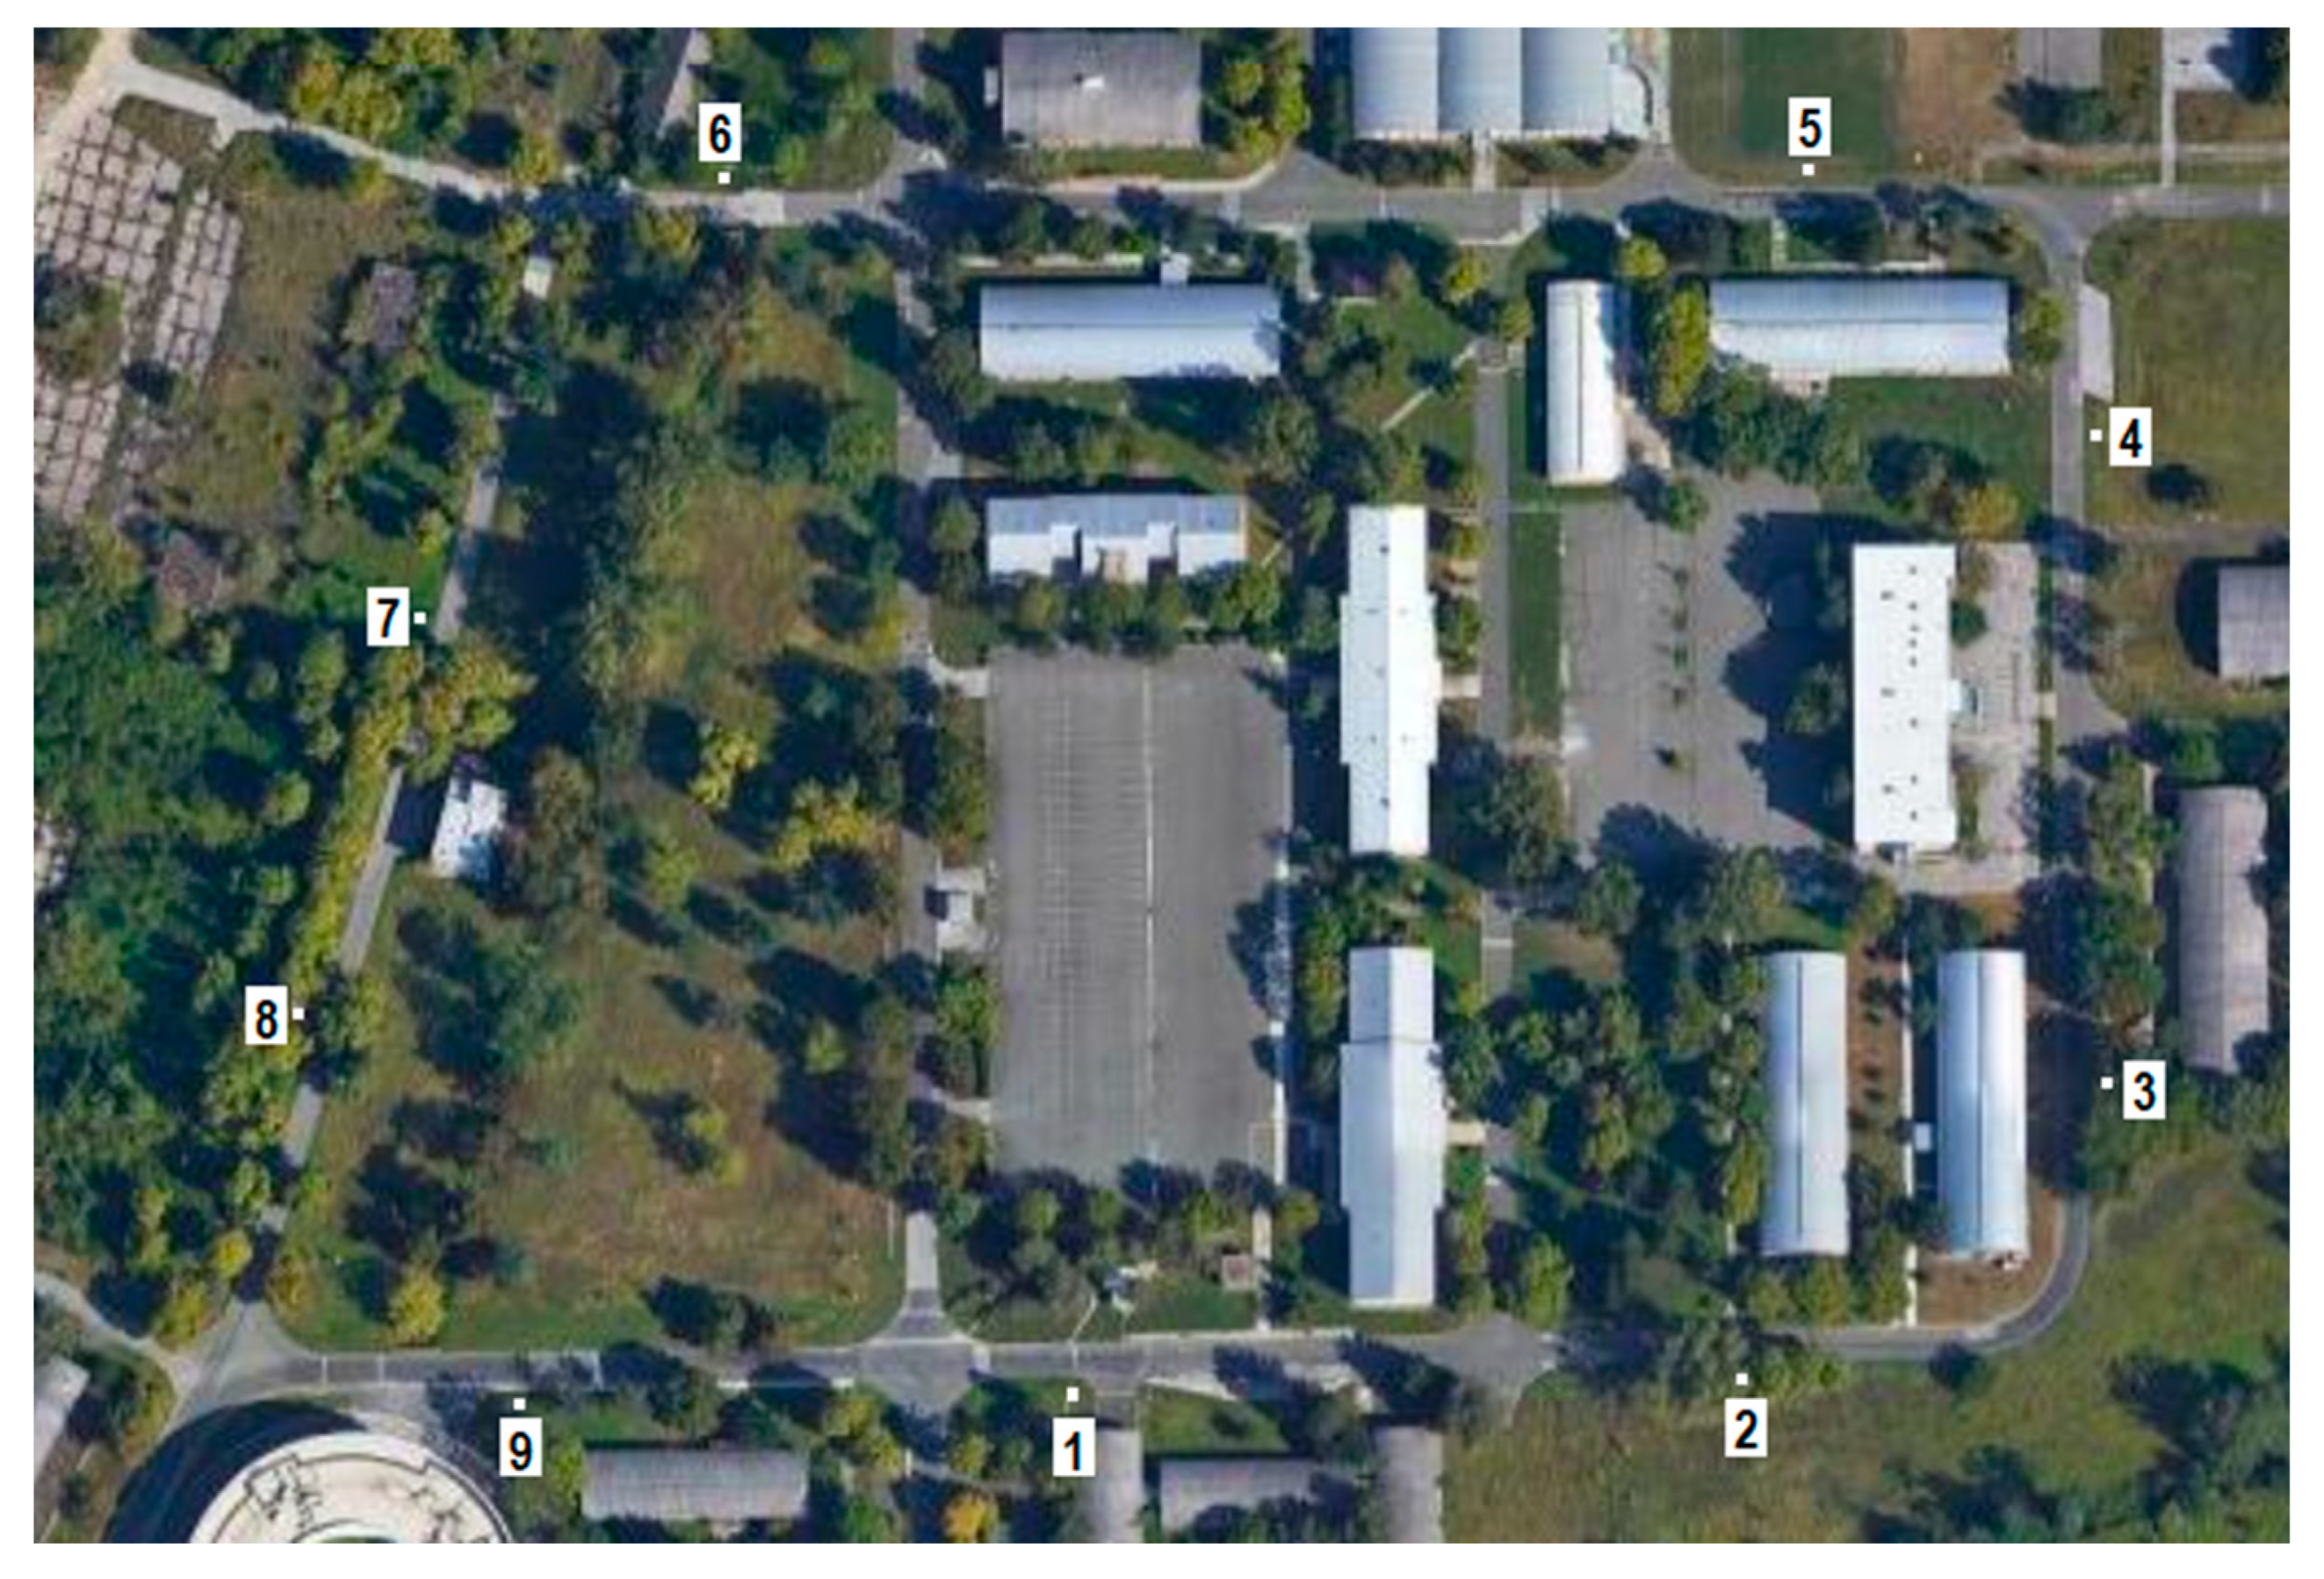
The experiment was conducted on a road inside the campus of the University of Zagreb. The road is a typical two-way road with almost no traffic since it is only used for connecting buildings on the campus. The total length of the road is 1.2 km and it consists of straight sections, four curves and five intersections with the right of way in the direction in which tests were conducted. Nine traffic signs were placed on straight sections of the testing track, as shown in
Figure 1. Seven of them were used, i.e., their graphical image was changed according to scenario designs, while the remaining two (8 and 9) were placed for control purposes only and their “readings” were not recorded and analyzed. Only speed limit and prohibition of overtaking signs were used since the majority of current TSRS read only these signs. In total, four “speed limit” signs (50 km/h, 60 km/h, 90 km/h and 100 km/h) and three “prohibition of overtaking” signs were used. The speed limits (50 km/h, 60 km/h, 90 km/h) were chosen based on the fact that they are the most common and that their meaning could easily be altered. For example, with a very small modification, 60 km/h could easily be altered to 80 km/h. The 100 km/h speed limit was chosen since it contains three digits. All signs were newly made and fulfilled all technical properties (visibility, chromaticity, etc.) defined by the Croatian standard [
14]. The design of the signs was also according to the Croatian standard, which is based on the Vienna convention. All of them are 60 cm in diameter and were made using class II sheeting with prismatic retroreflection. Furthermore, all signs were placed according to the Croatian standard [
14], which implies a 30–75 cm distance from the edge of the road and a height between 1.2 to 1.5 m. The distance between each sign was set to a minimum of 100 m and the locations of the signs did not have any environmental “disturbances” which could affect the TSRS. Although vegetation next to the road is present, all signs were clearly visible, i.e., they were not covered with vegetation. The layout of the signs at each location was as follows: Location 1—50 km/h speed limit; Location 2—prohibition of overtaking; Location 3—60 km/h speed limit; Location 4—prohibition of overtaking; Location 5—90 km/h speed limit; Location 6—prohibition of overtaking; Location 7—100 km/h speed limit; Location 8—prohibition of overtaking (control sign); Location 9—60 km/h speed limit (control sign).
2.2. Vehicles
Seventeen (17) cars in total were included in the study. Fourteen of them were from different manufacturers while the remaining three were from the same manufacturer. Most of those cars are new vehicles (12 of them were produced in 2020), while the other five ranged from 2014 to 2019. Each vehicle has TSRS which is based on a camera located at the front windshield inside the vehicle. The vehicles were, for the sole purpose of the research, lent to us by their official distributors for their respective manufacturing brand in Croatia. It is worth noting that the technical aspects of the system were not provided to us. Since the aim of the study is to detect the differences between existing TSRS and not to determine which car brand has the “best” TSRS, brand names are in code.
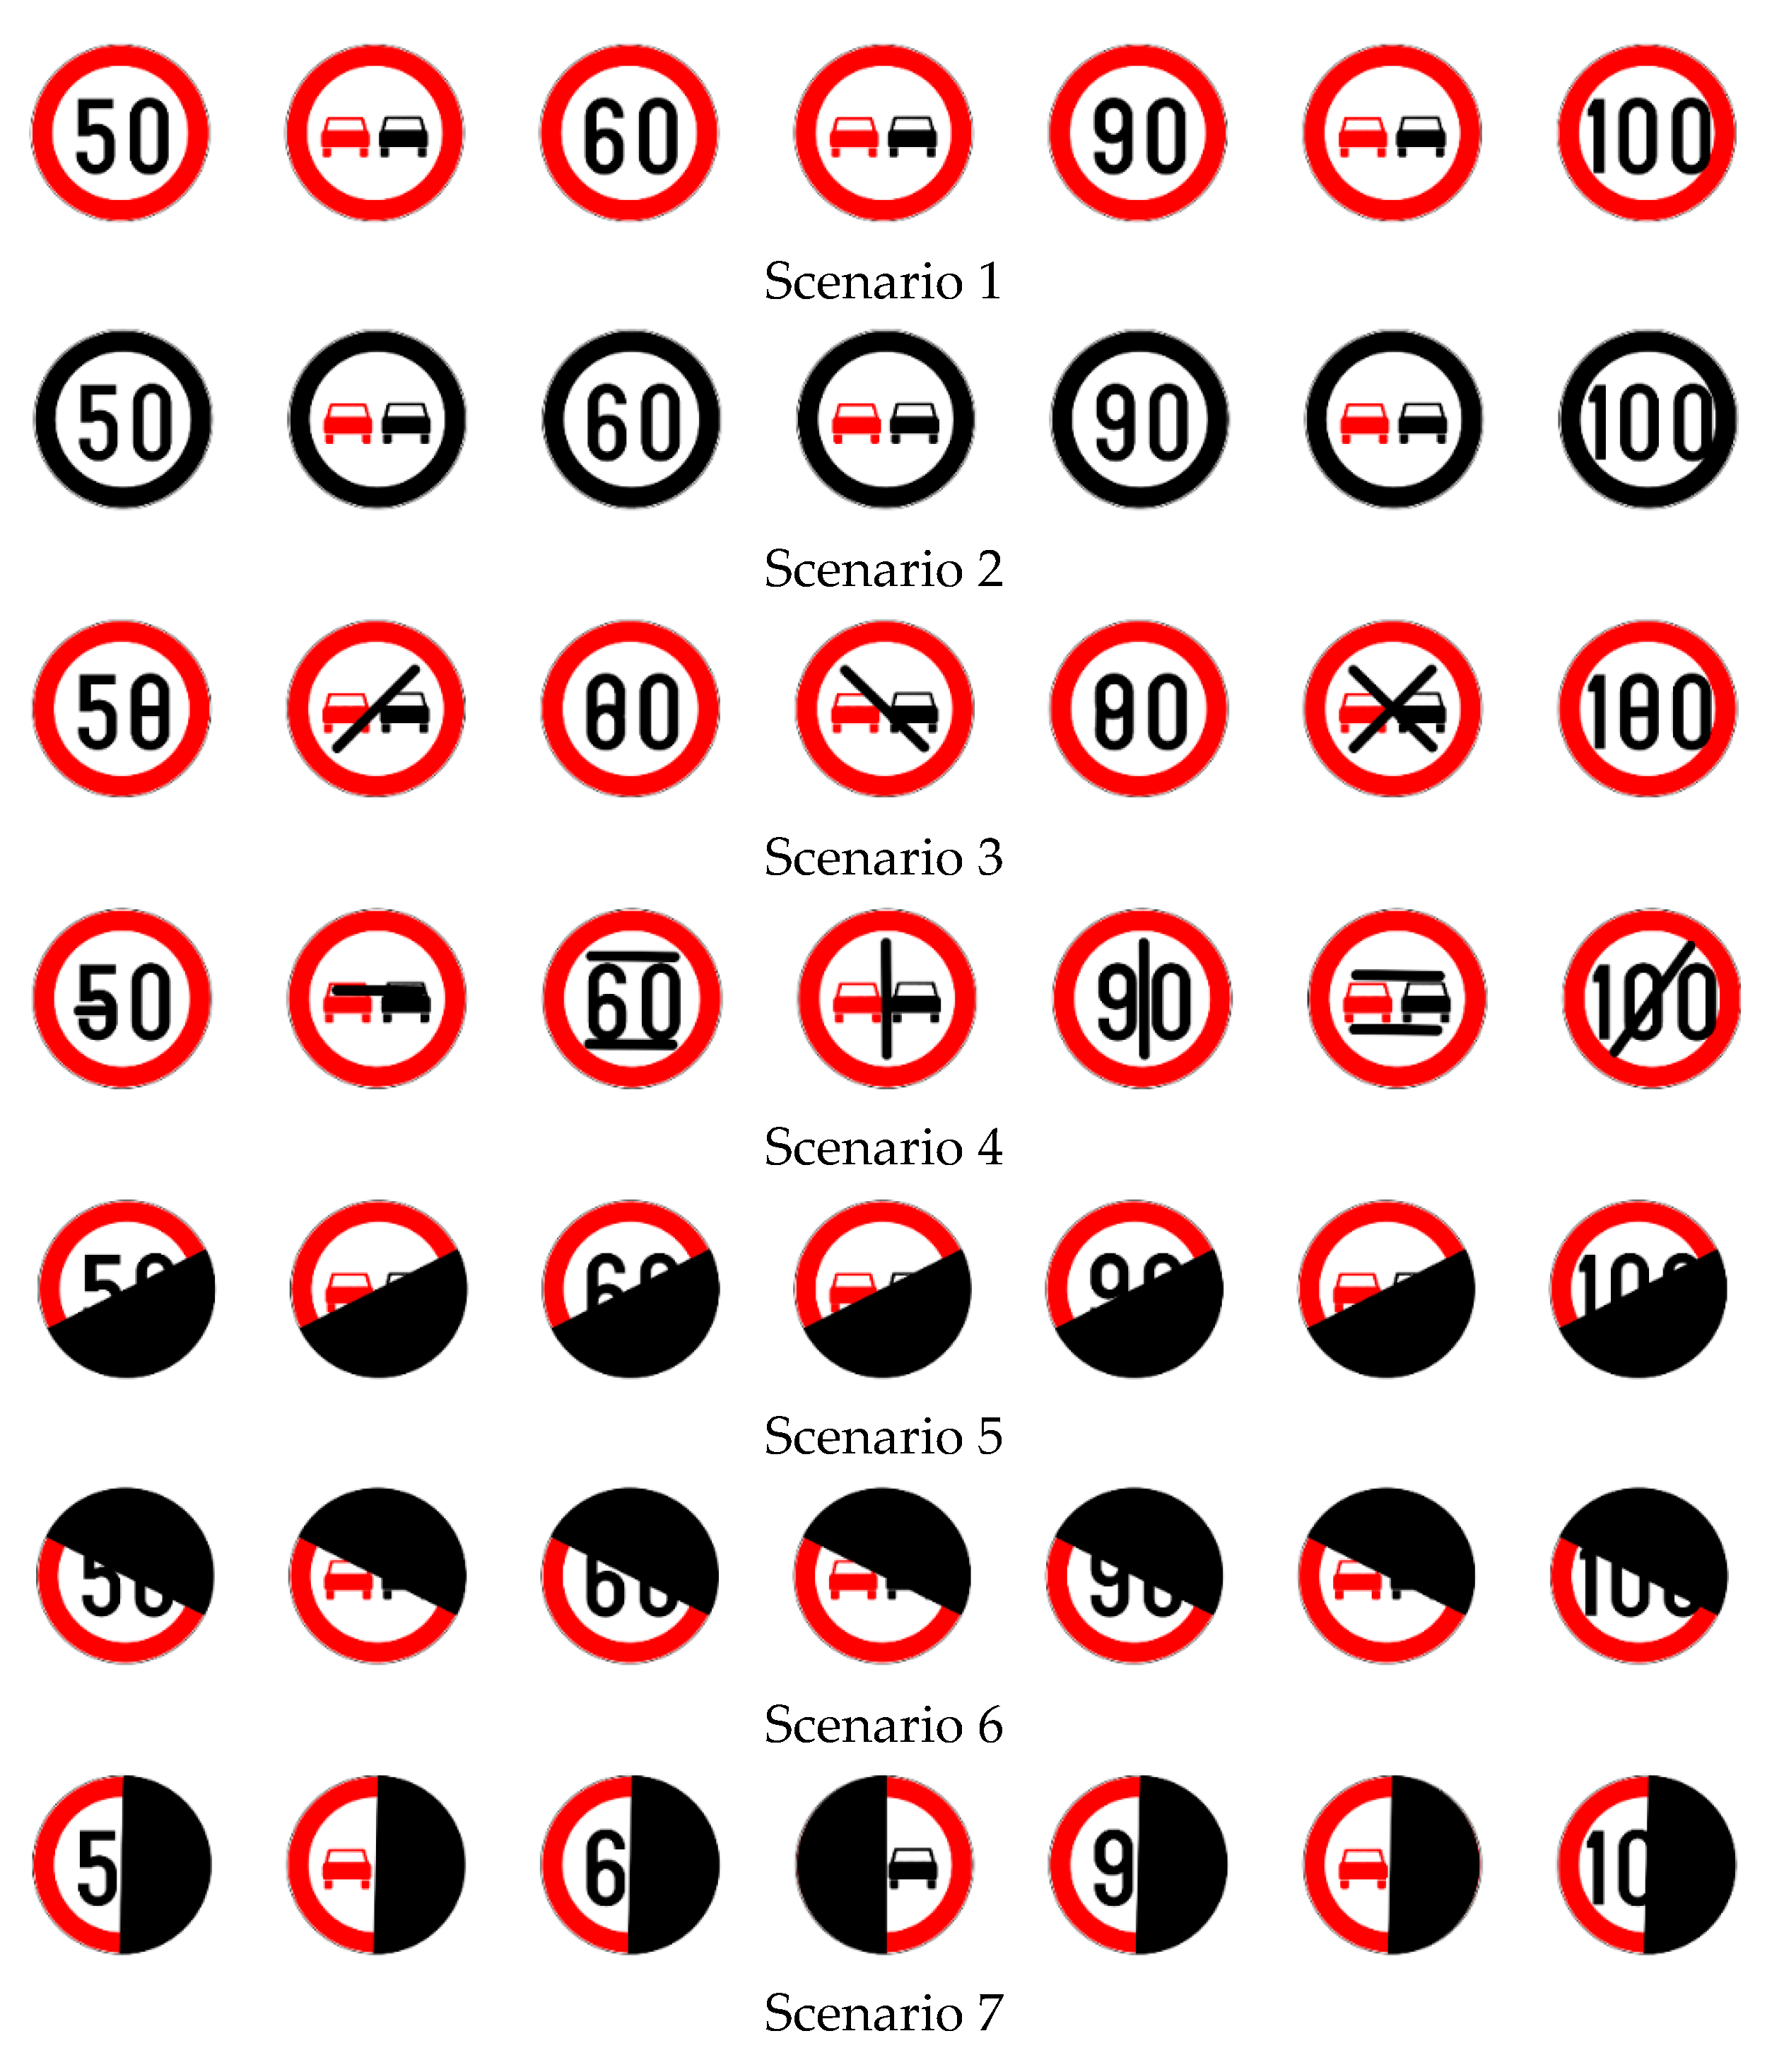
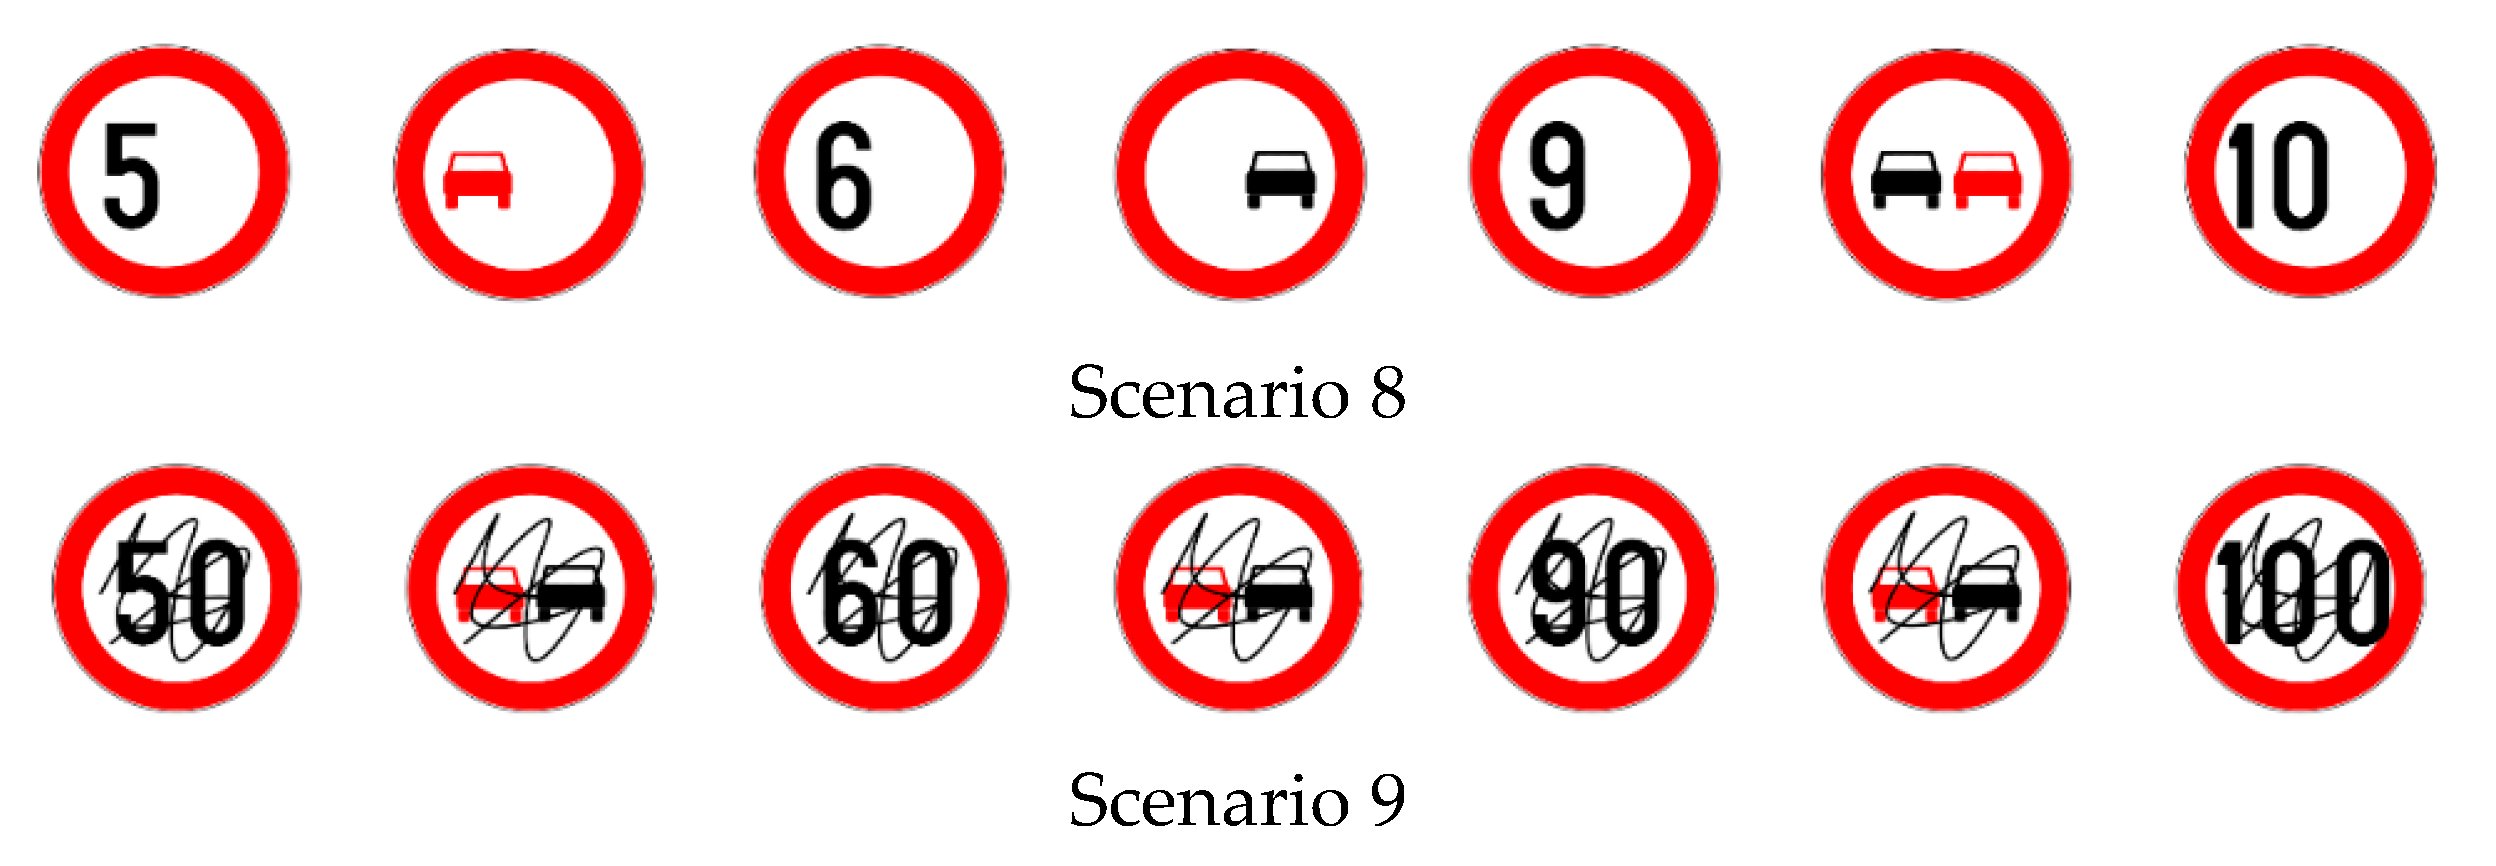
2.3. Scenarios and Test Procedure
In order to test the accuracy of TSRS, nine scenarios were created. The first one was a control scenario in which signs did not have any graphical changes. In the second scenario, the red outline of the signs was covered with black paper. In the third and fourth scenarios, minor changes on symbols were made. For example, a piece of black paper was placed so that 60 km/h speed limit looks similar to 80 km/h or black lines were placed on the prohibition of overtaking signs. In the fifth, sixth and seventh scenarios, a half of the signs’ face was covered with black paper. The difference between the scenarios was in the orientation of the coverage. In the eighth scenario, the last digit (0) on the speed limit sign was covered with white paper. On the two prohibition of overtaking signs, the symbols of cars were covered with white paper while on the third prohibition of overtaking sign, the symbols were mirrored. In the last scenario, symbols were covered with graffiti. The visual presentation of signs in each scenario is shown in
Figure 2.
Tests were conducted during daytime between 9:00 a.m. and 3:00 p.m. in the period of three days. During all three days, weather conditions were almost the same, i.e., normal (sunny) weather. Before the start, we held a “practice” run with each vehicle in order to check if the TSRS were functioning properly. During the test, each vehicle passed through the test track once per each scenario. Alongside the driver, the researcher was present in the vehicle during tests, controlling and recording if the signs were or were not displayed to the driver and, if yes, what was displayed. Only one vehicle was permitted on the testing track during each run and other traffic was not present. Because of the road configuration (campus site), the driving speed was between 40 and 60 km/h.
2.4. Data Analysis
For the first part of the analysis, we grouped the data into three categories: (1) correctly recognized signs, (2) unrecognized signs and (3) wrongly recognized signs. For each category, a percentage distribution of the results was calculated and compared. For the second part, the results from groups (2) and (3) were joined into one group, unrecognized or wrongly recognized signs, since they all in all presented the error of TSRS. On top of that, scenarios were grouped based on the level of modification they were submitted to: control (scenario 1), minor changes (scenarios 2 + 3 + 4), medium changes (scenarios 8 + 9) and major changes (scenarios 5 + 6 + 7) in order to analyze the differences between the control scenario (1) and each level of graphical change. Mean values for each vehicle and group were computed and repeated measures ANOVA with Bonferroni adjustment (alpha level 0.05) were used to test the differences between the control condition and each group.
In the second part of the analysis, we tested the differences between vehicles per scenario. Since the values in the data set for this analysis were dichotomous, Cochran’s Q test was used (alpha level 0.05). As one of the assumptions of Cochran’s Q test is that a sample has two mutually exclusive categories, the analysis was conducted on the correctly recognized signs categories and not on unrecognized or wrongly recognized signs.
3. Results
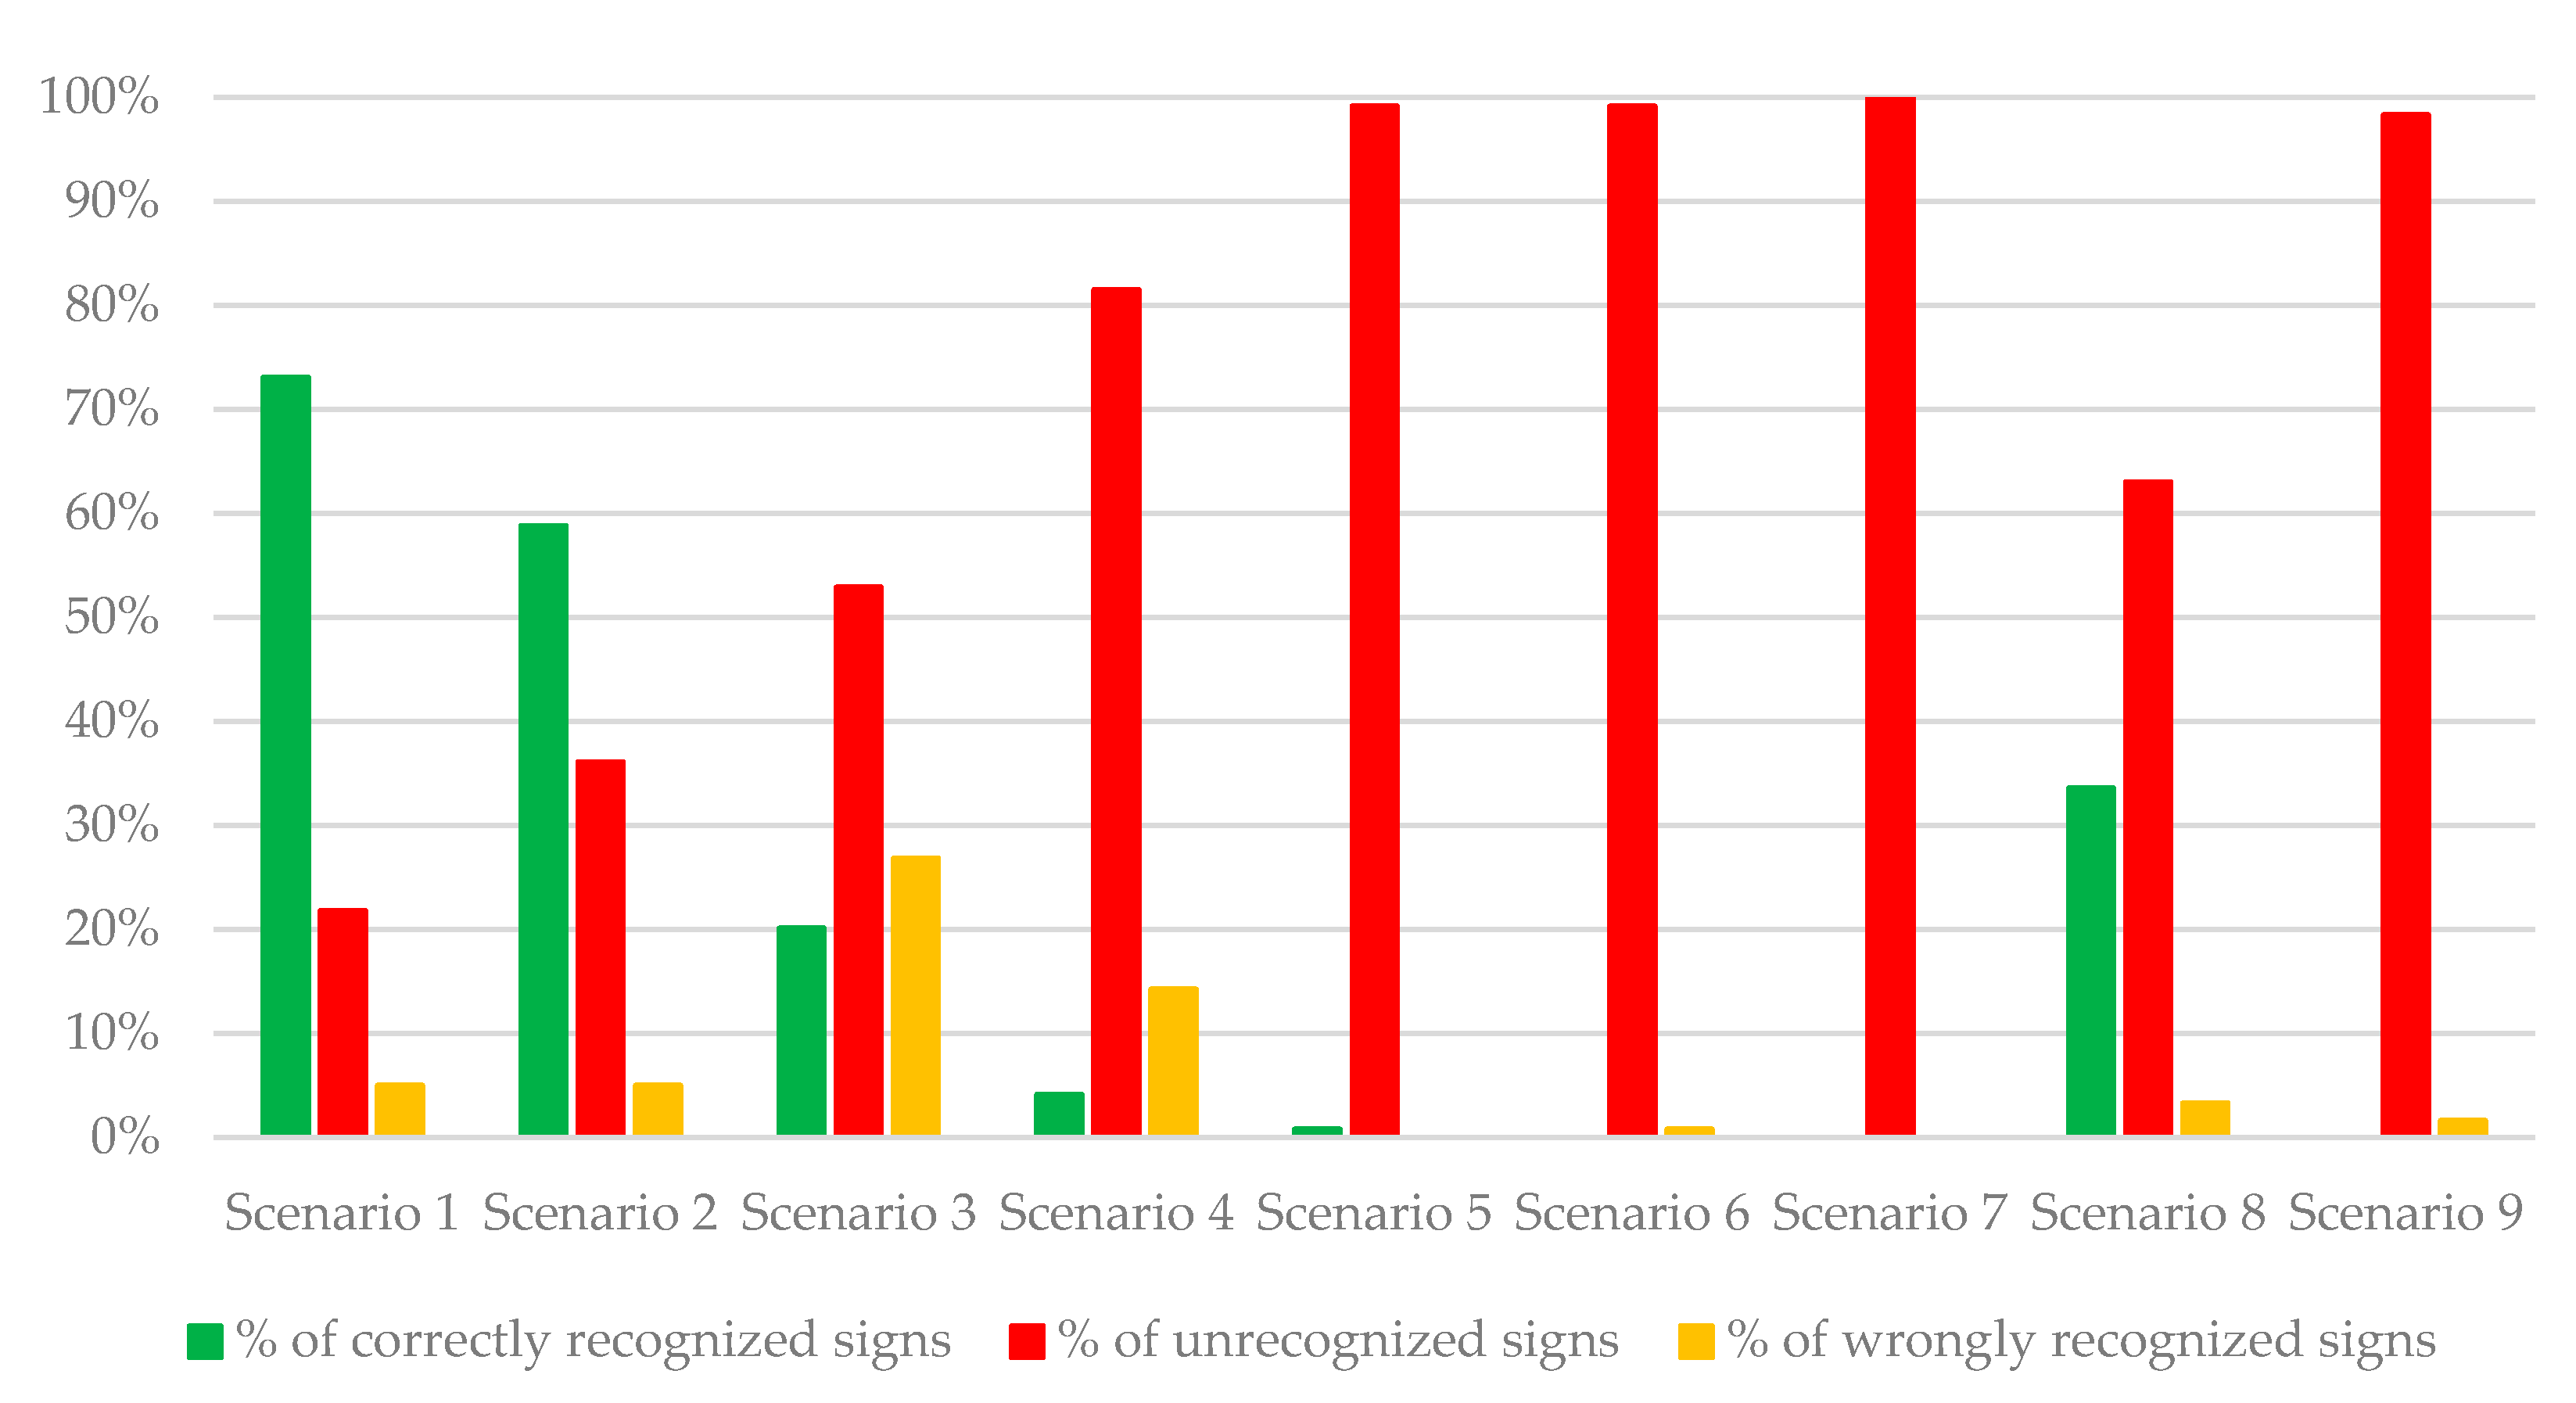
In total, 1071 recognitions were possible (7 signs per scenario × 9 scenarios × 17 vehicles). In 21.20% of the cases, signs were recognized correctly. In 72.46%, signs were not recognized at all, while in 6.35%, signs were wrongly recognized by vehicles. Of course, these percentages vary between each scenario. As expected, in the control scenario (scenario 1), the highest level of correctly recognized signs was recorded (73.11%). On the other hand, in the same scenario, 21.58% of the signs were not recognized at all (mainly prohibition of overtaking, but also in some cases speed limit signs). This is due to the fact that the type of signs which TSRS recognize and display to the driver varies to some extent between brands. Moreover, some of the signs (5.04%) were wrongly recognized even in the control scenario (for example, 90 km/h was recognized as 30 km/h). In the second scenario (black outline of the signs), the number of unrecognized signs increased to 36.13%, while the percentage of wrongly recognized signs stayed the same as in scenario 1 (5.04%).
A major decrease in sign recognition occurred in scenarios 3 and 4 in which minor changes were made to the signs. Namely, the percentage of correctly recognized signs in scenarios 3 and 4 fell to 20.17% and 4.20%, respectively. In addition to the increase in unrecognized signs, there was also an increase in wrongly recognized signs—26.89% in scenario 3 and 14.29% in scenario 4.
When signs were half covered by black paper (scenarios 4, 5 and 6) as well as by graffiti (scenario 9), the percentage of unrecognized signs was between 98% and 100%. In scenario 8, 33.61% of the signs were correctly recognized (63.03% of signs unrecognized), while 3.36% were wrongly recognized (mainly speed limit signs).
A graphical presentation of the aforementioned results is shown in
Figure 3 while the overall results for each vehicle per each scenario are presented in
Appendix A.
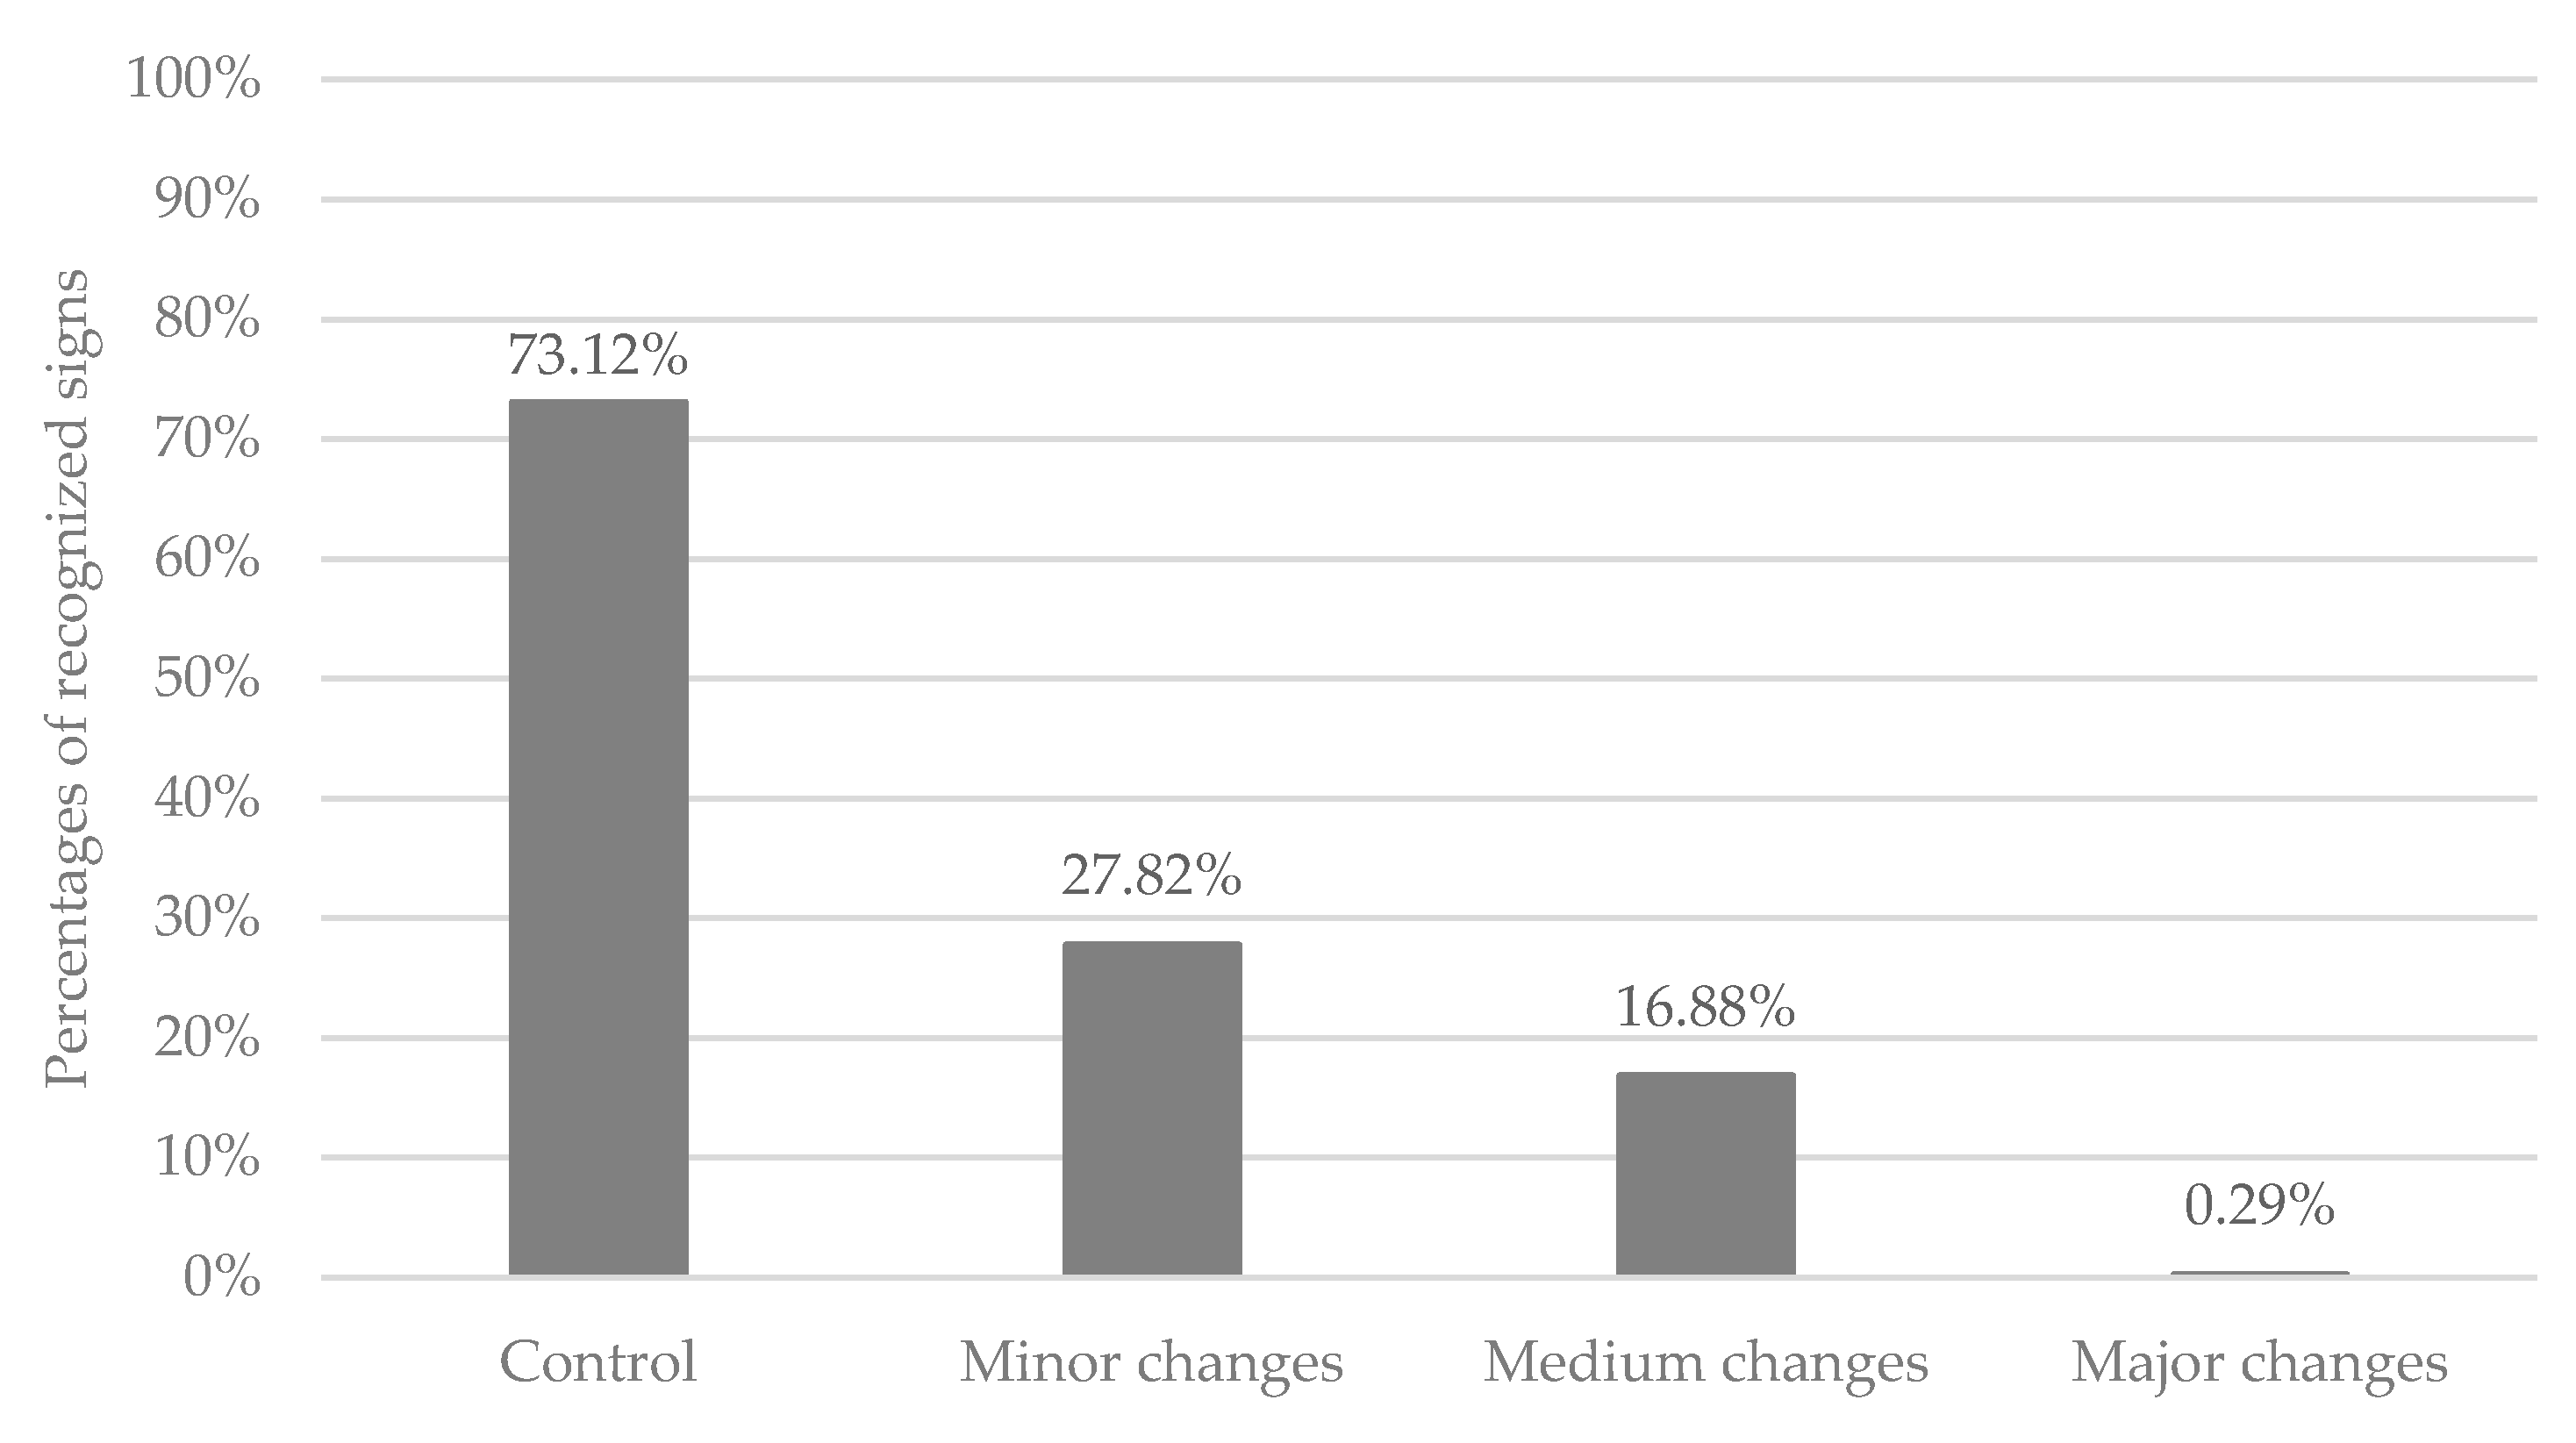
As mentioned in the Data Analysis section, the scenarios were grouped into four categories: control (scenario 1), minor changes (scenarios 2, 3 and 4), medium changes (scenarios 8 and 9) and major changes (scenarios 5, 6 and 7). This was done in order to analyze how different levels of changes on signs affect recognition accuracy. For each vehicle and group, mean value was computed. Overall, the decrease in correctly recognized signs between controlled conditions and minor, medium and major changes is 62%, 77% and 99%, respectively (
Figure 4).
Although differences between each category are evident, a repeated measure ANOVA with Bonferroni adjustment was used to test the differences between the control condition and each group. The results of ANOVA analysis shown in
Table 1 confirms that a statistical difference (
p < 0.05) between the control condition and each group representing different levels of graphical changes of signs exists.
Furthermore, we tested the difference between traffic sign recognition of each vehicle in each scenario with Cochran’s Q test. Since scenarios 6, 7 and 9 after grouping did not have variations in values (no values for group “correctly recognized signs”), Cochran’s Q test was not performed on them.
Overall, a statistical difference (
p < 0.05) in traffic sign recognition between tested vehicles was recorded for scenarios 1, 2, 3 and 8, while for scenarios 4 and 5, no statistical difference was found (
p > 0.05), as shown in
Table 2.
4. Discussion
Due to their great potential in reducing road accidents, ADAS technologies have become one of the fastest-growing safety application areas. In the European Union, ADAS systems are mandatory for all new and certified vehicles starting from 2022 and all new registered vehicles by 2024 [
15]. One of those systems is traffic sign recognition, which provides drivers with information about traffic signs.
However, the analysis of market-ready TSRS shows that the functionalities of systems differ to some extent between car brands, mainly in the type and the number of signs that can be recognized and displayed to the driver. Some of the cars display only speed limit signs, some besides speed limit display prohibition of overtaking, while some are, in addition to the above, displaying main warning signs such as “dangerous curve”, “pedestrian crossing”, etc. Furthermore, while the majority of TSRS signs are displayed in color, there are a few brands that display signs in black and white.
The results of this study show that TSRS accuracy differs between car brands and graphical clarity of the sign. In other words, each scenario with graphical changes on signs had significantly lower recognition level compared to the control condition (ranging from 62% to 99%). It is important to note that even the control condition did not have a 100% recognition and, contrary to expectations, had 5% of wrongly recognized signs. This is precisely due to the differences in TSRS between car brands. Moreover, between each category of graphical change and the control condition, there has been a statistically significant difference in the number of correctly recognized signs. The results suggest that even small changes in the design of a sign, such as the change of the outline color or a minor change in the symbol, can drastically affect TSRS accuracy. This result is in accordance with previous studies [
4,
12].
Although graphical changes on the signs were created artificially in this study, similar situations exist in real road conditions [
16,
17] and may result in TSRS errors. Such errors may affect the driver in different ways. Studies have shown that drivers in general perceive a relatively low amount of traffic signs [
18,
19,
20], and thus an additional display of signs in the vehicle (especially speed limits) should increase overall compliance with traffic regulations. On the other hand, if the sign is not recognized by the TSRS, the driver will not have additional information, which may result in inappropriate and/or improper driving behavior. Furthermore, if TSRS recognizes the signs but wrongly (for example 60 km/h as 80 km/h), such error may confuse drivers and thus distract them, which again may lead to inappropriate and/or improper driving behavior. This result confirms the importance of proper maintenance of signs and their surroundings as highlighted in several recommendations and publications [
4,
21,
22].
Since the general functioning and accuracy of TSRS significantly differ between car brands, a “standardization” of such systems is needed. Standardization, in this sense, implies defining the minimal number and types of signs which every TSRS should recognize, the way signs are displayed to the drivers and minimal levels of recognition accuracy at least for properly placed and maintained signs during daytime and low visibility conditions (night-time, rain, fog, etc.). Although the last requirement is difficult to define since recognition accuracy depends on the number of factors [
10,
11,
12,
13], the standardization of TSRS could potentially accelerate their development and possibly eliminate some of the current problems. In addition, recent studies emphasize that, although ADAS systems provide a significant progress in safety, they also may distract drivers [
23,
24]. Thus, the education of drivers regarding the functionality and limitations of TSRS is needed as well in order to avoid or at least decrease potential confusion of drivers. The education altogether with the standardization could decrease the driver’s distraction caused by TSRS. Finally, in order to increase the accuracy of TSRS, a database of traffic signs for each country should be established. The database in this sense should have all the variations of signs and their meaning for each country. In the primal stage, it could be developed at least for speed limits so the algorithms used for sign classification and recognition can be “taught” and thus the accuracy of the whole system may be increased.
Although this study provides valuable results, there are some limitations. The study was conducted in controlled conditions (practically a closed road section, dry daytime weather, lack of other traffic, all new traffic signs, relatively low driving speed, etc.) that are not generally present in the real world. However, such controlled conditions represent the best-case scenario, meaning that TSRS accuracy would decrease even more in real world conditions. Moreover, the study included only 17 cars from 14 brands. Even though the used sample is relatively small, most of the major car brands were included and all cars had the best equipment provided by the manufacturer. Finally, due to unavailability of the technical data, proper comparison of the TSRS was not possible.
5. Conclusions
The main aim of this field study was to test whether differences between detection and readability accuracy of market-ready TSRS exist and to what extent, as well as how different “graphical changes” affect their accuracy. A total of 17 cars from 14 brands were tested. Fourteen cars were from different manufacturers while three were from the same manufacturer. The results confirm that TSRS accuracy differs between car brands and even between the same brand, although, due to a limited sample, this needs to be further tested. Furthermore, graphical changes significantly affected the accuracy of the TSRS in all vehicles compared to the control condition (ranging from 62% to 99%).
Based on the results and limitations of this study, future research should investigate TSRS accuracy on real roads with other traffic present and in different conditions as well as different types and quality of traffic signs. In order to develop a deeper insight, the technical data about the installed TSRS should be analyzed in order to evaluate each system and its limitations. Furthermore, a detailed elaboration of standardization methodology and principles should also be developed.


