1. Introduction
Due to intensive environmental regulations, the market share of liquefied natural gas (LNG) in the ship fuel market is gradually increasing [
1]. Recently, discussions on the regulation of ships’ gas emission have continued and are being strengthened gradually. Regulations on nitrous oxides (NOx) and sulphur oxides (SOx) emissions have been established through International Convention for the Prevention of Marine Pollution from Ships (MARPOL) annex VI [
2,
3,
4], and vessels that do not meet the standards would be suspended. However, conventional ship fuels such as heavy fuel oil (HFO) or marine diesel oil (MDO) could not meet the regulations without an additional exhaust gas control system [
5]. For this reason, an attempt to use LNG, which is relatively free from these problems, as the fuel of vessels is a recent trend. Not only LNG carriers but also vessels for other purposes are gradually attempting to change their propulsion systems. For example, according to det Norske Veritas, LNG is expected to account for 11% of the vessel’s fuel market by 2030 and 32% by 2050 [
6,
7].
In order to use LNG as fuel, treatment of generated boil-off gas (BOG) is essential. The liquid state could be maintained only when LNG is kept in a cryogenic state of about −160 °C at ambient pressure [
8], and since it is impossible to block 100% of the heat inflow from the outside, a certain portion of LNG evaporates steadily, and evaporated gas is called BOG. Treatment of BOG is essential in the LNG fuel supply system, but without BOG control, there is a possibility of explosion and fracture of the storage tank. Although the generated BOG could be burned through a gas combustion unit (GCU), it is not the best option, considering that environmental issues such as pollutant gases are also emitted through the combustion process [
9]. If the BOG can be recovered in LNG through a small-scale liquefaction process, not only can fuel be saved, but also pollutant gas emissions can be reduced.
The key parameters for designing the liquefaction process for ships are the compactness of the equipment and the simplicity of the process [
10]. The conventional liquefactions process is an onshore liquefaction process, which is relatively free from space constraints and severe external environments. Unlike onshore, ships have limited space and the main purpose is to deliver goods, so there is not much space available for the liquefaction process. In addition, the ship performs six-way motion (heave, sway, surge, roll, pitch, and yaw), and due to these kinetic characteristics, the simplicity of the process is essential. For these reasons, it is difficult to mount the existing developed onshore liquefaction process on a ship.
However, research on the optimal design of a marine liquefaction process is insufficient, and further research is needed at the present time, when the propulsion fuel turns to LNG. The single mixed refrigerant (SMR) process is a representative liquefaction process with compactness of equipment and simplicity. Rehman et al. [
11] performed exergy analysis for natural gas liquefaction and found 43% of the overall exergy destruction can be avoided. Pham et al. [
12] proposed a compact and energy efficient SMR process for natural gas liquefaction. The proposed process can save energy consumption 30.6% by a knowledge-inspired optimization. Ali et al. [
13] optimized the SMR process for natural gas liquefaction by a recently developed metaheuristic Vortex Search Optimization (VSO) algorithm [
14], and the result showed that energy was saved up to 41.5% with COP of 32.8%. Cao et al. [
15] proposed that robustness be discussed regarding the adjustability of the mixed refrigerant in the SMR system. The degree of freedom to optimize the mixed refrigerants was reduced while the SMR system maintained high efficiency. Moein et al. [
16] minimized energy consumption of the APCI-SMR process using a genetic algorithm and obtained a linear relationship between the MR composition and total required work. In the case of these existing studies, the composition is mainly composed of five or more refrigerants, and it is difficult to maintain the refrigerants’ condition during operation, especially in marine conditions. Additionally, the feed gas was mostly LNG in the previous studies. However, in the liquefaction process for ships, the BOG is the target of cooling, which has a composition closer to pure methane than LNG, and research on the BOG liquefaction process is required.
Due to these characteristics, it is necessary to simplify the composition of the SMR process and evaluate the efficiency accordingly. In this study, the liquefaction process is simulated for a 170k LNG carrier, and energy efficiency is calculated according to the change in refrigerant composition. As the refrigerant composition, nitrogen (), methane (), ethane (), propane (), normal-butane (), and iso-butane () are considered, and the change in liquefaction efficiency according to the number of refrigerants are analyzed. It is shown that when the number of refrigerants is reduced from 5 to 4, the efficiency difference is about 1%, but when the number of refrigerants is reduced to 3, the efficiency decreased by 23%.
2. Process Design
2.1. Liquefaction Process
Natural gas liquefaction requires cooling down to −160 °C under ambient pressure, which makes it an energy intensive industry [
8]. Refrigerant systems can be largely classified into three categories: single refrigerant cascade process, expansion process, mixed refrigerant process [
17]. Mixed refrigerant is a mixture of materials with different boiling points, and it has the advantage that the exergy loss of the cryogenic heat exchanger is small since the temperature difference between the hot composite and the cold composite is small during the temperature change [
18]. Additionally, even when the conditions of the process change, the composition of the refrigerant could be changed to minimize energy consumption [
19]. Mixed refrigerant processes widely used include single mixed refrigerant (SMR), dual-mixed refrigerant (DMR), and propane precooled mixed refrigerant (C3-MR) processes [
18].
SMR has a single mixed refrigerant cycle, and the equipment cost and fixed cost are lower compared to other processes [
20]. In addition, the process is relatively simple since there are few components in the process, but the efficiency is low [
20]. The refrigerant is usually composed of nitrogen and hydrocarbon, and it is compressed through a multistage compressor [
21]. These characteristics make it dominant on a small scale (50,000 to 500,000 gallon per day) process [
22]. The C3-MR proposed by Air Products and Chemicals, Inc. (APCI) consists of two cycles: a pure propane cycle for precooling and a mixed refrigerant cycle for liquefaction and subcooling [
23,
24]. Compared with SMR, the addition of pure propane improves both capacity and efficiency [
20]. DMR consists of two independent mixed refrigerant cycles. Natural gas is pre-cooled by a warm refrigerant and then liquefied by a cold refrigerant [
25]. Warm refrigerant is mainly composed of methane, ethane, propane, and butane, and cold refrigerant is composed of nitrogen, methane, ethane, and propane [
26]. Since the composition of the mixed refrigerant could be easily controlled, it has the advantage of high flexibility, but the process is relatively complicated [
27].
2.2. Design Basis
The BOG composition is assumed as shown in
Table 1. ASPEN HYSYS V10 is used as a software for process simulation, and this study uses the Peng–Robinson equation of state, which is suitable for this situation as it simulates LNG, a light hydrocarbon, up to high pressure and cryogenic conditions.
The amount of BOG generated could be estimated by the following Equation (1) through the volume (
), liquid level (
), average density (
), and evaporation rate of the storage tank (
). Assuming that the tank volume is 170,000
, the liquid level is 95%, the average density is 437.9 kg/
, and the evaporation rate is 0.1%/day, the amount of BOG generated per hour could be estimated to be about 2946.7 kg/h.
The amount of BOG supplied to the re-liquefaction system is determined after supplying the fuel demand from the total BOG generated in the storage tank to the engine as shown in Equation (2).
In this study, it is assumed that two engines are mounted on the vessel: main engine for propulsion and auxiliary engine for power generation. The engine’s fuel demand is estimated as the engine power (
), specific fuel oil consumption (
), engine load (
), and lower heating value of BOG (
), as in the following Equation (3). The corresponding values of each engine are assumed as shown in the following
Table 2.
By subtracting the engine’s fuel demand obtained through the above calculation from the total BOG generation, the amount of BOG supplied to the re-liquefaction system could be estimated as 1029 kg/h.
2.3. Process Flow Diagram
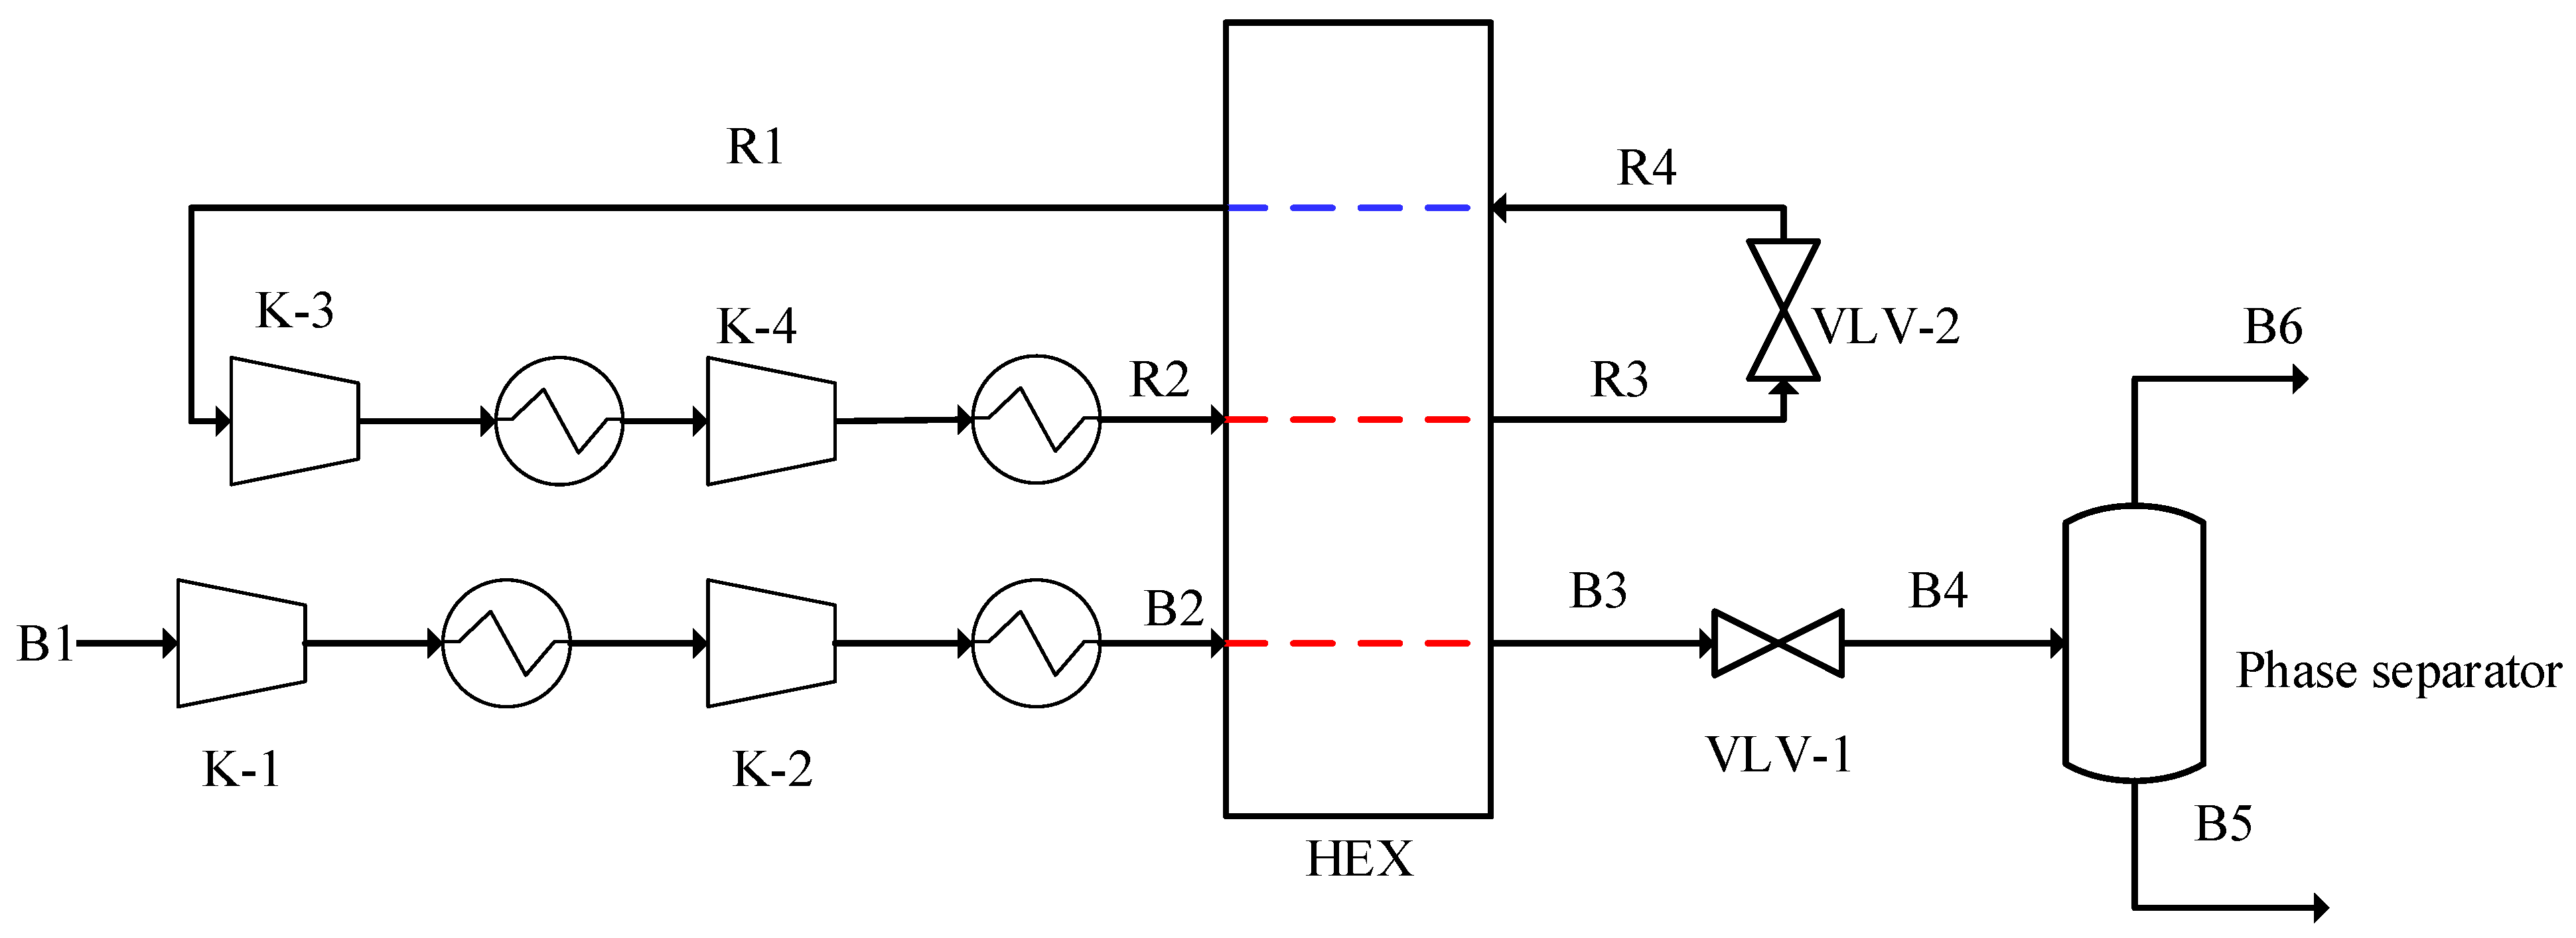
As previously described, the key points of the marine liquefaction process are compactness and simplicity. For this reason, in this study, the basic process configuration is set as the SMR cycle, and
Figure 1 shows the overall process flow diagram (PFD).
The overall system includes compressors for additional compression of BOG (K-1, K-2), a cryogenic heat exchanger (HEX) for cooling, compressors for MR compression (K-3, K-4), and valves for expansion (VLV-1, VLV-2), as well as a phase separator for gas–liquid separation. The BOG supplied to the re-liquefaction system (B1) is pressurized through two-stage compression, and a maximum of 4 times compression is assumed for each stage of the compressor. The cooler is installed at the rear end of the compressor to keep the discharge temperature at 45 °C. The discharged stream (B2) is cooled by heat exchange with the MR in a cryogenic heat exchanger, and after the cool down (B3), it is expanded through a Joule–Thompson valve (VLV-1). After expansion, cooled down BOG goes into phase separator. Liquid (B5) is a product of the liquefaction process; therefore, it goes to the storage tank. Generated gas (B6) goes to the fuel supply system. Afterward, in the MR cycle, the stream (R1) is pressurized through the two-stage compressors (K-3, K-4) (R2) and then cooled down in the heat exchanger (R3). After expansion through the valve (R4), it provides cold energy to the BOG at the heat exchanger.
2.4. Specific Power Consumption
The main purpose of this study was to compare and analyze the cooling efficiency of each liquefaction process. As in Equation (4), the specific power consumption (SPC) could be estimated by dividing the total power consumption of the liquefaction system (
by the total mass flow of LNG generated at the rear end of the phase separator (
. After selecting SPC as the objective function for comparative analysis, the optimum point to minimize SPC is found in each process.
2.5. Optimization
In the optimization, the objective function is SPC, and the variables are the pressure ratio of the compressors (K-1 to K-4), expansion pressure at the rear end of the valve (B4, R4), cooling temperature (R3), and the composition of the mixed refrigerant. The constraints set the minimum temperature difference of the heat exchanger to 3 °C and the vapor fraction of the compressor inlet stream to 1.
subject to
The optimization technique of this study is a genetic algorithm (GA), a global optimization technique that mimics the natural evolutionary process proposed by John Holland in 1975. GA is a representative technique of evolutionary computation in living things, and it uses techniques inspired by natural evolution such as inheritance, mutation, selection, and crossover to create solutions to optimization problems. This study compares and analyzes the efficiency of various mixed refrigerants; therefore, optimization was performed with GA in order to escape the risk of being buried at the local optimal point. Additionally, to verify the results, optimization is performed through the particle swarm optimization (PSO) algorithm, and there are no significant differences in the results.
3. Results and Discussion
In this section, the number of refrigerants is changed to 3, 4, and 5, and comparative analysis is performed on the results of searching for each optimum point of efficiency. There are a total of 6 simulation cases, case 1 is 5 refrigerants, including normal butane; case 2 is 5 refrigerants, including iso butane; case 3 is 4 refrigerants, excluding butane. Case 4 is 4 refrigerants, including normal butane without propane; case 5 is a change from case 4 to iso butane. Case 6 is 3 refrigerants composed of nitrogen, methane, and propane. As a reference case, the results of SMR APCI process optimization are selected.
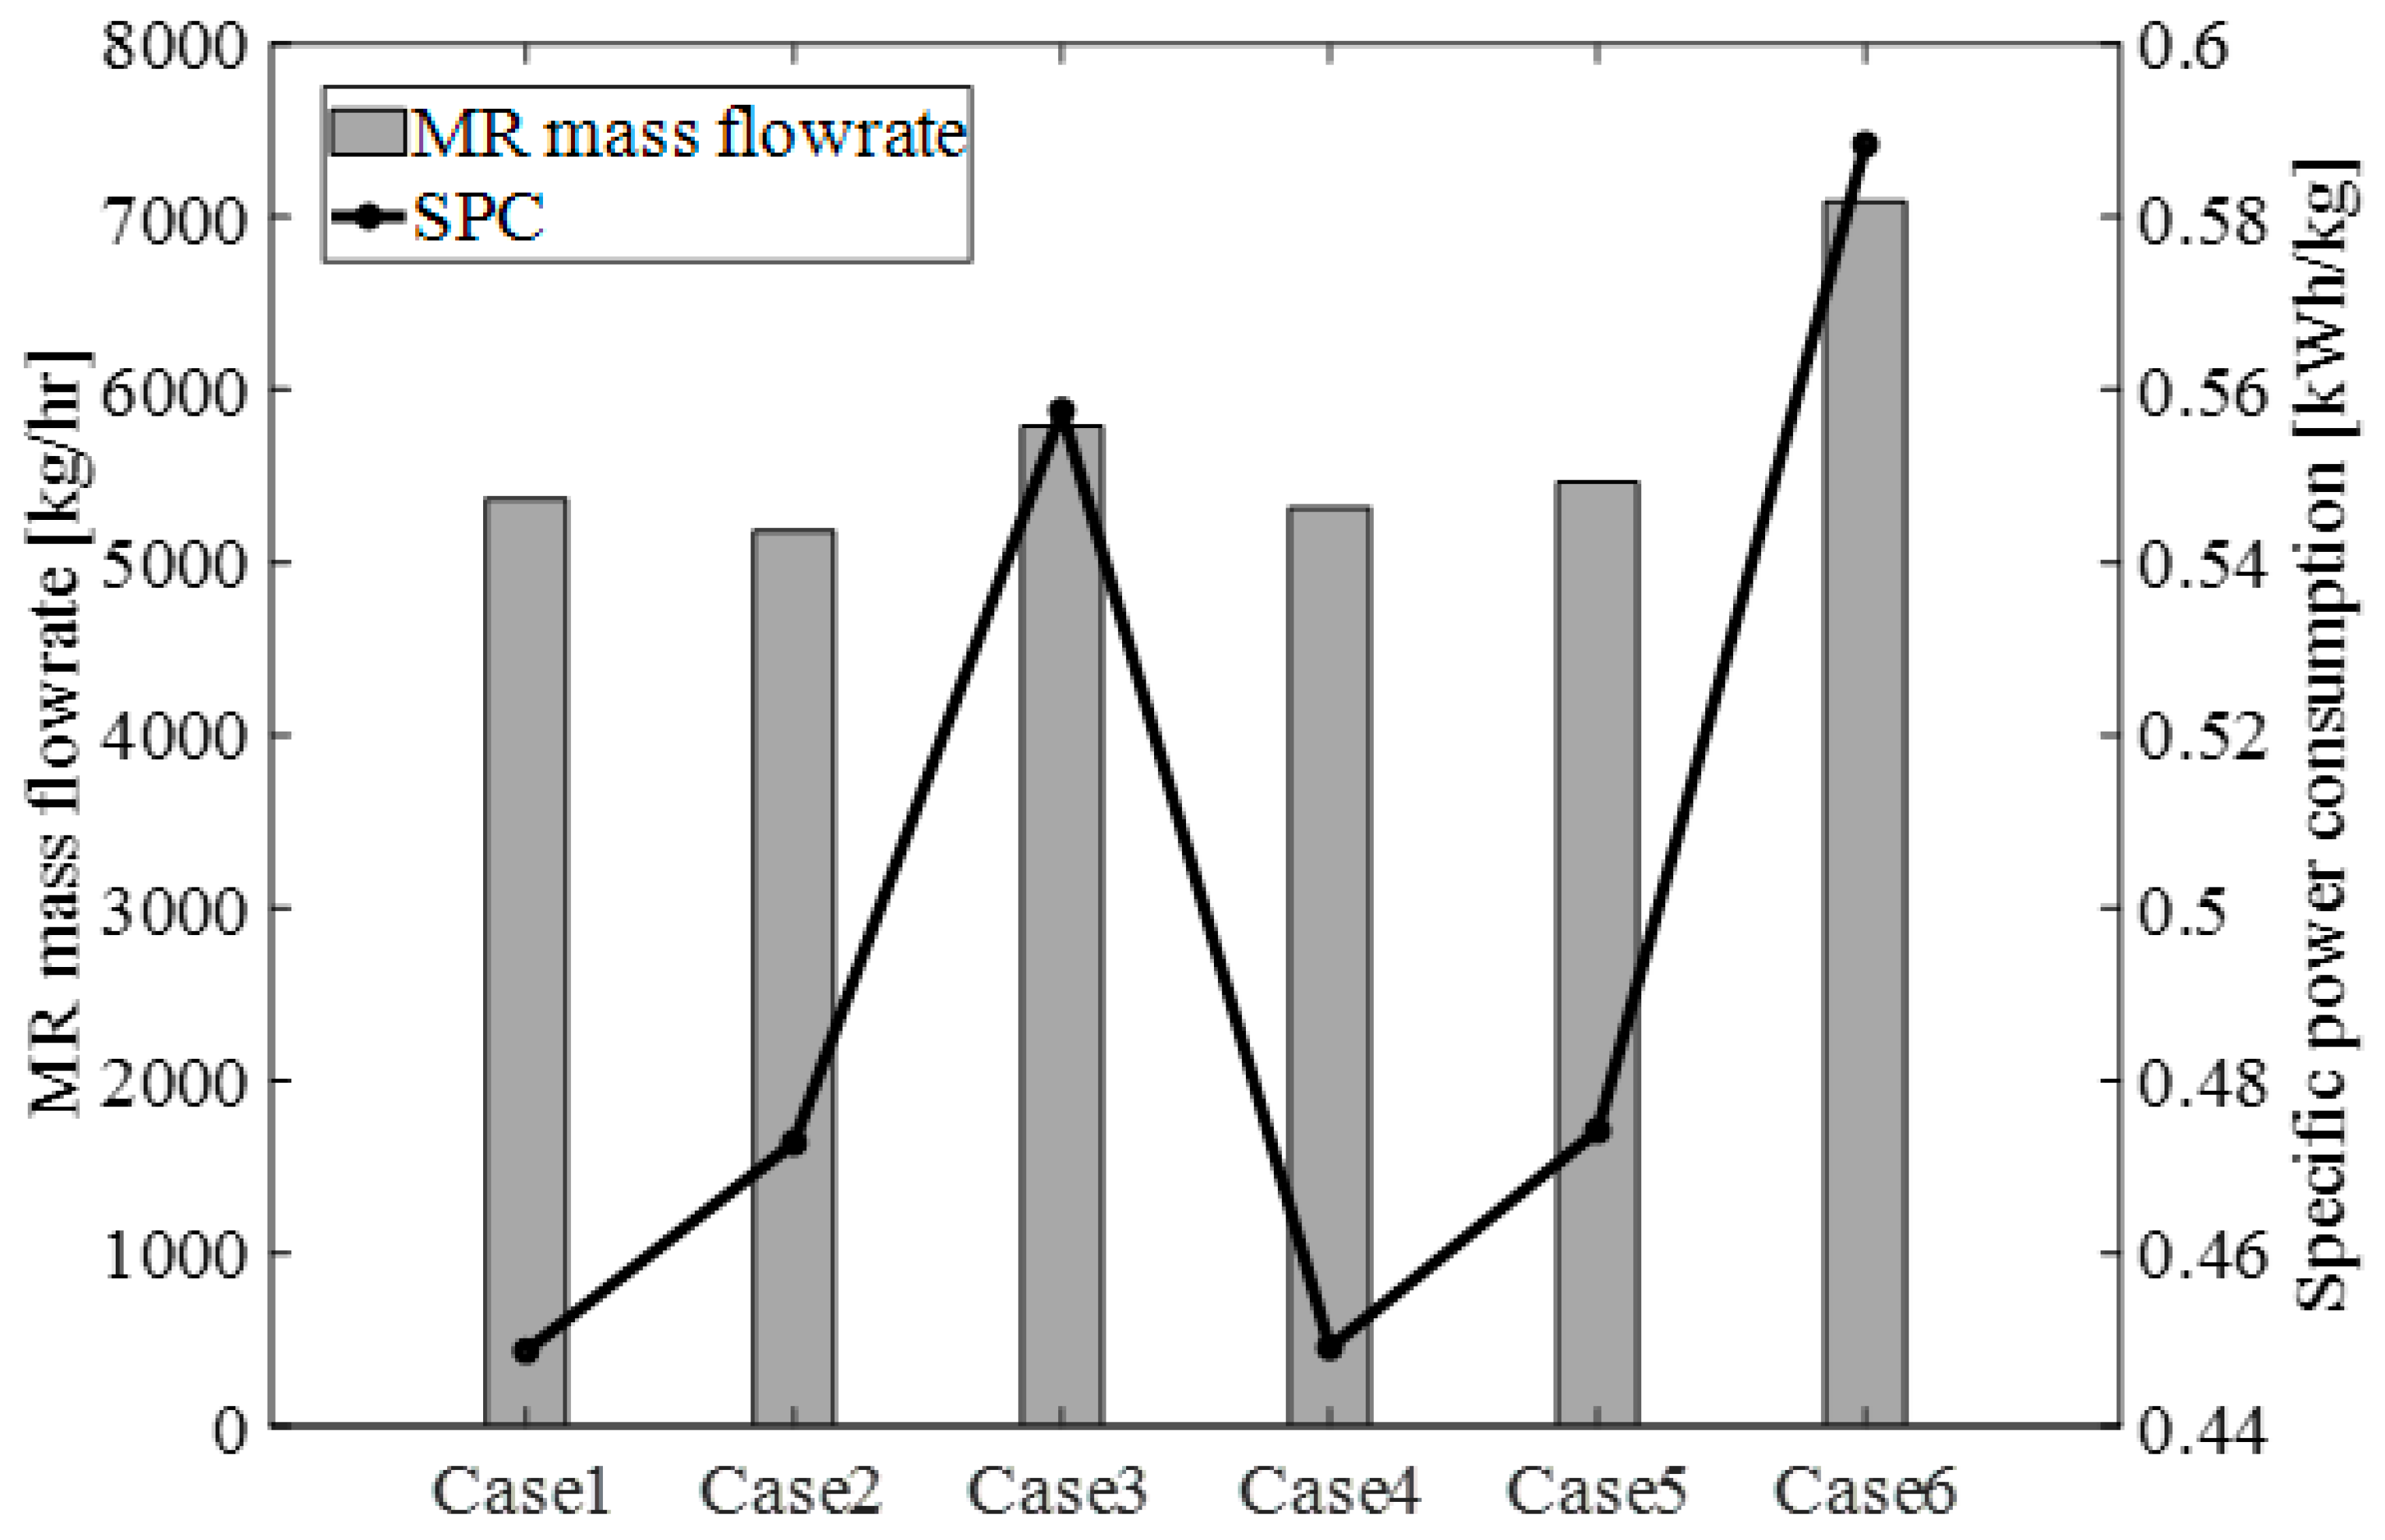
Figure 2 and
Table 3 shows the optimization results of each case. The reference case is the result of SMR-APCI process optimization of a large-scale LNG plant that produces 431,915 kg/h LNG. Mixed refrigerant composition is 5.7 for nitrogen, 27.4 for methane, 33.4 for ethane, 25.8 for propane, and 7.7 for normal butane based on mol percentage. The feed gas pressure is 66.5 bar; the pressure of the mixed refrigerant cycle is 9 bar at the compressor inlet stream and 60 bar at the compressor outlet stream. The optimal SPC obtained is 0.3046 kWh/kg.
Case 1 consists of five refrigerants—nitrogen, methane, ethane, propane, and normal butane—and the flow rate of the MR is 5308.6 kg/h. The BOG is compressed to 107.7 bar and then flowed into the heat exchanger and cooled down to −145.4 °C and expanded in the valve. The MR is pressurized to 48.8 bar in the compressor and then it goes into the heat exchanger. The total power required in this process is 423.9 kWh, and the calculated SPC value is 0.4487. Case 2 is composed of five refrigerants, and iso butane is included instead of normal butane. The MR flow rate is 5181.3 kg/h, and after the BOG is compressed to 105.5 bar, it is cooled to −145.2 °C in a heat exchanger. The MR is compressed to 37.9 bar and then it goes into the heat exchanger, and the total power required in this process is 446.6 kWh. The SPC value calculated through this is 0.4728. In both cases 1 and 2, 5 types of refrigerants are used as in the reference case, but the liquefaction efficiency is much lower compared with reference case. The composition also showed a lot of difference, and it showed a severe difference in the content of propane and butane. The reference case is the liquefaction process of natural gas, and the liquefaction target in this study is BOG. As shown in
Figure 3, BOG has a characteristic that is closer to pure methane than to natural gas, and since there is no temperature change during phase change, the cooling curve has a lower slope in the horizontal section than natural gas. As a result, the degree of bending of the heat curve appears to be more severe. Therefore, efficiency is lower, and the optimum point is different than that of the natural gas cooling process in which the relationship between temperature and the heat curve is close to linear.
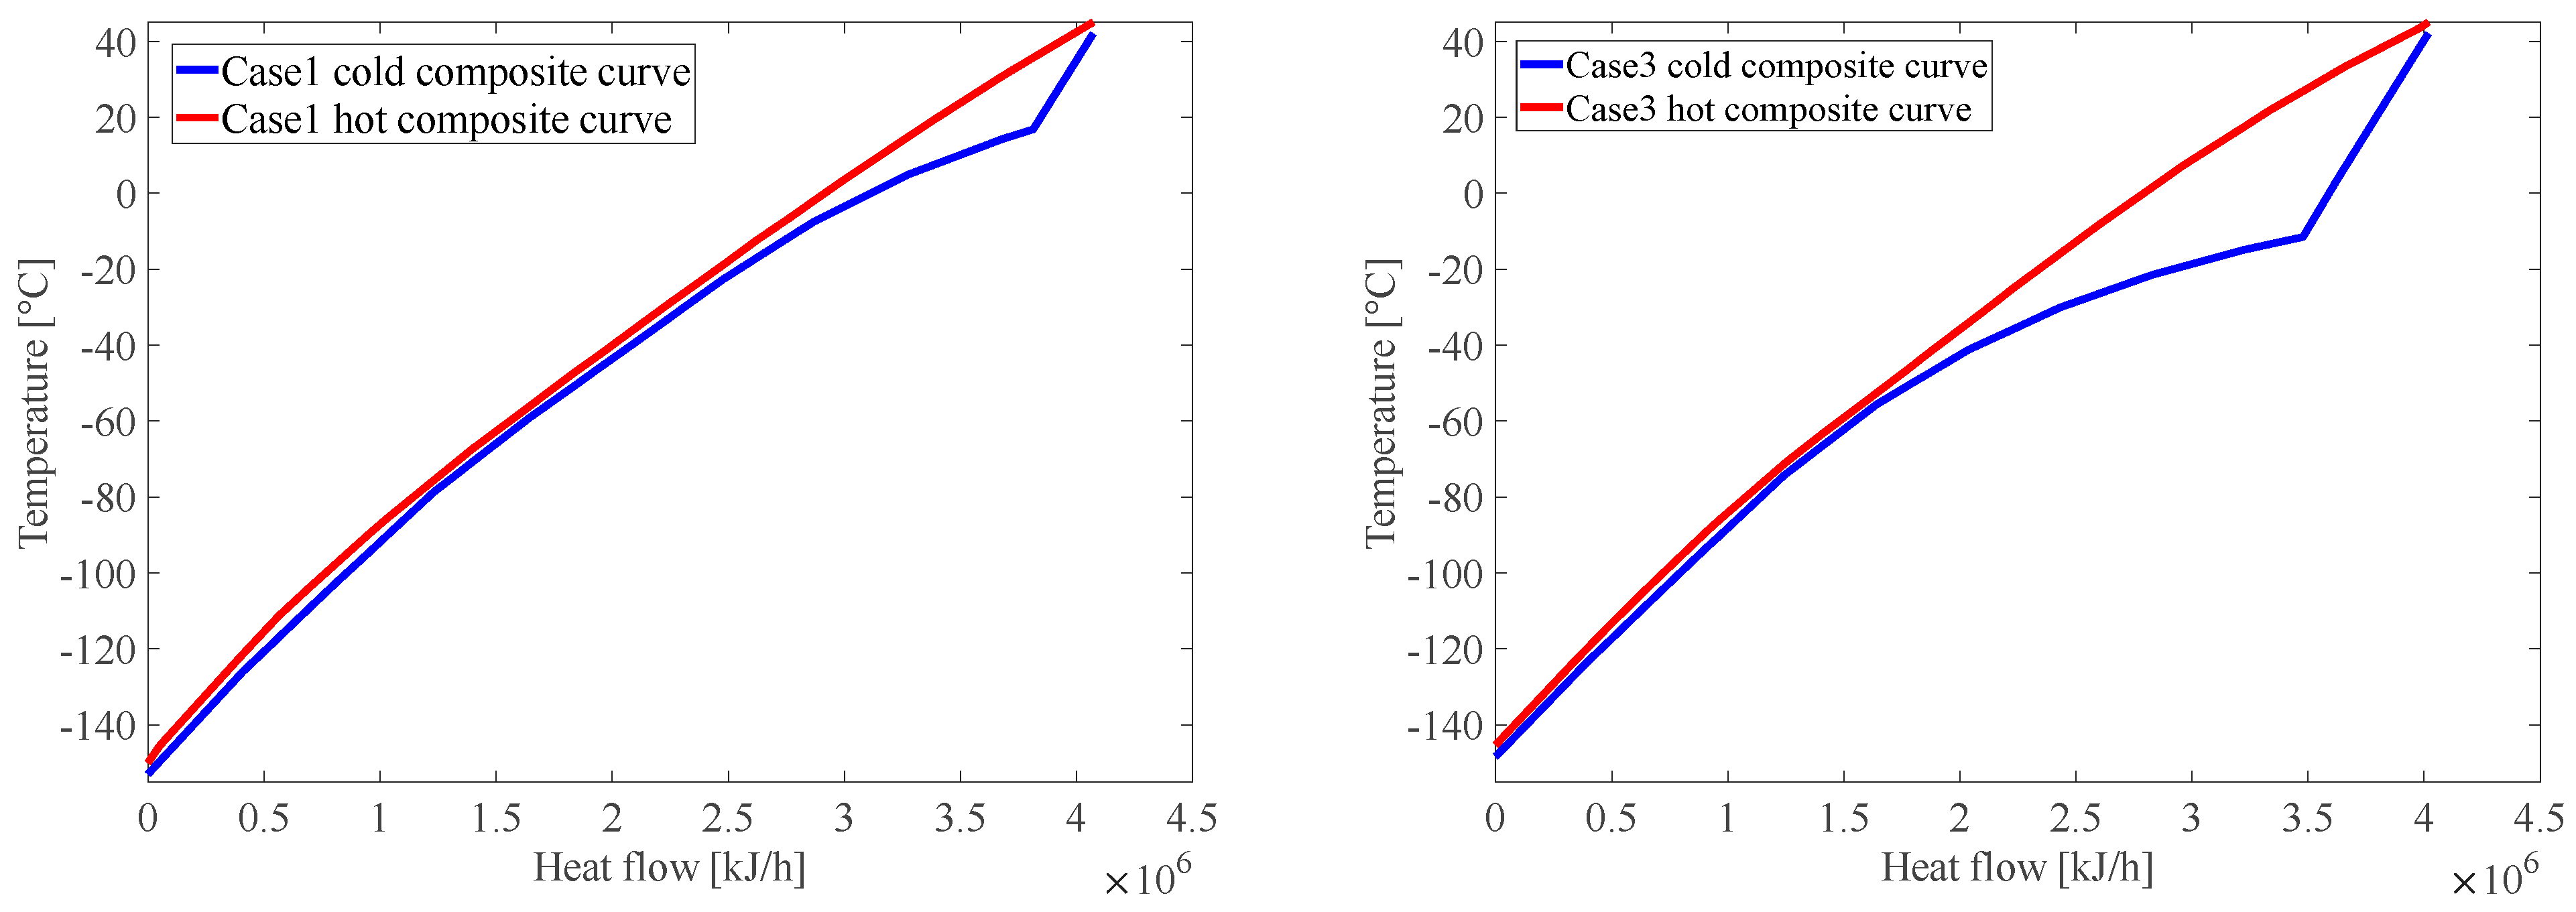
Case 3 consists of 4 refrigerants without butane. The total flow rate of the MR is 5786.3 kg/h, and after the BOG is compressed to 98.72 bar, it is cooled to −145.4 °C in a heat exchanger. The MR required compression to 88.7 bar, total power consumption is 526.8 kWh, and SPC is 0.5576. Compared with the previous 2 cases, a lot of energy is consumed, and as a result, the liquefaction efficiency is also low.
Figure 4 shows the heat curves of the heat exchanger for case 1 and case 3, and the reason for the low efficiency can be seen in the upper right corner. Compared with case 1, the heat curve of case 3 has a lot of open upper right part, but when a refrigerant is composed without butane, the bubble point of the mixture cannot be raised to a certain level. Butane, which is heavier than propane, is required to increase the efficiency by narrowing the space on the right side, and the efficiency is lowered when butane is excluded from the mixed refrigerant.
Case 4 and case 5 consist of 4 refrigerants, excluding propane. Case 4 included normal butane in the mixed refrigerant, and the flow rate of the MR is 5317.3 kg/h. After the BOG is compressed to 107.9 bar, it is cooled to −145.4 °C in a heat exchanger. The MR is compressed to 49 bar, the total power consumption is 424.3 kW, and the SPC is calculated as 0.4491. Compared with case 1, there is no significant difference in efficiency. It has been confirmed that if the number of refrigerants is reduced, excluding propane rather than butane is a better choice in terms of efficiency. Case 5 is a mixed refrigerant containing iso butane, and the total flow rate is 5463.1 kg/h. The BOG is compressed to 92.2 bar and then cooled to −144.8 °C. The MR is compressed to 46.4 bar, and the total power required for the process is 447.9 kW. SPC is estimated to be 0.4742, and there is no significant difference compared with case 2. However, comparing case 4 and case 5, normal butane showed better performance than iso butane. Normal butane has a straight chain structure, while iso butane has a branched chain structure. A branched chain exhibits weaker Van der Waals forces as compared with straight chains. The weak intermolecular force of iso butane lowers the boiling point of iso butane by lowering the energy required to separate them. At ambient pressure, the boiling point of normal butane is −0.4 °C, while iso butane is −11.75 °C. Comparing the difference between case 4 and case 5, the replacement of normal butane with iso butane lowers the boiling point of the MR. This lowers energy efficiency by widening the gas region of the MR where heat loss occurs significantly.
Case 6 consists of 3 refrigerants: nitrogen, methane, and propane. The MR flow rate is 7087.9 kg/h, and feed gas (BOG) compression is required to 116.5 bar, which is relatively high compared with other cases. The MR is compressed to 72 bar, and the BOG is cooled to −145.6 °C by the MR in a heat exchanger. The total power required for the liquefaction process is 555.8 kW, and the SPC is 0.5884. When the number of refrigerants is reduced to 3, the heat curve not only of the high temperature region but also of the low temperature region is also widened, as shown in
Figure 5.
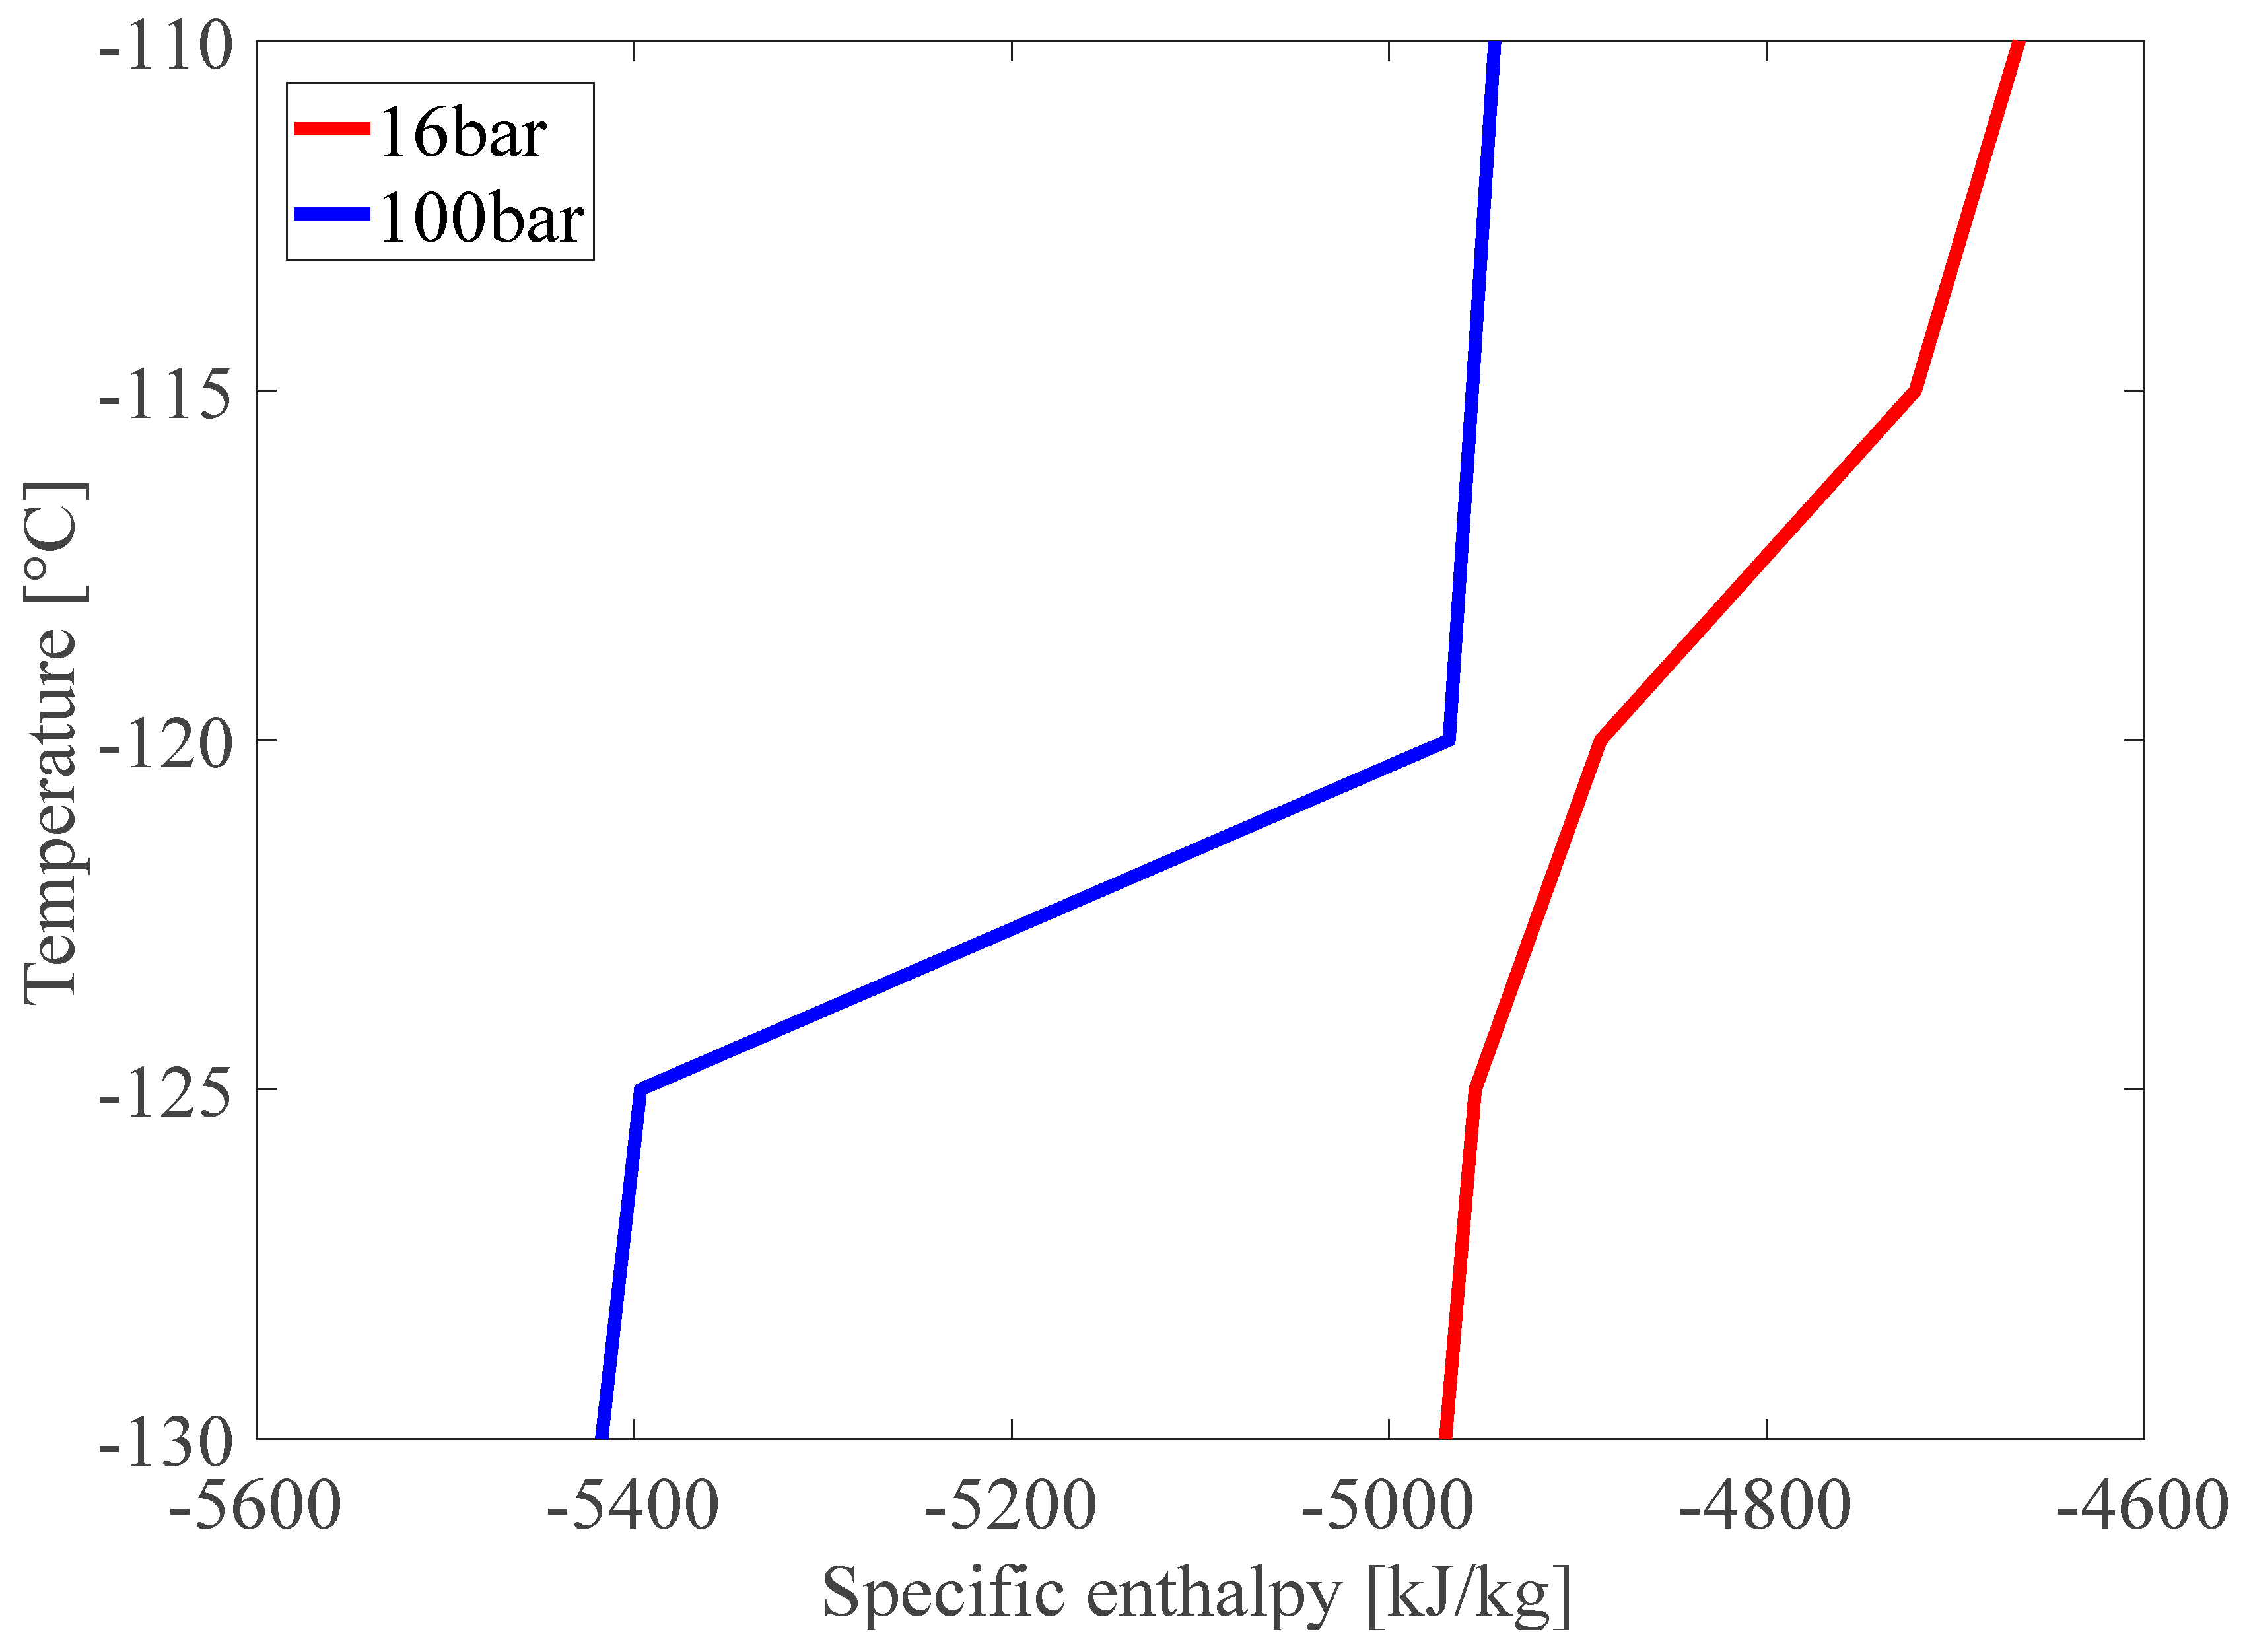
In all cases, it is found that the feed gas (BOG) requires additional compression to about 100 bar. When the feed gas pressure increases, it approaches a supercritical state, so that the temperature change relative to the heat is close to linear without the temperature invariant section due to the phase change.
Figure 6 shows the temperature–enthalpy diagram of the BOG at 16 bar and 100 bar and shows that the graph becomes linear at 100 bar.


