Article

Does CSR Affect the Profitability and Valuation of Energy Companies? An Example from Poland

by
Mariusz Zieliński
1 and
Izabela Jonek-Kowalska
2,*
1
Faculty of Economics and Management, Opole University of Technology, 45-758 Opole, Poland
2
Faculty of Organization and Management, The Silesian University of Technology, 44-100 Gliwice, Poland
*
Author to whom correspondence should be addressed.
Energies 2021, 14(12), 3668; https://doi.org/10.3390/en14123668
Submission received: 29 May 2021 / Revised: 16 June 2021 / Accepted: 17 June 2021 / Published: 20 June 2021

Abstract

:
The article refers to the issues of financial profitability of undertaking CSR activities, which is widely reported in literature. The four largest electricity producing companies in Poland were selected for the analysis. The research period covers the years 2009–2019, when the index of socially responsible companies was operating on the Warsaw Stock Exchange. The main purpose of the article is to compare the profitability ratios and quotations of energy companies in Poland declaring themselves socially responsible with companies of the same sector that have not expressed such a declaration. The results obtained on the basis of descriptive statistics, concerning profitability ratios and stock market quotations, indicate no relationship between their level and stability and the companies’ declarations of compliance with social responsibility. Companies declaring themselves socially responsible were placed in the ranking between the results of companies that did not belong to the indicated index. This may be the result of the specific situation of energy companies in Poland.

1. Introduction

Corporate Social Responsibility (CSR) extends the field of assessment of the effects of the company’s activities, indicating that in addition to economic goals, it should also include social and environmental goals in its strategy and activities. An incentive for the company to include CSR recommendations in the strategic goals is the expected positive reaction of the environment, favoring the strengthening of the competitive position, better use of resources, which should translate into improved financial results, and increased value of the enterprise. More and more often it is indicated that the development of an enterprise should be sustainable, especially from a long-term perspective [1,2]. Enterprises should be expected to increase their interest in CSR activities, if it turns out to be profitable for them.
The implementation of the principles of CSR is particularly difficult in enterprises generating electricity with the use of non-renewable energy sources, mainly due to their negative impact on the natural environment and the health of local and regional communities. This negative impact of conventional energy hampers the principles of CSR relating to balancing economic priorities with social and environmental ones.
Bearing in mind the above circumstances, the topic discussed in this article is both important from the perspective of the sector under consideration, the Polish economy, and the entire European Union. Poland, like a dozen other EU countries, continues to largely base its electricity production on hard coal and lignite resources. Poland and the Czech Republic have even declared that they will use coal in the energy sector after 2030 [3]. Deep changes related to the decarbonization of the economy are forced by the adopted climate policy of the European Union. Unfortunately, compared to other countries, Poland shows relatively low progress in implementing this policy. These delays will result in the necessity to catch up under the pressure of losing the competitiveness of the energy sector in the next few years. It is therefore worth checking whether energy enterprises that try to be socially responsible by belonging to the index of companies respecting CSR, not only improve their media image, but also have a chance to increase their market value and improve their financial results.
The article begins with a theoretical introduction to the profitability of CSR activities. This part outlines the history of the concept, positions of opponents and supporters of including CSR in the corporate strategy, and an overview of research on the profitability of CSR initiatives. Part of the theoretical introduction is also an outline of the conditions for the functioning of the energy sector in Poland.
The main purpose of the article is to compare the profitability ratios and quotations of energy companies in Poland declaring themselves socially responsible with companies of the same sector that have not expressed such a declaration.
The introduction to the research part includes the characteristics of the selection of companies for analysis, the period, and the research method. The research period corresponds to the functioning of the WIG RESPECT index on the Warsaw Stock Exchange, which gathers companies declaring corporate social responsibility that have undergone appropriate verification procedures. The analysis covers four companies that are the largest electricity producers in Poland, and two of them belong to the index of socially responsible companies.
The research part began with the characteristics of the stock market index covering energy companies compared to other stock market indices in the years 2009–2019. The main element of the research part is the comparison of profitability ratios and changes in the level of quotations of the analyzed companies and their stability.
The article is summarized in the discussion and conclusions.

2. Literature Studies

2.1. CSR and Its Profitability in Literature

Most authors consider the publication of the book Social Responsibilities of the Businessman by R. Bowen [4] to be the beginning of the modern period of interest in the concept of corporate social responsibility (CSR). In this publication, Bowen presented a preliminary definition of social obligations of entrepreneurs, describing them as conducting such a policy and making certain decisions that are desirable from the point of view of the goals and values of a given society ([5], p. 6).
The proposal to extend business obligations beyond economic goals has been criticized by supporters of economic liberalism. In his article ‘Social responsibility of business is to increase its profit’, M. Friedman stated that the only thing that business is responsible for is the use of resources in activities aimed at increasing its profit ([6], p. 12). It should be noted that Friedman saw the legitimacy of corporate social activity as long as it was aimed at improving the corporate image, leading to increased sales and profits. He identified CSR with activities performed on the basis of altruistic and ethical foundations [1].
Some authors supported Friedman’s position, stating that enterprises should act responsibly, but this should not be equated with the extended CSR doctrine [7]. Managers mainly act as ‘agents’ to shareholders. Investing in CSR activities can have a negative impact on financial results as it entails additional costs that, at least in the short term, may reduce profitability. Financing of CSR activities competes with other important strategic activities, perhaps more profitably [8,9,10]. Additionally, managers cannot be held morally accountable, and the task of regulating the social system is solely the task of the government [1].
Currently, most authors postulate that the principles of CSR should be included in the enterprise’s strategy [11,12,13,14,15]. What is more, CSR from the minimum obligation undertaken by enterprises began to be presented as a strategic necessity [16]. Porter and Kramer presented the view that companies can achieve a competitive advantage by implementing ‘strategic CSR’ aimed at creating common value, taking into account both the company’s interests and the creation of benefits for society [17,18]. Striving to create shared value is presented as a necessary step in business evolution to identify and expand the links between social and economic progress [19]. Including CSR rules in the enterprise’s strategy should contribute to its sustainable development. Achieving such a goal is supported by focusing CSR activities on care for reputation (including emphasis on reliability, credibility, honesty, responsibility), relations with stakeholders, sensitivity to the needs of the environment (understanding and responding to market trends, stakeholder needs), effective use of resources, and increasing their value (positively influencing the enterprise’s competitiveness) [20,21,22].
Taking into account the views of the authors who are skeptical about CSR, one of the basic problems of implementing CSR rules into business practice is the difficulty in reconciling the interests of shareholders (interested in profit) with the enterprise’s activities for social welfare [23,24]. Strong pressure from owners may cause managers to show a tendency to marginalize activities aimed at social interests and the environment, due to uncertainty about the return on investment [25]. In response to these doubts, the authors presenting the economic approach indicate that CSR activities should have a business justification [21,26], and only those that bring positive financial results can be treated as socially responsible [27]. CSR does not have to mean a compromise between profit and social benefits [4], and the decision to undertake CSR activities may be based on a cost benefit analysis. Managers may try to define the ideal scope of CSR activities [28], that is the level at which maximum profit is achieved, and at the same time take into account the broadest possible range of social expectations (expectations of the enterprise’s stakeholders) [29,30].
The approach to CSR continues to evolve [31,32,33], new definitions are proposed, and there are disputes about the scope of socially responsible activities and the need for their implementation [34,35]. One of the ways of perceiving CSR activities undertaken by enterprises is the triple bottom line (TBL) concept, according to which, apart from financial results, social and environmental effects should be taken into account among the criteria for assessing the enterprise’s activity [36]. These criteria are interrelated and mutually dependent, e.g., achieving an appropriate level of social goals supports the organization’s ability to deliver the expected economic and environmental outcomes. With regard to ecological goals, organizations should, as a minimum, comply with expected standards with regard to the protection of the state of air, water, land, and biodiversity resources [37].
It is emphasized in the financial literature that activities in the field of social and ecological commitment usually support the growth of the market value of the enterprise, but this happens in the long term. From a theoretical perspective, undertaking CSR activities can contribute to improving the financial results of an enterprise thanks to reducing risk, improving adaptability, larger flexibility, improved reputation (among business partners, employees, and customers), increased trust (resulting in lower transaction costs), easier access to information conducive to innovation, etc. [38,39,40].

2.2. CSR in the Energy Industry

The economic sector discussed in the article is a separate issue. Research shows that there are significant differences as to the optimal set of activities depending on the sector represented by the enterprise. The requirements of sustainable development and the effects of including it in the enterprise’s strategy turn out to be varied in different sectors [41,42]. Individual enterprises can improve the effectiveness of their CSR initiatives, adapting them to the specific nature of the sector, which is reflected in their financial results [43].
Publications on CSR in the energy sector emphasize that it is of great importance in this sector. The energy sector has enormous potential to contribute to economic and social development, and at the same time can have a devastating impact on the environment and communities. Energy demand is expected to grow in the coming decades, due to the increase in world population and the accompanying increase in economic activity, especially in developing countries. Challenges for the energy sector result from the fact that obtaining electricity is still based on the combustion of fossil fuels, in conditions of their gradual depletion, with limitations in obtaining renewable energy [44]. Consequently, the power industry is the main source of air and water pollution and one of the largest emitters of greenhouse gases, which contribute to climate change [45,46]. These factors mean that in the case of energy companies more than in the case of companies from other sectors, it is justified to engage in CSR practices and report the results of these activities, which helps to alleviate the environmental concerns of the society [47].
As in the case of other sectors, three areas of responsibility are indicated in the energy sector. These are social (displacement, community lifestyle impact, indigenous right, consumer right, affordability, access to electricity, public health and safety, labor issues, gender equality), environmental (natural resource depletion, climate change and greenhouse gas emissions, renewable sources of energy for electricity, biodiversity, waste and pollution, ecosystem impact), and economic responsibility (local economic development, competition, corruption, reliability of supply, due diligence, eco-efficiency, taxation, research and development, demand-side initiatives). The degree of implementation of CSR recommendations in practice largely depends on the degree of development of a given economy (e.g., the level of corruption risk depends on it) [48].
Responsibility for direct and indirect social impacts includes influencing people in the company, in the company’s supply chain, customers, and the local communities where the company operates. The company’s management, in its choices and actions, should take into account the impact on the interests of society (including health and well-being). One of the proposed directions of action is the dissemination of information among customers about incentives and tips on energy saving, greenhouse gas emissions related to energy consumption, the effects of the enterprise’s activities on the social well-being of the country or community, etc. [46]. Fukuda and Ouchida (2020) state that CSR invariably enhances social well-being. However, they point out a potential conflict between social and economic and environmental liability. If an enterprise has a monopolistic or oligopolistic position, then when environmental activities are associated with low efficiency (emission reduction is costly), environmental goals may lose to economic goals, which may even lead to an increase in pollution [49].
To avoid such a situation, enterprises generating negative externalities are charged with environmental pollution fees. This is especially true of energy companies, which society expects to contribute to environmental sustainability by increasing efficiency, investing in renewable energy sources, improving air quality, reducing carbon dioxide emissions, and protecting biodiversity [50,51]. They should comply with national and international laws and regulations and follow international energy resource efficiency initiatives and practices in order to protect their image [52]. This requires adjusting the CSR strategy to the pressure of external stakeholders, including taking initiatives to stimulate the increase in the use of RES, with the gradual phasing out of fossil fuels (ultimately a complete transition to RES), installing waste and pollution control systems to minimize the impact on the ecosystem, etc. [46,53].
The literature emphasizes that the environmental reputation obtained by the enterprise improves the company’s image and reduces the risk of a crash in the price of its shares [51,54]. From this perspective, CSR can bring benefits to companies by reducing the costs of acquiring new capital (e.g., by issuing new shares). Investors are interested in buying shares of such companies because they believe that CSR management will not hide too much bad news (the asymmetry of information between investors and shareholders will decrease) [54]. According to the signaling theory, companies with better CSR results are likely to provide more information on the actions taken by issuing CSR reports, subject to external verification of their reliability [52].
Unfortunately, with this awareness, in order to attract environmentally friendly investors and customers (which should result in improved financial results) companies may adopt a greenwashing strategy, revealing manipulated information (reporting CSR activities that they do not undertake or that they undertake to a small extent) [51]. Research on the energy sector supports the occurrence of the signaling theory, without showing the tendency to greenwashing (Karaman).
Directive 95/2014 of the European Parliament and the EU Council, which obliges large companies to disclose non-financial information (on environmental, social, and labor issues, respect for human rights, and anti-corruption) as part of the activity report, may significantly reduce the possibility of greenwashing. An essential requirement is that company statements be checked by a statutory auditor or audit firm (https://eur-lex.europa.eu/legal-content, accessed on 30 April 2021). Referring to the content of non-financial information, it seems that the most important information for the stakeholders of a company is the extent to which the company exceeds the minimum standards regulated by law (in the field of labor law, consumer rights, environmental protection, etc.). In the case of energy, information on the pace of reducing greenhouse gas emissions, investing in RES, plans in this regard, and the degree of their implementation would be important. Currently, there is insufficient comparability of non-financial data presented by companies, due to the freedom of choice of standards (uncertainty of companies related to the selection of information that is significant and should be reported). This situation is to be changed by another directive, which is to apply from 2023, introducing a uniform European standard for reporting ESG issues (environmental, social, and management), the draft of which was announced by the European Commission on 21 April 2021 (https://www.gov.pl/web/fundusze-regiony/raportowanie-spoleczne, accessed on 30 April 2021).
In recent years, the sector of electricity producers in Poland, which is the subject of the considerations, has faced the need to drastically change its strategy, including reshaping its production. Climate change has meant that political decision-makers, in addition to economic considerations, require the electricity generation sector to reduce greenhouse gas emissions. The transition to sustainable production based on renewable sources (RES) is very difficult and requires time and is also opposed by shareholders (investment funds) involved in the energy sector [55]. In a situation where most of the produced energy comes from non-renewable sources, a drastic shift towards RES poses a serious risk of instability, therefore it requires a gradual redirection of investments taking into account the transition period, all the more so as renewable energy production is associated with lower profitability [56].
Leading the efforts to reduce the environmental impact of energy is the European Union [57]; through the European Commission it has been consistently pursuing policies aimed at decarbonizing member state economies. Its basic tool is regulations causing additional costs of generating electricity from non-renewable sources, due to carbon dioxide emissions, related to the operation of the emissions trading system in the European Union [58]. The permissible limits of free CO2 emissions are being reduced and the prices of allowances for additional emissions tend to increase. The expected consequence of the tightening of emission limits will be the loss of competitiveness of energy obtained from coal [59], the profitability of investing in additional fossil fuel capacity from 2025, and in the longer term, the withdrawal of coal and natural gas from the energy sector in the 1940s [60].
The impact of environmental regulations introduced in the energy sector is of key importance for the energy generation system in Poland, which is still based on coal. Poland refrained from investing in RES, justifying it with rich deposits and experience in mining (scientific, engineering and technical support, access to modern machinery) and a significantly lower cost of energy production from fossil resources [61]. The Polish energy market is unique in the European Union, due to the largest share of hard coal and the use of lignite to produce electricity (48% hard coal and 29% lignite in 2018) [62,63]. This is due to, inter alia, delays in the implementation of the European energy policy [64,65], which will result in an accumulation of changes in the sector in a relatively short time. One of the main challenges of decarbonization in Poland is the abandonment of lignite, which is enforced by the regulations on the reduction of pollutant emissions [66]. The use of lignite (with its much lower calorific value) is associated with higher CO2 emissions (in Poland, respectively, 104.14 kg/GJ for lignite and 94.71 kg/GJ for hard coal) (https://www.kobize.pl/uploads/materialy/WO_i_WE_do_monitorowania-ETS-2019.pdf, accessed on 30 April 2021).
The scale of restructuring challenges for the mining and energy sector is unprecedented in other economies [3,67], which is confirmed by the structure of coal sales. In 2017, more than half of the hard coal was sent to power plants and combined heat and power plants, and in the case of lignite it was about 98%. Kaszyński and Kamiński [68] presented five scenarios of changes in the structure of the energy sector in Poland until 2050, taking into account the EU environmental policy. They predict a drastic reduction in the demand for hard coal, while the consumption of lignite will drop practically to zero in all the scenarios considered.
Due to the strategic and financial challenges faced by the energy sector, the results of its companies may become incomparable to those of companies in other sectors. This problem is addressed by the first of the research questions posed in the article:
(Q1) Are the strategic challenges facing the Polish energy sector reflected in the level of its stock market quotations?
Regardless of whether or not it is legitimate to compare the performance of companies belonging to different sectors, comparisons can be made between the profitability and performance of companies belonging to the same sector with similar economic activities and the factors affecting them. One of the factors influencing profitability and market valuation may be an appropriate CSR strategy.
Research on the effectiveness of CSR most often focuses on the relationship between CSR activities and the enterprise’s financial results and is directed to top-level managers [69]. Due to the large number of studies, for the overall assessment of the profitability of CSR activities, it was decided to compile the results of meta-analyses. Meta-analyses allow one to synthesize divergent empirical results of a large number of primary works. Some of the meta-analyses indicate that the impact of CSR on the financial performance of enterprises is positive, but small [70,71]. However, most meta-analyses indicate a positive impact of the implementation of CSR rules in an enterprise on its profitability [69,72,73,74,75,76].
The reasons for the success of CSR activities in the form of improved profitability and increased value on the market are most often indicated in the improvement of the image, competitive position, and positive response from customers and stock market investors [77,78,79,80]. Publications emphasize that in order to achieve such an effect, CSR activities should be properly directed and constitute a relatively coherent system, and the environment should be informed about CSR activities [81,82,83]. It is also noticed that managers’ knowledge of sustainable development increases over time, which results in increased investments in CSR and reorganization of business strategies [84].
Although meta-analyses indicate the advantage of publications with a positive relationship between CSR and profitability and market valuation, it should be remembered that some of the published studies do not confirm such a relationship, and even indicate a negative correlation [85,86,87,88]. This situation not only concerns individual enterprises, but also funds investing in socially responsible companies [89]. In conclusion, the authors of the research return to the reservations formulated by Friedman’s followers, concluding that even in the long run, CSR activities may have a neutral or insignificant impact on financial results due to the high costs of their implementation.
A very important issue from the perspective of the sector in question is the ecological aspect of CSR. Responsibility for the environment may become a source of competitive advantage for an enterprise [90,91,92]. Important in this respect is the pursuit of cleaner production, reduction of material consumption, efficient use of energy, water, and land, etc. [93]. Although environmental protection entails costs, lack of care for the environment leads to a deterioration of the image and an increase in fees (penalties) for pollution [94]. Meta-analyses on the issue in question showed that the inclusion of environmental issues in the strategic planning process, resulting in the use of technologies aimed at preventing pollution (as opposed to ‘end-of-pipe’ technology), not only improved the condition of the environment but also provided better financial results [95,96]. In retrospect, higher profits cannot be expected when environmental investments are made, but financial results improve in the coming years. Enterprises that invest less in environmental activities have better results in the short term but have lower profitability and lower growth rates in the following years [97].
The research question that is fundamental from the point of view of the aim of the article refers to the above review of research:
(Q2) Do energy companies that declare compliance with CSR rules achieve higher profitability and market valuation than other companies in the sector?
Companies adhering to the principles of corporate social responsibility are perceived as implementing more predictable strategies, which means that the risk of investing in such companies is lower. Therefore, there should be greater interest in such companies by stock market investors, especially institutional investors (e.g., large pension funds) looking for long-term stable investments. It should be added that institutional shareholders may influence the strategic activities of the enterprise, including the implementation of activities in the field of corporate social responsibility [98,99]. Based on the above considerations, the third research question was formulated:
(Q3) Are the profitability ratios and quotations of socially responsible companies more stable over time (characterized by lower volatility)?
3. Materials and Methods

3.1. Selection of Companies for Analysis

The research is a case study, carried out on a group of four companies that are the largest producers of electricity in Poland (PGE, Enea, Tauron, Zepak). The main selection criterion was the share in electricity production on a national scale. Additional criteria were independence (not being included in another capital group) and having a headquarters in Poland.
Although the group of analyzed companies only meets the minimum size criteria for case studies suggested by Eisenhardt [100], it should be noted that it reflects the situation in the energy sector in Poland. In 2019 (the last year covered by the analysis), the largest producer of electricity in Poland was PGE (40.6% share in production), along with the next two companies in terms of production, Enea and Tauron, which supplied 66.4% of energy. After adding the 4% share of Zepak, the analyzed companies supplied over 70% of electricity in Poland. Significant electricity producers are also PKN Orlen (5% share in production) and PGNiG (3%) (https://www.ure.gov.pl/pl/energia-elektryczna, accessed on 30 April 2021). They were not included in the analysis as their main activity belongs to the fuel sector. Energa, which plays an important role in the distribution of electricity, has not been added to the analysis, but its share in energy production is only 2% (additional arguments for excluding this company from the analysis were the fact that it did not participate in the WIG Energia index, it only entered the stock market in 2013, a large share in the production of RES specific for Polish conditions (over 40%), and loss of independence as a result of the acquisition by PKN Orlen in 2020) (https://oko.press/images/2020/06/Energa-2019.pdf, accessed on 30 April 2021).
In the comparative analysis, two companies (PGE and Tauron) belonging to the WIG RESPECT index were considered socially responsible. The index was first listed on 19 November 2009. It functioned until the end of 2019 (it ceased to be published from 1 January 2020 by a Resolution of the Exchange Management Board) [101,102,103]. The companies included in the index underwent a three-stage assessment, including an assessment of the liquidity of trading on the stock market, corporate governance practices, and activities addressed to stakeholders as part of CSR, which were assessed from the perspective of environmental, social, and economic factors (http://www.respectindex/kryteria_oceny_spolek, accessed on 30 April 2021). The companies in question joined the WIG RESPECT index in 2011, respectively (PGE) and 2013 (Tauron). It is true that they did not belong to the index from the beginning, but being included in it required appropriate preparations, and therefore these companies undertook CSR activities before applying to this index.
Enea and Zepak, which did not enter the WIG RESPECT index, were selected as the control group.

3.2. Period and Method of Research

The research period covered the years in which the WIG RESPECT index functioned. The answer to the first of the research questions concerning the specific situation of the energy sector in Poland was based on a comparison of four selected stock market indices, (apart from WIG Energia, the WIG, WIG 20, and WIG RESPECT indices were included). The values of the analyzed stock indices at the end of individual years are presented in tabular form, and they became the basis for the preparation of a chart showing the trends in changes in the level of quotations. The comparison was made on the basis of the quotation change ratios when adopted as the basis for the index calculations at the end of 2009.
The second research question concerned the comparison of profitability and stock market valuation of the analyzed companies. The analysis of profitability ratios and their changes covered the years 2009–2019, and the basic profitability ratios were calculated on the basis of the available data from the companies’ financial statements. To present the analyzed data, line charts were used, developed on the basis of the numerical data contained in the tables in the Appendix A. These tables additionally contain a ranking list for individual years, which makes it easier to track the relative changes in the level of profitability achieved by the companies. In order to illustrate the similarities between the companies, the cluster analysis (dendrograms) was additionally used. As one of the analyzed companies only started to be listed on the stock market in 2012, the research period in the case of changes in the level of stock market quotations closed in the years 2012–2019. The share prices of the analyzed companies and the values of selected stock market indices are the closing values at the last trading session in a given year. In order to obtain comparability of data, in the case of stock market quotations, the index method was used, assuming the level of quotations at the end of 2012 (i.e., the year in which the last of the analyzed companies appeared on the Warsaw Stock Exchange). The data are presented in the form of a chart, the reference of which was the actual quotation levels presented in the table preceding the chart. To illustrate the similarities between companies in terms of changes in the level of stock market quotations, a cluster analysis (dendrograms) was used.
The answer to the question concerning the stability of profitability and the level of quotations of individual companies was based on the analysis of volatility measures in the form of standard deviation and coefficients of variation. The calculated values are presented in tabular and graphic form.

4. Results

4.1. WIG Energia Compared to Other Stock Market Indices in the Years 2009–2019

To illustrate the situation of the analyzed sector in the years 2009–2019, the sector index (WIG Energia) was confronted with the index for the entire market (WIG), the index of the largest companies (WIG 20), and, due to the subject of the article, with the index of socially responsible companies (WIG RESPECT). Data on the development of the four analyzed indices in the analyzed period, with approximations to full points, are presented in Table 1.
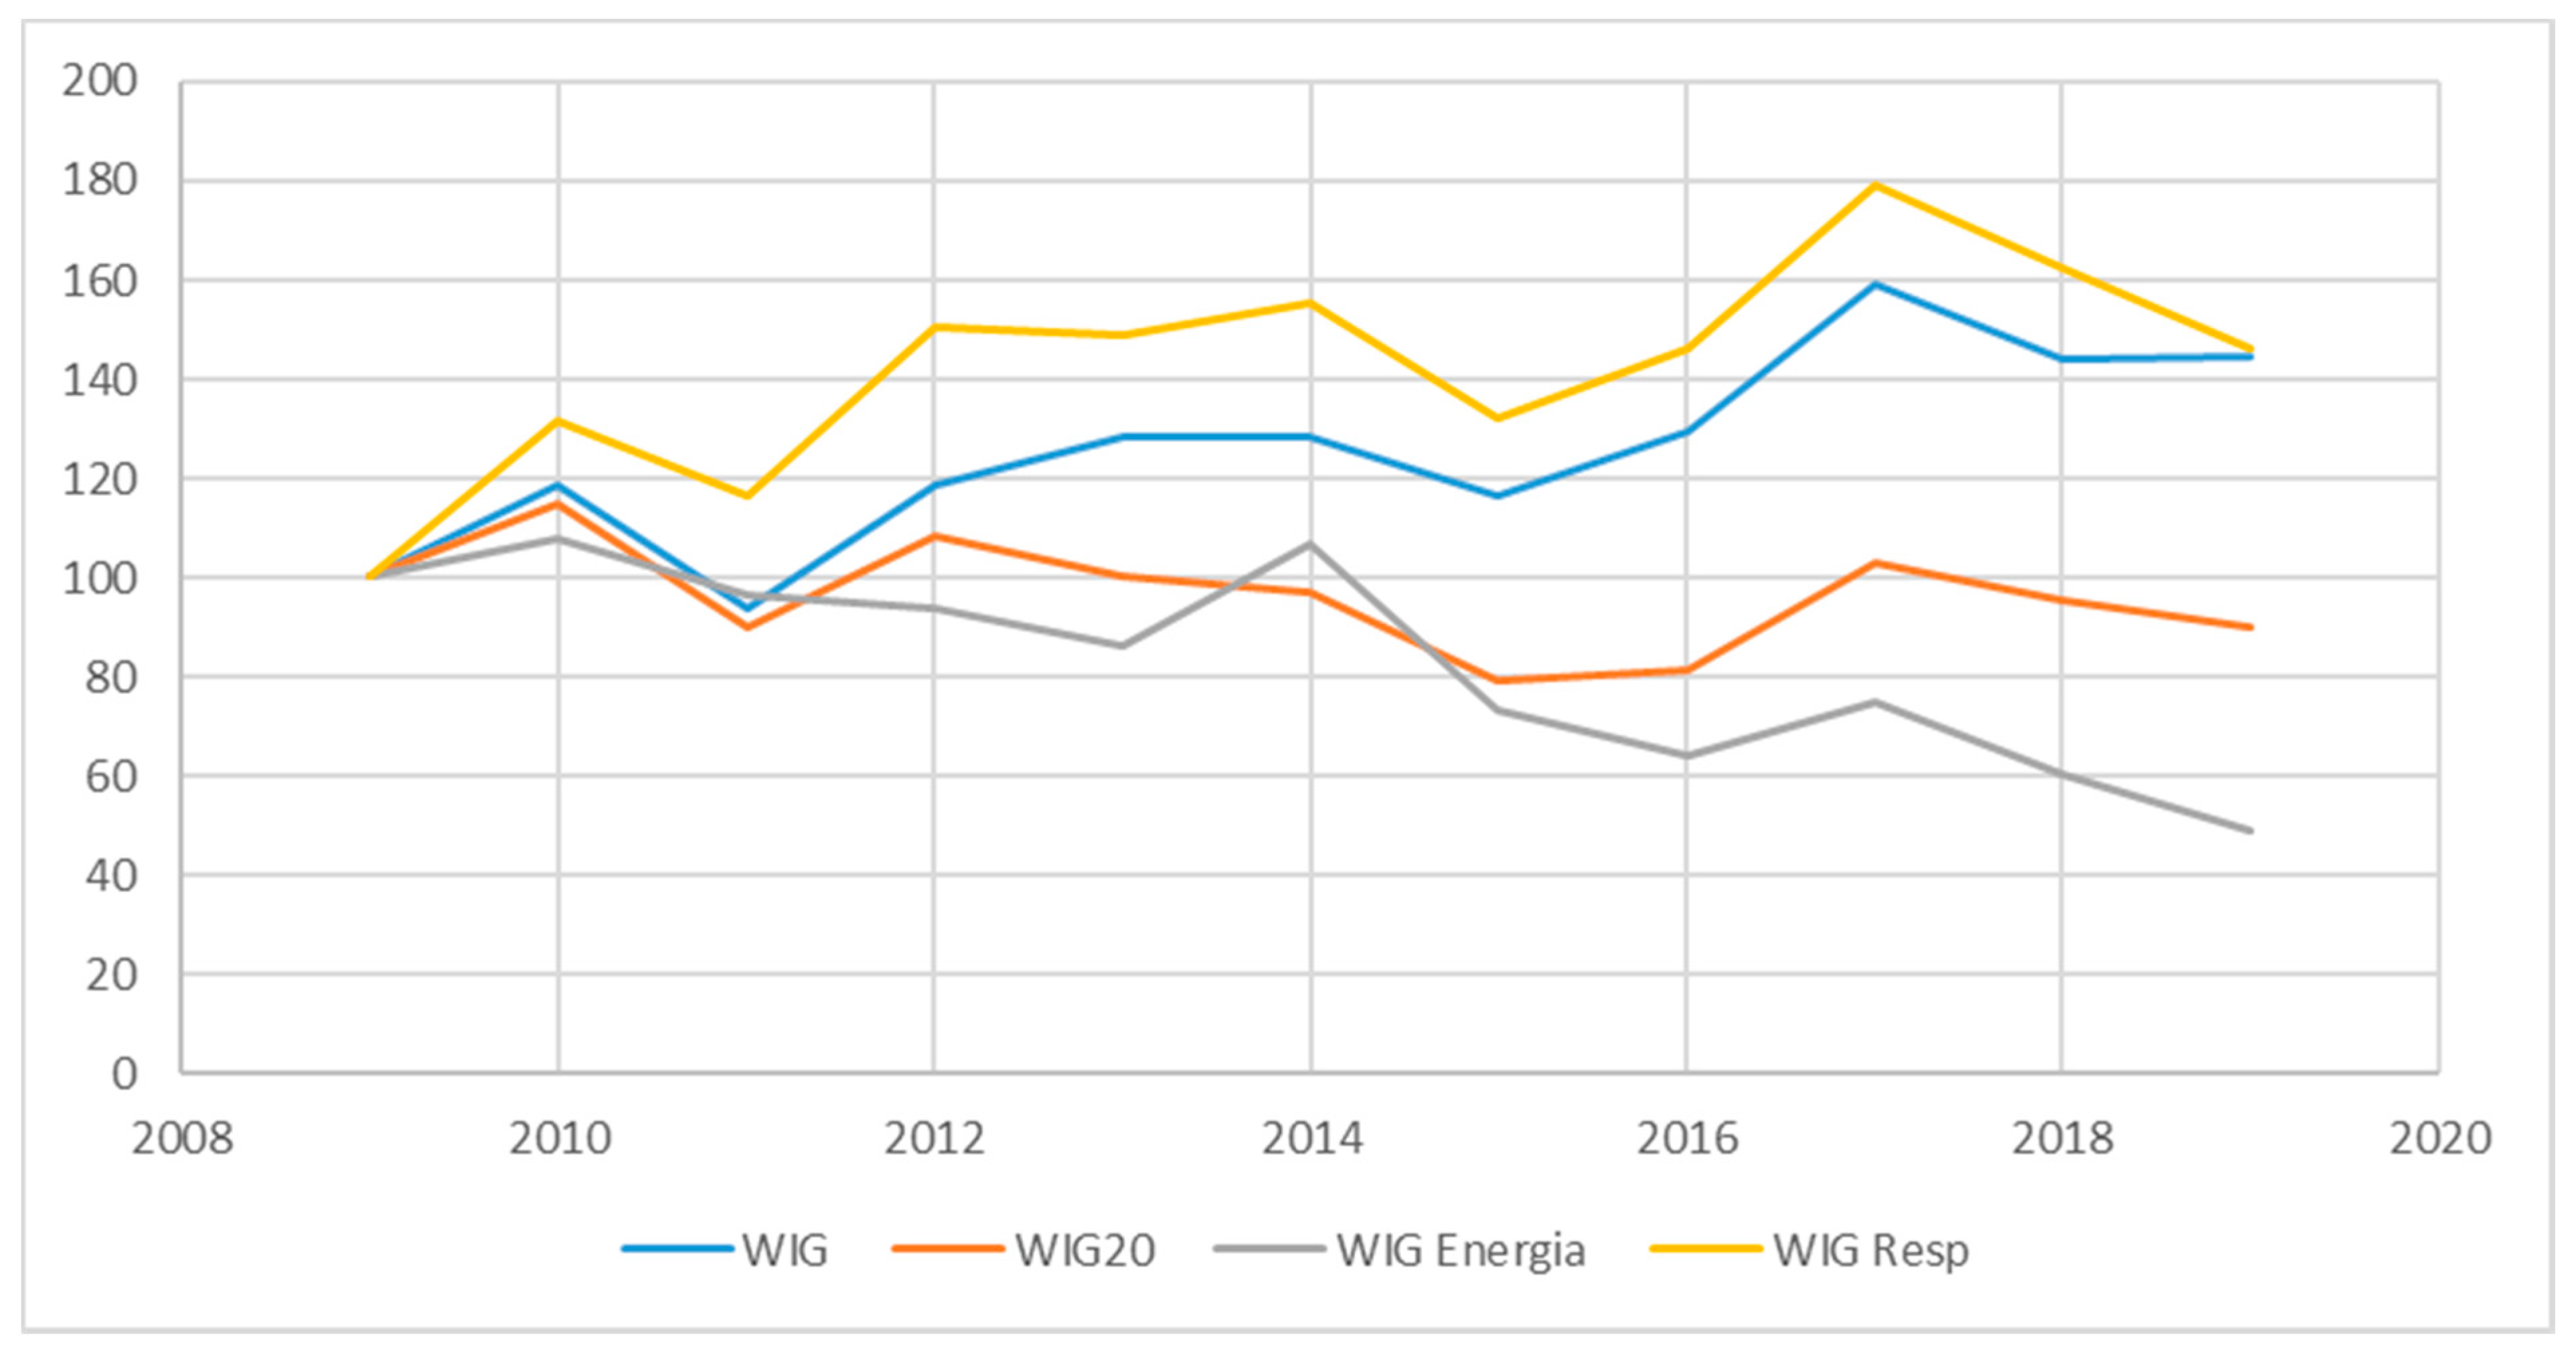
In order to obtain comparability of data on changes in individual indices, the ratios of their changes were calculated, assuming 2009 as the base year. Changes in the WIG Energia index compared to the other considered indices are presented in Figure 1.
The entire market, represented by the WIG index, only recorded a drop in its value in 2011, compared to the base year, and closed the entire ten-year period with an increase of 44.63%. Changes in the values of the WIG 20 and WIG Energia indices were similar in the period 2010–2015. In the next 4 years, WIG 20 made up for some of the losses from previous years and ended the analyzed 10-year period with a 10% loss, while further declines of WIG Energia brought it to 49% of the 2009 baseline value at the end of 2019.
The WIG Energia quotations should actually be compared with the development of WIG 20, as the two largest companies in the energy sector that make up WIG 20 are responsible for 2/3 of the WIG Energia index. The main reason for the deterioration in energy prices compared to the entire market (including deepening declines compared to WIG 20) were losses incurred by companies in the sector. In 2015, all analyzed companies reported losses (Table A1, Table A2 and Table A3 in the Appendix A). The situation repeated itself in 2019, when three of the analyzed companies revealed losses. Additionally, the level of energy quotations was influenced by investors’ awareness of the enormity of investment tasks facing the sector, related to the need to reshape production due to decarbonization, resulting in a decrease in the value of existing assets.
The development of the WIG RESPECT index is noteworthy, the increase of which until 2019 clearly exceeded the increase in quotations on the entire market. Perhaps one reason for discontinuing its publication was a consequence of the drop in its valuation, to a large extent caused by the declines in the quotations of the energy companies that make it up. The authorities of the Warsaw Stock Exchange promoted companies belonging to this index, emphasizing the importance of CSR and higher value growth than other indices. In the event that this index grew slower than the entire market (which was already seen in 2020), belonging to the index would become a burden. Referring to the drop in the valuation of the WIG RESPECT index, it can be assumed that to a lesser extent it was caused by the possible reluctance of investors towards socially responsible companies, and to a greater extent by its composition. Due to the great importance attached to the liquidity of turnover, the WIG RESPECT index in 2019 included 12 out of 20 companies belonging to WIG 20, and a significant relative drop in the valuation of the largest companies (a 10% drop in WIG 20, with an increase of the entire market by almost 45% in 10 years), had to be reflected in the valuation of the index of socially responsible companies.

4.2. Profitability Ratios

In order to answer the question whether the profitability of the companies can be expected to improve as a result of compliance with CSR rules, reports were prepared on the ROA, ROE, and ROS indicators for the four analyzed companies.
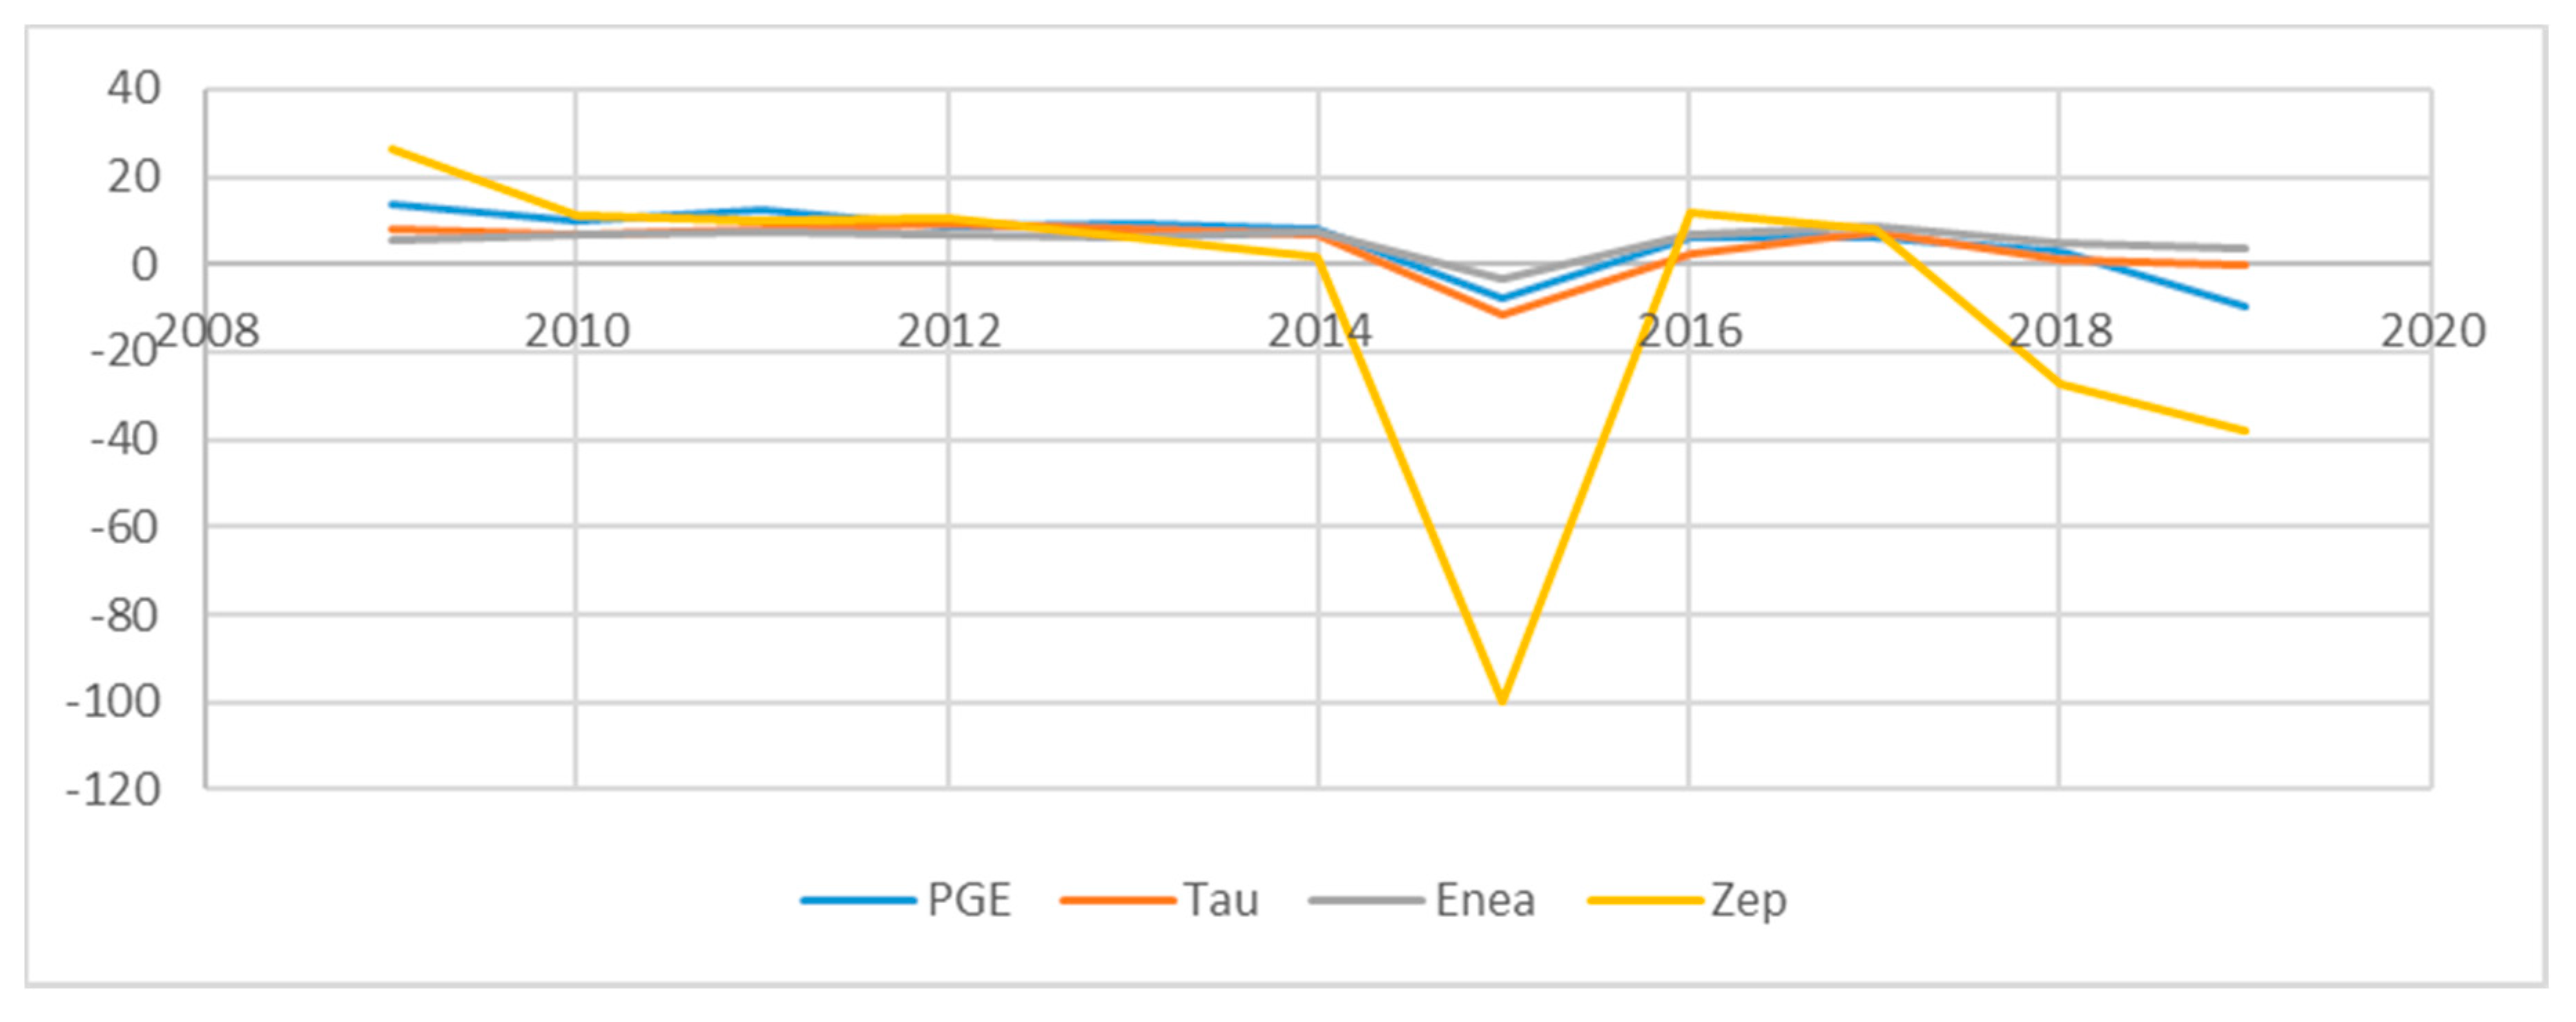
Data obtained by the companies on the ROA indicators are included in Table A1 (Appendix A), which also includes a ranking list from the perspective of the position taken by individual companies each year. On the basis of these data, Figure 2 was prepared. It should be noted that the hierarchy of companies in terms of return on assets is unstable over the period under review.
The observation of the ROA index does not confirm that companies treated as socially responsible achieve higher return on assets. On the one hand, the ratio for Zepak (belonging to the control group) clearly deteriorated during the research period, dropping to the last position of the company with the highest ROA. On the other hand, at the end of the analysis period, Enea, which is not included in the RESPECT index, obtained ROA ratios higher than those of socially responsible companies. Moreover, it moved up from last place in 2009 to first place in the last two years. It is worth emphasizing that Enea outdistanced socially responsible companies in terms of ROA after eight (in the case of PGE) and six (in the case of Tauron) years of belonging to the WIG RESPECT index, respectively.
It should be noted that the ROA level ratio (and other profitability ratios) and the position of individual companies in the ranking are significantly affected by losses in the sector (Enea recorded one year of losses in the analyzed period, PGE and Tauron recorded losses in two years, and Zepak made losses in three years).
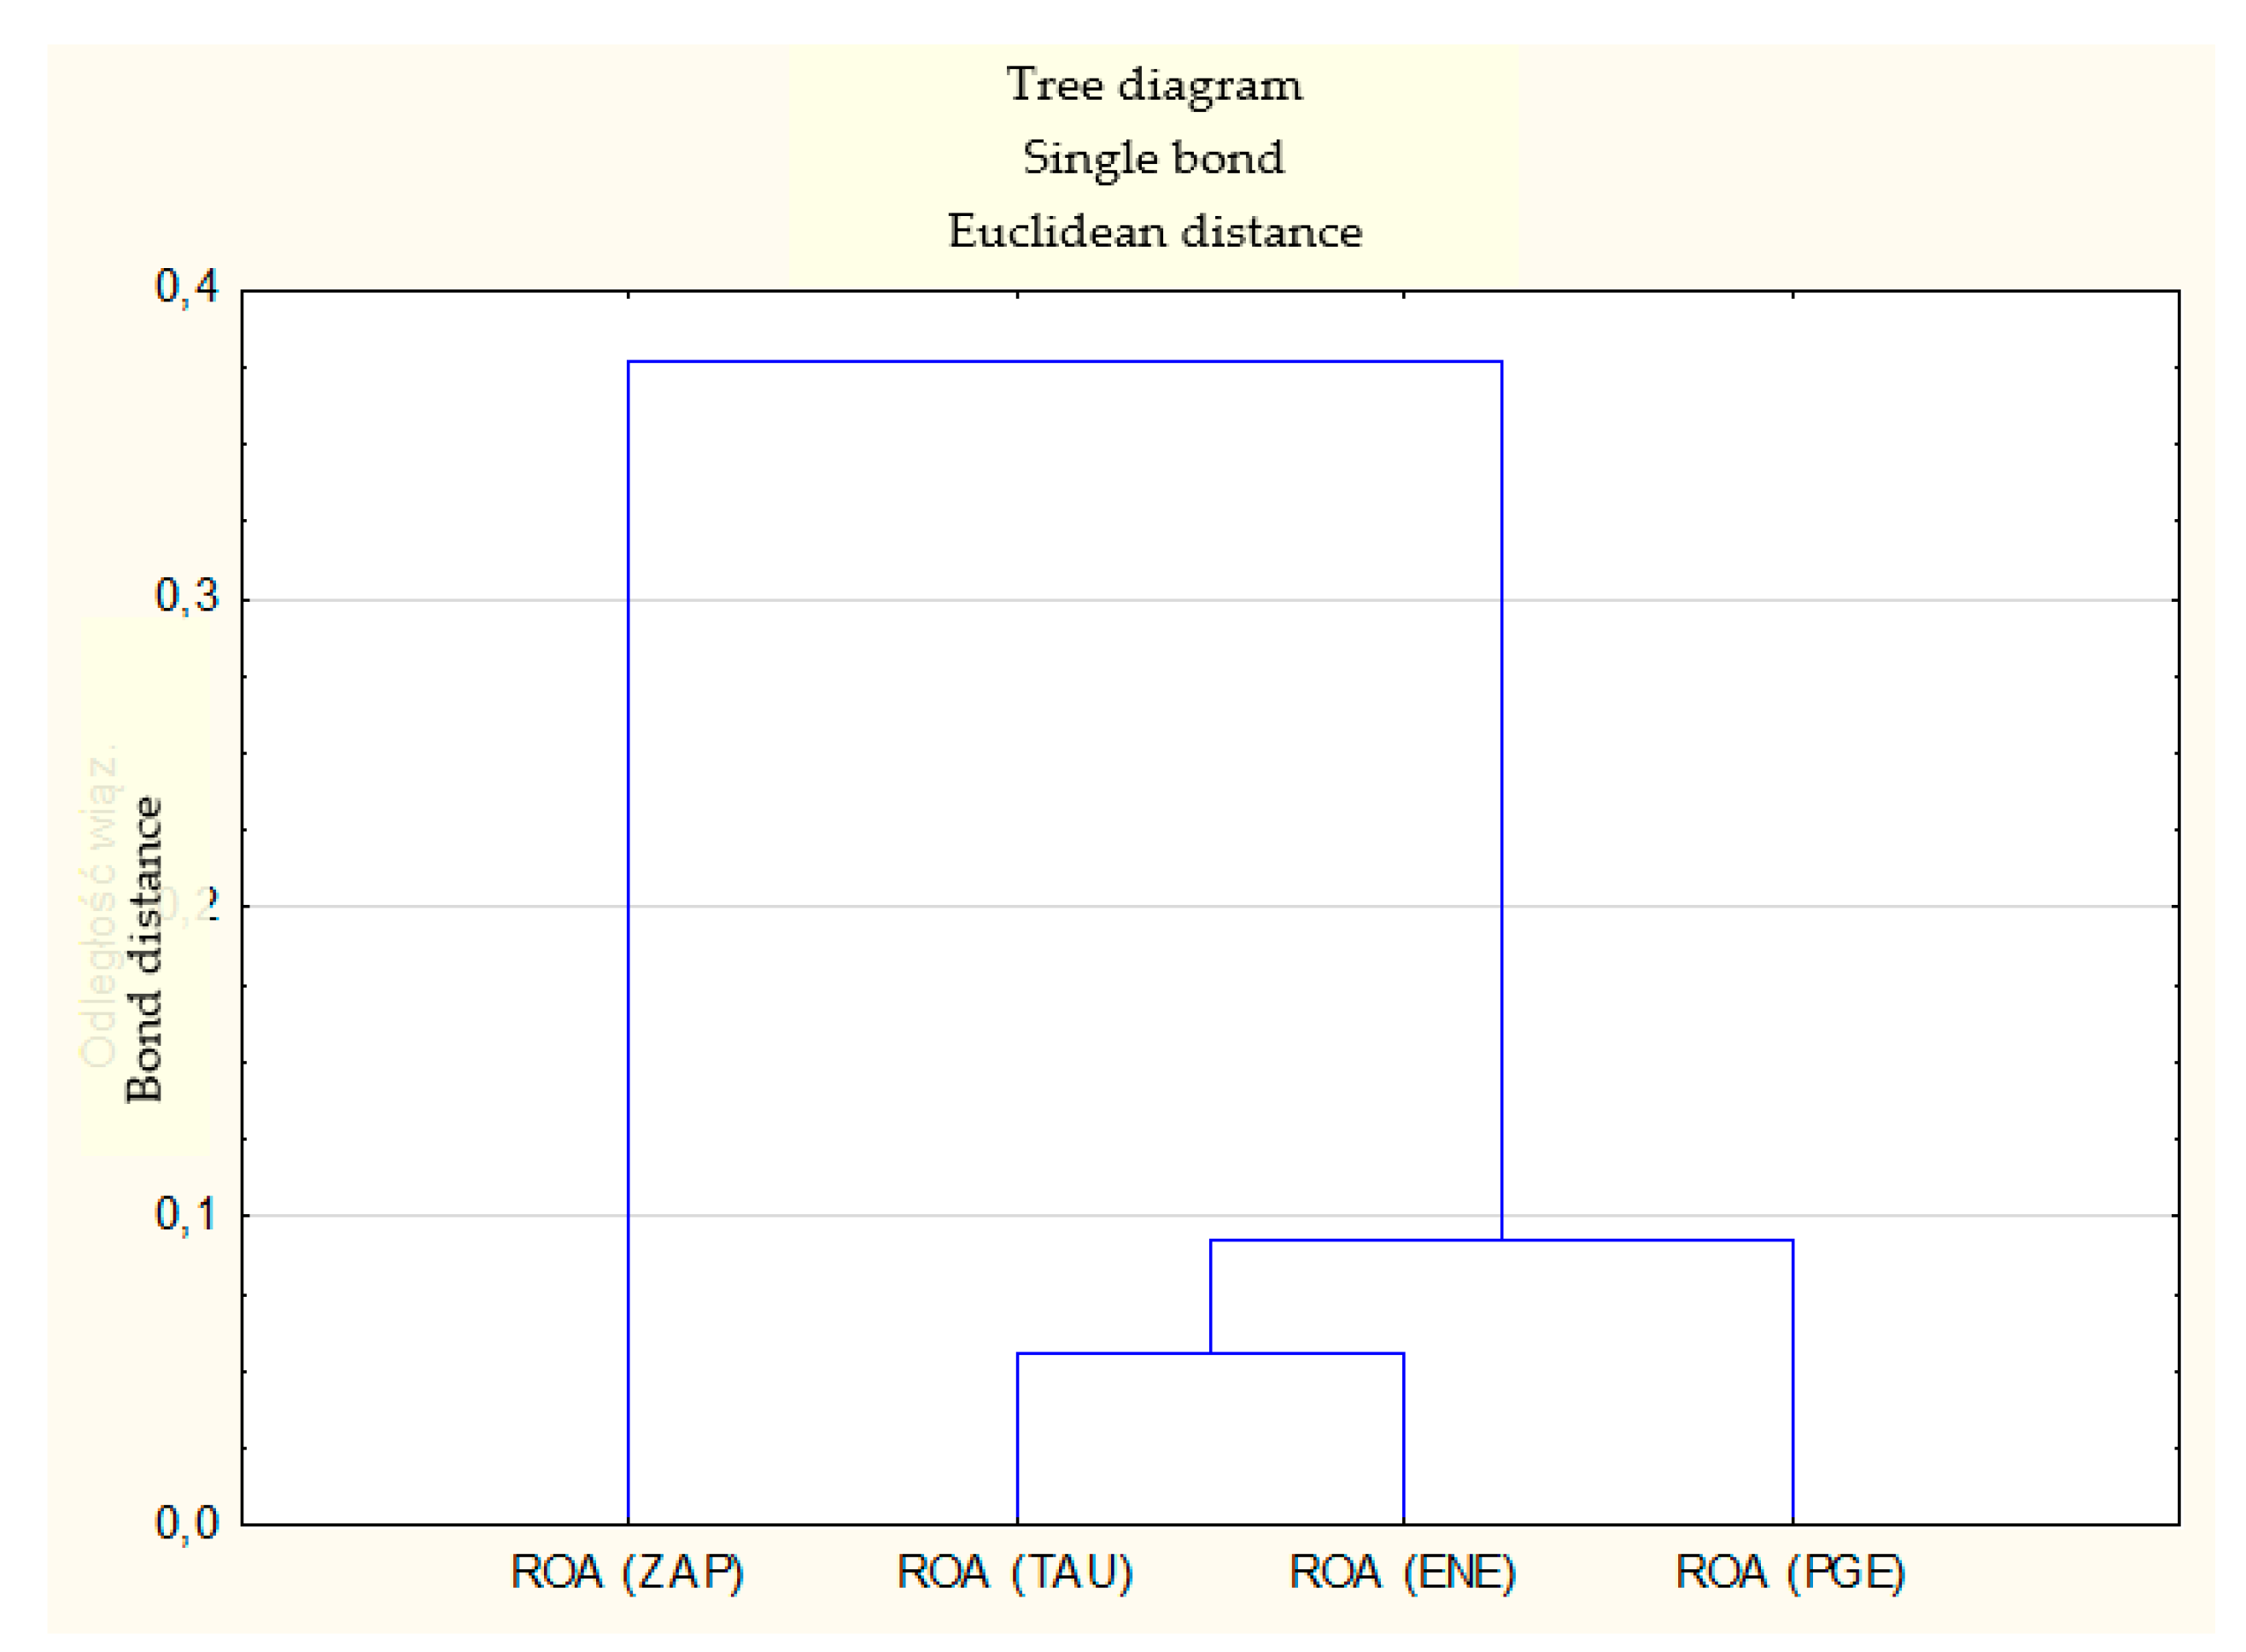
Figure 3 shows the clustering of the surveyed companies, taking into account ROA.
The companies closest to each other in terms of the ROA ratio are Enea and Tauron. Thus, the greatest similarity exists between an owned and non-owned company declaring commitment to the implementation of socially responsible activities. The ROA ratios for Zepak differ most from the rest of the analyzed companies.
To assess the stability of the achieved profitability from the perspective of ROA ratios, the analysis of the coefficients of variation and standard deviation for the analyzed ratio can be used (Table 2 and Figure 4).
Both in terms of standard deviation and the coefficient of variation, Zepak is the least stable in the comparison. It should be noted here that this company is by far the smallest in the ranking, which may be the cause of the strongest fluctuations in its ratios. Enea turned out to be the most stable. It is true that the differences in volatility in the ROA ratio of PGE and Tauron are more similar to that of Enea but are, nevertheless, much higher (in the case of the coefficients of variation, more than twice as high). This indicates a much lower ROA ratio stability in their case than in the case of Enea (belonging to the control group).
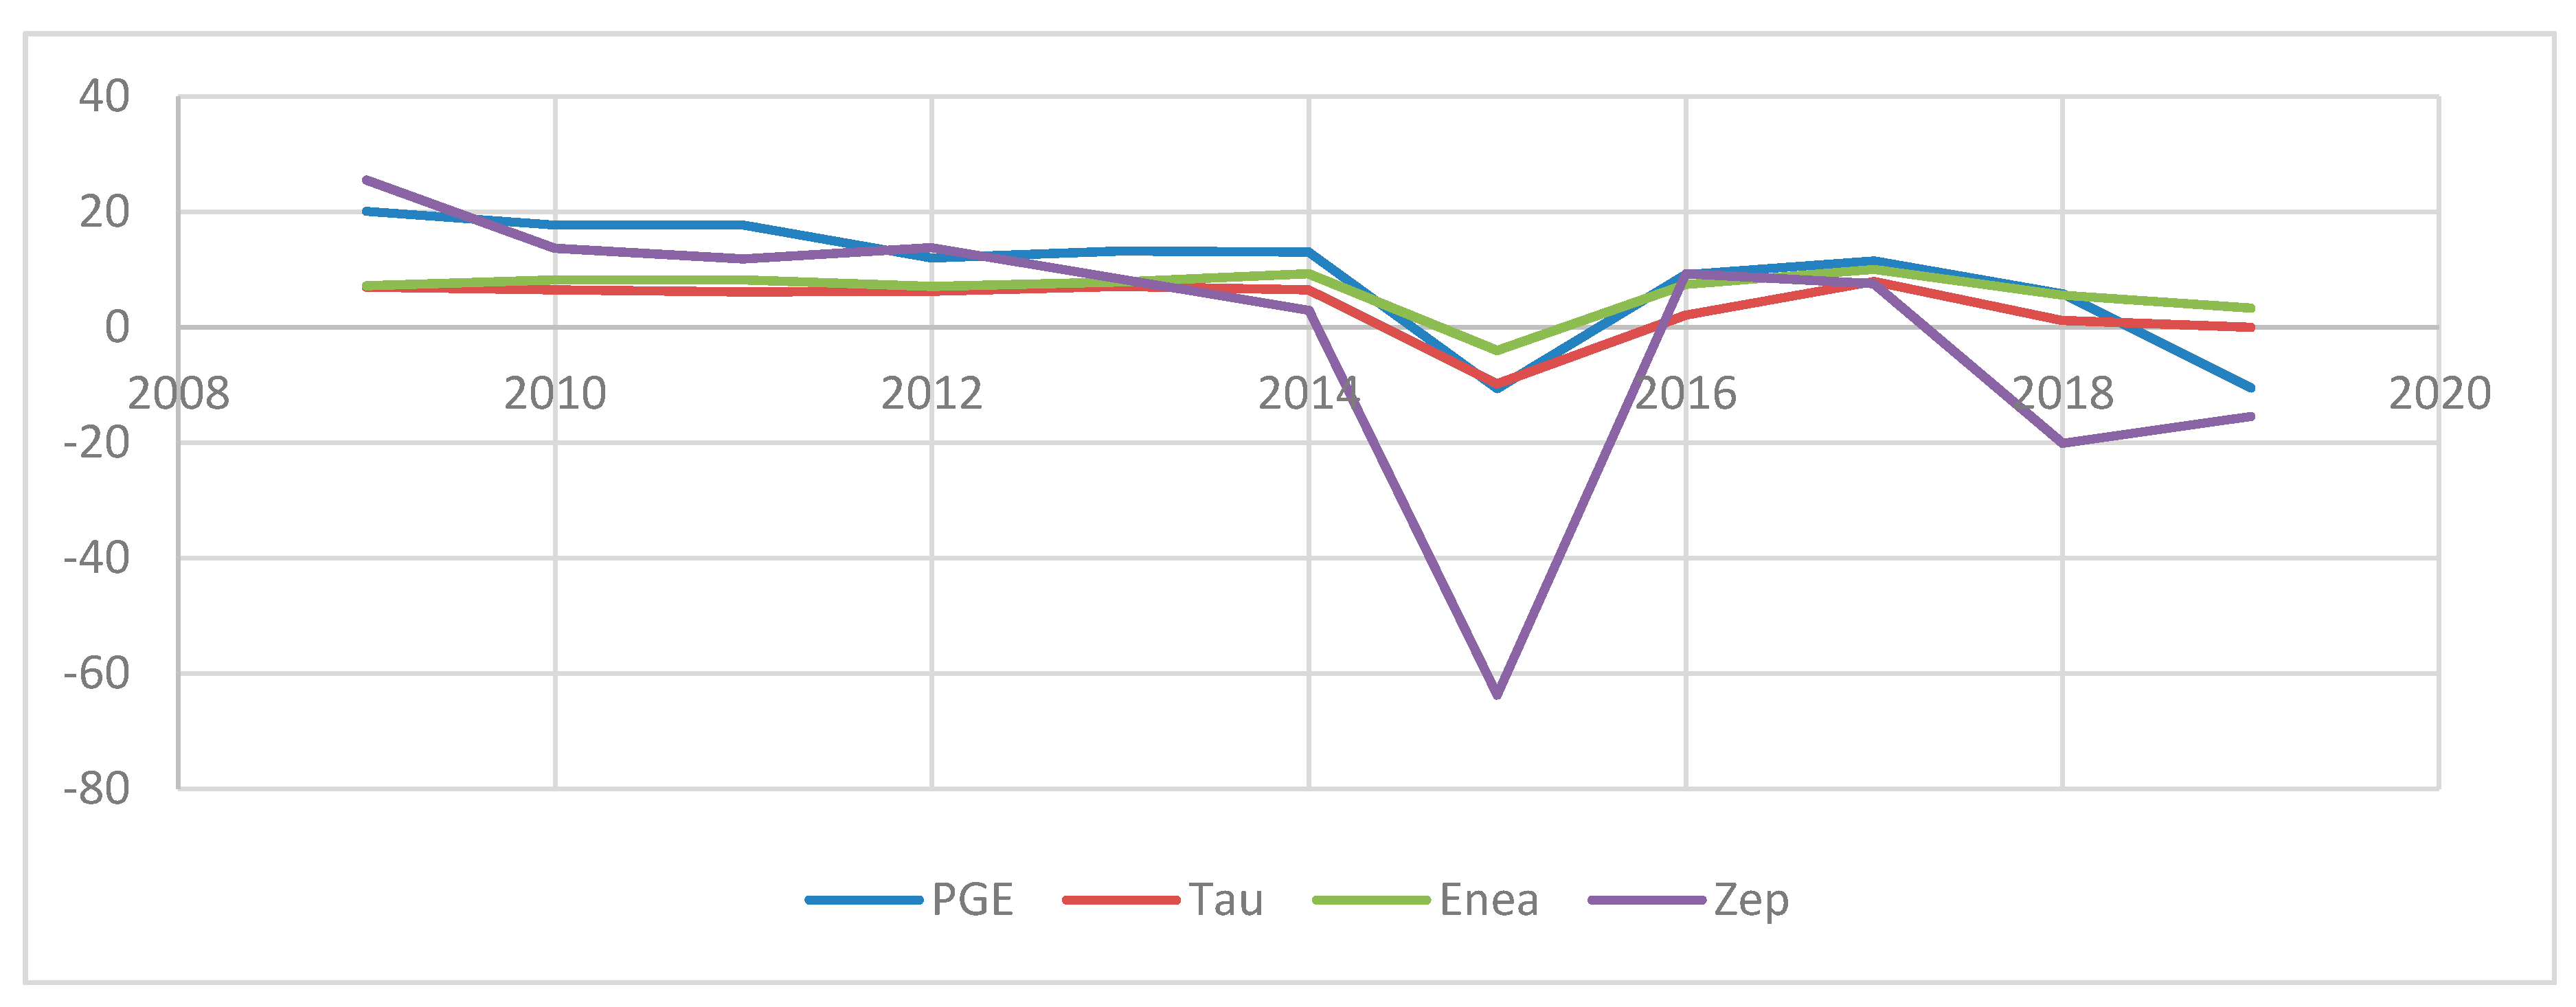
Another analyzed profitability ratio is return on equity (ROE). Detailed data on its development in the analyzed companies and the ranking list for individual years are presented in Table A2 (Appendix A). Comparing the beginning and end of the analyzed period, the changes in the hierarchy of companies are identical to the ROA ratio (Figure 5).
Zepak started from first place in the ranking, to significantly diverge in 2015, improve the ROE ratio in two consecutive years, and drop the rates at the end in 2018–2019. ROE ratios obtained by the other three companies are similar, but they improved most over time in the case of Enea. In terms of ranking, this company was in last place in the first four years, rising to the top in the last three years of the ranking.
Figure 6 shows the clustering of the surveyed companies, taking into account ROE.
As with the previous dendrogram, the ROE ratio breakdowns show a clear distinction from the rest of Zepak’s enterprises. Again, the most similar is between Enea and Tauron.
Table 3 contains the coefficients of variation and standard deviations of the analyzed index. The variability is additionally illustrated in Figure 7.
As in the previous comparison, the standard deviation and the coefficient of variation of the considered index are the lowest in the case of Enea. The return on equity ratios of PGE and Tauron, which declare themselves socially responsible, are clearly less stable. Again, the coefficients of variation in their case are more than twice as high as for Enea. The highest fluctuations in the ROE level were recorded by Zepak.
The last considered profitability ratio is ROS (Figure 8), the values of which are shown in Table A3 (Appendix A). In the case of this ratio, the changes in the hierarchy of the analyzed companies turned out to be similar to those observed in the case of the previous profitability ratios. The hierarchy at the end of the period is identical, and the difference occurred at the beginning of the period in the last two positions (the lowest ROS for 2009 was recorded by Tauron).
The improvement of the position in the ranking of the ROS ratios obtained for Enea was so much less spectacular than in the case of the two previous ratios, as Enea started from third position in 2009 and moved to the top of the ranking of the ROS ratio in 2015 and 2019. The significant deterioration of the ROS ratio in the case of the largest company in the ranking is noticeable. PGE from the leading company (ranked first or second in nine out of eleven years) dropped to third place last year, approaching the value of the ratio to the weakest company in the ranking.
Figure 9 shows the clustering of the surveyed companies, taking into account ROS.
The dendrogram illustrating the structure of the group of analyzed companies, taking into account the ROS ratio, shows the similarity of Tauron and Enea, much smaller than in the case of the two previous ratios, the similarity between them and PGE, and a very visible difference in the case of Zepak. It should be emphasized that such a hierarchical structure of the set of companies was repeated for all profitability ratios due to the decreasing similarity between them.
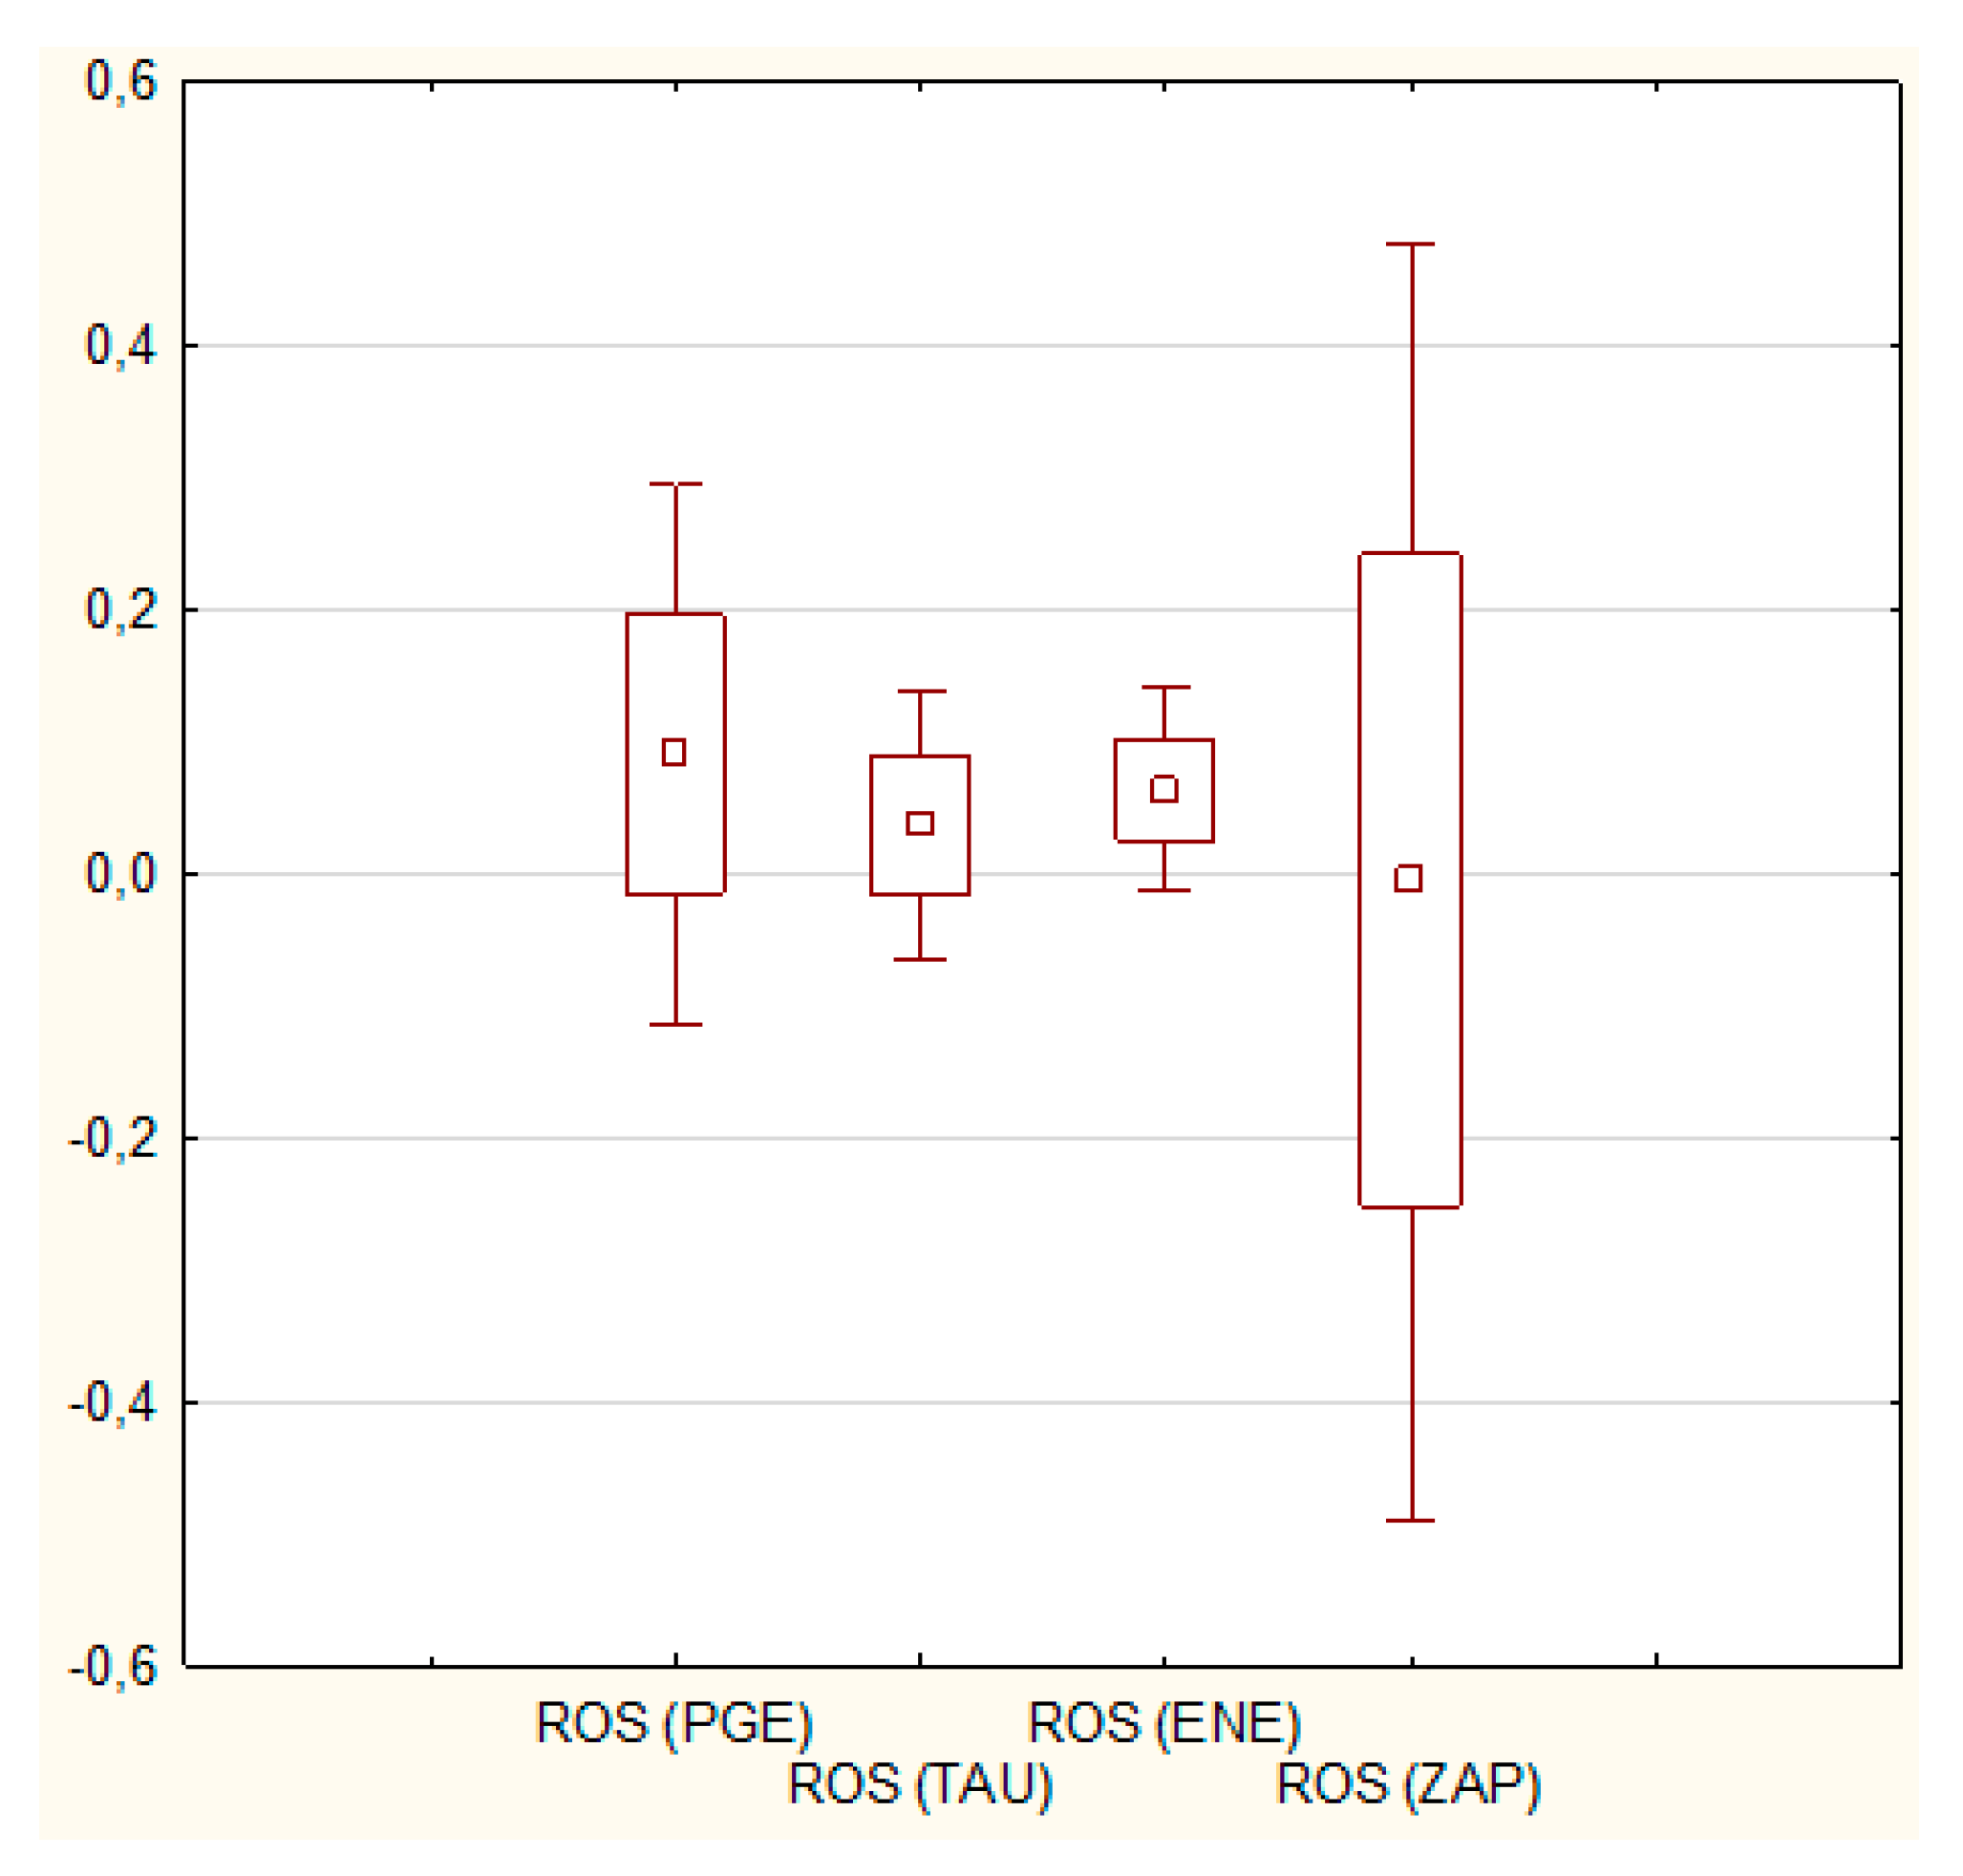
Table 4 and Figure 10 contain the coefficients of variation and standard deviations for the ROS ratio.
In the case of the ROS ratio, the relative differences in the coefficients of variation between the first three companies in the ranking are slightly smaller than in the case of the ROE ratio. Nevertheless, again, the standard deviation and the coefficient of variation are the lowest in the case of Enea, indicating its highest stability. Companies declaring themselves socially responsible record clearly higher coefficients of variation and the standard deviation of the ROS ratio. The least stable company, as in the case of the two previously analyzed profitability ratios, is Zepak.
Summing up the comparisons of profitability ratios, socially responsible companies obtained significantly better results than one of the companies not belonging to the RESPECT index; however, they allowed themselves to be outdistanced by the other from the control group. It should be noted that the main reason for the sharp drop in the profitability ratios of the weakest company Zepak in 2014 and 2015 was the high loss resulting from impairment write-offs (without this write-off, the company’s net profit in 2015 would be close to zero) (https://biznesalert.pl/ze-pak-notuje-blisko-2-mld-zl-straty, accessed on 30 April 2021).
On the one hand, the advantage of socially responsible companies over the weakest in the ranking is clearly higher than the loss in relation to the best company in the ranking. On the other hand, first place in the rankings of profitability ratios (and their stability) of the company from the control group took place in the last years of the research period (after 8–10 years of the functioning of the WIG RESPECT index), i.e., at the time when positive effects of CSR activities should appear (socially responsible companies should gain an advantage over other companies).

4.3. Level of Stock Market Quotations

A comparison of the changes in the level of quotations of the companies in question is possible in a slightly shorter period, because one of them only began to be listed on the stock market in 2012. The absolute levels of quotations at the end of the year (closing rate on the last day of the year) are shown in Table 5. The period under consideration was definitely unfavorable for the quotation level of the group of companies in question (over seven years, the best company lost almost half of its value in nominal terms).
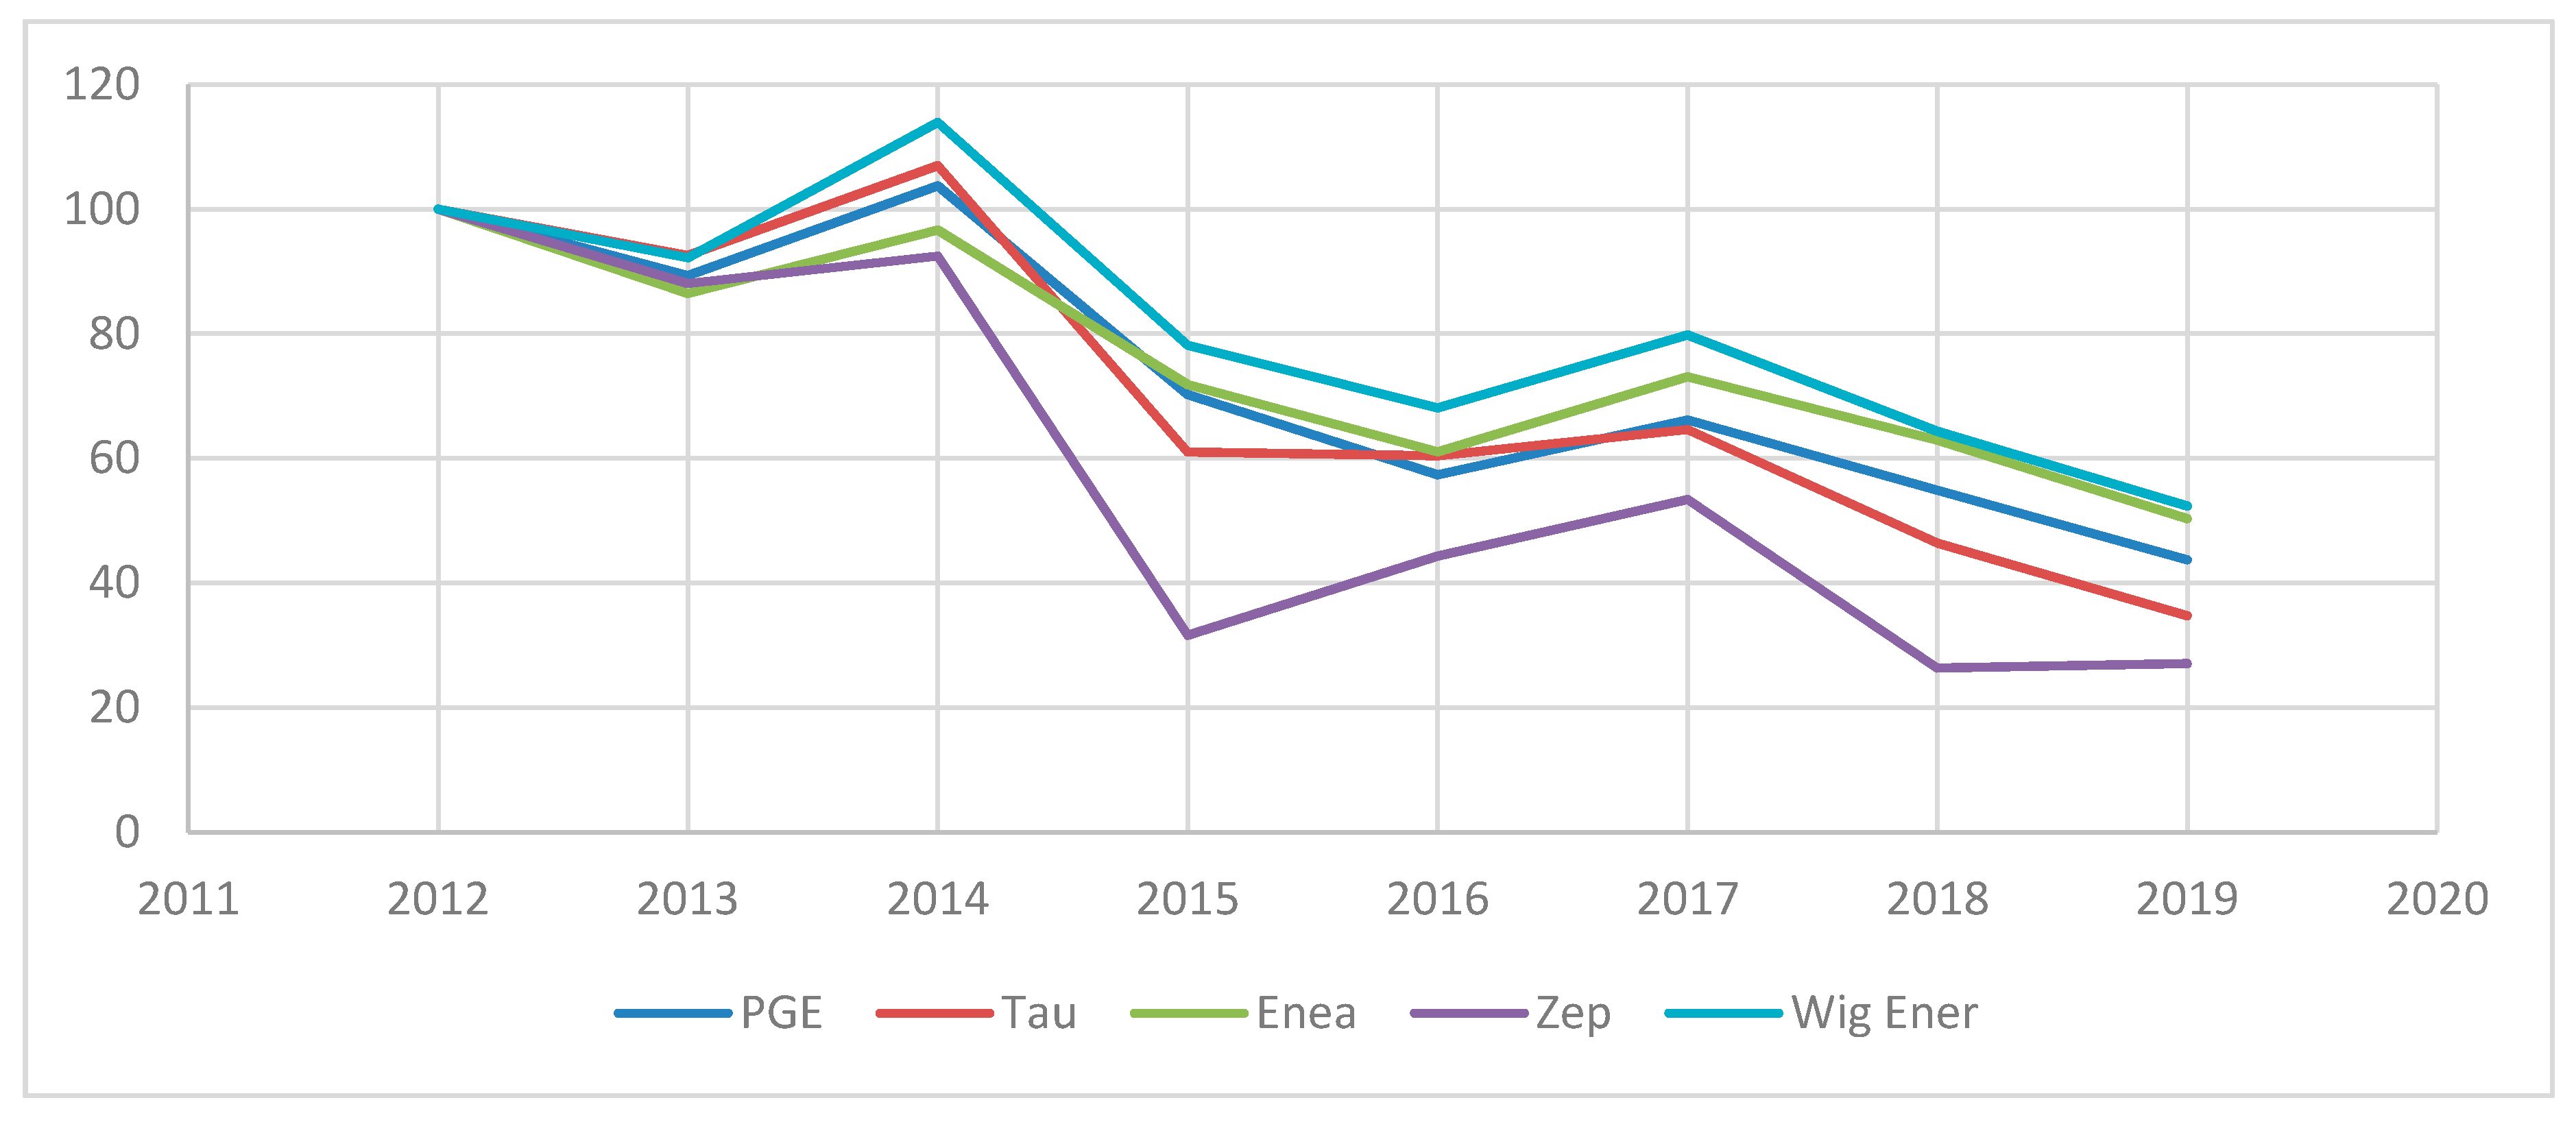
In order to obtain comparability of changes in the level of stock market quotations of the analyzed companies, the ratios of changes in their exchange rates were calculated, with the quotations from 2012 adopted as the base (Figure 11).
The performance of the entire sector (WIG Energia) remains in a clear downward trend. The rate of decline of all analyzed companies turned out to be faster than the WIG Energia index. The reason is a slightly better performance of the remaining companies contributing to the sector index, including two companies based abroad (from the Czech Republic and Lithuania) and several smaller companies (including those involved in obtaining solar energy). It should be noted that for the last two years, the quotations of the best company on the list, Enea, have come close to the sector index.
Due to the fact that the list of quotation changes covers a slightly shorter period, Figure 11 cannot be directly related to the charts characterizing changes in profitability ratios. While in the case of profitability statements, socially responsible companies recorded a much smaller distance to the leading company than the advantage in relation to the weakest company, in the case of quotation changes, the distance between subsequent companies is similar. Therefore, the summary shows that social responsibility in the case of Polish companies from the energy sector did not translate into their market valuation in the analyzed period. It should also be noted that in the event of quotation changes, the hierarchy changed, i.e., Tauron was ranked third at the end of the period, recording greater quotation drops than PGE.
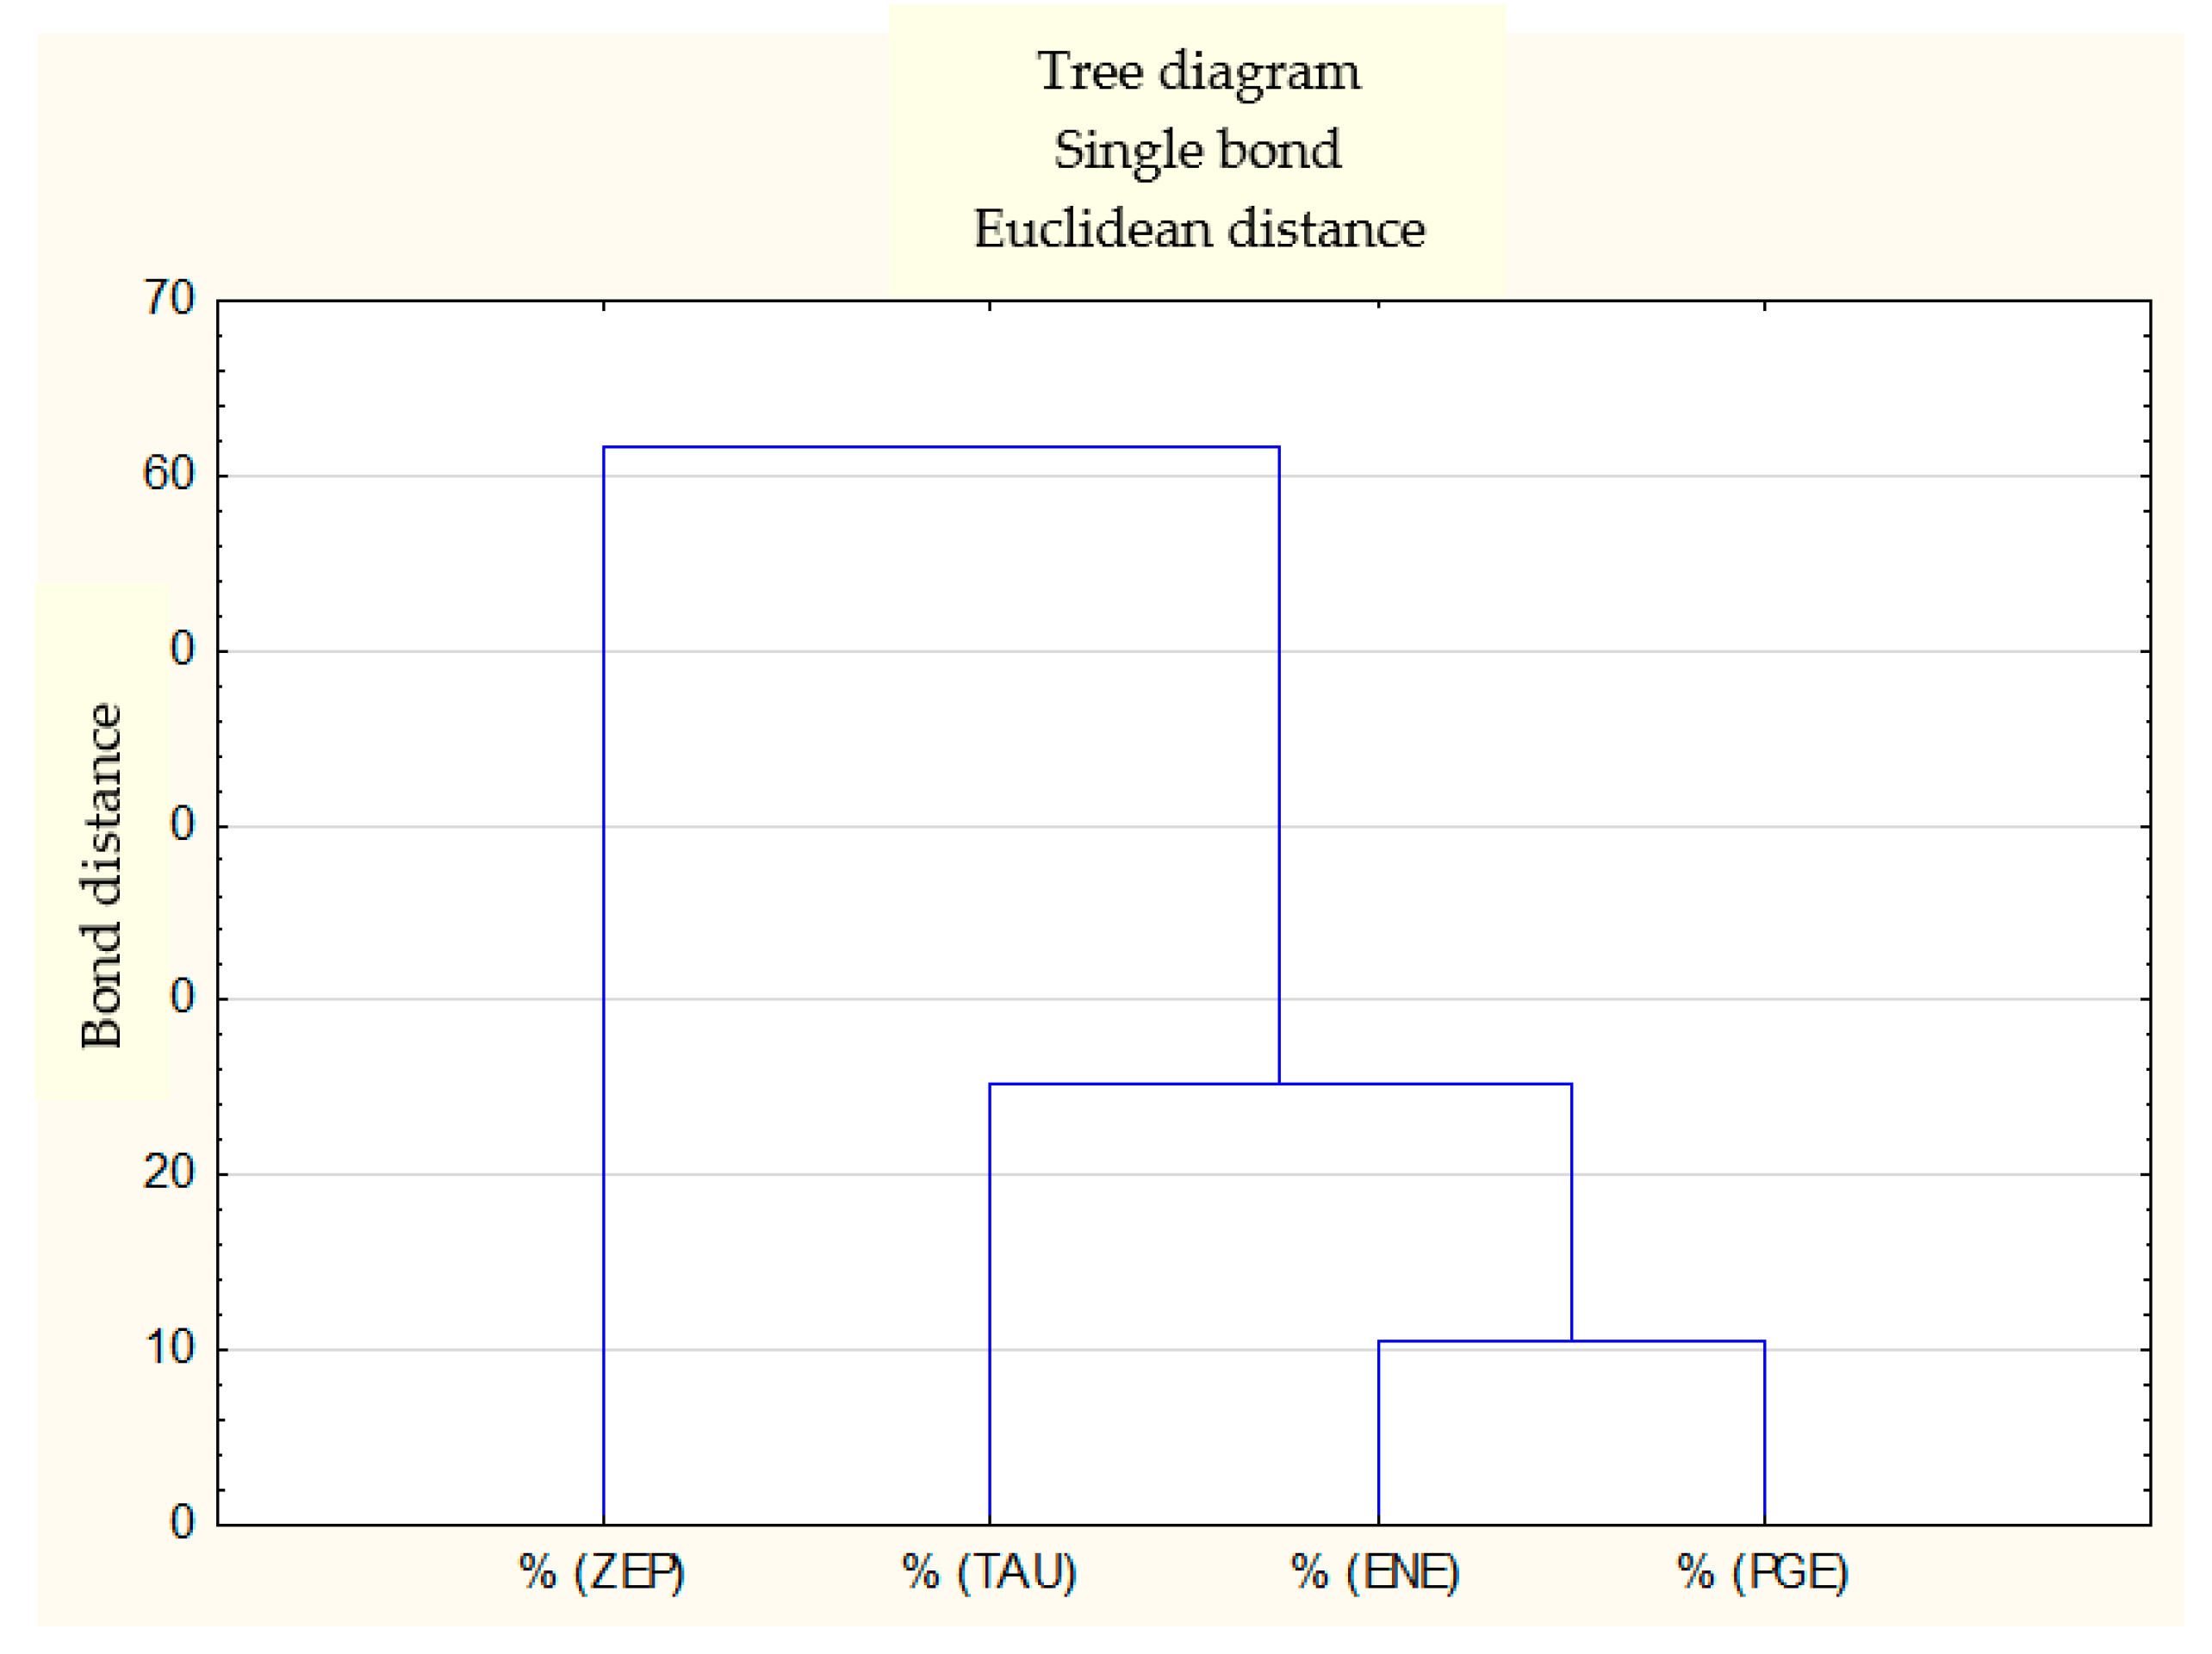
Figure 12 shows the clustering of the surveyed companies from the perspective of changes in their stock market valuation.
The companies closest to each other in terms of changes in the level of quotations are Enea and PGE. Tauron’s much lower resemblance to the above results primarily from the relatively highest drop in valuation in the last two years covered by the analysis. The changes in the level of Zepak’s quotations differ most from the rest of the analyzed companies.
Table 6 contains the coefficients of variation and the standard deviation of the quotation level of the analyzed companies. Additionally, the variability is illustrated in Figure 13.
In the case of stock market quotations, the standard deviation and coefficient of variation are closer to each other than in the case of the previously analyzed profitability ratios, which is partly due to the shorter period of the analysis. However, it should be emphasized that the hierarchy from the perspective of stability has remained the same in this case—the most stable are the quotations of Enea, the second most stable company is PGE, and in last place is, once again, Zepak.

5. Discussion

The main conclusion of the article is the lack of a relationship between undertaking CSR activities and profitability, the level of stock market quotations and their stability in the Polish energy sector. The best results (the highest profitability ratios, the lowest level of loss of market value, accompanied by the highest stability of profitability and stock market valuation) were achieved by a company that did not declare social responsibility. It is true that the second of the companies from the control group was at the other extreme, but the fact that two companies in the WIG RESPECT were ranked second and third in all sections indicates that CSR activities do not translate into profitability and stock market valuation of Polish energy companies.
The contribution of the article to existing literature is the repetition of the research on the translation of CSR activities into the performances of enterprises. The presented summaries indicate that CSR activities may have a neutral or insignificant impact on the financial results and stock exchange quotations of companies, which is consistent with the results of some studies [86,87,88], and contradictory with the summaries of meta-analyses. This situation is a result of the specific conditions of the operation of the energy sector in Poland, which influenced the profitability and quotation levels of the analyzed companies to a greater extent than social responsibility. The obtained results support the dependence of the effectiveness of CSR activities on the sector indicated by some authors [41,42].
The fact that the results achieved by the companies cannot be compared without taking into account their sectoral affiliation is indicated by a very large drop in the quotations of energy companies in Poland during the growth of the entire market. The deepening of the decline in the sector’s quotations in the last five years of the analysis was caused by the losses it recorded in 2015, and in subsequent years by a slowdown in changes to the EU climate policy after 2015 [65,104]. A serious threat from the perspective of stock market investors is the expected loss of value of ‘coal’ assets in the sector. An example of shock changes is the loss recorded by Zepak in 2015, resulting from impairment write-offs. As a result of the write-off, its assets decreased by 27.6% and equity by 50.7% each year.
Differences in the valuation of companies within the sector can be related to the level of their profitability. The company with the lowest quotation drop is Enea, which has the highest profitability ratios. Definitely Zepak’s worst quotation, apart from the lowest profitability, was also influenced by the fact that it groups three power plants that generate energy from lignite, and it is not possible to obtain income from distribution (the remaining three analyzed companies are also the main distributors of electricity in Poland).
Moving on to the discussion and determination of further directions of research, one of the explanations for the lack of impact of CSR on the profitability and quotation levels of Polish energy companies may be the scope and direction of the actions taken. Being part of the energy sector, companies not belonging to the WIG RESPECT index were also forced to undertake CSR activities, for example for regulatory reasons (regulations introduced by the state and the European Union). Therefore, it is necessary to verify to what extent individual companies exceed the minimum standards of social responsibility imposed by law. Perhaps in the energy sector, companies declaring corporate social responsibility as part of a business strategy do not differ much in their CSR activities from companies refraining from such declarations. Initiatives undertaken by socially responsible companies may also be focused on activities that translate to a small extent into the possibilities of returning the expenditure incurred on them. From this perspective, the direction of further research is to determine the nature of CSR activities undertaken in the Polish energy sector, to estimate their costs and effects, which could explain the lack of a relationship between corporate social responsibility and financial results of companies. The greenwashing phenomenon may also explain the lack of a relationship between the scale of the declared CSR activities and the results of companies. It is true that research does not indicate the occurrence of this phenomenon in the energy sector [47]; nevertheless, it is worth checking its possible scale in Polish energy companies. Such research requires the preparation of an appropriate research tool and the inclusion of both managers and stakeholders of energy companies.
The article indicates the specificity of the Polish electricity production sector based on coal, which will be abandoned in the Polish energy sector in the perspective of twenty rather than ten years [66]. The specificity resulting from the national context is a limitation for generalizations, therefore it is difficult to suggest that CSR activities will prove to be equally insignificant for the profitability of energy enterprises in other countries. The results of the research may constitute a certain point of reference for energy companies, which, similarly to those analyzed in the article, mainly base the acquisition of electricity on coal combustion. However, it should be emphasized at this point that the analysis only covers four companies producing electricity. As they are suppliers of over 70% of electricity produced, they reflect the situation of the energy sector in Poland well, having a limited value in international comparisons.

6. Conclusions

In the case of the Polish energy sector, the expectations that the declaration of compliance with CSR rules will translate into an improvement in the level and stability of profitability and stock market quotations of companies are not confirmed. In the case of this sector, changes in the strategic conditions of its functioning play a more important role than social responsibility. Regulations introduced at the EU level entail the need to decarbonize the sector, which is a response to the expected permanent loss of competitiveness of the coal-based energy sector. The direct cause of the loss of competitiveness in obtaining energy from non-renewable sources are regulations reducing the limits of ‘free’ CO2 emissions and the mechanism of increasing the prices of emission allowances, exacerbated by the speculative increase in their prices.
The energy sector in Poland, which is the most dependent on coal among EU countries, must focus on successively changing energy sources. On the one hand, this will entail serious investment challenges, and on the other hand, the loss of some of the assets decommissioned. The necessary new investments will entail very high costs, which will be difficult to cover with the funds generated by the companies themselves (taking into account the level of profitability they obtain).
Apart from spreading the transformation process (over decades rather than years), an appropriate adaptation policy is needed, supported by national and European funds. A great opportunity for the analyzed sector will be transfers of EU funds under the Reconstruction Fund created to stimulate the economies of the Member States after the crisis caused by the pandemic, and especially in its part concerning the Just Transition scheme. The transformational effect will depend on the scale of support. Taking into account the condition of the Polish energy sector (dependence on coal, insufficient production from the perspective of the economy’s needs, resulting in an increase in electricity imports), its transformation should be among the priority objectives.
From the perspective of the possibility of accelerating the transformation of the energy sector with the support of EU funds and domestic funds, it is worth emphasizing the change in the narrative of the Polish government, which indicates that it is trying to catch up with the implementation of the EU climate policy.

Author Contributions

M.Z.: Conception and research; I.J.-K.: Literature studies, description, and conclusions. Both authors have read and agreed to the published version of the manuscript.

Funding

This research was funded by Silesian University of Technology, Poland, grant number 13/010/BK_21/0057.

Institutional Review Board Statement

Not applicable.

Informed Consent Statement

Not applicable.

Data Availability Statement

Conflicts of Interest

The authors declare no conflict of interest.

Appendix A

Table A1. ROA (%) ratios and the position of companies in the ranking in the years 2009–2019.
CompanyYears
20092010201120122013201420152016201720182019
PGE7.977.058.466.436.485.52−4.953.813.691.97−5.10
Tau4.284.234.444.934.163.43−5.631.113.860.56−0.03
Enea4.204.985.604.844.385.02−1.743.464.112.401.65
Zep13.266.485.955.983.581.14−37.795.214.12−11.98−14.31
Place in the ranking in a given year
PGE21111122423
Tau34433334332
Enea43242213211
Zep12324441144
Source: Own calculations based on: https://www.biznesradar.pl/notowania-historyczne (accessed on 30 April 2021).
Table A2. ROE (%) ratios and the position of companies in the ranking in the years 2009–2019.
CompanyYears
20092010201120122013201420152016201720182019
PGE13.929.7812.208.959.128.17−7.536.025.893.21−9.37
Tau8.006.748.119.497.776.60−11.262.227.671.13−0.06
Enea5.496.497.586.526.247.57−3.526.978.915.103.74
Zep26.5611.429.8110.616.122.05−99.7311.688.11−27.54−38.00
Place in the ranking in a given year
PGE22131123423
Tau33322334332
Enea44443212111
Zep11214441244
Source: Own calculations based on: https://www.biznesradar.pl/notowania-historyczne (accessed on 30 April 2021).
Table A3. ROS (%) ratios and the position of companies in the ranking in the years 2009–2019.
CompanyYears
20092010201120122013201420152016201720182019
PGE20.0617.7117.6911.9613.1713.00−10.649.1411.525.77−10.53
Tau6.926.436.106.237.046.43−9.822.107.941.14−0.06
Enea7.188.168.167.057.829.22−4.057.379.995.563.30
Zep25.4813.6811.7913.798.382.93−63.779.257.51−20.12−15.50
Place in the ranking in a given year
PGE21121132113
Tau44444324332
Enea33333213221
Zep12212441444
Source: Own calculations based on: https://www.biznesradar.pl/notowania-historyczne (accessed on 30 April 2021).

References

  1. Fifka, M.S. Towards a more business-oriented definitions of Corporate Social Responsibility: Discussing the core controversies of a well-established concept. J. Serv. Sci. Manag. 2009, 2, 312–321. [Google Scholar] [CrossRef] [Green Version]
  2. Silva, P.; Cooray, R. Building human capital in organizations through Corporate Social Responsibility—A holistic coaching approach. Procedia Soc. Behav. Sci. 2014, 159, 753–758. [Google Scholar] [CrossRef] [Green Version]
  3. Kochanek, E. The energy transition in the Visegrad group countries. Energies 2021, 14, 2212. [Google Scholar] [CrossRef]
  4. Smith, R.E. Defining Corporate Social Responsibility: A System Approach for Socially Responsible Capitalism. Master’s Thesis, University of Pennsylvania, Philadelphia, PA, USA, 2011. [Google Scholar]
  5. Bowen, H.R. Social Responsibilities of the Businessman; Harper & Brotjers: New York, NY, USA, 1953. [Google Scholar]
  6. Friedman, M. The Social Responsibility of Business is to Increase Its Profits. The New York Times Magazine, 13 September 1970. [Google Scholar]
  7. Henderson, P.D. Misguided Virtue: False Notions of Corporate Social Responsibility; Institute of Economic Affairs: London, UK, 2001. [Google Scholar]
  8. Aupperle, K.E.; Carroll, A.B.; Hatfield, J.D. An empirical examination of the relationship between corporate social responsibility and profitability. Acad. Manag. J. 1985, 28, 446–463. [Google Scholar] [CrossRef]
  9. Balabanis, G.; Phillips, H.C.; Lyall, J. Corporate social responsibility and economic performance in the top British companies, are they linked? Eur. Bus. Rev. 1998, 98, 25–44. [Google Scholar] [CrossRef] [Green Version]
  10. Saridakis, C.; Angelidou, S.; Woodside, A.G. What type of CSR engagement suits my firm best? Evidence from an abductively-derived typology. J. Bus. Res. 2020, 108, 174–187. [Google Scholar] [CrossRef]
  11. Maignan, I.; Ferrell, O.C. Antecedents and benefits of corporate citizenship: An investigation of French businesses. J. Bus. Res. 2001, 51, 37–51. [Google Scholar] [CrossRef]
  12. Matten, D.; Crane, A. Corporate citizenship: Towards and extended theoretical conceptualization. Acad. Manag. Rev. 2005, 30, 166–179. [Google Scholar] [CrossRef] [Green Version]
  13. Gössling, T.; Vocht, C. Social role conceptions and CSR policy success. J. Bus. Ethics 2007, 74, 363–372. [Google Scholar] [CrossRef] [Green Version]
  14. Pollach, I. Online privacy as a corporate social responsibility: An empirical study. Bus. Ethics A Eur. Rev. 2011, 20, 88–102. [Google Scholar] [CrossRef]
  15. Glavas, A.; Kelley, K. The effects of perceived Corporate Social Responsibility on employee attitudes. Bus. Ethics Q. 2014, 24, 165–202. [Google Scholar] [CrossRef]
  16. Werther, W.B.; Chandler, D. Strategic corporate social responsibility as global brand insurance. Bus. Horiz. 2005, 48, 317–324. [Google Scholar] [CrossRef]
  17. Porter, M.E.; Kramer, M.R. Strategy and Society. Harv. Bus. Rev. 2006, 84, 78–92. Available online: https://hbr.org/2006/12/strategy-and-society-the-link-between-competitive-advantage-and-corporate-social-responsibility (accessed on 30 April 2021).
  18. Latapi Agudelo, M.A.; Jóhannsdóttir, L.; Davidsdóttir, B. A literature review of the history and evolution of corporate social responsibility. Int. J. Corp. Soc. Responsib. 2019, 4, 1–23. [Google Scholar] [CrossRef] [Green Version]
  19. Porter, M.E.; Kramer, M.R. Creating Shared Value. Harv. Bus. Rev. 2011, 89, 62–77. Available online: https://hbr.org/2011/01/the-big-idea-creating-shared-value (accessed on 30 April 2021).
  20. Engizek, N.; Yasin, B. How CSR and overall service quality lead to affective commitment: Mediating role of company reputation. Soc. Responsib. J. 2017, 13, 111–125. [Google Scholar] [CrossRef]
  21. Esken, B.; Franco-Garcia, M.D.; Fischer, P.A.M. CSR perception as a signpost for circular economy. Manag. Res. Rev. 2018, 41, 586–604. [Google Scholar] [CrossRef]
  22. Jeffrey, S.; Rosenberg, S.; McCabe, B. Corporate social responsibility behaviors and corporate reputation. Soc. Responsib. J. 2019, 15, 395–408. [Google Scholar] [CrossRef]
  23. McWilliams, A.; Siegel, D. Event studies in management research: Theoretical and empirical issues. Acad. Manag. J. 1997, 40, 626–657. [Google Scholar] [CrossRef]
  24. Jones, T.M.; Felps, W. Stakeholder wealth maximization and social welfare: A utilitarian critique. Bus. Ethics Q. 2013, 23, 207–238. [Google Scholar] [CrossRef] [Green Version]
  25. Goodman, J.; Arenas, D. Engaging ethically: A discourse ethics perspective on social shareholder engagement. Bus. Ethics Q. 2015, 25, 163–189. [Google Scholar] [CrossRef] [Green Version]
  26. Wagner-Tsukamoto, S.A. In search of ethics: From Carroll to integrative CSR economics. Soc. Responsib. J. 2019, 15, 469–491. [Google Scholar] [CrossRef]
  27. Lantos, G.P. The boundaries of strategic corporate social responsibility. J. Consum. Mark. 2001, 18, 595–632. [Google Scholar] [CrossRef]
  28. McWilliams, A.; Siegel, D. Corporate social responsibility: A theory of the firm perspective. Acad. Manag. Rev. 2001, 26, 117–127. [Google Scholar] [CrossRef]
  29. Freeman, R.E.; Harrison, J.S.; Wicks, A.C.; Parmar, B.L.; De Colle, S. Stakeholder Theory: The State of the Art; Cambridge University Press: Cambridge, UK, 2010; pp. 1–61. [Google Scholar]
  30. Hubbard, G. Measuring organizational performance: Beyond the Triple Bottom Line. Bus. Strategy Environ. 2009, 18, 177–191. [Google Scholar] [CrossRef]
  31. Madsen, P.M.; Bingham, J.B. A stakeholder—Human capital perspective on the link. In Economics: Principles, Problems, and Policies; McConnell, C.R., Ed.; McGraw-Hill: New York, NY, USA; St. Luis, MI, USA, 1984. [Google Scholar]
  32. Carroll, A.B. Corporate Social Responsibility—Evolution of definitional construct. Bus. Soc. 1999, 38, 268–295. [Google Scholar] [CrossRef]
  33. Blair, M.M. Of corporation, courts, personhood, and morality. Bus. Ethics Q. 2015, 25, 415–431. [Google Scholar] [CrossRef]
  34. Dahlsrud, A. How Corporate Social Responsibility is defined: An analysis of 37 definitions. Corp. Soc. Responsib. Environ. Manag. 2008, 15, 1–3. [Google Scholar] [CrossRef]
  35. Lin, Y.-C.; Fadliansyah, R.; Lin, T.-C. The relationship and development trend of corporate social responsibility (CSR) literature. Utilizing bibliographic coupling analysis and social network analysis. Manag. Decis. 2020, 58, 601–624. [Google Scholar] [CrossRef]
  36. Mishra, P.; Schmidt, G.B. How can leaders of multinational organizations be ethical by contributing to corporate social responsibility initiatives? Guidelines and pitfalls for leaders trying to do good. Bus. Horiz. 2018, 61, 833–843. [Google Scholar] [CrossRef]
  37. Marcus, A.G.; Fremeth, A.R. Green management matters regardless. Acad. Manag. Perspect. 2009, 23, 17–26. [Google Scholar] [CrossRef] [Green Version]
  38. Van Marrewijk, M. Concept and definitions of CSR and corporate sustainability: Between agency and communion. J. Bus. Ethics 2003, 44, 95–105. [Google Scholar] [CrossRef]
  39. Hsueh, C.-F. Improving corporate social responsibility in a supply chain through a new revenue sharing contract. Int. J. Prod. Econ. 2014, 151, 214–222. [Google Scholar] [CrossRef]
  40. Saeidi, S.P.; Sofian, S.; Saeidi, P.; Saeidi, S.P.; Saaeidi, S.A. How does corporate social responsibility contribute to firm financial performance? The mediating role of competitive advantage, reputation, and customer satisfaction. J. Bus. Res. 2015, 68, 341–350. [Google Scholar] [CrossRef]
  41. Melo, T.; Garrido-Morgado, A. Corporate reputation: A combination of social responsibility and industry. Corp. Soc. Responsib. Environ. Manag. 2012, 19, 11–31. [Google Scholar] [CrossRef]
  42. Khan, M.; Serafeim, G.; Yoon, A. Corporate sustainability: First evidence on materiality. Account. Rev. 2016, 91, 1697–1724. [Google Scholar] [CrossRef] [Green Version]
  43. Palmer, H.J. Corporate Social Responsibility and Financial Performance: Does It Pay to be Good? Licentiate Thesis, Cleramont McKenna College, Claremont, CA, USA, 2012. Available online: http://scholarship.claremont.edu/cmc_theses/529 (accessed on 30 April 2021).
  44. van der Berg, M.; Neumann, K.; van Vuuren, D.P.; Bouwman, A.F.; Kram, T.; Bakkes, J. Exploring resource efficiency for energy, land and phosphorus use: Implications for resource scarcity and the global environment. Glob. Environ. Chang. 2016, 36, 21–34. [Google Scholar] [CrossRef] [Green Version]
  45. Kerckhoffs, T.; Wilde-Ramsing, J. European Works Councils and Corporate Social Responsibility in the European Energy Sector; SINTEF Energy Research: Trondheim, Norway, 2010; pp. 1–61. [Google Scholar]
  46. Stjepcevic, J.; Siksnelyte, I. Corporate Social Responsibility in Energy Sector. Transform. Bus. Econ. 2017, 16, 21–33. [Google Scholar]
  47. Karaman, A.S.; Orazalin, N.; Uyar, A. Shahbaz, M. CSR achievement, reporting, and assurance in the energy sector: Does economic development matter? Energy Policy 2021, 149, 112007. [Google Scholar] [CrossRef]
  48. Wilde-Ramsing, J. Quality Kilowatts: A Normative-Empirical Approach to the Challenge of Defining and Providing Sustainable Electricity in Developing Countries; SINTEF Energy Research: Trondheim, Norway, 2009; pp. 1–97. [Google Scholar]
  49. Fukuda, K.; Ouchida, Y. Corporate social responsibility (CSR) and the environment: Does CSR increase emissions? Energy Econ. 2020, 92, 1–10. [Google Scholar] [CrossRef]
  50. Shahbaz, M.; Karaman, A.S.; Kilic, M.; Uyar, A. Board attributes, CSR engagement, and corporate performance: What is the nexus in the energy sector? Energy Policy 2020, 143, 111582. [Google Scholar] [CrossRef]
  51. Saeed, A.; Noreen, U.; Azam, A.; Sohail Tahir, M. Does CSR Governance Improve Social Sustainability and Reduce the Carbon Footprint: International Evidence from the Energy Sector. Sustainability 2021, 13, 3596. [Google Scholar] [CrossRef]
  52. Clarkson, P.M.; Li, Y.; Richardson, G.D.; Vasvari, F.P. Revisiting the relation between environmental performance and environmental disclosure: An empirical analysis. Account. Organ. Soc. 2008, 33, 303–327. [Google Scholar] [CrossRef]
  53. Mapelli, F.; Arena, M.; Azzone, G. What drivers determine CSR strategies in the energy industry? Evidence from Italy. In Proceedings of the European Conference on Sustainability, Energy & the Environment 2016, Official Conference Proceedings, Brighton, UK, 7–10 July 2016. [Google Scholar]
  54. Wu, C.-M.; Hu, J.-L. Can CSR reduce stock price crash risk? Evidence from China’s energy industry. Energy Policy 2019, 128, 505–518. [Google Scholar] [CrossRef]
  55. Dangerman, A.T.; Schellnhuber, H.J. Energy systems transformation. Proc. Natl. Acad. Sci. USA 2013, 110, 549–558. [Google Scholar] [CrossRef] [PubMed] [Green Version]
  56. Van den Bergh, J.C.J.M. Policies to enhance economic feasibility of a sustainable energy transition. Proc. Natl. Acad. Sci. USA 2013, 110, 2436–2437. [Google Scholar] [CrossRef] [Green Version]
  57. Chodakowska, E.; Nazarko, J. Assessing the performance of sustainable development goals of EU countries: Hard and soft data integration. Energies 2020, 13, 3439. [Google Scholar] [CrossRef]
  58. Capros, P.; Paroussos, L.; Fragkos, P.; Tsani, S.; Boitier, B.; Wagner, F.; Busch, S.; Resch, G.; Blesl, M.; Bollen, J. Description of models and scenarios used to assess European decarbonisation pathways. Energy Strategy Rev. 2014, 2, 220–230. [Google Scholar] [CrossRef]
  59. Ciesielska-Maciągowska, D.; Klimczak, D.; Skrzek-Lubasińska, M. Central and Eastern European CO2 market—challenges of emissions trading for energy companies. Energies 2021, 14, 1051. [Google Scholar] [CrossRef]
  60. Gerbaulet, C.; von Hirschhausen, C.; Kemfert, C.; Lorenz, C.; Oei, P.Y. European electricity sector decarbonization under different levels of foresight. Renew. Energy 2019, 973–987. [Google Scholar] [CrossRef]
  61. Marks-Bielska, R.; Bielski, S.; Pik, K.; Kurowska, K. The importance of renewable energy sources in Poland’s energy mix. Energies 2020, 13, 4624. [Google Scholar] [CrossRef]
  62. Bluszcz, A.; Manowska, A. Diferentiation of the level of sustainable development of energy markets in the European Union countries. Energies 2020, 13, 4882. [Google Scholar] [CrossRef]
  63. Paska, J.; Surma, T.; Terlikowski, P.; Zagrajek, K. Electricity generation from renewable energy sources in Poland as a part of commitment to the Polish and EU Energy Policy. Energies 2020, 13, 4261. [Google Scholar] [CrossRef]
  64. Sompolska-Rzechuła, A.; Kurdyś-Kujawska, A. Towards understanding interactions between sustainable development goals: The role of climate-well-being linkages. Experiences of EU countries. Energies 2021, 14, 2025. [Google Scholar] [CrossRef]
  65. Wach, K.; Głodowska, A.; Maciejewski, M.; Sieja, M. Europeanization processes of the EU energy policy in Visegrad countries in the years 2005–2018. Energies 2021, 14, 1802. [Google Scholar] [CrossRef]
  66. Gawlik, L.; Mokrzycki, E. Changes in the structure of electricity generation in Poland in view of the EU climate package. Energies 2019, 12, 3323. [Google Scholar] [CrossRef] [Green Version]
  67. Bielecka, A.; Kulczycka, J. Coal combustion products management toward a circular economy—A case study of the coal power plant sector in Poland. Energies 2020, 13, 3603. [Google Scholar] [CrossRef]
  68. Kaszyński, P.; Kamiński, J. Coal demand and environmental regulations: A case study of the Polish power sector. Energies 2020, 13, 1521. [Google Scholar] [CrossRef] [Green Version]
  69. Orlitzky, M.; Schmidt, F.L.; Rynes, S.L. Corporate social and financial performance: A meta-analysis. Organ. Stud. 2003, 24, 403–441. [Google Scholar] [CrossRef]
  70. Margolis, J.D.; Elfenbein, H.A.; Walsh, J.P. Does it pay to be good? A mata-analysis and redirection of research on the relationship between corporate social and financial performance. SSRN Electron. J. 2007. [Google Scholar] [CrossRef]
  71. Gallardo-Vázquez, D.; Barroso-Méndez, M.J.; Pajuelo-Moreno, M.L.; Sánchez-Meca, J. Corporate Social Responsibility Disclosure and Performance: A Meta-Analytic Approach. Sustainability 2019, 11, 1115. [Google Scholar] [CrossRef] [Green Version]
  72. Allouche, J.; Laroche, P. A Meta-analytical Investigation of the Relationship between Corporate Social and Financial Performance. Rev. Gest. Ressour. Hum. 2005, 18, 1–29. [Google Scholar]
  73. Boaventura, J.M.G.; da Silva, R.S.; Bandeira-de-Mello, R. Corporate financial performance and corporate social performance: Methodological development and the theoretical contribution of empirical studies. Rev. Contab. Financ. 2012, 23, 232–245. [Google Scholar] [CrossRef] [Green Version]
  74. Wang, Q.; Dou, J.; Jia, S. A meta-analytic review of Corporate Social Responsibility and Corporate Financial Performance: The moderating effect of contextual factors. Bus. Soc. 2015, 55, 1083–1121. [Google Scholar] [CrossRef]
  75. Mikołajek-Gocejna, M. The relationship between corporate social responsibility and corporate financial performance—evidence from empirical studies. Comp. Econ. Res. 2016, 19, 67–84. [Google Scholar] [CrossRef] [Green Version]
  76. AidElMekki, O. Is socially responsible investment outperforming conventional investment or not? A meta-analysis. Am. J. Ind. Bus. Manag. 2020, 10, 1760–1784. Available online: https://www.scirp.org/journal/ajibm (accessed on 30 April 2021).
  77. Garriga, E.; Melé, D. Corporate Social Responsibility theories: Mapping the territory. J. Bus. Ethics 2004, 53, 51–71. Available online: https://www.jstor.org/stable/25123282 (accessed on 30 April 2021). [CrossRef]
  78. Velte, P. Meta-analyses on corporate social responsibility (CSR): A literature review. Manag. Rev. Q. 2021. [Google Scholar] [CrossRef]
  79. Bodhanwala, S.; Bodhanwala, R. Does corporate sustainability impact firm profitability? Evid. India. Manag. Decis. 2018, 56, 1734–1747. [Google Scholar] [CrossRef]
  80. Chakrun, S.; Saldi, B.; Ben Amar, A.; Jarboui, A. The impact of ISO 26000 social responsibility standard adoption on firm financial performance. Evidence from France. Manag. Res. Rev. 2020, 43, 545–571. [Google Scholar] [CrossRef]
  81. Jackson, L.A.; Hua, N. Corporate social responsibility and financial performance: A snapshot from the lodging and gaming industries. J. Hosp. Financ. Manag. 2009, 17, 63–78. Available online: https://scholarworks.umass.edu/jhfm (accessed on 30 April 2021). [CrossRef] [Green Version]
  82. Hasan, I.; Kobeissi, N.; Liu, L.; Wang, H. Corporate Social Responsibility and Firm Financial Performance: The Mediating Role of Productivity; Bank of Finland Research Discussion Paper; Bank of Finland: Helsinki, Finland, 2016; Volume 7, pp. 1–48. Available online: http://www.suomenpankki.fi/en (accessed on 30 April 2021).
  83. Pereira, A.F.A.; Stocker, F.; de Mascena, K.M.C.; Boawentura, J.M.G. Corporate Social Performance and Financial Performance in Brazilian Companies: Analysis of the Influence of Disclosure. Braz. Bus. Rev. 2020, 17, 540–558. [Google Scholar] [CrossRef]
  84. Velte, P. Does CEO power moderate the link between ESG performance and financial performance? A focus on the German two-tier system. Manag. Res. Rev. 2019, 43, 497–520. [Google Scholar] [CrossRef]
  85. Boyle, E.J.; Higgins, M.M.; Rhee, S.G. Stock market reaction to ethical initiatives of defense contractors: Theory and evidence. Crit. Perspect. Account. 1997, 8, 541–561. [Google Scholar] [CrossRef]
  86. McWilliams, A.; Siegel, D. Corporate Social Responsibility and Financial Performance: Correlation or Misspecification? Strateg. Manag. J. 2000, 21, 603–609. [Google Scholar] [CrossRef]
  87. Hirigoyen, G.; Poulain-Rehm, T. Relationships between Corporate Social Responsibility and financial performance: What is the causality? J. Bus. Manag. 2015, 4, 18–43. [Google Scholar] [CrossRef]
  88. Lee, J.; Graves, S.B.; Waddock, S. Doing good does not preclude doing well: Corporate responsibility and financial performance. Soc. Responsib. J. 2018, 14, 764–781. [Google Scholar] [CrossRef]
  89. Humphrey, J.E.; Lee, D.D. Australian Socially Responsible Funds: Performance, Risk and Screening Intensity. J. Bus. Ethics 2011, 102, 519–535. [Google Scholar] [CrossRef]
  90. Beckmann, M.; Hielscher, S.; Pies, I. Commitment Strategies for Sustainability: How business firms can transform trade-offs into win-win outcomes. Bus. Strategy Environ. 2014, 23, 18–37. [Google Scholar] [CrossRef]
  91. Mundowafa, R.T.; Johl, S.K. A systematic review of eco-innovation and performance from the resource-based and stakeholder perspectives. Sustainability 2019, 11, 6067. [Google Scholar] [CrossRef] [Green Version]
  92. Schwens, C.; Wagner, M. The role of firm-internal corporate environmental standards for organizational performance. J. Bus. Econ. 2019, 89, 823–843. [Google Scholar] [CrossRef]
  93. Mårtensson, K.; Westerberg, K. Corporate environmental strategies towards sustainable development. Bus. Strategy Environ. 2016, 25, 1–9. [Google Scholar] [CrossRef]
  94. Lee, K.-H.; Cheol Cin, B.; Young Lee, E. Environmental responsibility and firm performance: The application of an environmental, social and governance model. Bus. Strategy Environ. 2016, 25, 40–53. [Google Scholar] [CrossRef]
  95. Klassen, R.D.; Whybark, D.C. The impact of environmental technologies on manufacturing performance. Acad. Manag. J. 1999, 42, 599–615. [Google Scholar] [CrossRef]
  96. Gunawardana, K.D.; Pushpakumari, M.D. An impact of environmental practices on financial performance. A literature review. In Proceedings of the 12th International Conference on Business Management, Colombo, Sri Lanka, 7–8 December 2015; pp. 1–2015. Available online: http://ssrn.com/link/12th-ICBM-2015.html (accessed on 30 April 2021).
  97. Jiang, L.; Yang, Q. The Relationship between Corporate Social and Financial Performance: Evidence from Chinese Heavy-Polluting Industries. Master’s Thesis, Uppsala University, Uppsala, Sweden, 2015. [Google Scholar]
  98. Deakin, S.; Hobbs, R. False down for CSR? Shifts in regulatory policy and response of the corporate and financial sectors in Britain. Corp. Gov. Int. Rev. 2006, 333, 1–17. [Google Scholar] [CrossRef]
  99. Sakawa, H.; Watanbel, N. Institutional ownership and firm performance under stakeholder-oriented corporate governance. Sustainability 2020, 12, 1021. [Google Scholar] [CrossRef] [Green Version]
  100. Eisenhardt, K.M. Building theories from case study research. Acad. Manag. Rev. 1989, 14, 532–550. [Google Scholar] [CrossRef]
  101. Kowalska-Styczeń, A.; Malarz, K. Noise induced unanimity and disorder in opinion formation. PLoS ONE 2020, 15, e0235313. [Google Scholar] [CrossRef] [PubMed]
  102. Paradowski, K.; Kowalska-Styczeń, A.; Malarz, K. Influence of a range of interaction among agents on effciency and effectiveness of knowledge transfer within an organization. Acta Phys. Pol. A 2018, 133, 1470–1476. [Google Scholar] [CrossRef]
  103. Kowalska-Styczeń, A.; Malarz, K.; Paradowski, K. Model of knowledge transfer within an organization. JASSS J. Artif. Soc. Soc. Simul. 2018, 21, 1–30. [Google Scholar] [CrossRef] [Green Version]
  104. Księżopolski, K.; Maśloch, G. Time delay approach to renewable energy in the Visegrad Group. Energies 2021, 14, 1928. [Google Scholar] [CrossRef]
Figure 1. Changes in the values of the WIG, WIG 20, WIR RESPECT, and WIG Energia indices in the years 2009–2019 (2009 = 100). Source: Own elaboration.
Energies 14 03668 g001
Figure 2. ROA ratios for the analyzed companies in 2009–2019 (%). Source: Own elaboration.
Energies 14 03668 g002
Figure 3. Dendrogram grouping the surveyed companies in terms of ROA. Source: Own elaboration.
Energies 14 03668 g003
Figure 4. Box plot for ROA. Source: Own elaboration.
Energies 14 03668 g004
Figure 5. ROE ratios for the analyzed companies in 2009–2019 (%). Source: Own elaboration.
Energies 14 03668 g005
Figure 6. Dendrogram grouping the surveyed companies in terms of ROE. Source: Own elaboration.
Energies 14 03668 g006
Figure 7. Box plot for ROE Source: Own elaboration.
Energies 14 03668 g007
Figure 8. ROS ratios for the analyzed companies in 2009–2019 (%). Source: Own elaboration.
Energies 14 03668 g008
Figure 9. Dendrogram grouping the surveyed companies in terms of ROS. Source: Own elaboration.
Energies 14 03668 g009
Figure 10. Box plot for ROS Source: Own elaboration.
Energies 14 03668 g010
Figure 11. Ratios of changes in the level of stock market quotations of the analyzed companies in the period 2012–2019 (2012 = 100) Source: Own elaboration.
Energies 14 03668 g011
Figure 12. Dendrogram grouping the surveyed companies in terms of quotation changes. Source: Own elaboration.
Energies 14 03668 g012
Figure 13. Box plot for quotation changes. Source: Own elaboration.
Energies 14 03668 g013
Table 1. Selected indices of the Warsaw Stock Exchange in the years 2009–2019 rounded to the full point (as at the end of the year).
IndexYears
20092010201120122013201420152016201720182019
WIG39,98647,49037,59547,46151,28451,41646,46751,75463,74657,69157,833
WIG 2023892744214425832401231618931948246122772150
WIG Energia39994314385137483454426829282551299124111962
WIG RESPECT1719 *2259200525912559267422692516307827932509
* first listing of WIG Energia on 4 January 2010—the reference was the value of companies forming it in the WIG index of 31 December 2009. Source: https://www.biznesradar.pl/notowania-historyczne (accessed on 30 April 2021).
Table 2. Coefficients of variation and standard deviations for ROA of the surveyed companies.
CompanyStandard DeviationCoefficient of Variation
PGE4.80%127%
Tauron3.10%137%
Enea2.10%60%
Zepak14.50%867%
Source: Own elaboration.
Table 3. Coefficients of variation and standard deviations for ROE of the surveyed companies.
CompanyStandard DeviationCoefficient of Variation
PGE7.50%137%
Tauron6.00%143%
Enea3.30%60%
Zepak35.90%500%
Source: Own elaboration.
Table 4. Coefficients of variation and standard deviations for ROS of the surveyed companies.
CompanyStandard DeviationCoefficient of Variation
PGE10.50%117%
Tauron5.20%142%
Enea3.90%61%
Zepak24.70%4124%
Source: Own elaboration.
Table 5. Quotation level of companies at the end of the year (in PLN) (as at the end of the year).
CompanyYears
20122013201420152016201720182019
PGE18.2116.2618.8912.7910.4512.05107.96
Tau4.724.375.052.882.853.052.191.64
Enea15.7313.615.211.39.611.59.97.915
Zep28.4525.0526.3912.6115.197.57.7
Source: Own elaboration.
Table 6. Coefficients of variation and standard deviations for quotation changes of the surveyed companies.
CompanyStandard DeviationCoefficient of Variation
PGE17.44%19%
Tauron19.91%23%
Enea16.00%17%
Zepak35.13%38%
Source: Own elaboration.
Publisher’s Note: MDPI stays neutral with regard to jurisdictional claims in published maps and institutional affiliations.