Article

Case Study of a Hybrid Wind and Tidal Turbines System with a Microgrid for Power Supply to a Remote Off-Grid Community in New Zealand

1
Electrical and Electronic Engineering Department, School of Engineering, Computing and Mathematical Sciences Auckland University of Technology, Auckland 1010, New Zealand
2
Technology Research Department, R&D Center, Fusheng Industrial Co., Ltd., Taipei 24158, Taiwan
*
Author to whom correspondence should be addressed.
Energies 2021, 14(12), 3636; https://doi.org/10.3390/en14123636
Submission received: 18 March 2021 / Revised: 1 June 2021 / Accepted: 14 June 2021 / Published: 18 June 2021

Abstract

:
This paper evaluates the feasibility of using a hybrid system consisting of wind and tidal turbines connected to a microgrid for power supply to coastal communities that are isolated from a main supply grid. The case study is Stewart Island, where the cost of electricity, provided by a central diesel power station, is higher than the grid network in New Zealand. Local residents believe that reducing the consumption of diesel and having a renewable source of electricity generation are two of the island’s highest priorities. Merging a tidal energy source (predictable) with wind (unpredictable) and diesel (back-up), through a microgrid, may be a way to increase reliability and decrease the cost of generation. Several off-grid configurations are simulated using HOMER and WRPLOT software. Using two wind and four tidal turbines, plus one diesel generator for back-up, is the best design in terms of lower greenhouse gas emissions, higher renewable fraction, and reduced net present cost.

Graphical Abstract

1. Introduction

According to the International Energy Agency (IEA) World Energy Outlook report, one in six people in the world lack access to electricity. The distance of main-grid substations and the huge amount of investment needed for governments or companies to provide connections are the main reasons, despite an abundance of renewable energy sources and technologies currently available [1].
This paper models the integration of two available offshore renewable energies, wind and tidal, using a microgrid with the aim to avoid the detrimental effects of diesel on the environment and decrease the cost of electricity in a remote off-grid community. Optimization software is used to simulate electricity consumption from a set of hourly operating loads, then simulate reductions in the percentage of diesel power output dependent on the percentages of wind and tidal power available each hour. The novelty of the paper, with respect to the state of the art, is the use of tidal energy in order to enhance the overall efficiency of the microgrid while preserving its stability. This issue is of particular interest for diesel-based island microgrids that face, constantly, the issues of reducing their dependency from fossil fuels and of enhancing the quality of their supply, by reducing voltage drops and power losses.
From a technical point of view, the contributions of the paper are as follows:
  • Explore the use of tidal energy for off-grid design;
  • Explore microgrid design to link tidal energy with other sources;
  • Explore the use of optimisation software as a method how to apply wind and tidal data into microgrid design;
  • Define a method that could be used to optimise a microgrid of wind and tidal turbines anywhere, in order to facilitate future feasibility studies.
The paper extends previous work of the same authors [2], which evaluated connecting a large wind–tidal hybrid turbine to the main New Zealand grid. In contrast, the current work evaluates the off-grid design for an isolated area, using a microgrid to integrate small separate turbines with battery storage, and retaining a diesel generator for back-up at times when wind and tidal flows are insufficient.
The paper includes four sections. The remainder of Section 1 outlines the concepts. Section 2 introduces the proposed site for the case study, and then the methods. Section 3 presents the results from simulating different scenarios. It contains a discussion on the results of the simulations. Finally, Section 4 reports the conclusions from the case study.
The terms microgrid and mini-grid are often mixed. To understand the difference, first the term “grid” needs to be defined clearly, which is as follows:
A main grid is a network of generation stations to carry power through transmission lines from producers to suppliers, who connect consumers through sub-stations and with distribution lines [3].
A mini-grid has a power rating below 15 MW and is disconnected from larger electric grids [4].
A microgrid is a group of loads and energy resources that are individually controllable and connected, in the range from 100 kW to multi-MW [5]. A microgrid can be operated in grid-connected or disconnected mode [6].
In remote areas, isolated from centralized grids, electricity is already being supplied in a relatively expensive and quick way, through off-grid (or island mode) microgrids. However, reducing the cost of generation and increasing access to renewable energy are two important factors in encouraging greater use of microgrids [7].
The next stage in microgrid design is the integration of renewable energies. Microgrids could contribute to the future of clean energy by the following:
  • Better controllability and adaptability [8];
  • More diversity and less cost of the new-design generators; they now include solar panels, small-scale wind, efficient natural gas generators, combined heat and power (CHP), and more [8];
  • Using various kinds of storage systems, such as batteries, fuel cells and thermal energy storages (TES), at a cheaper price [8,9];
  • Possibility of integrating renewable energy sources using artificial intelligence (AI) and machine learning [8].
Laboratory-scale microgrids are used for the experimental investigation of distributed energy resources (micro-turbines, fuel cells, photovoltaics, etc.) [10], hybrid designs [11], and possible components [12]. For real-world installations, commercially available sources of energy, such as diesel generators, hydro generators, photovoltaic arrays, wind turbines, batteries, flywheels and supercapacitors, are being used to construct microgrids for power supply [1].

2. Method

In order to propose a solution for the electricity demand of a remote off-grid community, a number of steps needed to be carried out, which are as follows:
  • Selecting a suitable site for the case study;
  • Identifying electricity demand, i.e., load profile data;
  • Defining all the components of microgrid design including multiple energy resources (turbines and generator), storage device (batteries), rectifier of AC to DC (converter) and predeterminer of electrical system (controller);
  • Obtaining environmental data for the energy resources, including fuel type, wind, and water speeds;
  • Optimizing the design identifying the location, size, and number of devices required to harness energy resources;
  • Feasibility analysis and financial viability of the optimized microgrid design.

2.1. Site Selection

Stewart Island is selected as a case study to evaluate the feasibility of a hybrid system consisting of wind and tidal turbines connected to a microgrid for power supply to remote coastal communities that are isolated from a national supply grid. The island is one of several such communities in New Zealand (Figure 1). The cost of electricity is much higher than on the grid-connected mainland, because power is supplied to just 408 customers from a small diesel power station located centrally in the island’s main settlement Oban by the Stewart Island Electrical Supply Authority (SIESA). Its retail charge is 62 c/kWh, of which 23 c/kWh is the direct cost of operating five diesel generators. Replacing diesel by a source of renewable energy is a top priority for residents [13].
In the case of Stewart Island, fuel cost makes up 40% of operations and maintenance expenditure (Figure 2), so drives the price being charged to customers. Fuel cost is on a 5% annual increase, and additionally, fuel consumption is anticipated to increase 1% annually, which either will increase the cost of electricity for islanders or will decrease the overall income of the supply authority [15].
Several investigations have been conducted recently to find a solution for providing electricity at lower cost, such as an undersea cable from Bluff to Stewart Island, providing hydropower from Maori Creek [16], and integrating wind with solar energy [13]. Tidal energy has not been investigated prior to the case study described in this paper.

2.2. Identifying Demand

Stewart Island Electrical Supply Authority data have been used in the case study to estimate monthly and hourly generation. They indicate that the peak values are in January (209 kW) and at 6–7 pm (239 kW), and the lowest values are in August (162 kW) and at 3–4 pm (121 kW) [13].

2.3. Obtaining Environmental Data

Tidal current data have been obtained from a simulation model that MetOcean Solutions Limited (MSL) conducted on an NZ-wide grid with a 0.06° resolution (5.6 × 6.6 km). The simulation nested high-resolution domains over Foveaux Strait (0.004°; 340 × 450 m) shown in Figure 3. The Princeton ocean model (POM) was used to hindcast the tidal current in a vertically integrated two-dimensional mode with boundaries provided from the global TPX07.1 solution [17].
One of these points, referred to as the Foveaux site (Figure 3), has been selected for the case study, because despite being on the opposite side of Foveaux Strait, it appears to have stronger currents (better generation potential) than points close to Stewart Island’s coast, and also because the global wind atlas model [18] indicates that this point is in an area with frequent strong winds (high potential for wind energy), shown in Figure 4. For New Zealand, global wind atlas extrapolates data from a network of meteorologic recorder stations operated by New Zealand Meteorological Service (NZMS) and National Institute of Water and Atmosphere (NIWA).
The environmental parameters of the site are summarized in Table 1, and Figure 5 and Figure 6.
The last resource input is fuel type for a back-up diesel generator. Biodiesel was selected rather than diesel, because of the following reasons:
  • Diesel with 88% carbon content produces more carbon emissions than biodiesel with 77%;
  • The lower heating value (LHV) of biodiesel is 43.20 MJ/kg, while this value for diesel is 38.5 MJ/kg [19];
  • The price of biodiesel ($/L 0.53) is cheaper than diesel ($/L 1.00) [1].

2.4. Microgrid Components

The microgrid system under consideration consists of wind and tidal turbines combined with a diesel generator and battery energy storage systems (BESS) as shown in Figure 7. A DC bus connects all the components.

2.4.1. Wind Turbine

A suitable wind turbine in terms of low cut-in speed, a generating capacity capable of meeting peak load, supplying a substantial percentage of peak load and low purchase, installation and maintenance costs is the XANT M-21 (XANT, Brussels, Belgium) (100 kW). The capital, replacement, maintenance, and life of the turbine are taken as $50,000, $50,000, $2500/year, and 20 years, respectively. The power curve and percentage of generation in intervals of 4 m/s shown in Figure 8 are given by Equation (1).
P w i n d = { 0.0018 V 6 0.07 V 5 + 1.0826 V 4 8.4544 V 3 + 36.229 V 2 78.056 V + 66.38   f o r   V   10   m / s 100   f o r   11 V 20
Other pertinent details for the XANT wind turbine are given in Table 2.
WRPLOT view software [21] was used to plot wind frequency distribution downloaded from NASA Surface Meteorology and Solar Energy database [22] at the Foveaux site. As can be seen in Figure 9, for 90.5% of the year, the wind speed is more than cut-in speed, so the XANT M-21 wind turbine will be suitable for electricity generation at the Foveaux site.

2.4.2. Tidal Turbine

A suitable tidal turbine in terms of low cut-in speed, a generating capacity capable of meeting peak load, supplying a substantial percentage of peak load and low purchase, installation and maintenance costs is the Schottel (Schottel, Spray, Germany) (54 kW) bidirectional turbine. The capital (or installation and wiring and mounting expenses), replacement, maintenance, and life of the turbine are taken as $54,000, $54,000, $2700/year and 10 years, respectively. The power curve and percentage of generation in 0.5 m/s intervals shown in Figure 10 is given by Equation (2).
P t i d a l = { 2.0978 V 3 + 2.7163 V 2 1.7909 V 0.2358     f o r   V 2.5 54     f o r     2.75 V 4.59
Other pertinent details for the Schottel tidal turbine are given in Table 3.
WRPLOT view software (manufacturer Lakes Environmental, city Ontario, country Canada) [21] was used to plot maximum tidal flow at 5 m above sea bottom. This was obtained by using Python (Python Software Foundation (PSF), Wilmington, NC, USA) code to create a tidal velocity profile from the MetOcean (MetOcean Solutions, Raglan, New Zealand) model’s integrated average tidal velocity. As can be seen in Figure 11, water speed for 68.4% of the year is more than cut-in speed, so the Schottel 54 kW tidal turbine is suitable for generating electricity at the Foveaux site.

2.4.3. Biodiesel Generator

A 320 kW CAT-400 kVA-50 Hz-PP (Caterpillar, Pontefract, United Kingdom) generator is proposed to cover the base load as a low-level load at less than 25% of nominal capacity. This solution enhances the performance of generation consuming just 6.37 L/h fuel. The lifetime is taken as 90,000 h. Capital, replacement, and O&M costs are $160,000, $128,000, and $4.80/h, respectively [23] as follows:
  • Capital cost = 500 × 320 = $160,000;
  • Replacement cost = 400 × 320 = $128,000;
  • O & M cost = 0.015 × 320 = $ 4.80/h.

2.4.4. Battery Energy Storage

Energy storage is one of the most important components in an integrated system generating from different sources of renewable energy [24]. A generic 12-volt lead–acid battery with 1 kWh of energy storage is proposed to ensure highly reliable performance and cost-effective operation [25]. Specifications are given in Table 4. The capital, replacement, maintenance, and life of the battery are taken as $154, $154, $15.40/year, and 10 years, respectively [19].

2.4.5. Converter

A generic system converter is proposed to rectify the AC output of the generator to DC, which is much cheaper than a bidirectional converter. Selecting the HOMER (Homer Energy, Colorado, U.S.) optimizer allows the HOMER model to optimize the size of the converter. The capital, replacement, maintenance, life, and efficiency of the converter are taken as $154, $154, $15.40/year, 15 years, and 90%, respectively [24].

2.4.6. Controller

A load following (LF) controller is selected because it will produce only enough power to meet the demand. The capital, replacement, maintenance, and life of the controller are taken as $200, $200, $5.00/year, and 25 years, respectively.

2.5. Optimising the Design

For the feasibility study presented in this paper, an industry-recognized simulation software called HOMER Pro® (hybrid optimization of multiple electric renewables) is used. The HOMER Pro® microgrid software has become a recognized global standard for optimizing microgrid design in all sectors, from off-grid village power and island utilities to grid-connected campuses and military bases [26].

2.6. Feasibility Analysis

In terms of financial viability, there are two main parameters. The net present cost (NPC) of a system is the total cost of the system (such as capital costs, replacement costs, operation and maintenance costs, etc.) minus all the revenue during its lifetime. The levelized cost of energy (COE) is the average cost of production of 1 kWh of electricity. HOMER software includes an economic analysis module, so is used to estimated NPC and COE. The lowest possible NPC and COE is desirable [24].

3. Results and Discussions

In this section, different designs, in terms of required turbines at the selected Foveaux site for providing the electricity for the demand of Stewart Island, are compared.
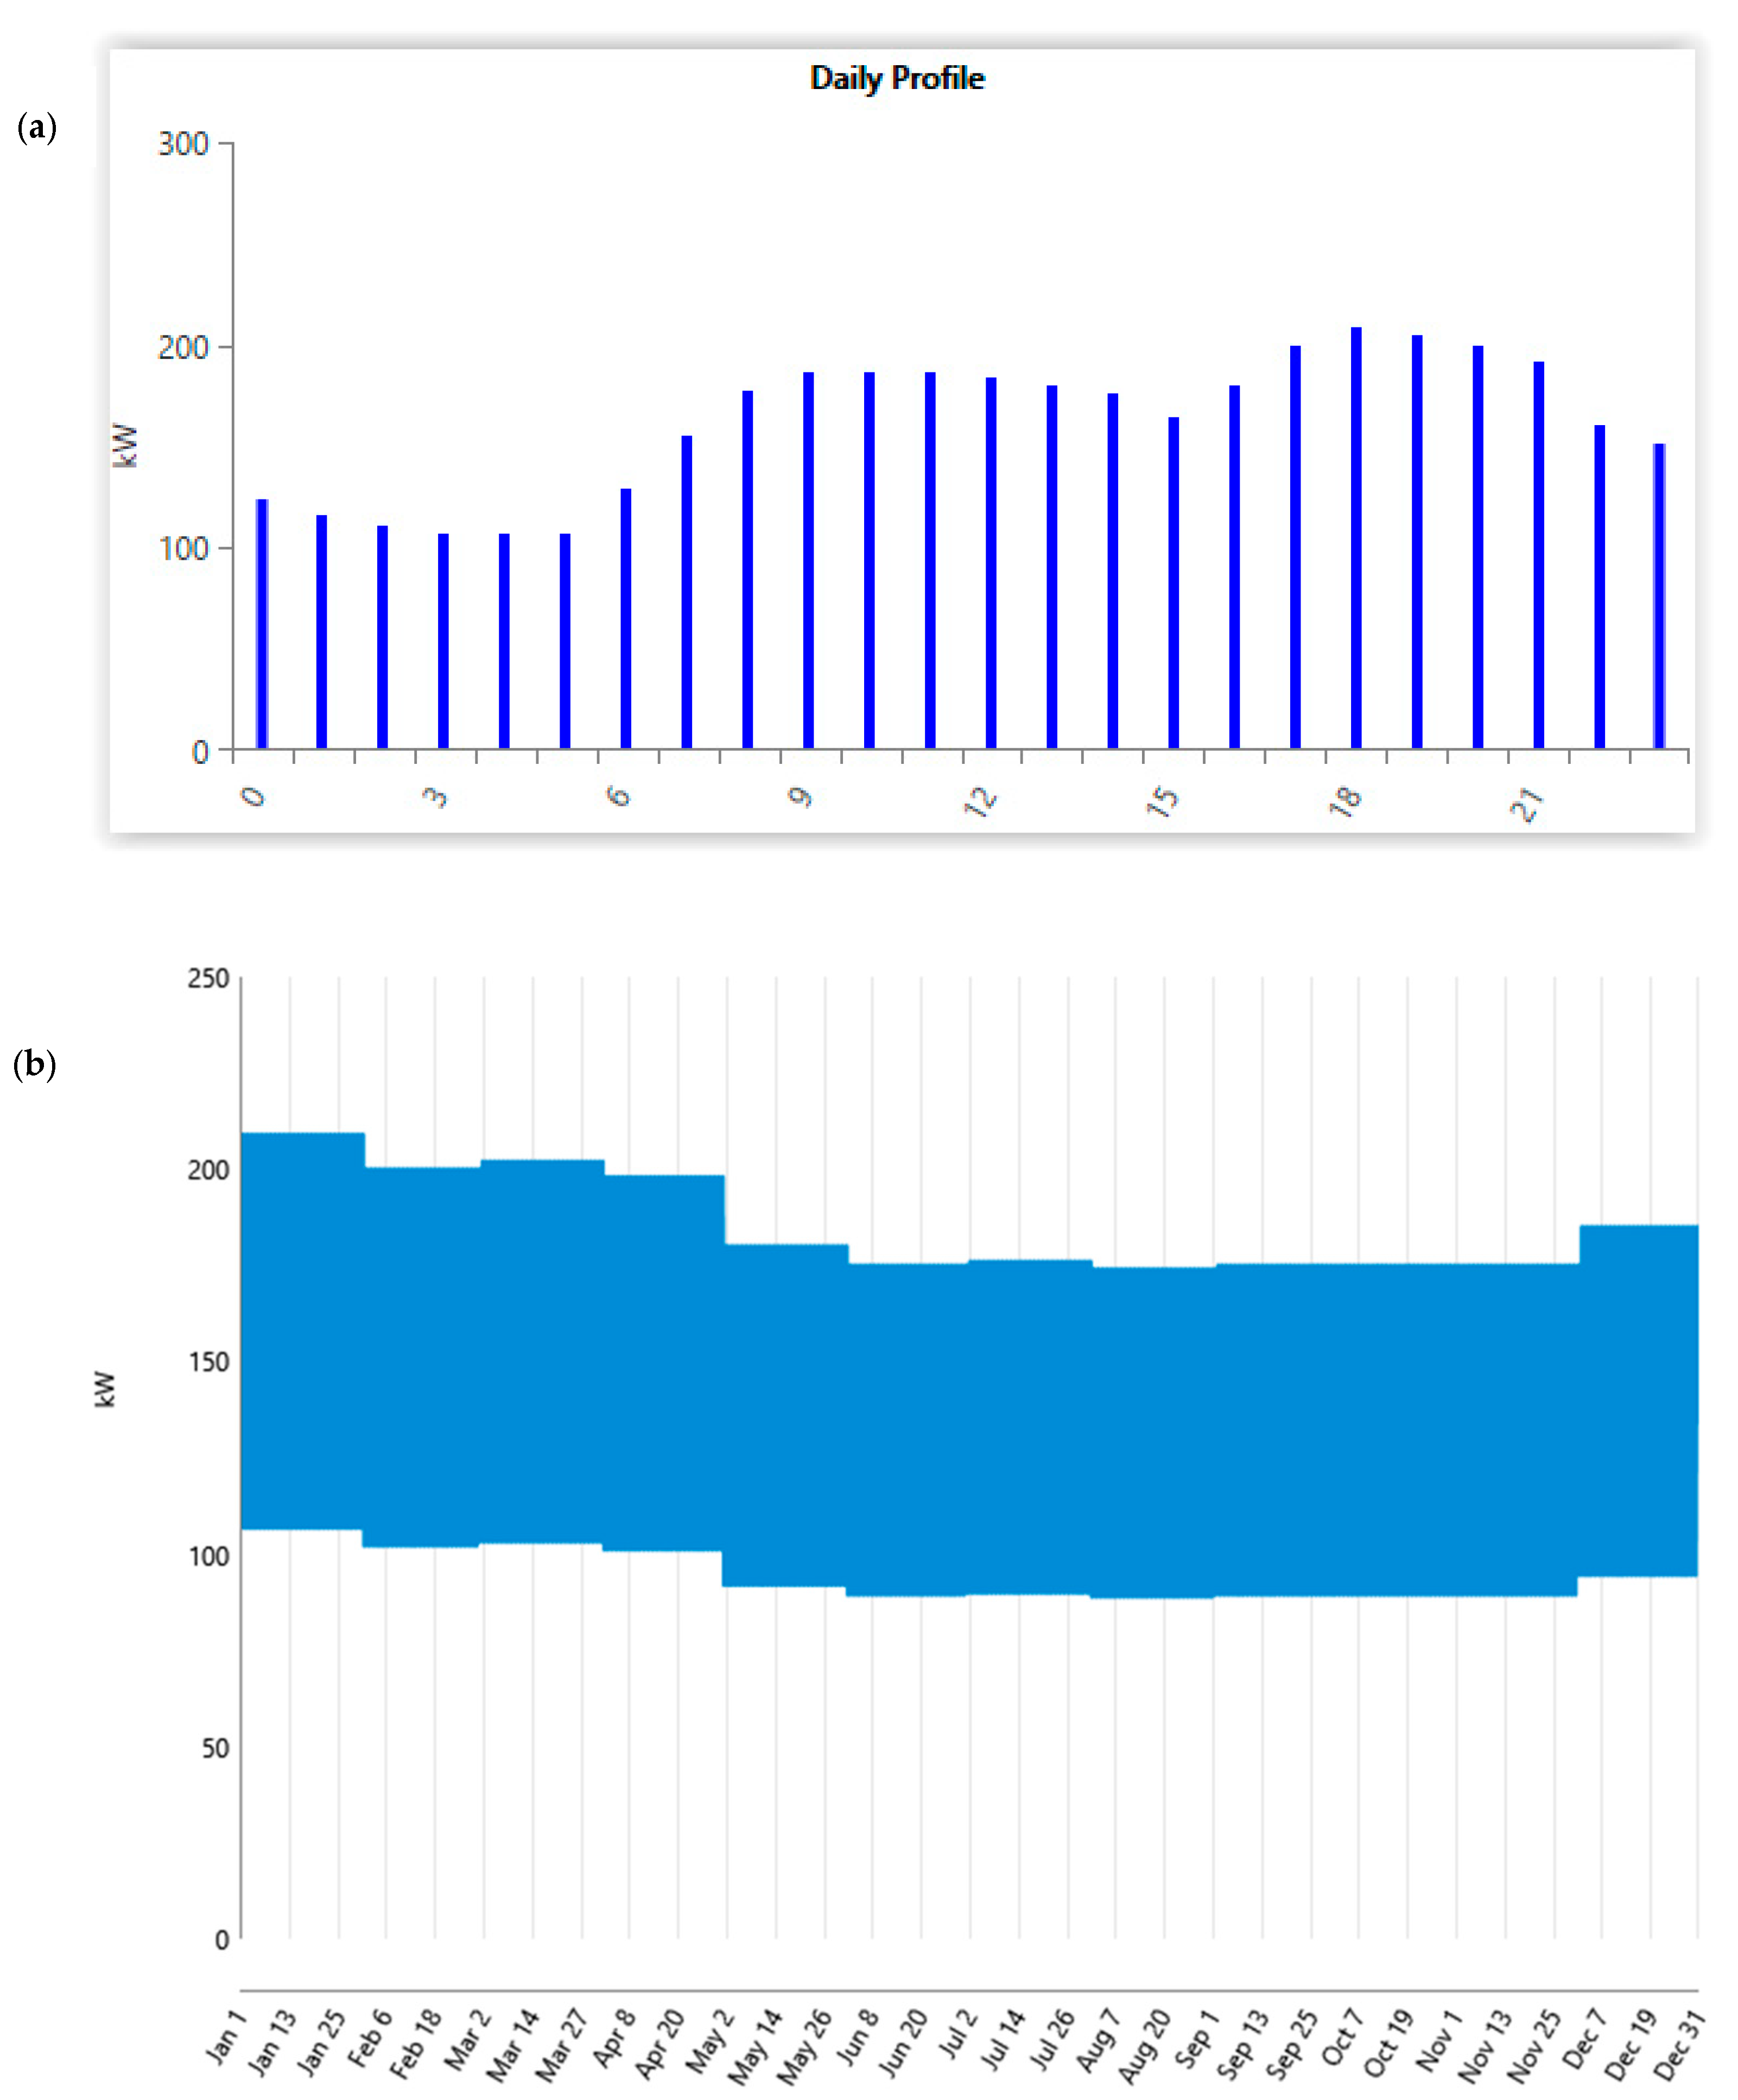
By way of background, the SIESA load profile will be discussed first. The peak hourly load is 209 kW. HOMER software (as explained in Section 2.5 and Section 2.6) is used to plot the average hourly and monthly load, as shown in 
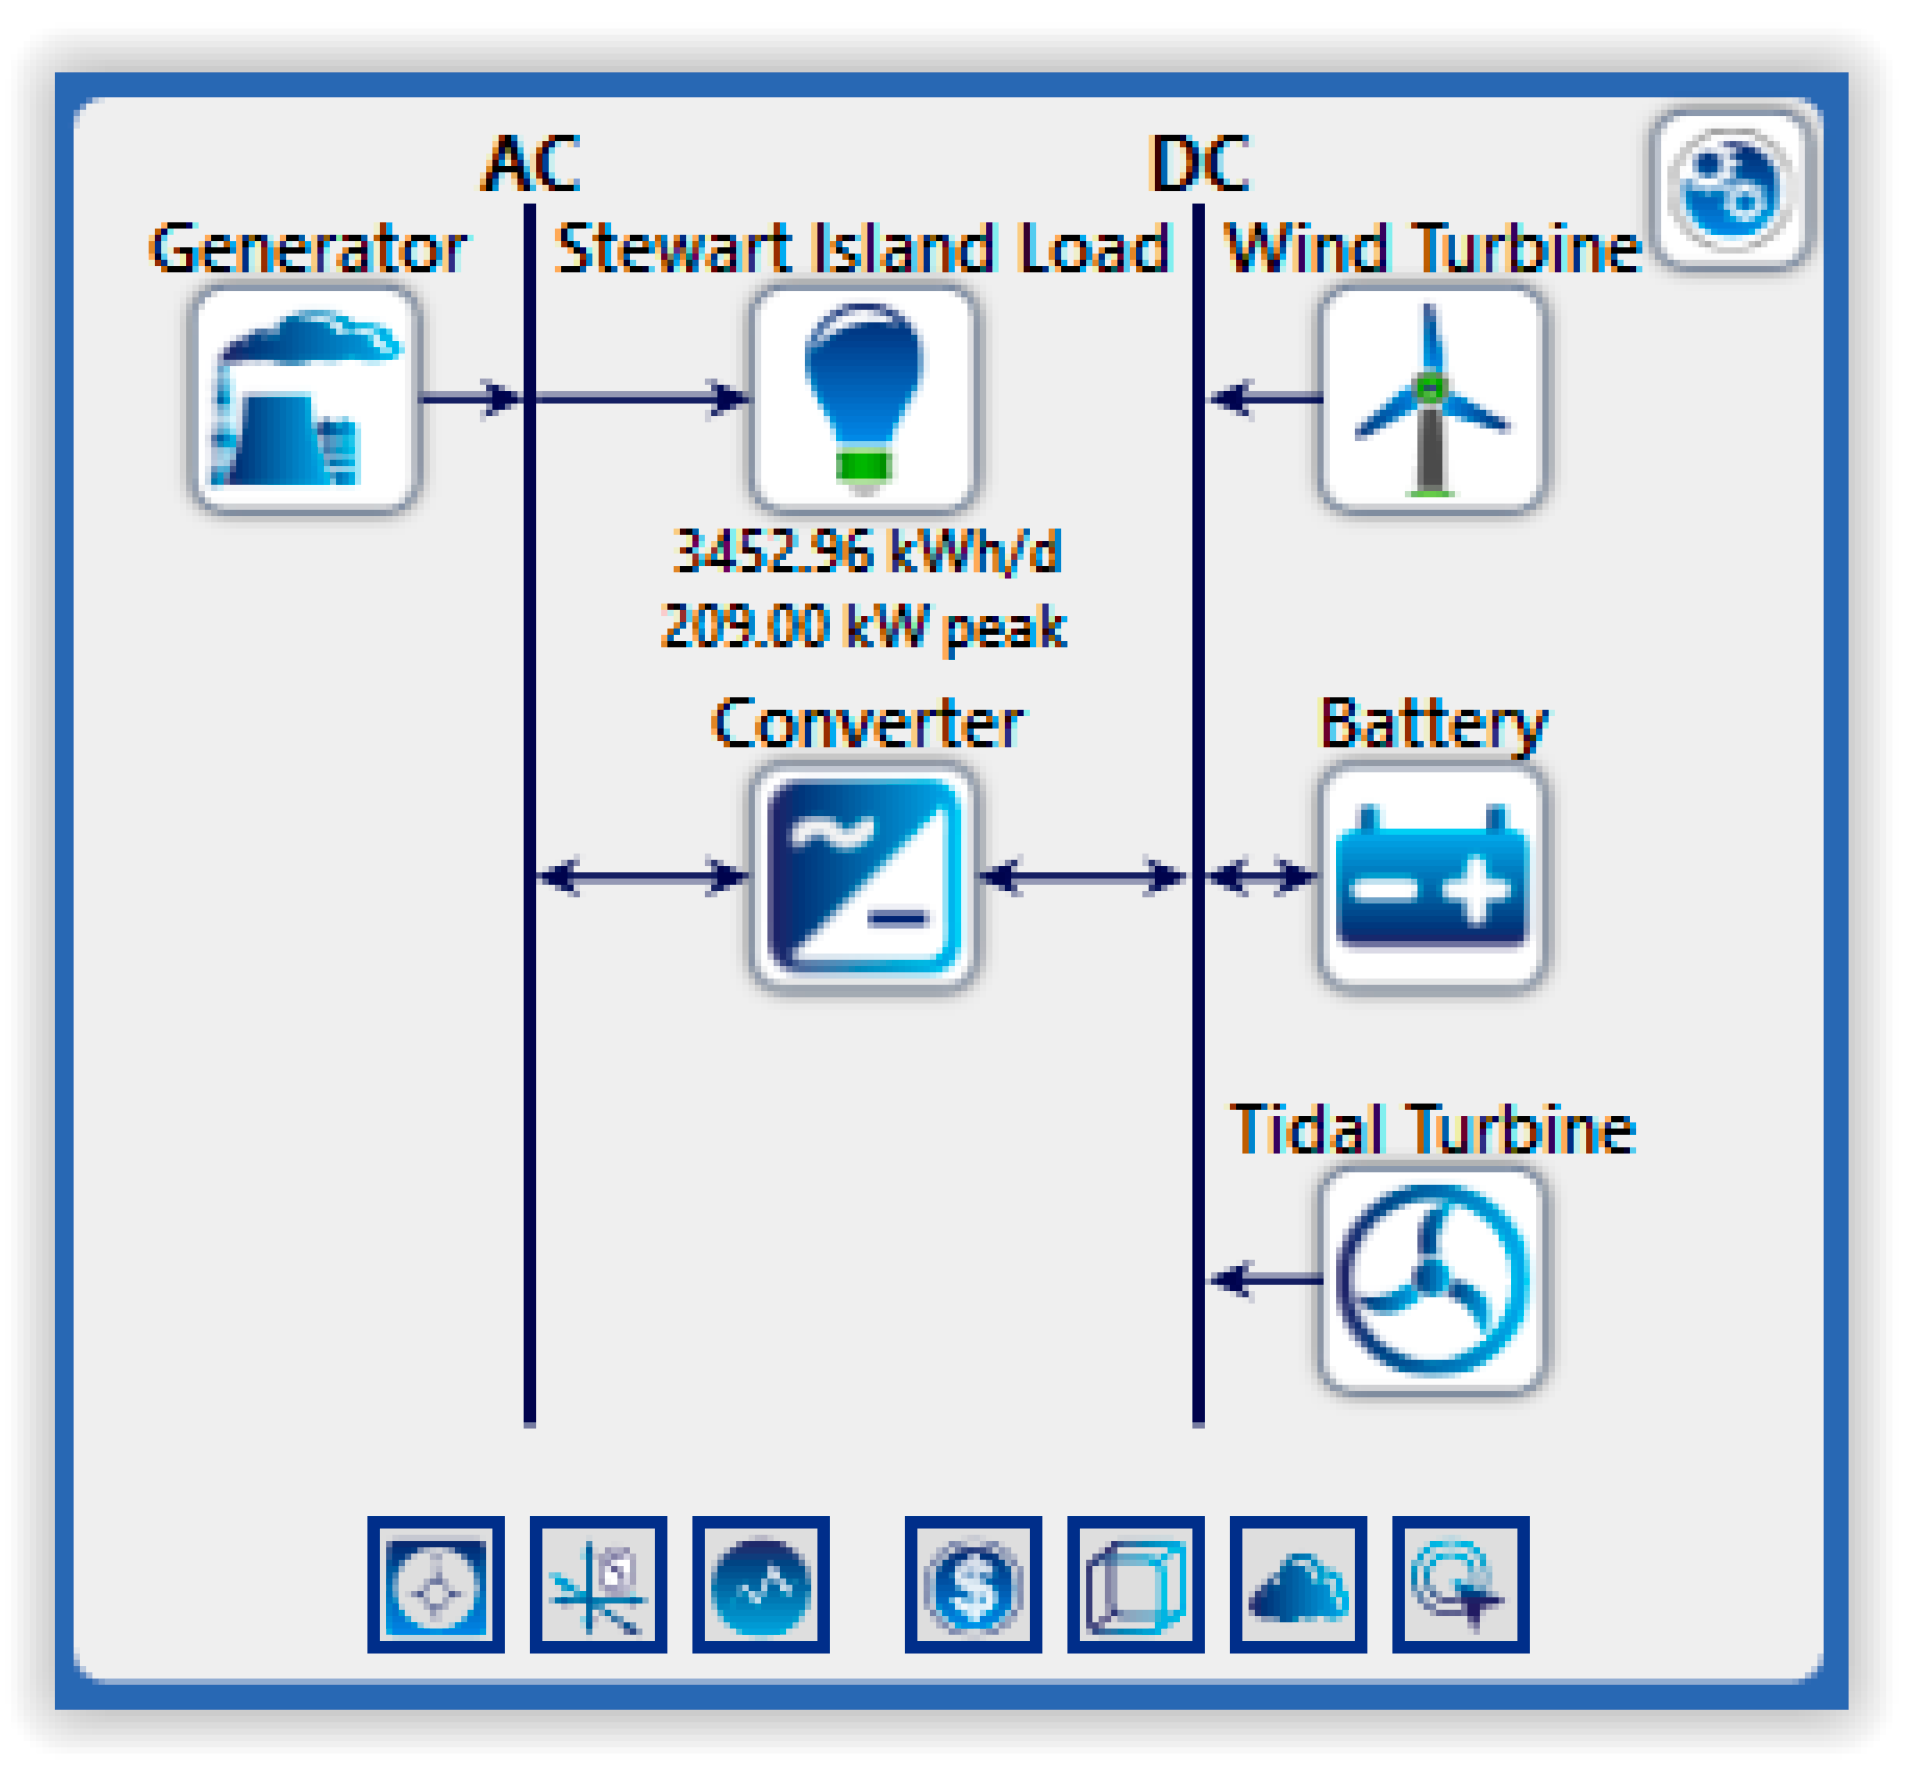
Figure 12. The left graph shows that the average daily load fluctuates between 106 and 209 kW. The right graph shows the load for different months of the year. The minimum load fluctuates between 88 and 174 kW in August, and the maximum load fluctuates between 106 and 209 kW in January. The daily demand for the year averages 3452.9 kWh/d, with a load factor of 0.69. The total demand is 1,260,332 kWh/year.
The power that can be output by single wind and tidal turbines at the Foveaux site are shown in Figure 13. The maximum outputs of the selected wind and tidal turbines are 100 kW and 39.3 kW, respectively.
Figure 14 compares the fluctuations in power demand for three days, with outputs obtained from a tidal turbine, a wind turbine, and a diesel generator. The red curve represents the overall power generated by the system, while the green one shows the demand. The curves show that more than one wind turbine and more than one tidal turbine would have to be configured, in a hybrid system, to reduce Stewart Island ’s dependence on a diesel generator to meet its power demand.
In view of what Figure 14 shows, Section 3.1 and Section 3.2 evaluate different designs, using HOMER software (Section 2.5 and Section 2.6) to optimize turbine and generator operation, so as to meet the fluctuations in demand through the year. The scenarios, in terms of the number of wind (W) and tidal (T) turbines and diesel generators (G), are 1W + 1T, 1W + 2T, 2W + 2T, 2W + 4T and 1W + 10T. Section 3.3 and Section 3.4 discuss the results, in terms of power generation and cost-effectiveness, respectively.

3.1. Power Generation Results

Table 5 shows the mean output, hours of operation, and total production for each scenario. Increasing the number of wind and tidal turbines, decreases the hours of operation and the total production from diesel generators. The total power production for all scenarios exceeds Stewart Island’s demand (1,260,332 kWh/year).
Figure 15a–d show the monthly average power outputs (kW) for different scenarios. Wind energy can generate a large share of output in the scenarios 2W + 2T and 2W + 4T. Tidal energy just starts to generate a significant share of output in the scenario 2W + 4T. Table 6 shows the total electricity production and the percentages contributed by each energy source. The scenario 2W + 4T enables two thirds of production to be generated from renewable sources.
Figure 16 and Table 7 show a possible alternative scenario, 1W + 10T, which might enable a tidal source to contribute as much renewable energy as a wind source. The mean output of wind and tidal turbines are 45.3 and 44.7 kW, and wind and tidal electricity production are 396,392 and 391,238 kWh/year, respectively.

3.2. Financial Analysis Results

Table 8 is a summary of financial analyses for different scenarios at the Foveaux site.
The 2W + 2T and 2W + 4T scenarios seem more economic to install and operate. To show why, Table 9 depicts the optimization results for each scenario. Their renewable fractions are 30.2%, 32.5%, 57.1% and 61.1%, respectively. A renewable fraction of 61.1% means that 61.1% of the electricity is supplied from the wind and tidal turbines, and the rest of it from the diesel generator. Hybrid systems with a renewable fraction of more than 66% are high revenue. [27]. The scenarios 2W + 2T and 2W + 4T almost meet this criterion. They have a lower operating cost, fuel cost, and NPC than 1W + 1T or 1W + 2T. Most importantly, they have a lower COE.
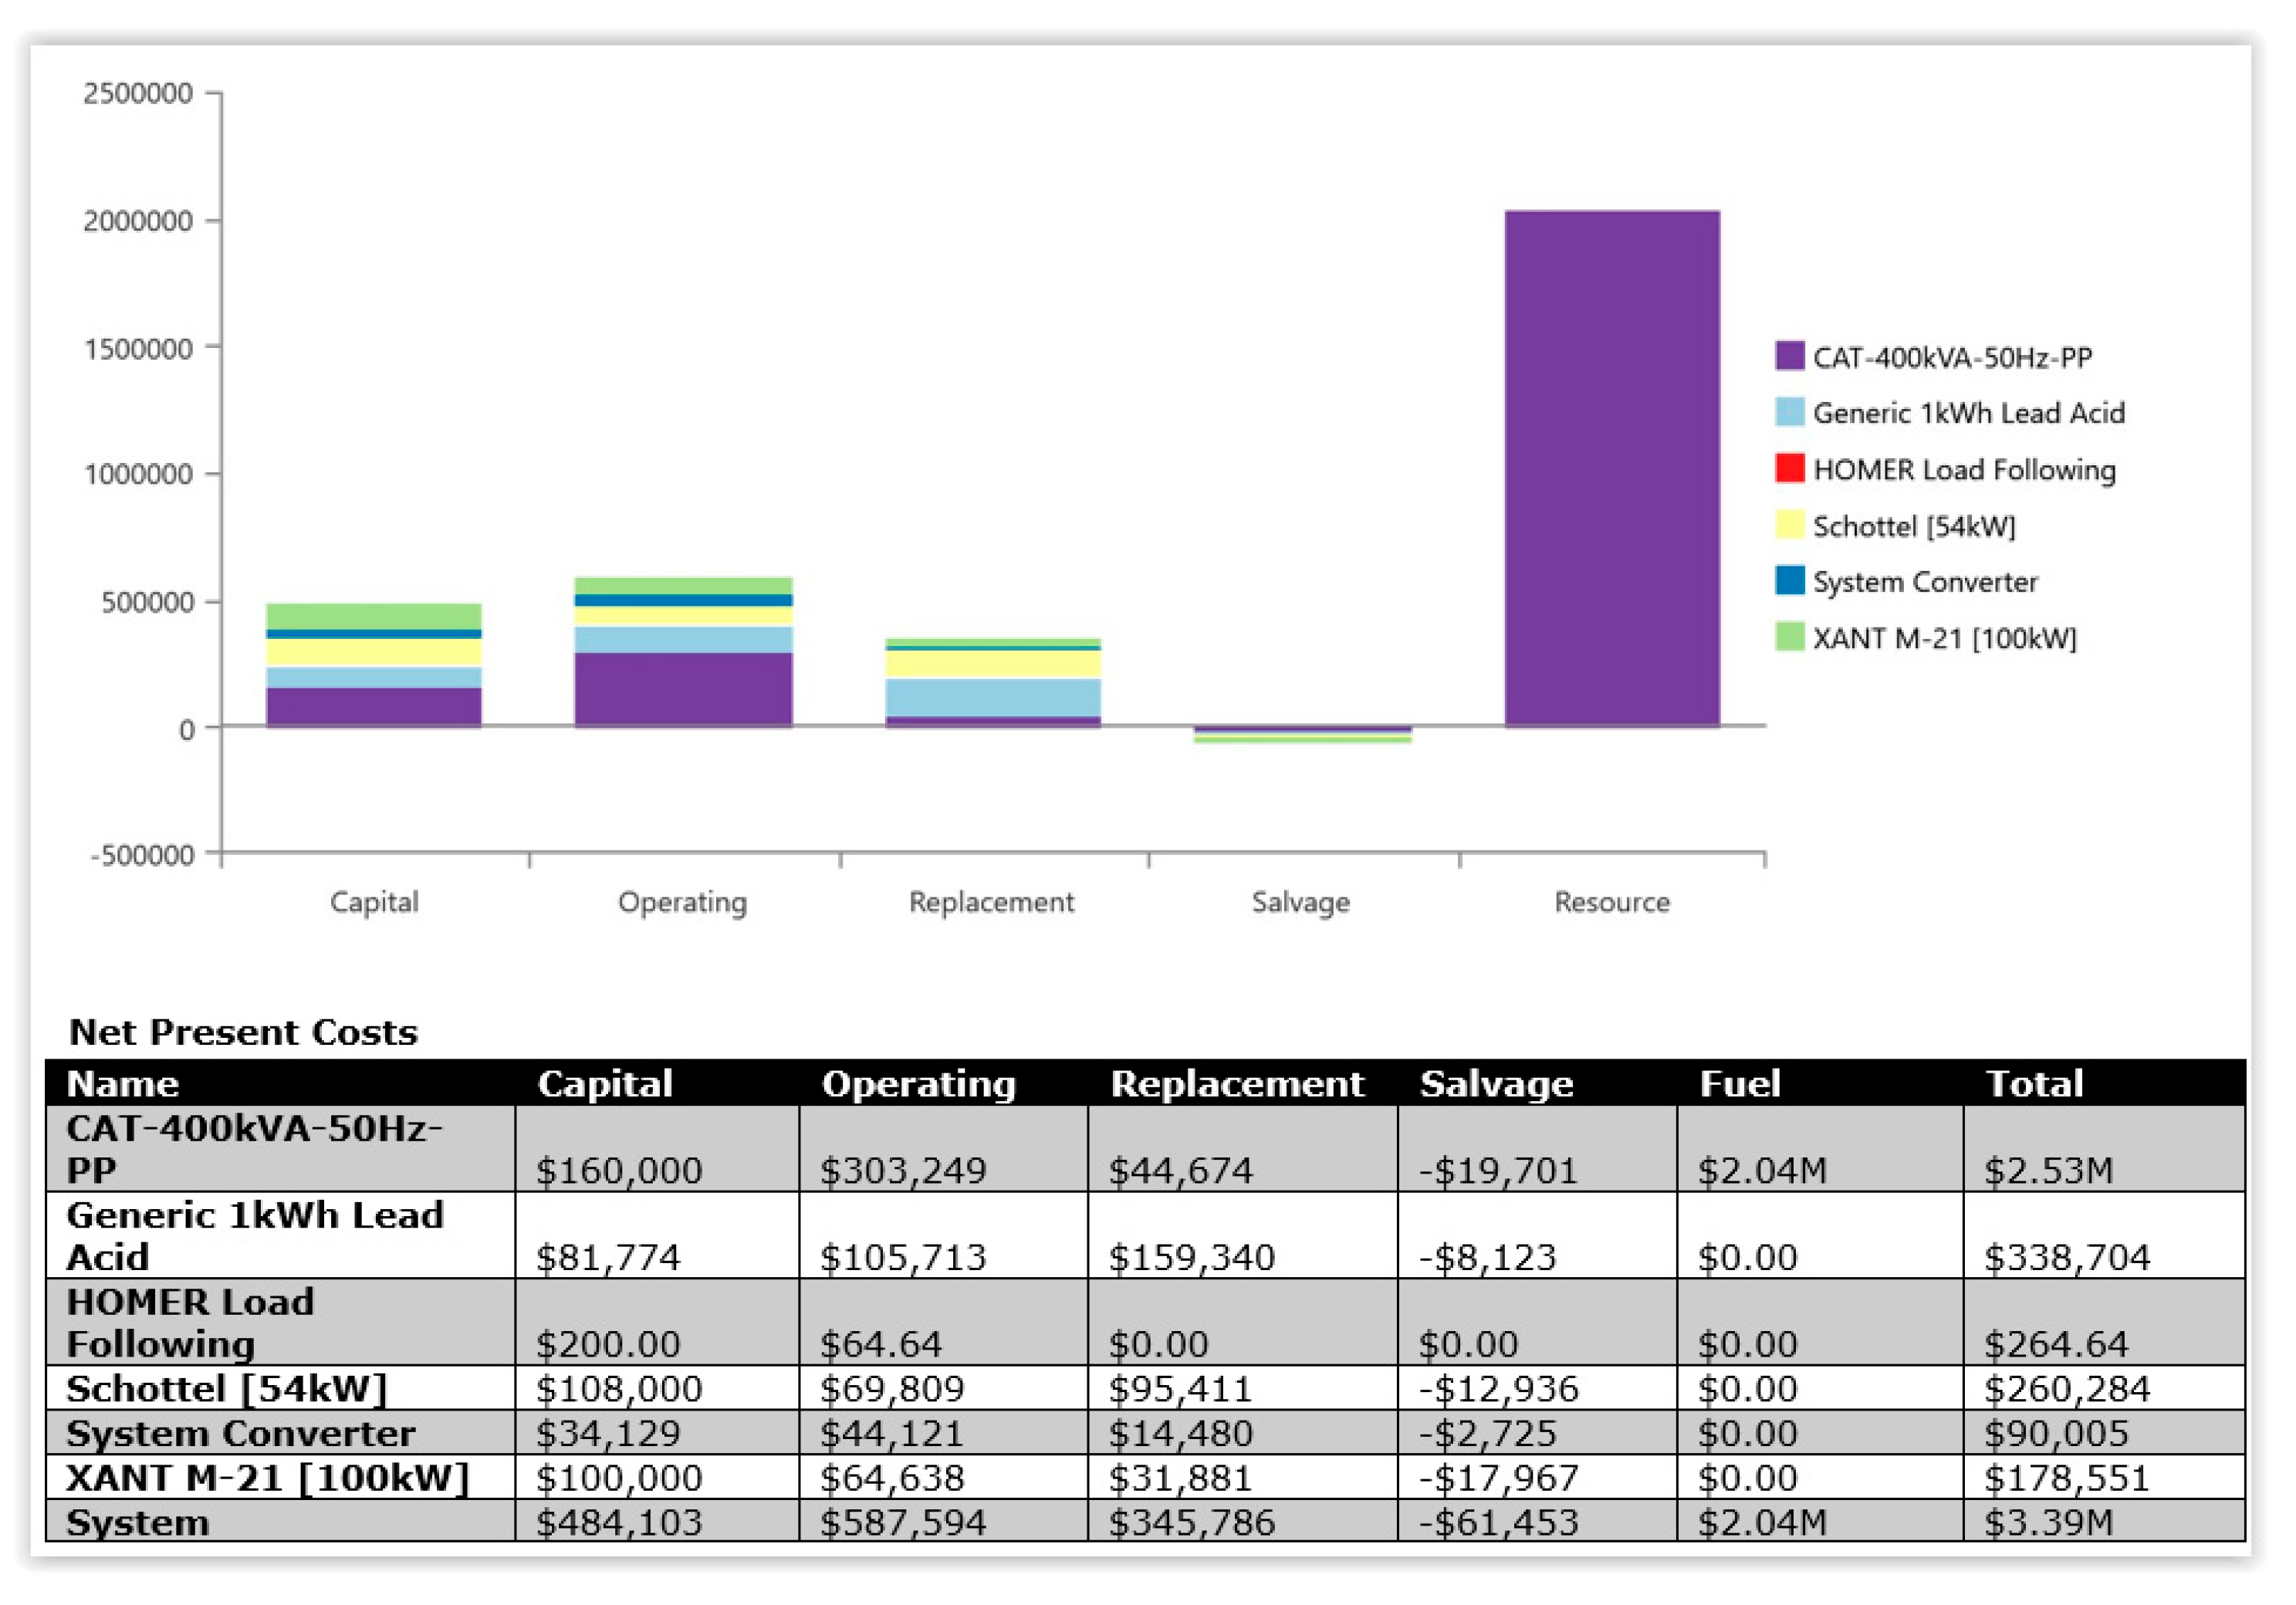
Figure 17 show the scenario with the lowest costs at the Foveaux site, and the net present cost of each component in the system and the system as a whole. The capital, operating, replacement, and salvage costs are small. The main costs are fuel for the generator and initial construction (no provision to enter it in HOMER’s financial analysis module).
Table 10 depicts the optimization results for a possible alternative scenario that can balance wind and tidal generation, 1W + 10T, which has a renewable fraction of 52.7%. However, the capital cost, operating cost, and NPC are higher than 2W + 2T or 2W + 4T. The COE also becomes higher.
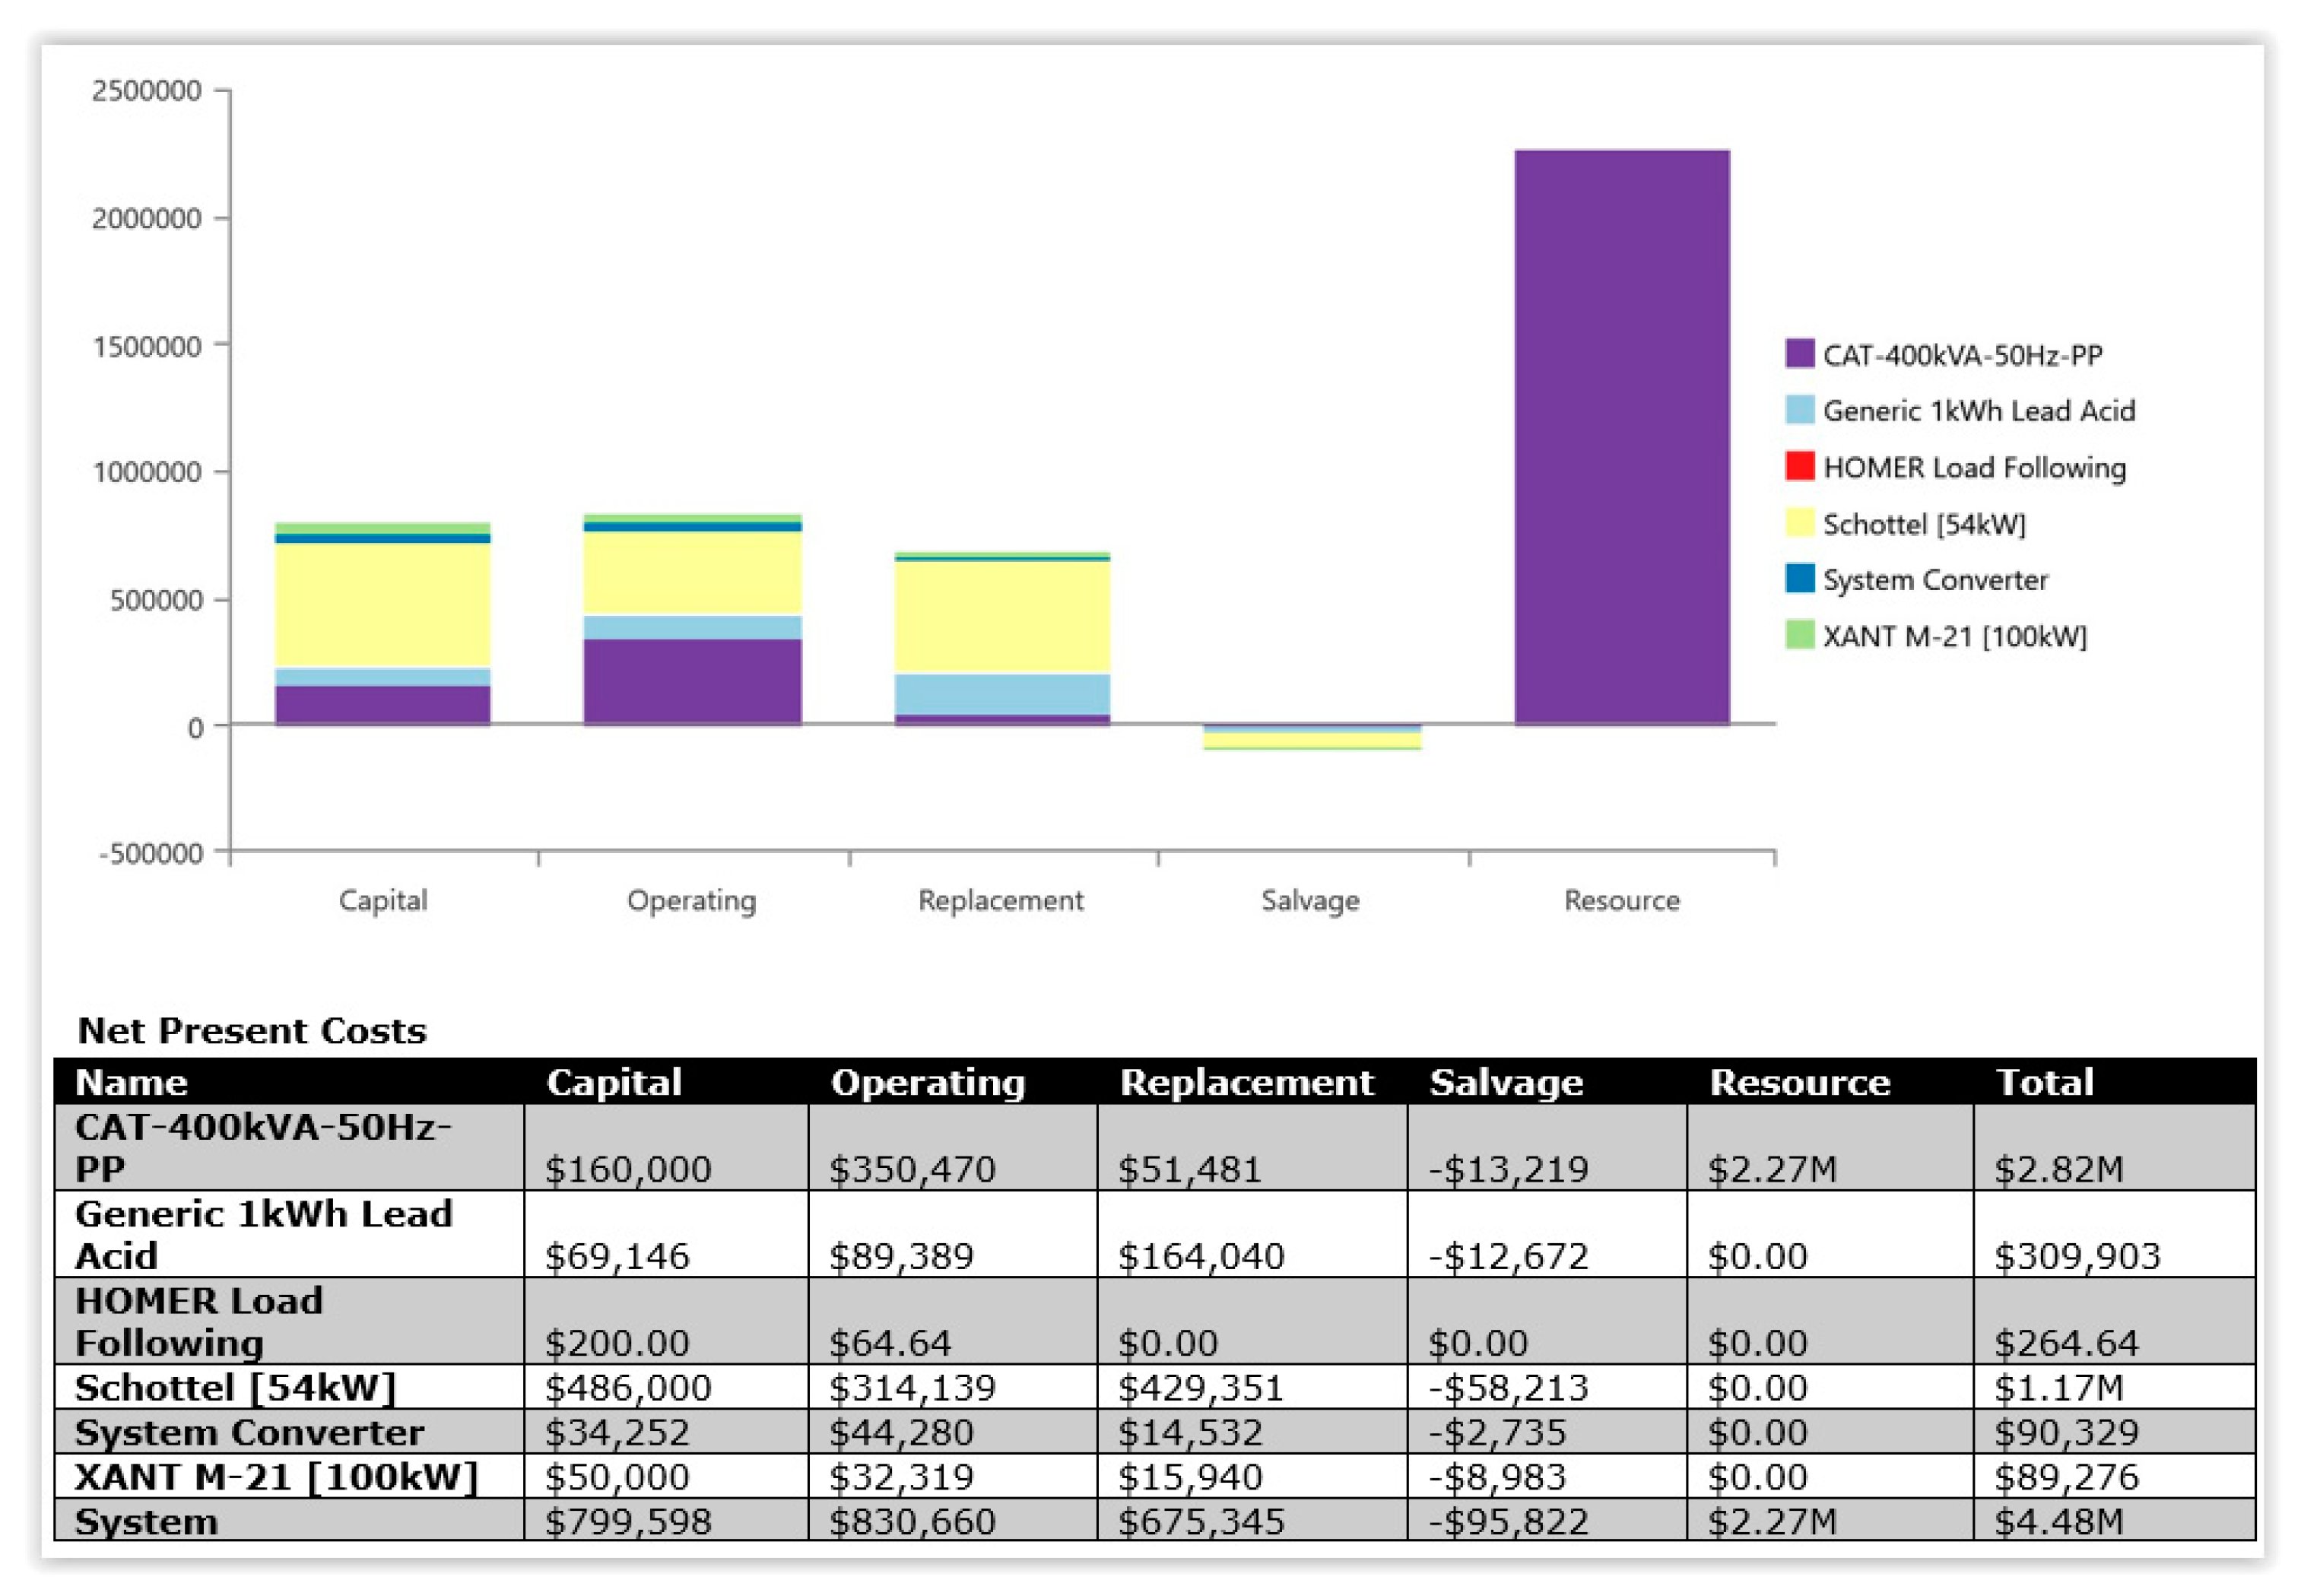
The reason why is shown in Figure 18. Adding more tidal turbines increases the whole-system capital, operating, replacement, and salvage costs. However, it does not reduce the whole-system fuel cost, and the scenario adds to whole-system construction cost (more floating platforms and cables for tidal turbines).

3.3. Discussion of Power Generation Results

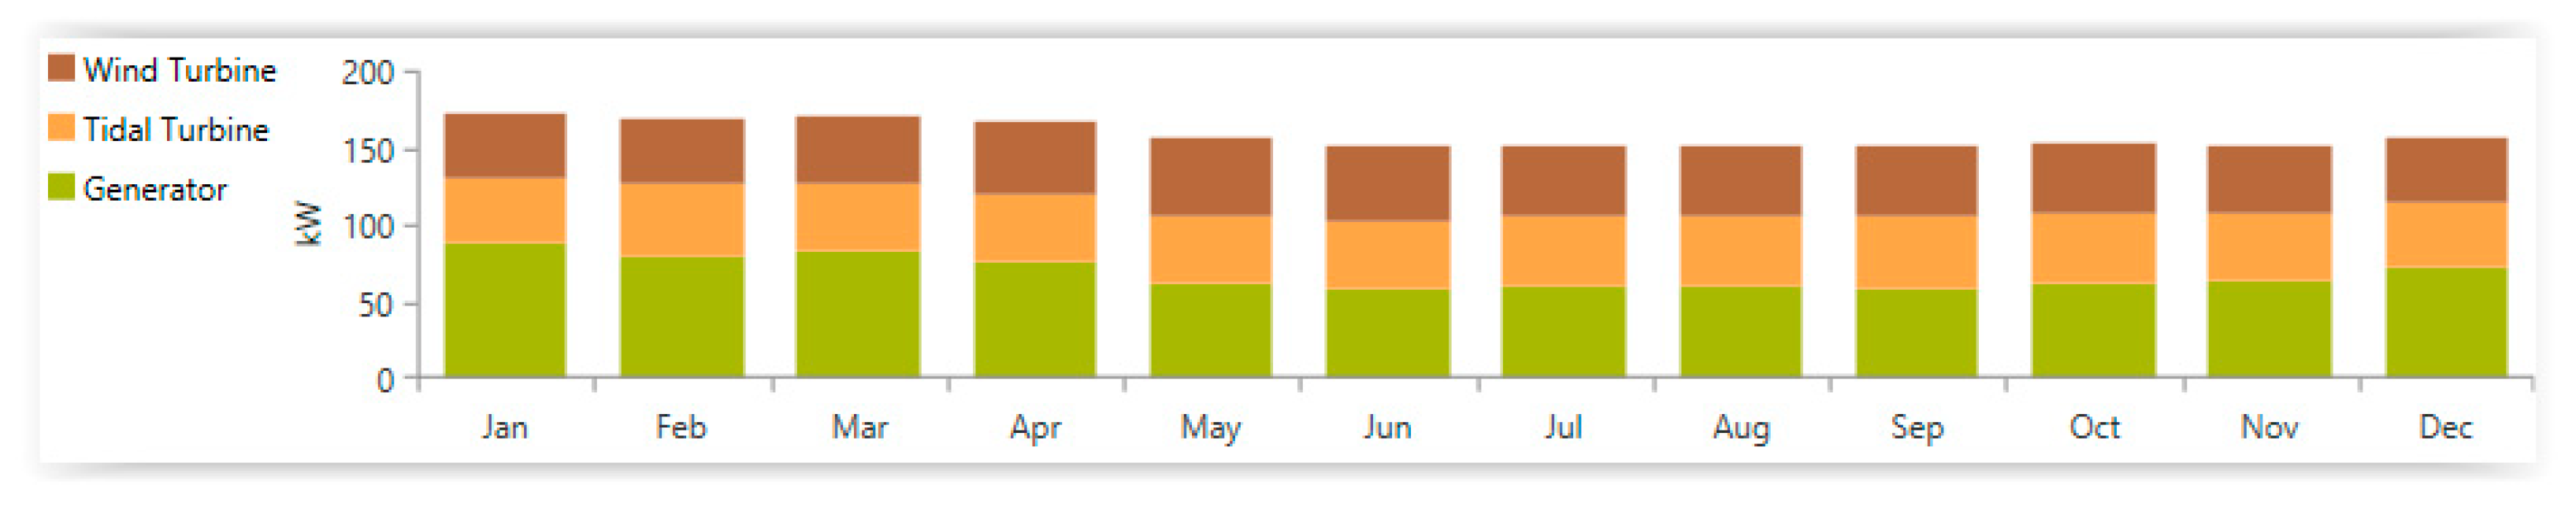
Table 11 shows the mean output power for all the scenarios. Stewart Island’s mean power demand is 143.9 kW. All the scenarios can meet the mean demand. Only 2W + 2T’s and 2W + 4T ’s mean output exceeds the peak demand (209 kW).
Table 12 shows the percentage of electricity produced by the wind and tidal turbines. Stewart Island ’s total power demand is 1,260,332 kWh/year. The scenario 2W + 4T produces the highest renewable energy fraction, and could contribute 75% of the power demand.
Table 13 shows the amount of pollutants and fuel consumed. The scenario 2W + 4T is the most environmentally friendly scenario.
Comparing different designs shows that that 2W + 4T is an optimized hybrid design, which can provide the electricity demand of Stewart Island by using wind, tidal and diesel sources to cover each other during periods when one or another source cannot generate. Further, 2W + 4T’s mean output is the highest at 90.5 kW, it can meet the peak load (209 kW), and it can supply 75.3% of Stewart Island’s total demand.
In comparison with the optimum scenario, 2W + 2T’s mean output is almost as high, and it can also meet the peak load. Its renewable component can still supply 69.1% of the total demand. However, 2W + 2T’s diesel consumption is somewhat higher than the optimum scenario, so are its greenhouse gas emissions. The scenarios 1W + 1T and 1W + 2T have a lower mean output, their renewable output cannot meet the peak load, and meet less than 40%. The fuel consumption and emission of pollutants are much higher than other scenarios.
The scenario 1W + 10T can balance wind and tidal power generation. The renewable components can supply 62.5% of the demand. Although less than 69.1% from 2W + 2T and 75.3% from 2W + 4T, this is still a satisfactory renewable fraction.

3.4. Discussion of Financial Analysis Results

In this section, the scenarios are compared, based on the financial analysis results from Section 3.2, which are summarized in Table 14.
Capital equipment: The cost is the least for scenarios 1W + 1T and 1W + 2T, but these scenarios do not generate much power from renewable sources. The scenarios that can (2W + 2T, 2W + 4T, 1W + 10T), require higher initial expenditure on equipment purchase;
Replacement: The cost to replace equipment (at the end of design life) is consequently the least for the scenarios that do not generate much renewable power, and is higher for the scenarios that can;
Construction: The cost of project installations is not shown, because HOMER Pro’s financial analysis module does not include this. (It just compares equipment, operating and resource costs).
Removal/re-instatement: The cost to remove or re-instate project installations (at the end of design life) is not shown, for the same reason;
Operation: The cost is the least for two scenarios (2W + 2T, 2W + 4T), which generate much power from few turbines. The operating cost for 1W + 10T is greater, because this scenario has numerous turbines. The operating cost is most expensive for the scenarios that do not generate much power from renewable sources. The reason is that the diesel generator (which has a high operating cost) starts up often and runs longer.
Resource: The cost is the least for scenarios that generate much power from wind and tidal turbines (2W + 2T, 2W + 4T, 1W + 10T). The reasons are, firstly, there is no resource cost for wind or tide. Secondly, fuel purchase for the diesel generator is reduced by up to 60%.
The total net present cost of the project (NPC) is the least for 2W + 2T, because this scenario has low equipment and operating costs, and generates much power (62%) from renewable sources, so does not incur a high resource cost. The NPC is almost the same for 2W + 4T, which can generate a greater percentage of power (66%) from renewable sources. However, 1W + 10T, which can still generate much renewable power (57%), is almost as costly as the scenarios that do not, because it requires more expenditure on equipment purchase and operation.
Total cost of energy: The COE is the least for 2W + 2T and almost the same for 2W + 4T, when their NPCs are levelized (per kWh over the life of the project). However, the COE for 1W + 10T, despite its high renewable percentage, is almost as great as the scenarios that do not, once the NPCs of all three are levelized for the purpose of comparison.
The 2W + 4T scenario is optimal for power generation, because it produces the highest renewable fraction (66%), while the RF for 2W + 2T is 62%. Its total NPC seems affordable at 3.47 million dollars. Its levelized cost at 21 c/kWh appears better than the present scenario (5D = 0.23 c/kWh).
A possible alternative scenario, 1W + 10T, would equalize generation from wind and tidal at 28% each, providing a balance of renewable sources. However, its total NPC is considerably higher at 4.48 million dollars, and the levelized cost is also higher at 27 c/kWh.
A problem with HOMER Pro ‘s financial analysis is that it just evaluates equipment, operating and resource costs, when calculating the NPC and COE. A realistic comparison of NPC and COE should include construction and installation costs, particularly offshore platforms, marine cables, and a DC–AC shore converter station.

4. Conclusions

This paper has proposed the integration of two available offshore renewable energy sources—wind and tidal—using a microgrid, with the aim to decrease the cost of electricity in a remote off-grid coastal community, and avoid the detrimental effects of off-grid diesel generation on the environment.
Stewart Island was selected as a case study because it is typical of isolated coastal communities in New Zealand, which depend on small, locally operated diesel power stations or single-household petrol generators.
Components of a suitable microgrid design were identified as multiple energy sources (wind and tidal turbines, with diesel generators for back-up), storage devices (batteries), supply cables (marine connecting to land), and operating equipment (AC to DC converter, system controller).
An industry-recognized simulation software package, HOMER Pro, was used to optimize the microgrid design, by evaluating scenarios composed of components assembled in different combinations, and to analyze their cost.
The power generation results and financial analysis results for various scenarios, as presented and discussed in Section 3, enable the following several conclusions:
There is enough tide to generate electricity during 65% of the year at an offshore site close to Stewart Island (referred to as the Foveaux site);
There is also enough wind to generate electricity during 90% of the year at the Foveaux site. However, this site is on the other site of Foveaux Strait, 40 km away from Stewart Island’s community at Oban;
DC electricity from the offshore Foveaux site can be integrated as a hybrid system with AC electricity from the existing onshore diesel generators at Oban by using a microgrid design, as described in Section 2. The design solution is to mount tidal and wind turbines on the same offshore platform, feed power through a DC marine cable to a DC–AC converter at the Stewart Island shore, then through an AC land cable to a system controller at Oban’s diesel generator station;
The design can be optimised in a way that enables Stewart Island’s power to be supplied, in part, from renewable sources. The simulation of various component combinations (in HOMER Pro) shows several scenarios that look promising. The combination that is optimal for maximising renewable generation is two wind and four tidal turbines, plus a single diesel generator;
The optimal scenario is worth implementing because it could supply 75% of Stewart Island’s power demand from renewable sources, reducing the diesel fuel consumption by 60%;
It is unknown whether the design can be constructed at an affordable cost, because the HOMER Pro financial analysis module does not include construction or installation;
Once built and installed on site, the design can be operated at an affordable cost, because the levelized cost of equipment and resources over the project life (21 c/kWh) is lower than the present operation cost of five diesel generators (23 c/kWh);
A complete cost-benefit analysis is needed to find out whether the supply authority can recover all construction, installation, operating and maintenance/replacement costs from a lower charge to the community than its present retail charge (67 c/kWh).

Author Contributions

Conceptualization, N.M.N. and J.K.; methodology, N.M.N.; software, N.M.N.; validation, N.M.N., J.K. and L.B.; formal analysis, N.M.N.; investigation, N.M.N.; resources, N.M.N.; data curation, N.M.N.; writing—original draft preparation, N.M.N.; writing—review and editing, N.M.N.; visualization, N.M.N.; supervision, J.K.; project administration, J.K.; funding acquisition, J.K. All authors have read and agreed to the published version of the manuscript.

Funding

This research received no external funding.

Acknowledgments

The authors wish to acknowledge the technical support of Julie Jakoboski from MetOcean, and Craig Stewart from NIWA.

Conflicts of Interest

The authors declare no conflict of interest.

References

  1. Rousis, A.O.; Tzelepis, D.; Konstantelos, I.; Booth, C.; Strbac, G. Design of a Hybrid AC/DC Microgrid Using HOMER Pro: Case Study on an Islanded Residential Application. Inventions 2018, 3, 55. [Google Scholar] [CrossRef] [Green Version]
  2. Nasab, N.M.; Kilby, J.; Bakhtiaryfard, L. The Potential for Integration of Wind and Tidal Power in New Zealand. Sustainability 2020, 12, 1807. [Google Scholar] [CrossRef] [Green Version]
  3. Kaplan, S.M. Smart Grid: Modernizing Electric Power Transmission and Distribution; Energy Independence, Storage and Security; Energy Independence and Security Act of 2007 (EISA); Improving Electrical Grid Efficiency, Communication, Reliability, and Resiliency; Integrating New and Renewable Energy Sources; The Capitol Net Inc.: Alexandria, VA, USA, 2009. [Google Scholar]
  4. Pittet, A. An Overview of Technical Aspects of Mini-Grids. 2013. Available online: https://www.eda.admin.ch/dam/countries/countries-content/india/en/resource_en_224456.pdf (accessed on 10 September 2020).
  5. INEGI. La Discapacidad en México, Datos al 2014. 2017. Available online: http://internet.contenidos.inegi.org.mx/contenidos/Productos/prod_serv/contenidos/espanol/bvinegi/productos/nueva_estruc/702825094409.pdf (accessed on 10 September 2020).
  6. Ton, D.T.; Smith, M.A. The U.S. Department of Energy’s Microgrid Initiative. Electr. J. 2012, 25, 84–94. [Google Scholar] [CrossRef]
  7. Adetunji, K.E.; Akinlabi, O.A.; Joseph, M.K. Developing a microgrid for tafelkop using homer. In Proceedings of the 2018 International Conference on Advances in Big Data, Computing and Data Communication Systems (icABCD), Durban, South Africa, 6–7 August 2018. [Google Scholar]
  8. Roberts, D.; Chang, A. Meet the Microgrid, the Technology Poised to Transform Electricity. Vox. May 2018, 24, 2018. [Google Scholar]
  9. Colombo, P.; Saeedmanesh, A.; Santarelli, M.; Brouwer, J. Dynamic dispatch of solid oxide electrolysis system for high renewable energy penetration in a microgrid. Energy Convers. Manag. 2020, 204, 112322. [Google Scholar] [CrossRef]
  10. Barnes, M.; Dimeas, A.; Engler, A.; Fitzer, C.; Hatziargyriou, N.; Jones, C.; Papathanassiou, S.; Vandenbergh, M. Microgrid laboratory facilities. In Proceedings of the 2005 International Conference on Future Power Systems, Amsterdam, The Netherlands, 18 November 2005; p. 6. [Google Scholar]
  11. Wang, P.; Goel, L.; Liu, X.; Choo, F.H. Harmonizing AC and DC: A hybrid AC/DC future grid solution. IEEE Power Energy Mag. 2013, 11, 76–83. [Google Scholar] [CrossRef]
  12. Kroposki, B.; Lasseter, R.; Ise, T.; Morozumi, S.; Papathanassiou, S.; Hatziargyriou, N. Making microgrids work. IEEE Power Energy Mag. 2008, 6, 40–53. [Google Scholar] [CrossRef]
  13. Botha, G.M.P. Stewart Island Wind Investigation 2018. 2018. Available online: https://www.mbie.govt.nz/dmsdocument/5768-stewart-island-wind-investigation (accessed on 12 December 2020).
  14. Electricity Authority. Electricity in New Zealand. 2018. Available online: https://www.ea.govt.nz/assets/Uploads/Electricity-in-NZ-2018-2.pdf (accessed on 5 May 2021).
  15. Stewart Island Electricity Supply (SIESA) Part B. 2018. Available online: https://www.southlanddc.govt.nz/assets/LTP2018/AMP/26-AMP-Electricity-Supply-SIESA-2018-2028-DRAFT-FEB-18.pdf (accessed on 25 January 2021).
  16. McCutcheon, J. Stewart Island Future Supply. 2016. Available online: https://www.mbie.govt.nz/dmsdocument/5768-stewart-island-wind-investigation (accessed on 2 February 2021).
  17. Huckerby, J.J.; Johnson, D.; Nobs Line, N.P. New Zealand’s wave and tidal energy resources and their timetable for development. In Proceedings of the International Conference on Ocean Energy (ICOE), Brest, France, 15–17 October 2008. [Google Scholar]
  18. Global Wind Atlas. Available online: https://globalwindatlas.info/ (accessed on 20 December 2020).
  19. Phurailatpam, C.; Rajpurohit, B.S.; Wang, L. Planning and optimization of autonomous DC microgrids for rural and urban applications in India. Renew. Sustain. Energy Rev. 2018, 82, 194–204. [Google Scholar] [CrossRef]
  20. Homer Pro. Available online: https://www.homerenergy.com/ (accessed on 11 December 2020).
  21. WRPLOT View™–Freeware. Available online: https://www.weblakes.com/products/wrplot/index.html (accessed on 5 August 2020).
  22. NASA Surface Meteorology and Solar Energy Database. 2019. Available online: https://asdc.larc.nasa.gov/project/SSE (accessed on 31 May 2021).
  23. Generator Cost in Homer. Available online: https://www.homerenergy.com/products/pro/docs/latest/generator.html (accessed on 5 August 2020).
  24. Phurailatpam, C.; Rajpurohit, B.; Wang, L. Optimization of DC microgrid for rural applications in India. In Proceedings of the 2016 IEEE Region 10 Conference (TENCON), Singapore, 22–25 November 2016. [Google Scholar]
  25. Taylor, M.; Daniel, K.; Iias, A.; So, E. Renewable Power Generation Costs in 2014; International Renewable Energy Agency: Masdar City, Abu Dhabi, United Arab Emirates, 2015. [Google Scholar]
  26. Deshmukh, M.; Singh, A.B. Modeling of Energy Performance of Stand-Alone SPV System Using HOMER Pro. Energy Procedia 2019, 156, 90–94. [Google Scholar] [CrossRef]
  27. Hiendro, A.; Yusuf, I.; Wigyarianto, F.T.P.; Khwee, K.H.; Junaidi, J. Optimum Renewable Fraction for Grid-connected Photovoltaic in Office Building Energy Systems in Indonesia. Int. J. Power Electron. Drive Syst. 2018, 9, 1866–1874. [Google Scholar] [CrossRef]
Figure 1. Transmission network map [14].
Energies 14 03636 g001
Figure 2. Electricity supply expenditure of Stewart Island [15].
Energies 14 03636 g002
Figure 3. Tidal current model points near Stewart Island from NIWA.
Energies 14 03636 g003
Figure 4. Wind conditions near Stewart Island (left) and at the Foveaux site (right) [18].
Energies 14 03636 g004
Figure 5. Annual water speed for Foveaux site.
Energies 14 03636 g005
Figure 6. Annual wind speed for Foveaux site.
Energies 14 03636 g006
Figure 7. Schematic layout of DC microgrid.
Energies 14 03636 g007
Figure 8. The power curve (top) and power generation distribution (bottom) of the XANT M-21 turbine.
Energies 14 03636 g008
Figure 9. Wind speed frequency distribution at Foveaux site.
Energies 14 03636 g009
Figure 10. The power curve of the Schottel (54 kW) tidal turbine.
Energies 14 03636 g010
Figure 11. Tidal speed frequency distribution at Foveaux site.
Energies 14 03636 g011
Figure 12. The daily (a) and monthly (b) load of Stewart Island.
Energies 14 03636 g012
Figure 13. Power output fluctuation for (a) tidal turbine and (b) wind turbine at the Foveaux site.
Energies 14 03636 g013
Figure 14. Variation in generated powers and required demand during a three-day period at Foveaux.
Energies 14 03636 g014
Figure 15. Monthly average output power for (a) 1W + 1T, (b) 1W + 2T, (c) 2W + 2T, (d) 2W + 4T.
Energies 14 03636 g015
Figure 16. Monthly average output power for 1W + 10T.
Energies 14 03636 g016
Figure 17. Cost summary and components of scenario with lowest NPC (2W + 2T).
Energies 14 03636 g017
Figure 18. Cost and summary results and components of NPC for balanced alternative scenario (1W + 10T).
Energies 14 03636 g018
Table 1. The environmental parameters of the Foveaux site.
LocationLatitude (deg)Longitude (deg)Annual Average Water Speed (m/s)Water Depth (m)Annual Average Wind Speed (m/s)
Foveaux−46.6325° S168.2025° E0.52308.31
Table 2. Wind turbine details. Adapted from [20].
Wind TurbineValue
NameXANT M-21 (100 kW)
Rated Capacity (kW)100
ManufacturerXANT
Cut-in wind speed3 m/s
Cut-out wind speed20 m/s
Rated wind speed11 m/s
Hub height31.8 m
Swept area346.36 m2
Rotor diameter21 m
Table 3. Tidal turbine details.
ParameterValue
NameSchottel (54 kW)
Rated Capacity (kW)54
ManufacturerSchottel
Cut-in tidal speed0.7 m/s
Cut-out tidal speed4.6 m/s
Rated power at2.6 m/s
Swept area7.06 m2
Rotor diameter3 m
Table 4. Properties of generic 1 kWh lead–acid battery [20].
Sl.NoPropertiesRatings
1Nominal voltage12 V
2Round trip efficiency80%
3Lifetime throughput800 kWh
4Maximum charging current16.67 A
5Maximum discharge current24.33 A
Table 5. Annual mean output, hours of operation, and power production for proposed scenarios at Foveaux site.
Parameter1W + 1T1W + 2T2W + 2T2W + 4T
Mean output of W (kW)45.345.390.590.5
Mean output of T (kW)4.58.98.917.9
Mean output of G (kW)111.0109.0111.0109.0
Operation hours of W (h/year)7747774777477747
Operation hours of T (h/year)5759575957595759
Operation hours of G (h/year)7966783548874519
Power production of W (kWh/year)396,392396,392792,785792,785
Power production of T (kWh/year)39,12478,24878,248156,495
Power production of G (kWh/year)880,263850,602540,402490,358
Total Production (kWh/year)1,315,7791,325,2421,411,4341,439,638
Table 6. Share of wind and tidal turbines in electricity production.
ScenarioTotal Electricity Production (kWh/year)Share of Tidal TurbinesShare of Wind Turbine Share of Generator
1W + 1T1,315,7793.0%30.1%66.9%
1W + 2T1,325,2425.9%29.9%64.2%
2W + 2T1,411,4345.5%56.2%38.3%
2W + 4T1,439,638 10.9%55.1%34.1%
Table 7. Share of wind and tidal turbines in electricity production for 1W + 10T.
ScenarioTotal Electricity Production (kWh/year)Share of Tidal TurbinesShare of Wind TurbineShare of Generator
1W + 10T1,383,32528.3%28.7%43.0%
Table 8. Financial analysis results for different scenarios.
ScenarioCapital (k$)Fuel Cost (M$)Operating Cost (k$)Total NPC (M$)Levelized Cost ($/kWh)
1W + 1T3503.33234.530.278
1W + 2T4023.23214.550.279
2W + 2T4842.02253.390.208
2W + 4T5931.82223.470.213
Table 9. Optimization results for (a) 1W + 1T, (b) 1W + 2T, (c) 2W + 2T, (d) 2W + 4T.
Energies 14 03636 i001
Table 10. Optimization results for balanced alternative scenario 1W + 10T.
Energies 14 03636 i002
Table 11. Mean output for different scenarios.
Parameter1W + 1T1W + 2T2W + 2T2W + 4T1W + 10T
Mean Output of Wind Turbine (kW)45.345.390.590.545.3
Mean Output of Tidal Turbines (kW)4.478.98.917.944.7
Mean Output of Generator (kW)111109111109105
Total (kW)160.8163.2210.4217.4195.0
Table 12. Share of wind and tidal turbines in producing electricity and meeting demand.
Parameter1W + 1T1W + 2T2W + 2T2W + 4T1W + 10T
Wind Turbine (% of production)30.129.956.255.128.7
Tidal Turbine (% of production)2.975.905.5410.928.3
Generator (% of production)66.964.238.334.143.1
Renewable Fraction (% of production)33.135.861.766.057.0
W + T Generated power (kWh)435,516474,640871,033949,280787,630
W + T Generated power (% of demand)34.637.769.175.362.5
Table 13. Emissions of pollutants and fuel consumption.
Parameter 1W + 1T 1W + 2T 2W + 2T 2W + 4T 1W + 10T
Carbon Dioxide (kg/year)677,709657,185415,995378,894462,949
Carbon Monoxide (kg/year)1024993629573700
Unburned Hydrocarbons (kg/year)7.707.474.734.315.26
Particulate Matter (kg/year)00000
Sulfur Dioxide (kg/year)1684163310349421151
Nitrogen Oxides (kg/year)37133600227920762536
Total Fuel Consumed (L)256,757248,981157,604143,548175,393
Average Fuel per Hour (L/h)29.328.418.016.420.0
Table 14. Financial analysis summary.
Parameter1W + 1T1W + 2T2W + 2T2W + 4T1W + 10T
Capital equipment (k$)350402484593799
Replacement (k$)233282345469675
Construction, End-of-project removal/reinstatement (k$)-----
Operating cost (k$)323320225222284
Fuel Cost (M$)3.33.22.031.82.2
Total NPC (M$)4.534.553.393.474.48
COE (c/kWh)0.2780.2790.2080.2120.274
Publisher’s Note: MDPI stays neutral with regard to jurisdictional claims in published maps and institutional affiliations.

