Article

Hybrid Control of Grid-Feeding and Fuzzy Logic Fault Detection in Solving Voltage Dynamic Problem within the Malaysian Distribution Network

1
Department of Electrical and Electronics Engineering, Universiti Tenaga Nasional, Kajang 43000, Malaysia
2
Institute of Power Engineering, Universiti Tenaga Nasional, Kajang 43000, Malaysia
3
Department of Electrical Engineering, Universitas Pertamina, Daerah Khusus Ibukota Jakarta 12220, Indonesia
*
Author to whom correspondence should be addressed.
Energies 2021, 14(12), 3545; https://doi.org/10.3390/en14123545
Submission received: 30 April 2021 / Revised: 28 May 2021 / Accepted: 4 June 2021 / Published: 15 June 2021

Abstract

:
The stochastic behavior of PV together with high PV penetration have given rise to power quality concerns involving voltage dynamic issues such as undervoltage, overvoltage, sag and swell. To ensure the grid’s stability, various methods have been practiced such as a proper sizing of the grid lines and the installation of power quality compensation equipment. However, these measures often require high costs and high control complexity due to additional equipment being involved such as multiple transformers and inverters. Moreover, the current available reactive power compensation equipment has a lesser impact on distribution level networks. Therefore, this work proposes a hybrid control of grid-feeding mode and energy storage with Direct Current (DC) fault detection scheme utilizing fuzzy control to mitigate high PV penetration problems, PV intermittency and faults via active power compensation to maintain the system’s voltage within its nominal range. This hybrid control works on two mode of operations: strategic power dispatch by the grid-feeding mode to solve under and overvoltage caused by inconsistent PV generation. Meanwhile, the utilization of fuzzy control aims to solve PV intermittency and line faults. The novel hybrid control has proven its capability to solve voltage dynamic problems caused by high PV penetration, intermittency and faults in the network within a shorter timeframe.

1. Introduction

In recent years, PV system deployments in the grid system have increased significantly, with yearly installed capacities of around 100 GWp [1]. According to the estimation by the International Renewable Energy Agency (IRENA), the cumulative installed capacity would escalate to up to 2840 GW by 2030 and 8519 GW by 2050 [2]. In Malaysia, the Sustainable Energy Development Authority (SEDA) has imposed an energy target of 3% renewable energy in the 11th Malaysian Plan (2016–2020) [3]. Subsequently, the new government under the Ministry of Energy, Science, Technology, Environment and Climate Change (MESTECC) set a new target for renewable energy (RE) of 20% for 2025 excluding large hydro in the power mix [4]. With the available climate advantages in Malaysia, this would make PV-RES (PV-renewable energy sources) one of the leading forms of renewable generation in Malaysia aside from biomass and mini-hydro energy. Currently, there are two types of PV systems, which are roof top and large-scale solar (LSS). However, the implementation of high capacity LSS to fulfil load demand will give rise to power quality issues such as under and overvoltage due to high PV penetration if left unattended. In addition to high PV penetration issues, the intermittency of PV will lead to voltage fluctuations. The current market solutions available to solve power quality problems caused by PV integration are the tap transformers, capacitors, batteries, voltage regulators and smart PV inverters [2]. Each of the equipment mentioned requires high costs and high control complexity. Another common method to overcome the high PV penetration problem is performing PV curtailment, but this would hinder the potential of PV to maximize its generation [5]. Thus, to address the stated issue, a grid-feeding mode with control strategies such as a voltage oriented control (VOC) is proposed to provide support in terms of power compensation, and because of its capability to perform power dispatch between primary and renewable generation. Despite its low cost, simplicity and robustness, a grid-feeding mode is unable to solve fault problems due to its slow response time.
In addition, an unpredictive fault may causes unfavorable disturbances within the network. The four possible fault occurrences within the distribution network are the line-to-ground, double-line-to-ground, line-to-line and three-phase faults [6]. The presence of these faults may cause breakdowns on the line cables or the load equipment in a power system network. In distribution networks, the main encountered power quality issues involve the voltage interruption, sag and swell [7]. As defined in IEEE 1159–1995, voltage sags and swell are a type of power quality problem which occurs when there is a sag or swell of its root mean square within a half cycle to a minute [8]. A short decrease in power supply or load current to less than 10% of the nominal voltage in less than one minute are often classified as an interruption [8]. The following description of the causes and effects of the PQ issues are summarized in Table 1.
Hence, the deployment of the Flexible Alternating Current Transmission System (FACTS) has come into effect to prevent any possible damage caused by power quality issues (voltage interruption, sag, swell and fluctuation) within the power system [10]. With the emerging technology of renewable generation in distribution networks, intermittency on environmental-dependent renewable energy (RE) technology could cause voltage instability within the network. Series compensation devices such as Dynamic Voltage Restorer (DVR) offer compensation via reduction of the reactance element in the line impedance to improve the power factor or injection of the required voltage magnitude towards the load side to maintain grid stability [11]. However, solving both under/overvoltage and voltage sag/swell issues will reduce the lifespan of the energy storage significantly. Furthermore, compensating for the under/overvoltage problem requires larger energy storage, which will induce more costs in this case. Similar to series compensation devices, prominent shunt compensation devices such as the Static VAr Compensation (SVC) or Static Synchronous Compensator (STATCOM) inject reactive current to compensate for voltage magnitude in order to enhance stability within the grid. Overall, both of these systems offer faster voltage dynamic compensation, maintaining voltage stability and the quality of power factor in an acceptable range. Despite that, the capability of Distribution Flexible Alternating Current Transmission System (D-FACTS) in solving the above-mentioned voltage disturbance problem within the distribution network is still being questioned in terms of its reliability and effectiveness for reactive power compensation [12]. This is due to the load on the residential side being more resistive, while reactive power compensation could cause higher current injection into the network, inducing the possibility of cable overheat. D-FACTS devices which utilize real power compensation show a better performance in resolving the voltage disturbance problem; however, this comes with a higher operational cost and these devices are bulkier compared to reactive compensation devices. The list of power quality (PQ) compensation devices with their main functions and drawbacks have been summarized into Table 2.
To evaluate on the occurrence of the voltage disturbance problem (voltage interruption, sag, swell and fluctuation), several detection techniques have been conducted by various researchers for avoiding electrical breakdown within the grid. The three techniques, namely the Data Driven, Process Model and Knowledge Based techniques, are shown in Figure 1.
The Data Driven technique offers better reliability and simplicity based on the previous historical data. However, in order to achieve a more reliable and precise computational value, it demands a large model size and heavy computational efforts, which causes a potential time delay in fault detection. The Process Model or the Physical Model (Control System Based) delivers output of a residual form based on a reference value to indicate the presence of a fault within a system, which is relatively simple for fault detection. A major disadvantage was found in this model through the failure of the filter to suppress unwanted signals (signal noises/disturbance) from its residuals [17,18]. This leads to an uncertainty in fault detection, thereby defeating its objective to detect the required fault signals.
As for the Knowledge-Based technique, its methods such as fuzzy logic provide more robustness than the Process Model (PM) fault detection scheme. This is due to Process Model requiring additional sensors and an actuator to obtain the residual output by comparing the output of the process model with actual output of the monitored system [19]. Furthermore, when there is no presence of a fault, the residual output cannot be lowered down to zero due to the noises and interference incurred in the PM fault detection scheme [20]. Thus, an additive fault detection with a different form of residual filtering is needed to resolve the stated issue [21]. In contrast with the PM fault detection technique, the knowledge-based fuzzy logic method only requires signal input and formulation of the membership function. However, selection of the AC signal as the fuzzy input could generate numerous rules, which further increases the complexity and computational load. To address drawbacks of the conventional Knowledge-Based fuzzy logic method, a simplified and faster computational method (DC fault detection method) that utilizes lesser inputs is proposed in this work to replace conventional AC fault detection. The potential solution to drawbacks of PQ devices and fault detection schemes is presented in Table 2.
Table 2. Summary of Power Quality Devices and Fault Detection Schemes Drawbacks and the Potential Solution [9,10,11,22,23,24].
Power Quality (PQ) Compensation DevicesMain FunctionDrawbacks
Dynamic Voltage Restorer (DVR)
  • Active power compensation [11]
  • Reactive power compensation
  • Sag and swell compensation [22]
  • Short lifespan of energy storage if it operates to solve both under/overvoltage and sag/swell problems.
  • High cost due to large battery sizing for active power compensation
  • Reactive power compensation is less effective in distribution network due to resistive load.
  • Requires additional transformer
Static VAr Compensator (SVC)
  • Reactive power compensation [9]
  • Sag and swell compensation
  • Address voltage fluctuation
  • Reactive power compensation is less effective in distribution network due to resistive load.
  • Unable to compensate for large voltage margin (limitation in capacitor sizing)
Static Synchronous Compensator (STATCOM)
  • Active power compensation
  • Reactive power compensation
  • Sag and swell compensation [23]
  • Power factor correction [24]
  • High operational cost for active power compensation (larger battery size)
  • Reactive power compensation is less effective in distribution network due to resistive load
  • Short lifespan of energy storage if it operates to solve both under/overvoltage and sag/swell problems.
  • Requires coupling transformer
Fault Detection SchemesDrawbacks
Data Driven
  • Possible time delay in fault detection due to high demand in large modal size and heavy computational effort [25,26]
Process Model
  • High event of uncertainty in fault detection [17,18]
  • Requires additional sensors and actuator [19]
Conventional Knowledge-Based (fuzzy logic)
  • Requires only signal input and formulation of membership function. However, selection of AC signal as fuzzy input could generate numerous rules that increase complexity and computational load in fault detection [23]
Potential Solution to Drawbacks of PQ Devices and Fault Detection Schemes
TechniqueAimAdvantages
Hybrid Control of Grid-Feeding Voltage Oriented Control (VOC) and Direct Current (DC) Fuzzy Logic (FL) Fault Detection SchemeTo solve under/overvoltage problem
  • Introducing VOC control could avoid large sizing of energy storage to perform active power compensation (cost reduction).
  • With the VOC control back-to-back converter (AC-DC-AC) topology, fuzzy logic control could tap into data at the DC-link to formulate a DC fault detection scheme, which significantly reduces the number of membership function rules as compared to an AC fault detection scheme, thus leading to a faster fault solving time.
  • Coordination of both VOC and FL control could solve a wide range of power quality problems, at the same time prolonging battery lifespan.
  • Does not require additional transformer
To solve sag/swell/voltage fluctuation (fault)
In light of the above, this work aims to resolve the high PV penetration problem, intermittency (PV fluctuation) and fault (sag/swell) in the distribution network by introducing a hybrid control of grid-feeding mode (Voltage Oriented Control) and energy storage with a fuzzy controlled Direct Current (DC) fault detection scheme. First, a 33 kV PV-integrated Malaysian Distribution Network (RN#1) was constructed followed by a power flow study to identify the weak bus through observation on the possible line losses based on the permissible voltage tolerance. Next, the weak bus from the network was integrated with PV-RES to compensate for the line voltage losses. A back-to-back converter was proposed along with the grid-feeding control strategy (VOC) where the objective was to regulate the power output between the primary generation and renewable sources within a 33 kV PV-integrated Malaysian Representation Network. This would maximize the potential generation of PV by solving the under and overvoltage issue caused by high PV penetration. On the other hand, the selection of fault detection method which is the Knowledge-Based Fuzzy Control was modeled along with the energy storage to solve PV intermittency (fluctuation) and fault (sag/swell). The proposed hybrid compensation method between Voltage Oriented Control (VOC) and fuzzy control would ensure a faster fault clearance while at the same time preventing frequent charging and discharging events for the energy storage. Consequently, it would prolong the state-of-health of the energy storage and contributes to an overall lower operational cost within the network in the long run. The overall proposed hybrid control could mitigate the high PV penetration problem (under/overvoltage), intermittency (fluctuation) and faults (sag/swell) all at once through active power compensation to maintain the system’s voltage stability.

2. Methodology

2.1. Development of the Malaysian Representative Network (RN#1)

A 33 kV PV-integrated Malaysian Representation Network (RN#1) was developed based on an actual network in Malaysia, as shown in Figure 2. The voltage level was in accordance with the MS 61,000 standard, which is 230 V for a single-phase system and 400 V for a three-phase system with a permissible tolerance voltage level of +10% and −6%. For the maximum loading of the transformer, it was set below 75% of the maximum demand according to the standards set by the Malaysian Electric Utility company [27]. The standards of PV sizing were based on 75% of the load maximum demand (560 kW) according to the Net Energy Metering introduced by the Malaysian Energy Commission [28]. For the slack bus voltage, it was set according to the normal operation limit with a tolerance of 5% (1.05 p.u.) in a 33 kV distribution network [29]. The parameters for RN#1 are presented in Table 3 and the five types of loads within the network in Figure 2 are categorized as follows:
  • Long distance (10 km) of supply to load—Load Type A
  • Commercial load—Load Type B
  • Small residential load—Load Type C
  • Normal residential load—Load Type D
  • PV integrated rooftop residential load—Load Type E
Table 3. Parameters for the 33 kV Malaysia Representative Network (RN#1) [27].
No.ParametersAverage Value
RN#1
1No of 11 kV feeders per 33/11 kV Tx 5
2No of 11 kV feeders (unit) for each main intake -
311 kV feeder length per feeder (km/feeder) 2.6
411 kV Tx nos per 11 kV feeder (nos) 5
5LV feeder nos per 11/0.4 KV Tx (nos) 8
6Average distance between 11/0.4 kV Tx (per feeder in km) 0.6
733/11 kV Tx MD (MW/Tx) 9.6
811 kV Feeder MD per feeder (MW/feeder) 2.5
911/4 kV Tx capacity (MVA) 1
1011/0.4 kV Tx MD per 11 kV feeder (kW) 560
1111/0.4 kV Tx maximum loading (%) 65
1211 kV Feeder MD per km (MW/km) 1.3
13% ratio of number of LV Overhead (OH) lines over total feeder nos 52
14% ratio of number of LV Underground (UG) lines over total feeder nos 48
After the RN#1 network was modeled, a power flow study was conducted to identify the possible weak bus within the network. The observed voltage p.u. for five different load types is shown in Table 4.
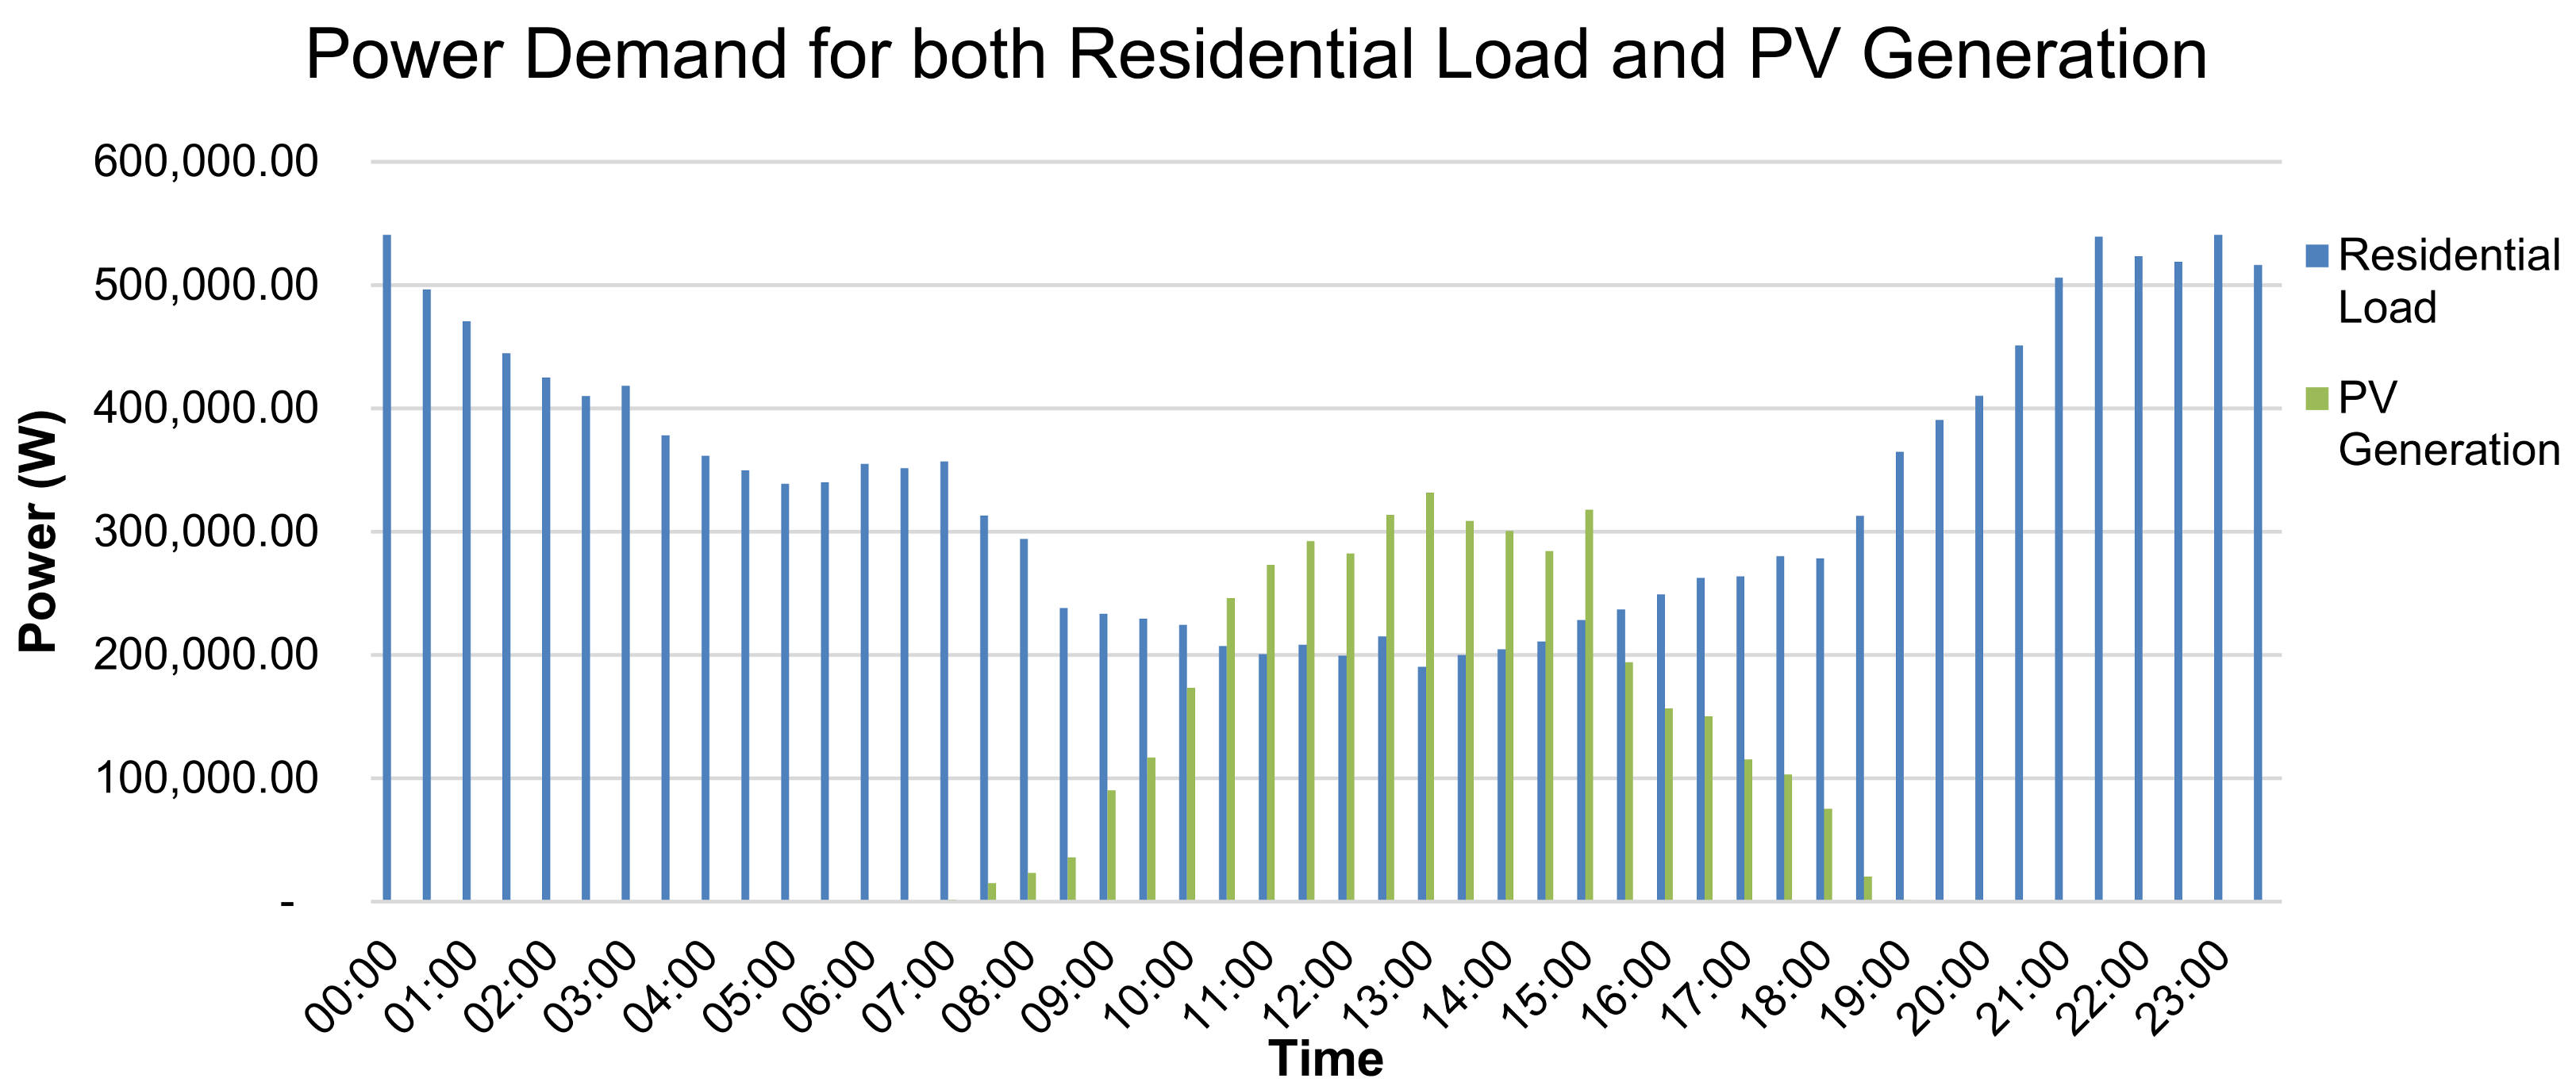
From Table 4, it can be observed that the bus with load Type A and load Type E were prone to a high voltage drop and overvoltage. The overvoltage problem at load Type E could be avoided by resizing the PV. However, load Type A was not PV integrated, thus, to recover from the voltage drop, the weak bus had to be restimulated with PV source integration using Simulink, MATLAB software. The parameters of the constructed weak bus and load profile for load Type A with PV generation are shown in Table 5 and Figure 3. In Table 5, the load at 4:00 p.m. was selected which represents the average time in Malaysia that is prone to weather changes (becoming rainy and cloudy) [31].
Based on Figure 3, the integration of PV sources at load Type A will lead to issues such as high penetration level and intermittency that will cause voltage dynamic concerns (undervoltage, overvoltage and fluctuation). Solely depending on energy storage to address the mentioned problem would eventually deteriorate the lifespan of the battery. Therefore, a grid-feeding mode with VOC control scheme was required to address part of the issue caused by PV integration, mainly involving under and overvoltage problems. However, this work focuses mainly on two scenarios which utilize the hybrid control (VOC and fuzzy control), representing the events of undervoltage, fault and PV intermittency. The following conditions and scope of work are described in Table 6.

2.2. Grid-Feeding Mode on Weak Bus

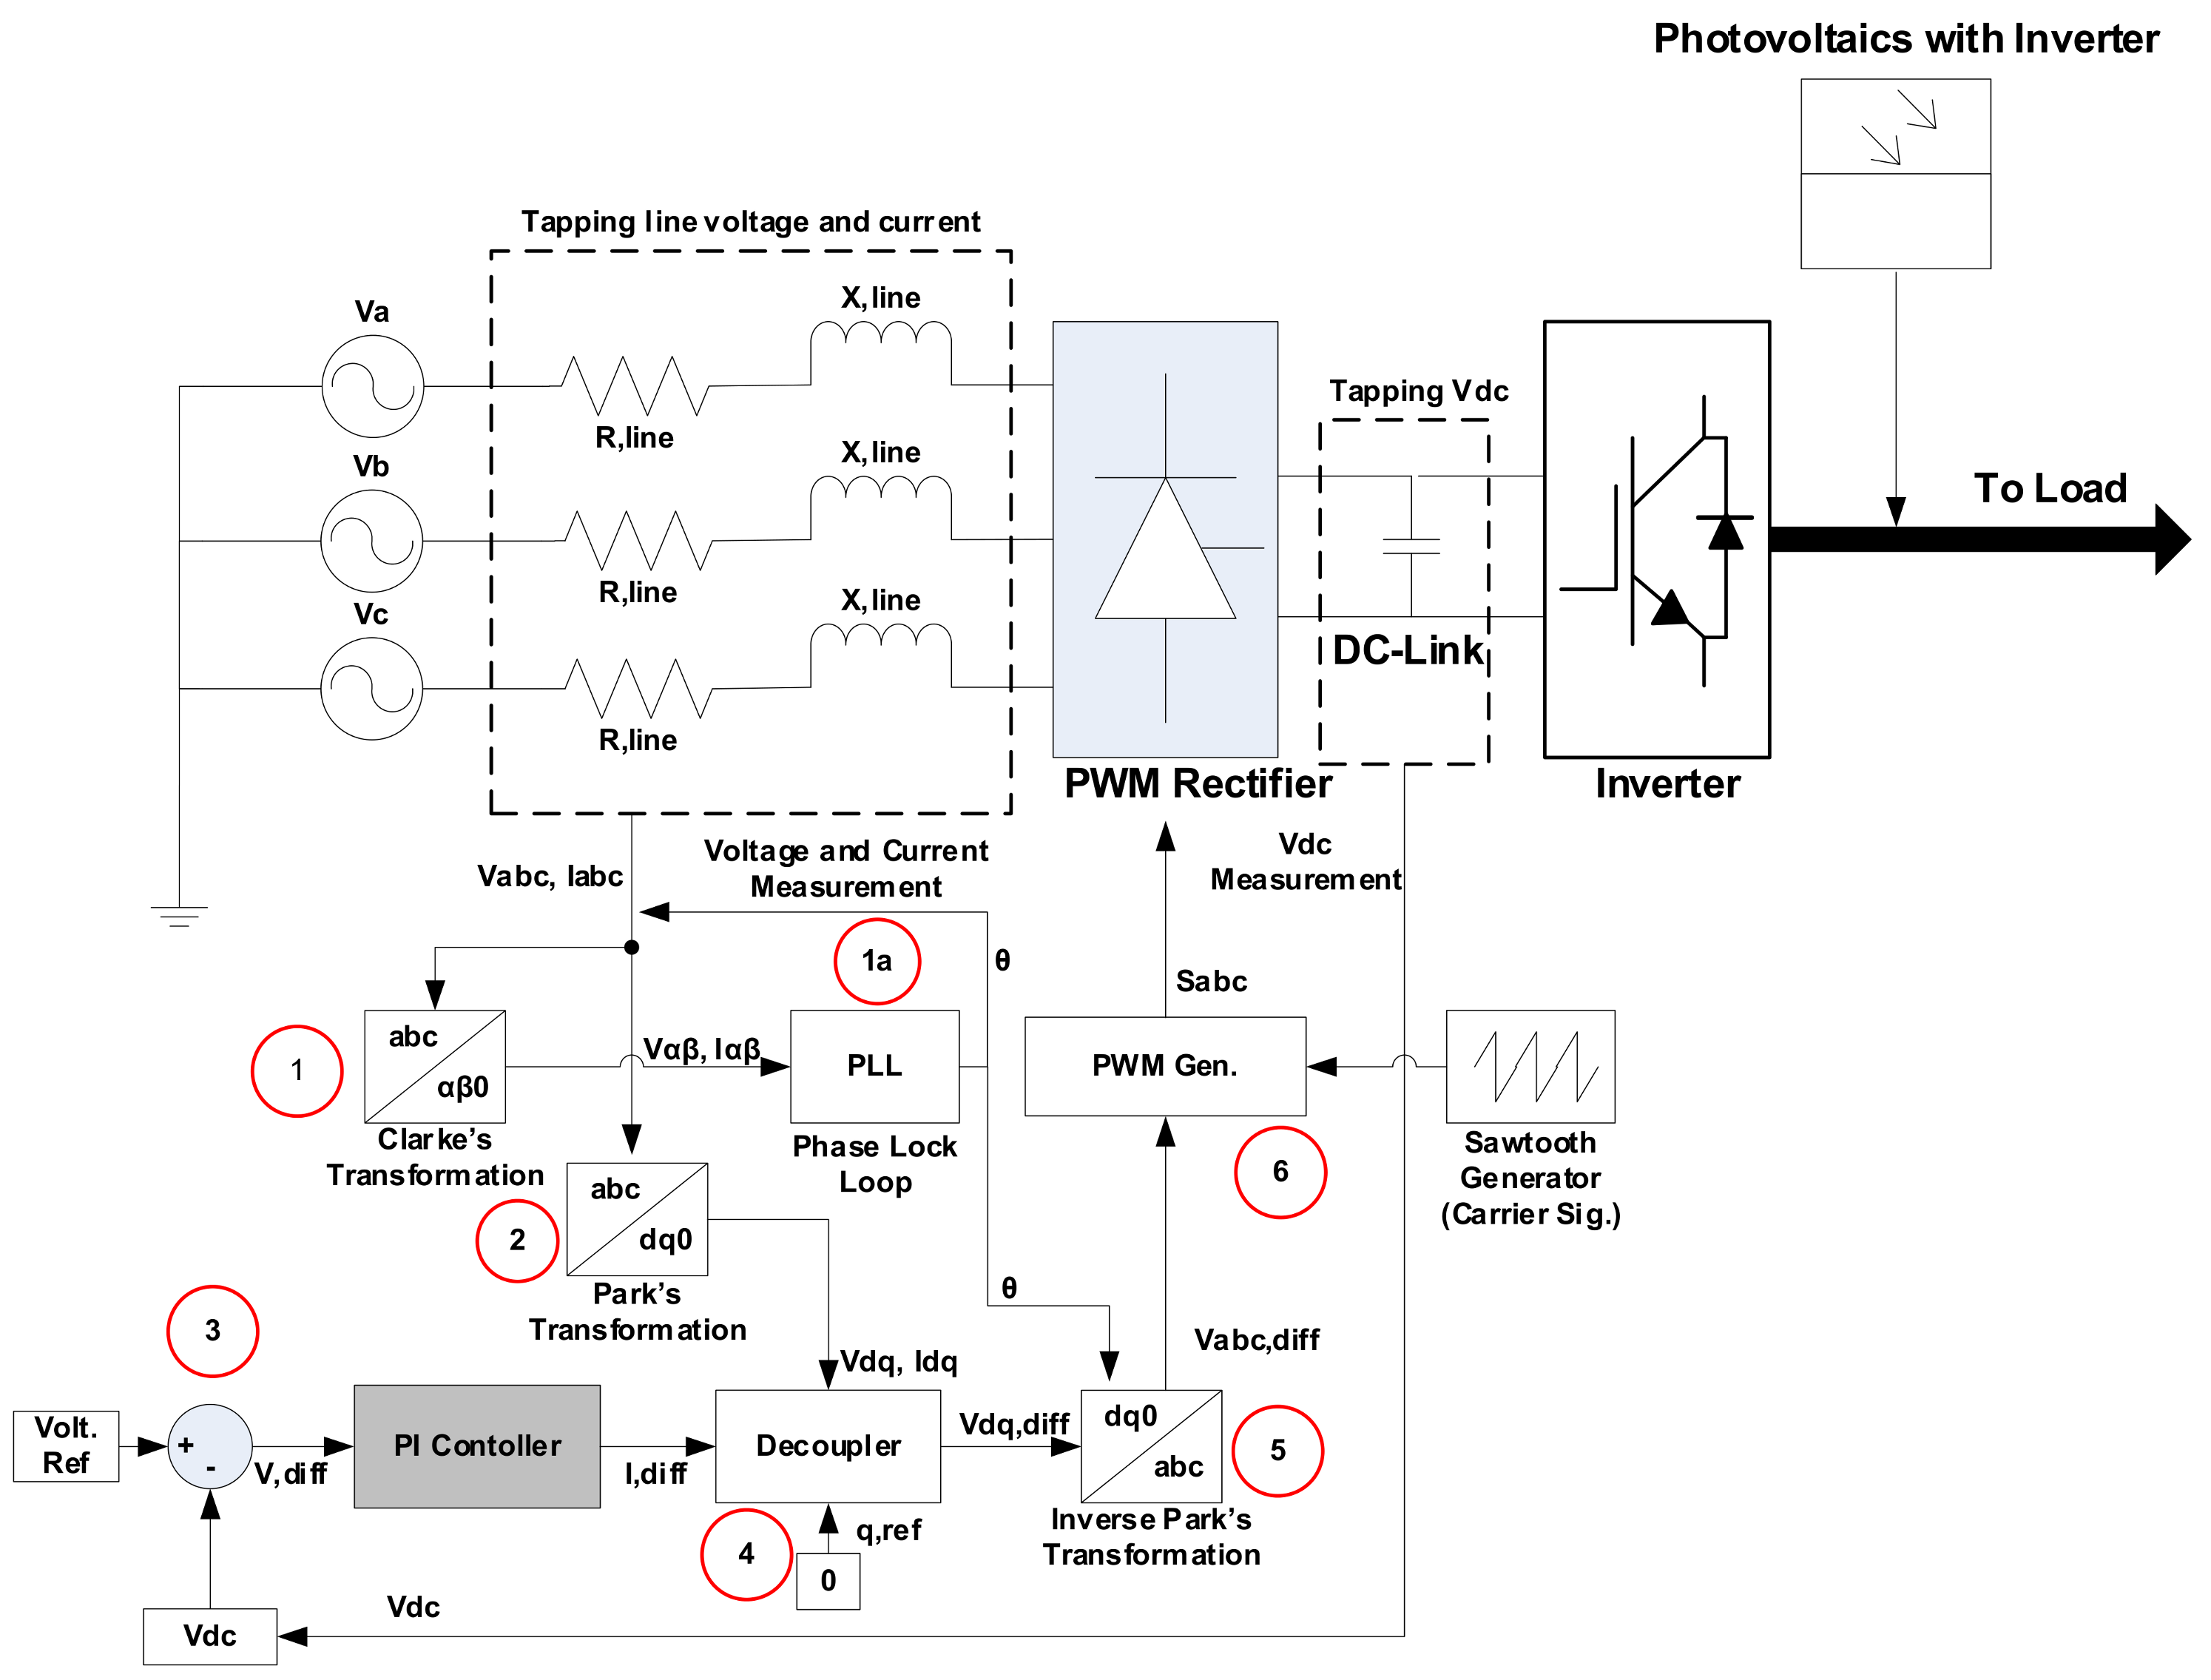
Referring to Figure 4, the grid-feeding mode with VOC control scheme was integrated between the back-to-back converter. The VOC control would obtain the grid line voltage (Vabc) and current (Iabc), then convert it to the form of d-q axis through Clarke (1) and Parks (2) Transformation. Clarke Transformation converts a three-phase system into two component frames (α and β) that were later used in Phase Lock Loop (PLL) (1a) to synchronize signals for simplicity for analysis purposes. The Parks Transformation converts the α-β frame into an orthogonal rotating frame reference (d–q). The transformation was employed to rotate reference frames of an AC waveform into a DC waveform. Simplified calculations could be performed in DC quantities before inverse transforming them to actual three-phase results.
The voltage difference (V, diff) of reference voltage (Volt. Ref) and DC-link voltage (Vdc) (3) were converted into representations of current (I,diff) and then passed through the decoupled controller (4). The decoupled controller prevented mapping of the d-axis onto the q-axis, as that can distort the signal and affect overall effectiveness of the grid-feeding mode. The difference voltage Vdq,diff was transformed back to abc reference signals through an inverse Parks Transformation (5). The inversed abc reference signals were compared with a sawtooth carrier signal to generate “0” or “1” pulses (6) according to the conditions whereby,
Vref > Vcarrier = “1” pulse
Vref < Vcarrier = “0” pulse.
Vref are the voltage references from the output of the controller after the Inverse Park’s Transformation and Vcarrier is the voltage carrier generated from the sawtooth generator.
Lastly, the pulse was sent to the PWM rectifier to perform switching based on the stated condition to regulate the voltage back to the desired voltage level (Volt. Ref) through optimal power dispatch at the DC-link. Despite the grid-feeding mode being able to solve under and overvoltage caused by high PV penetration, it failed to respond to fault conditions and PV intermittency. Hence, hybrid control of grid-feeding mode and fuzzy control for energy storage were modeled onto the weak bus to address the following issues: undervoltage, overvoltage, fault and PV intermittency.

2.3. Grid-Feeding Mode and Energy Storage with Fuzzy Logic Direct Current (DC) Fault Detection Scheme on the Weak Bus

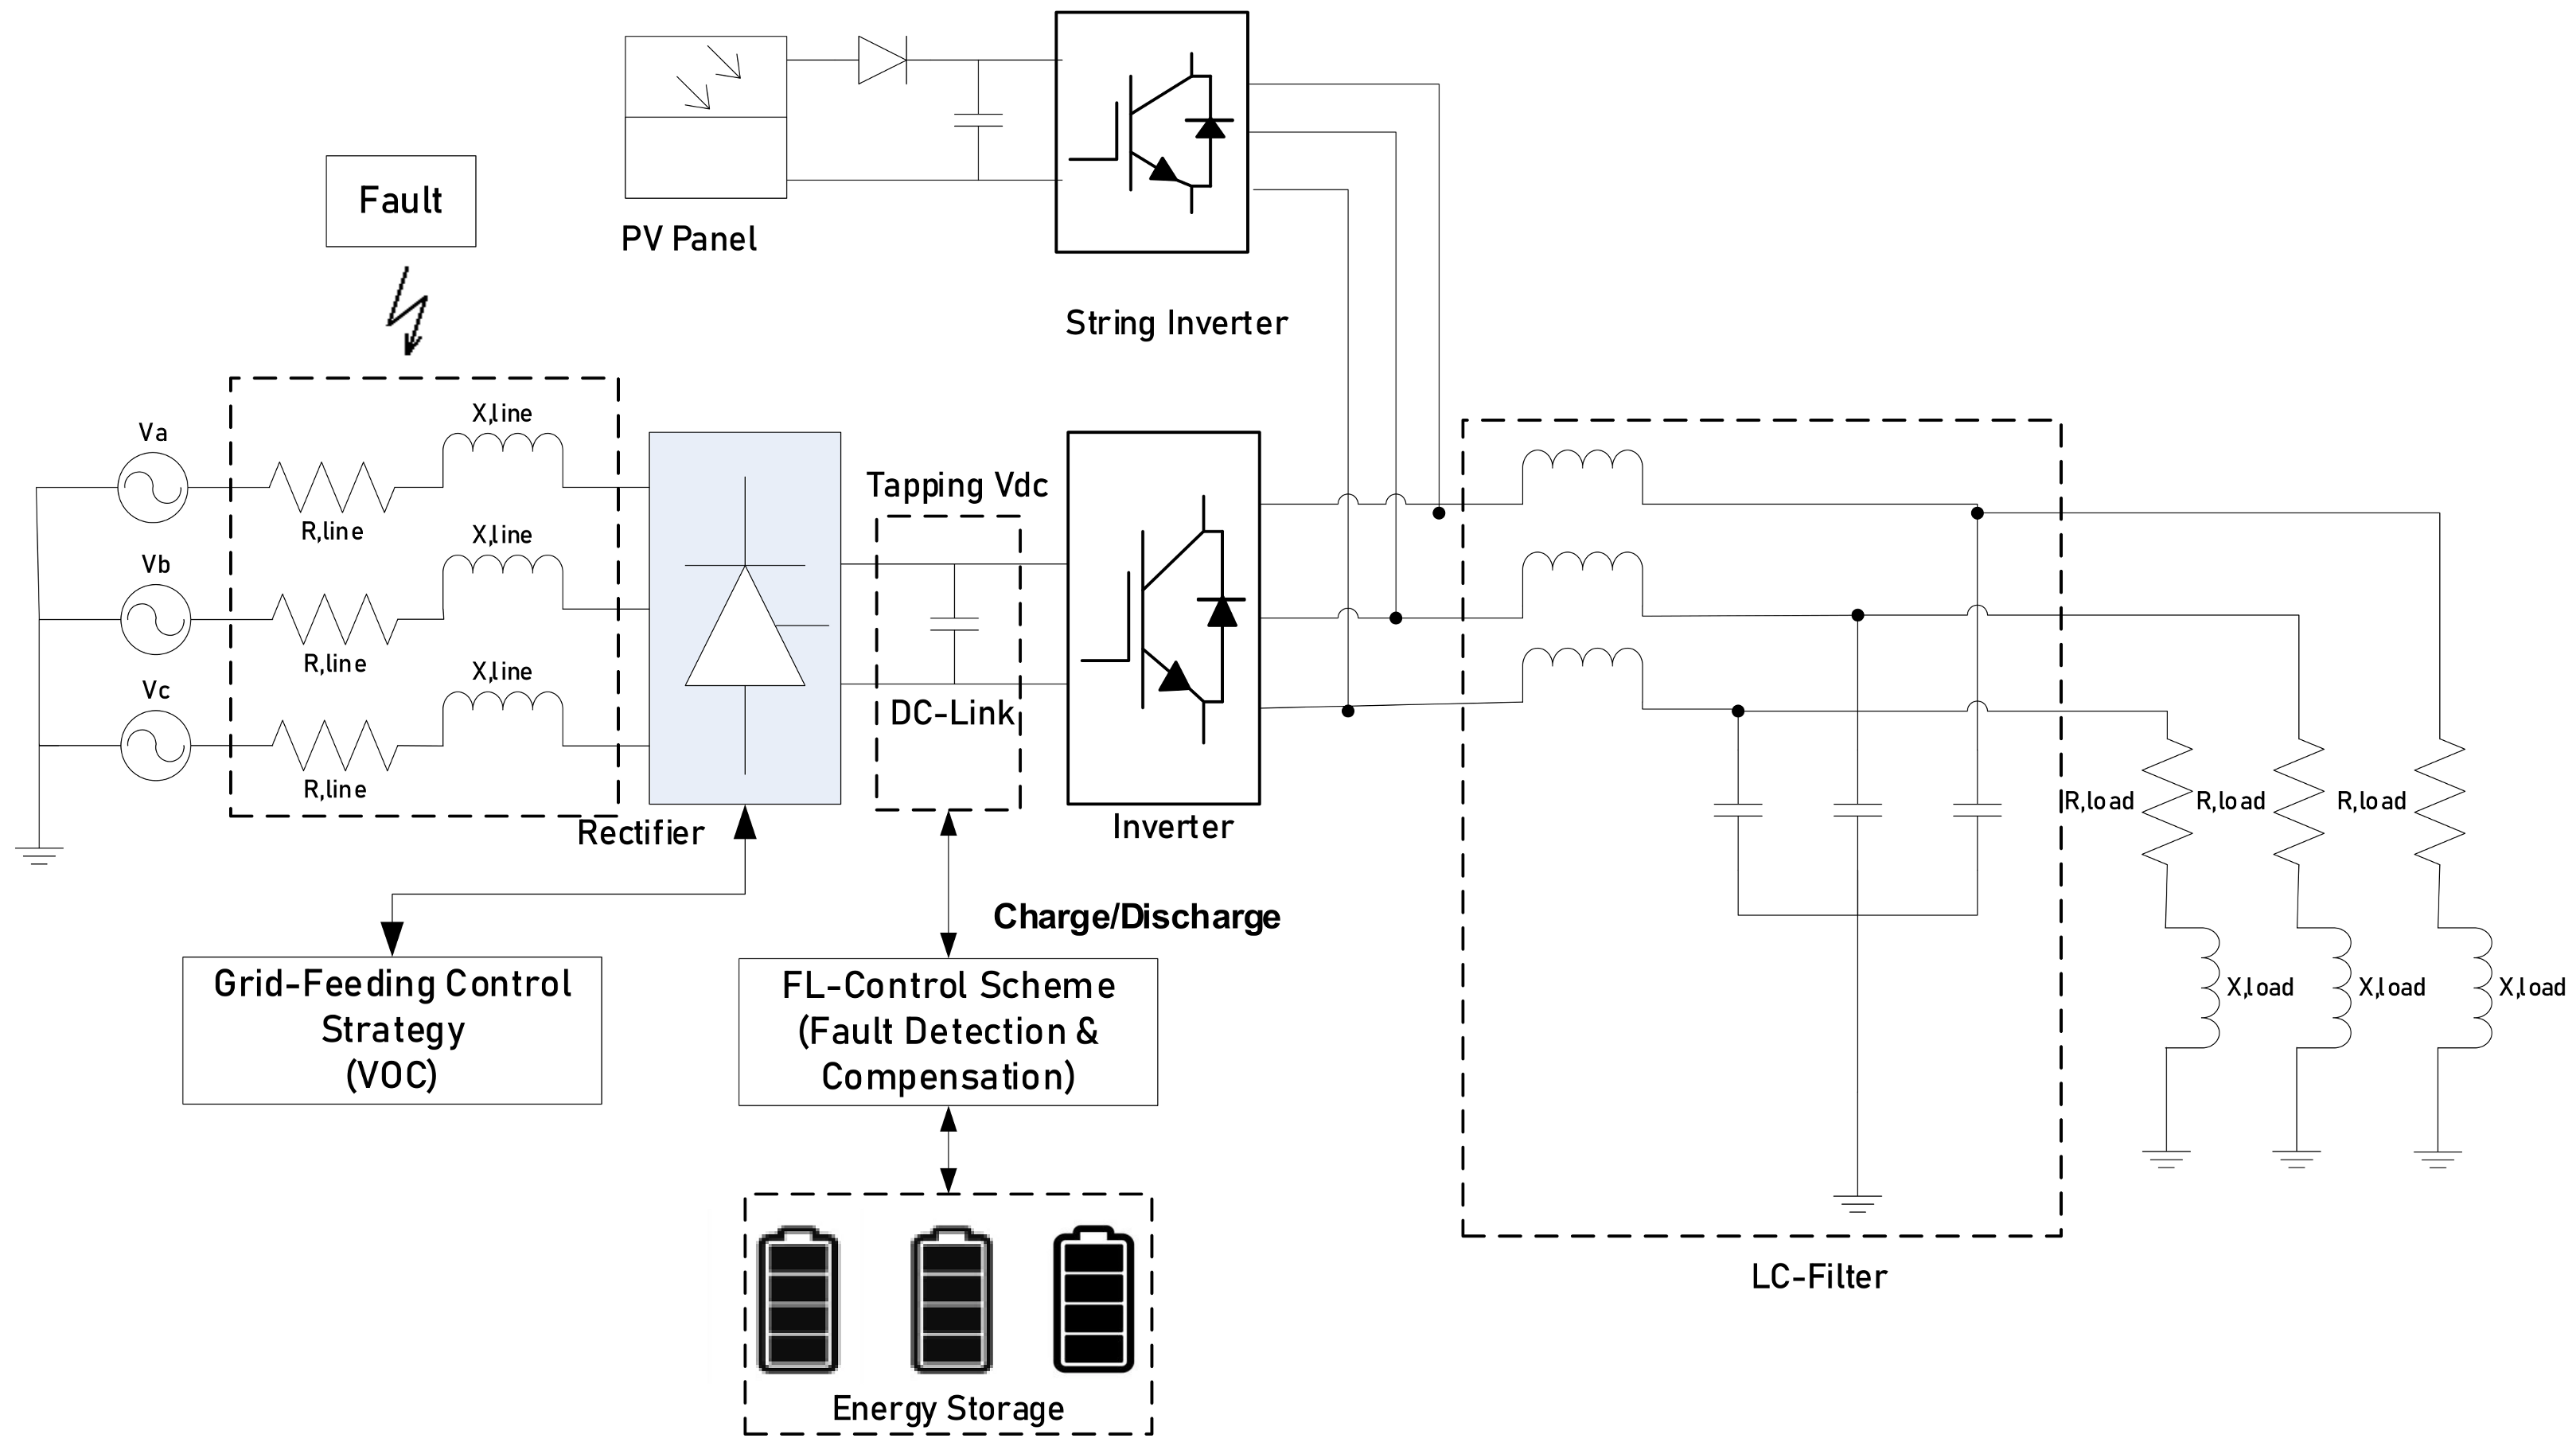
The configuration of both hybrid control, a grid-feeding mode and a fuzzy logic fault detection scheme with energy storage on the weak bus are shown in Figure 5. In a condition whereby there is a high penetration level in the grid, the grid-feeding mode (VOC) regulated the voltage level by charging the DC-link between the back-to-back converter. When the grid voltage experienced undervoltage within the network, the DC-link discharged to attain its nominal voltage value. Unfortunately, this would not be possible when the grid is experiencing a fault condition or PV intermittency. Therefore, a fault-compensation scheme was introduced to address the problem above. This demonstrated the importance of having a hybrid control (grid-feeding and fault compensation) to solve voltage dynamics without overstraining the energy storage.
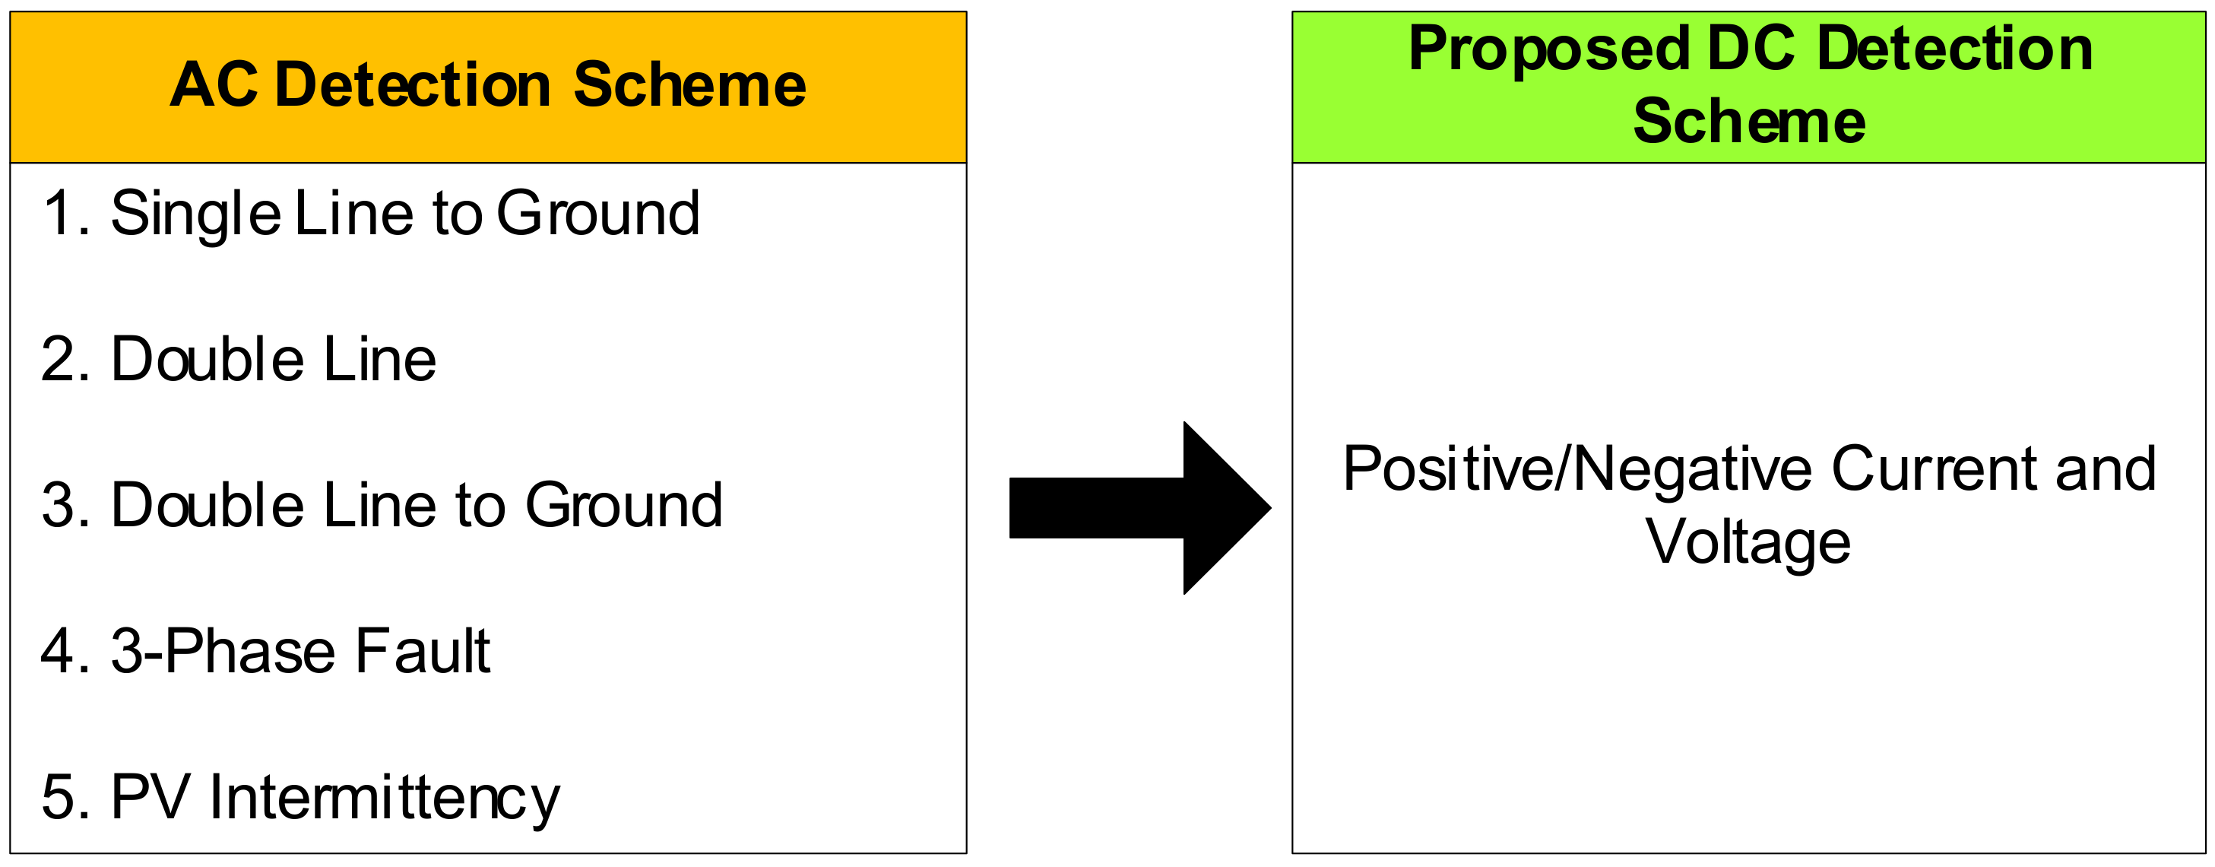
A fault-compensation control scheme would need to achieve a faster detection method and the ability to adapt towards grid changes in load or any sources. Therefore, fuzzy logic (FL) was selected as the control scheme prior to fault/voltage fluctuation detection in this work. For a conventional AC fault detection scheme, four representation of inputs (phase A, B, C and neutral) are required, which includes the current and voltage signal for each phase. However, the combination of both grid-feeding and an FL control scheme used in this work require only two inputs taken from the DC-link, which are the DC voltage and current. This is due to both DC voltage and current exhibiting fault characteristics relative to AC signals but in a simplified manner. In addition, the DC current signal could act as an auxiliary indicator for the fuzzy control to avoid miscomputation.
The comparison between conventional AC and the proposed DC fault detection are listed in Figure 6. The proposed DC fault detection minimized the computational load, compensation speed and complexity of the overall system.
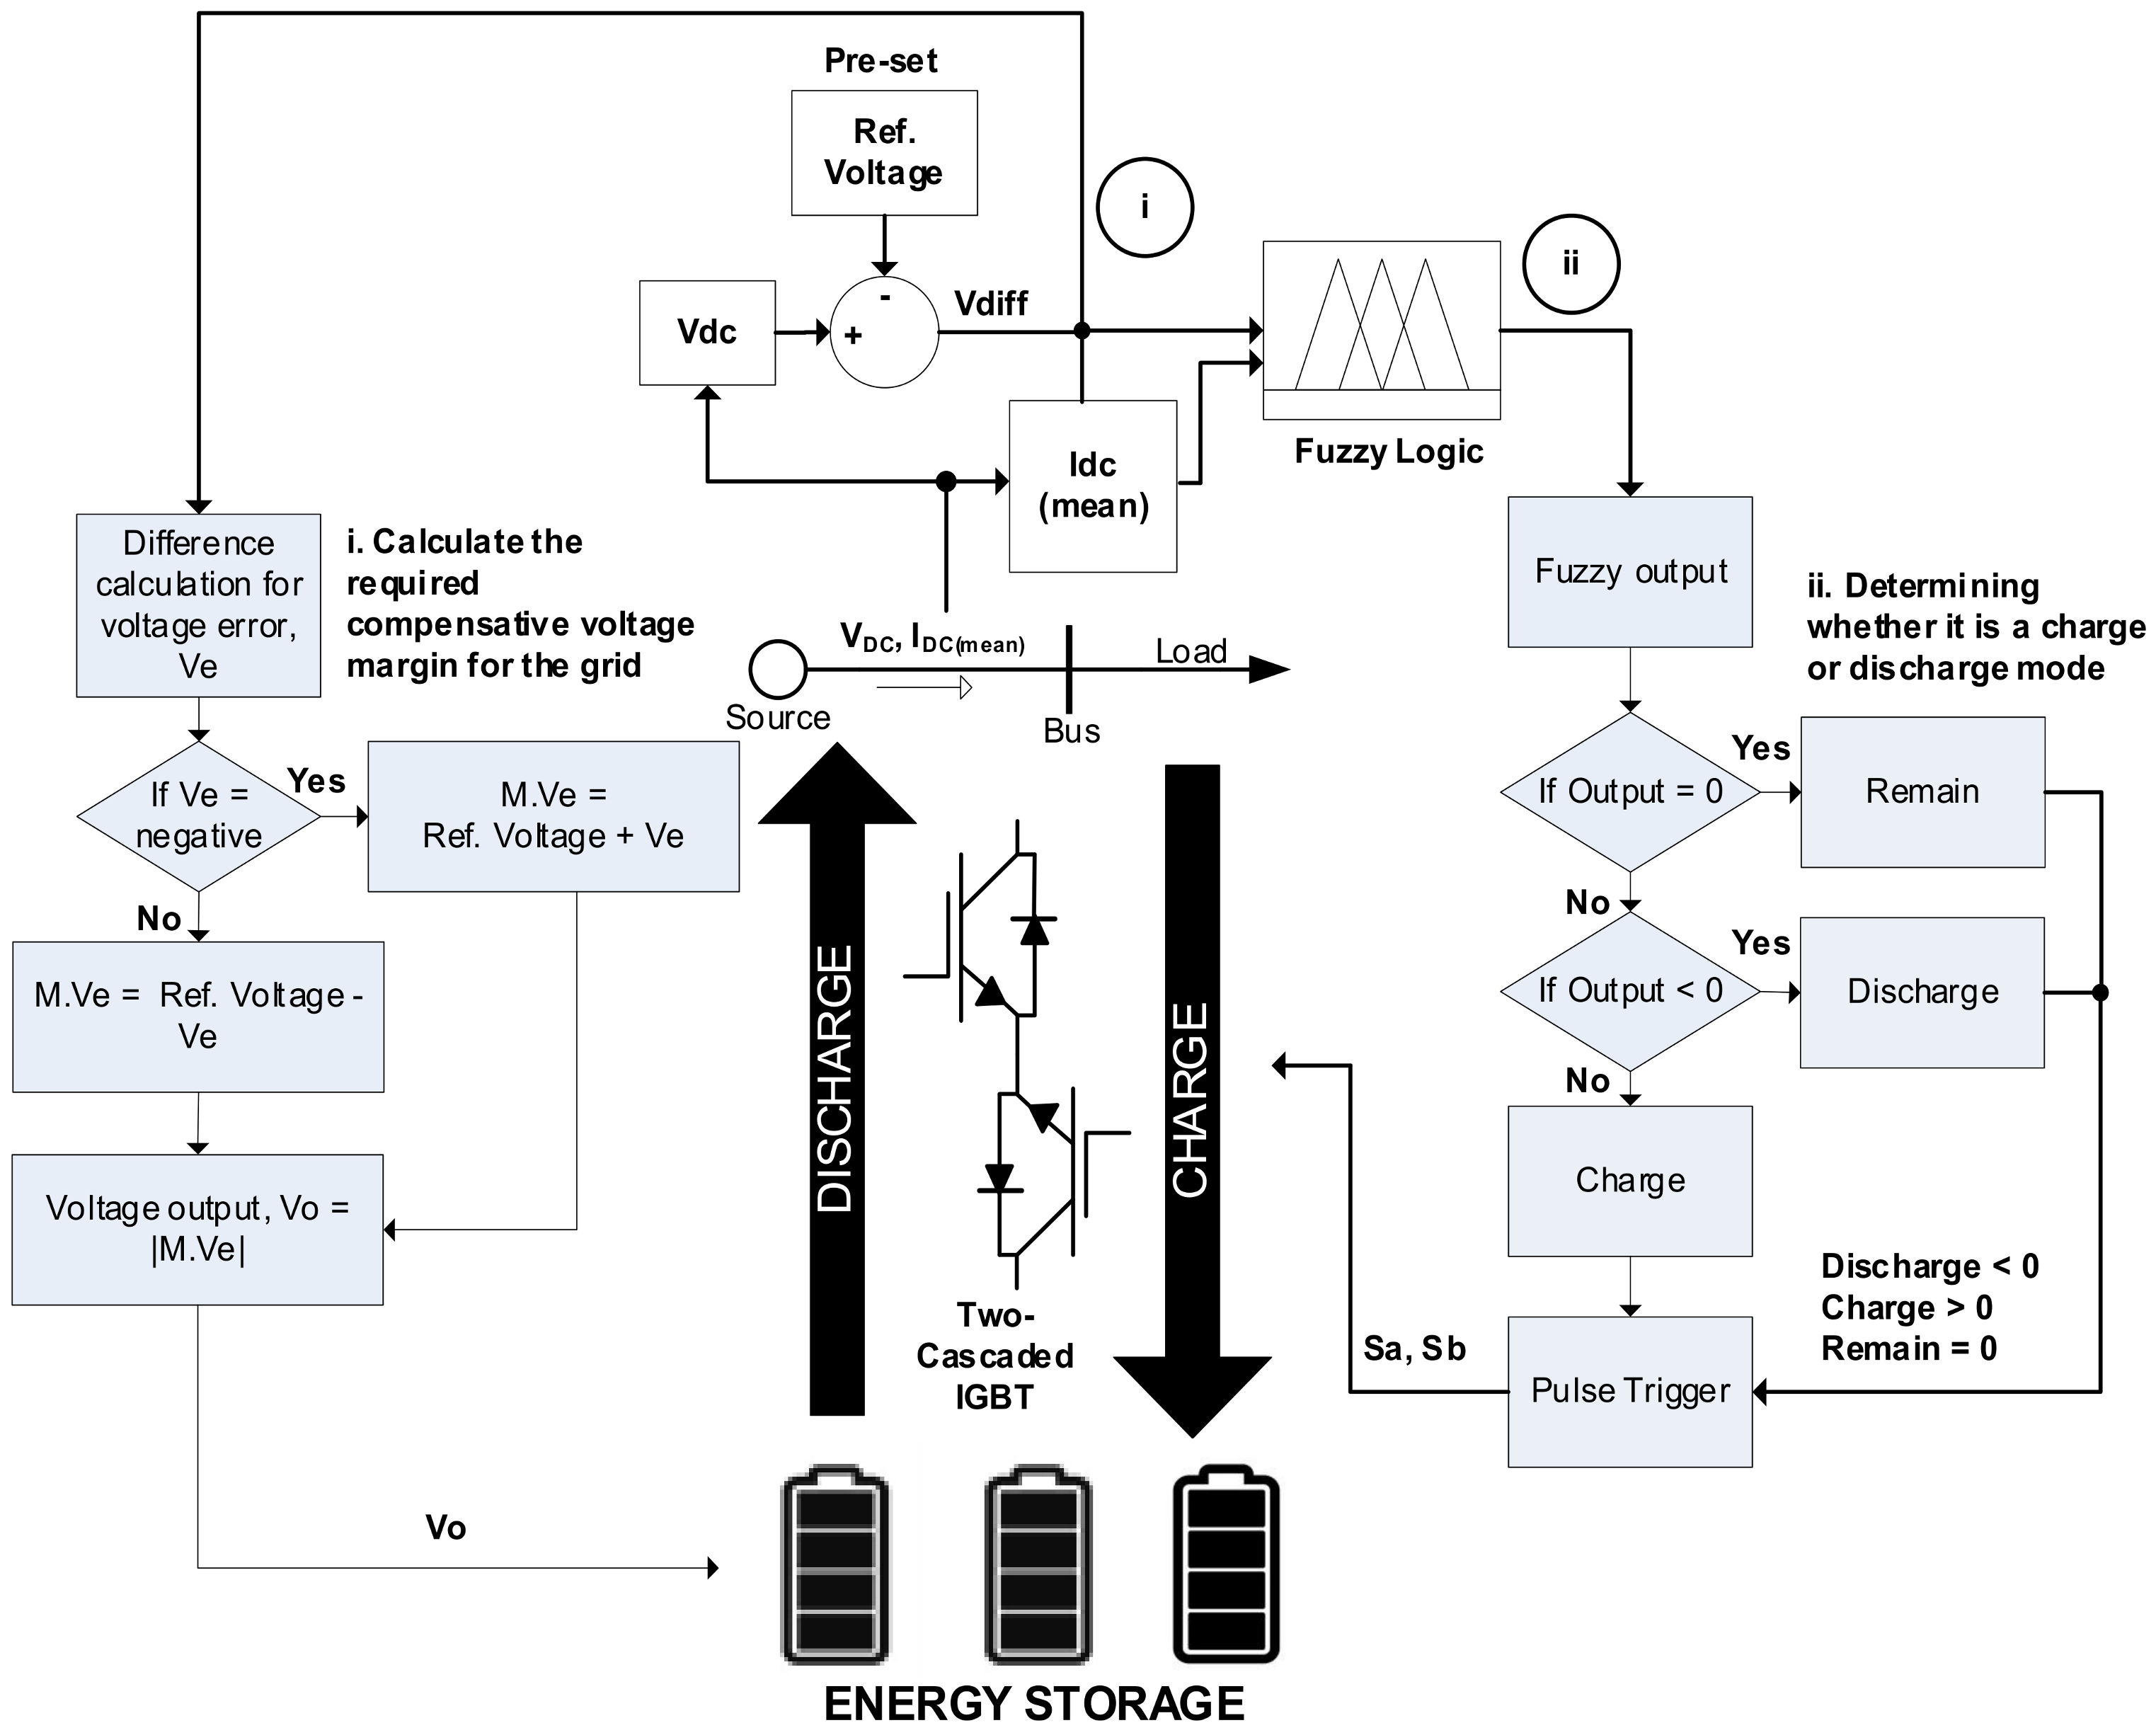
The FL control scheme of the energy storage shown in Figure 7 consists of two main parts: calculation of the energy storage compensation margin and the computation of fuzzy logic. The first part (i) of the calculation of energy storage margin obtained the difference (Ve) between voltage at DC-link (Vdc) from the grid and the ref. voltage (Vref). In the event of voltage sag being present in the grid, the difference between Vref and Vdc would be a negative value. Likewise, the difference between Vref and Vdc would be a positive value in the events of voltage swell. The computed voltage margin magnitude (M.Ve) was added to the reference voltage (Vref) to acquire the new voltage output (Vo) as the compensation value for the energy storage. The fuzzy logic part (ii) was computed based on two inputs from the DC-link, which are the difference voltage (Ve) and mean current (I_mean). The reason for selecting I_mean is that it has a lesser ripple as compared to DC-link current (Idc), which leads to a more accurate computation. The two inputs of fuzzy exhibit the behavior of fault and PV intermittency, which eliminates unnecessary operations other than fault and intermittency conditions. Next, each input was represented in three membership functions classified as (i) Low (VL/IL), (ii) Normal (VN/IN) and (iii) High (VH/IH). From three membership function with two inputs, this formed nine rules (Knowledge-Based) in total, as shown in Table 7.
The output of the fuzzy logic displayed three conditions which reflects the state of operation (SoO) of the energy storage: (i) Discharge (DISC), (ii) Remain (N) and (iii) Charge (C). For an example, when Ve was low (VL) and Im was low (IL), the SoO of the output was DISC. The overall representation of two inputs and one output of the FL controller is illustrated in Figure 8.

3. Results

3.1. L-G Fault

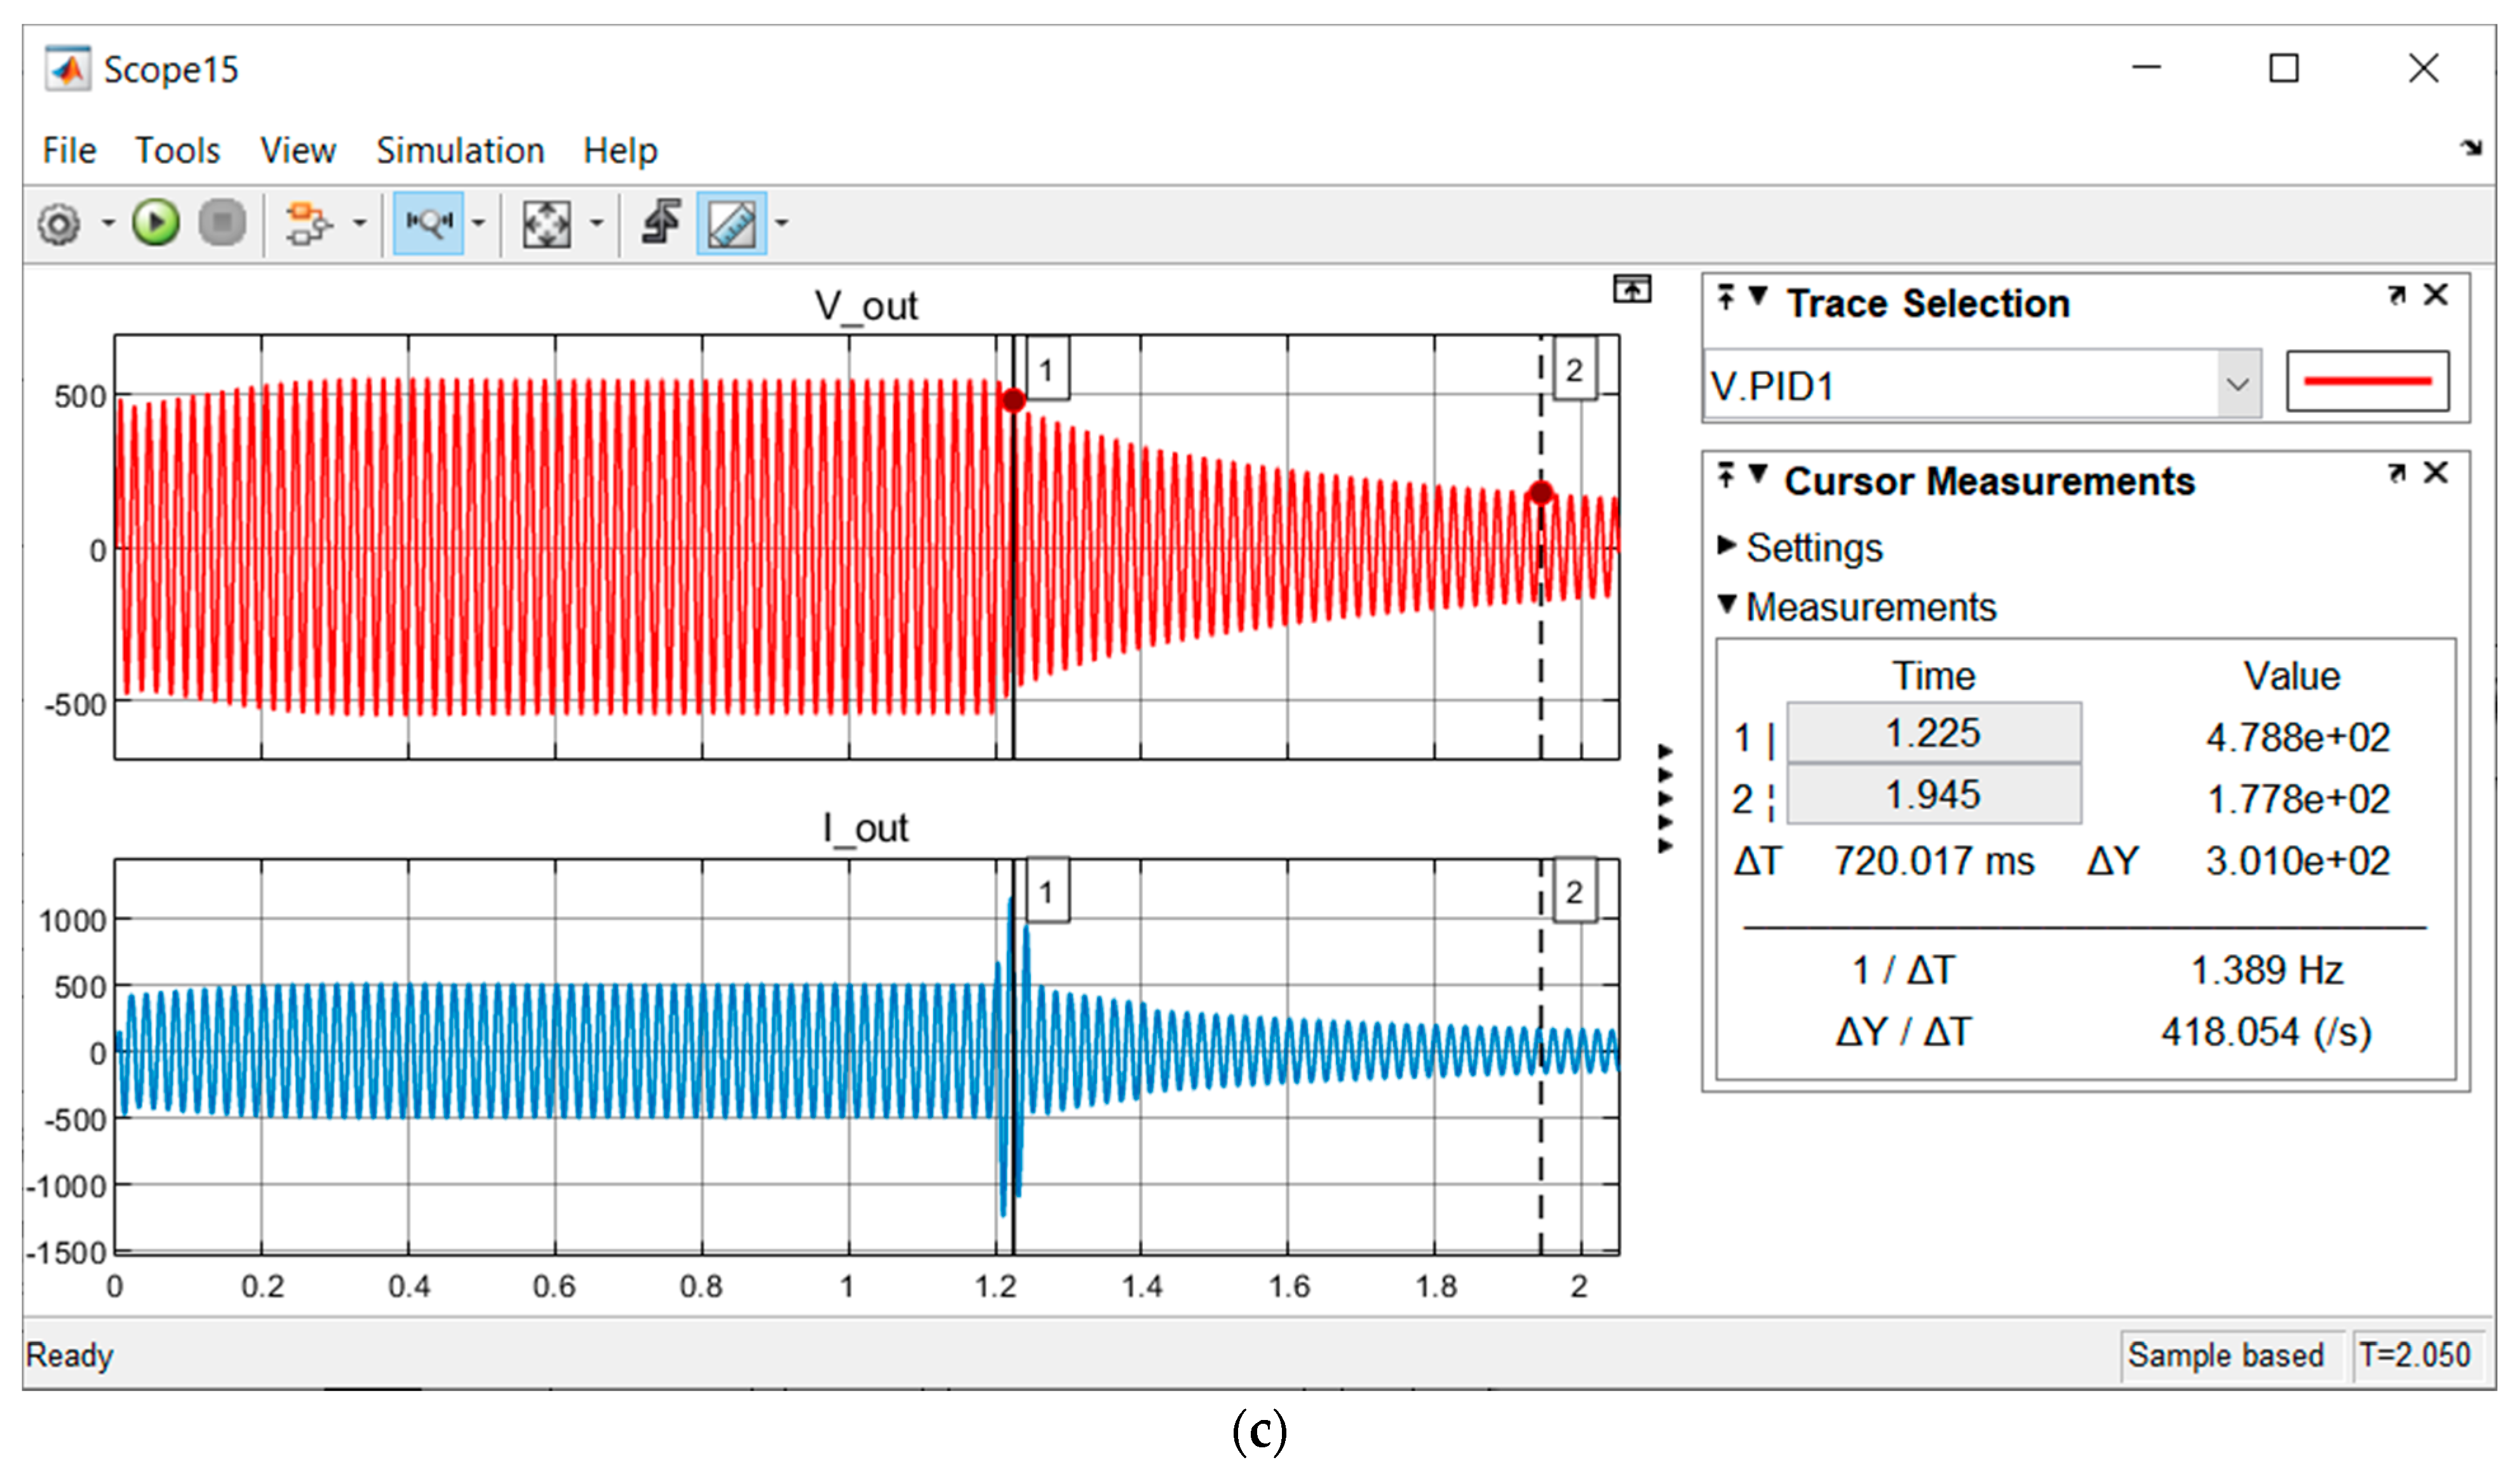
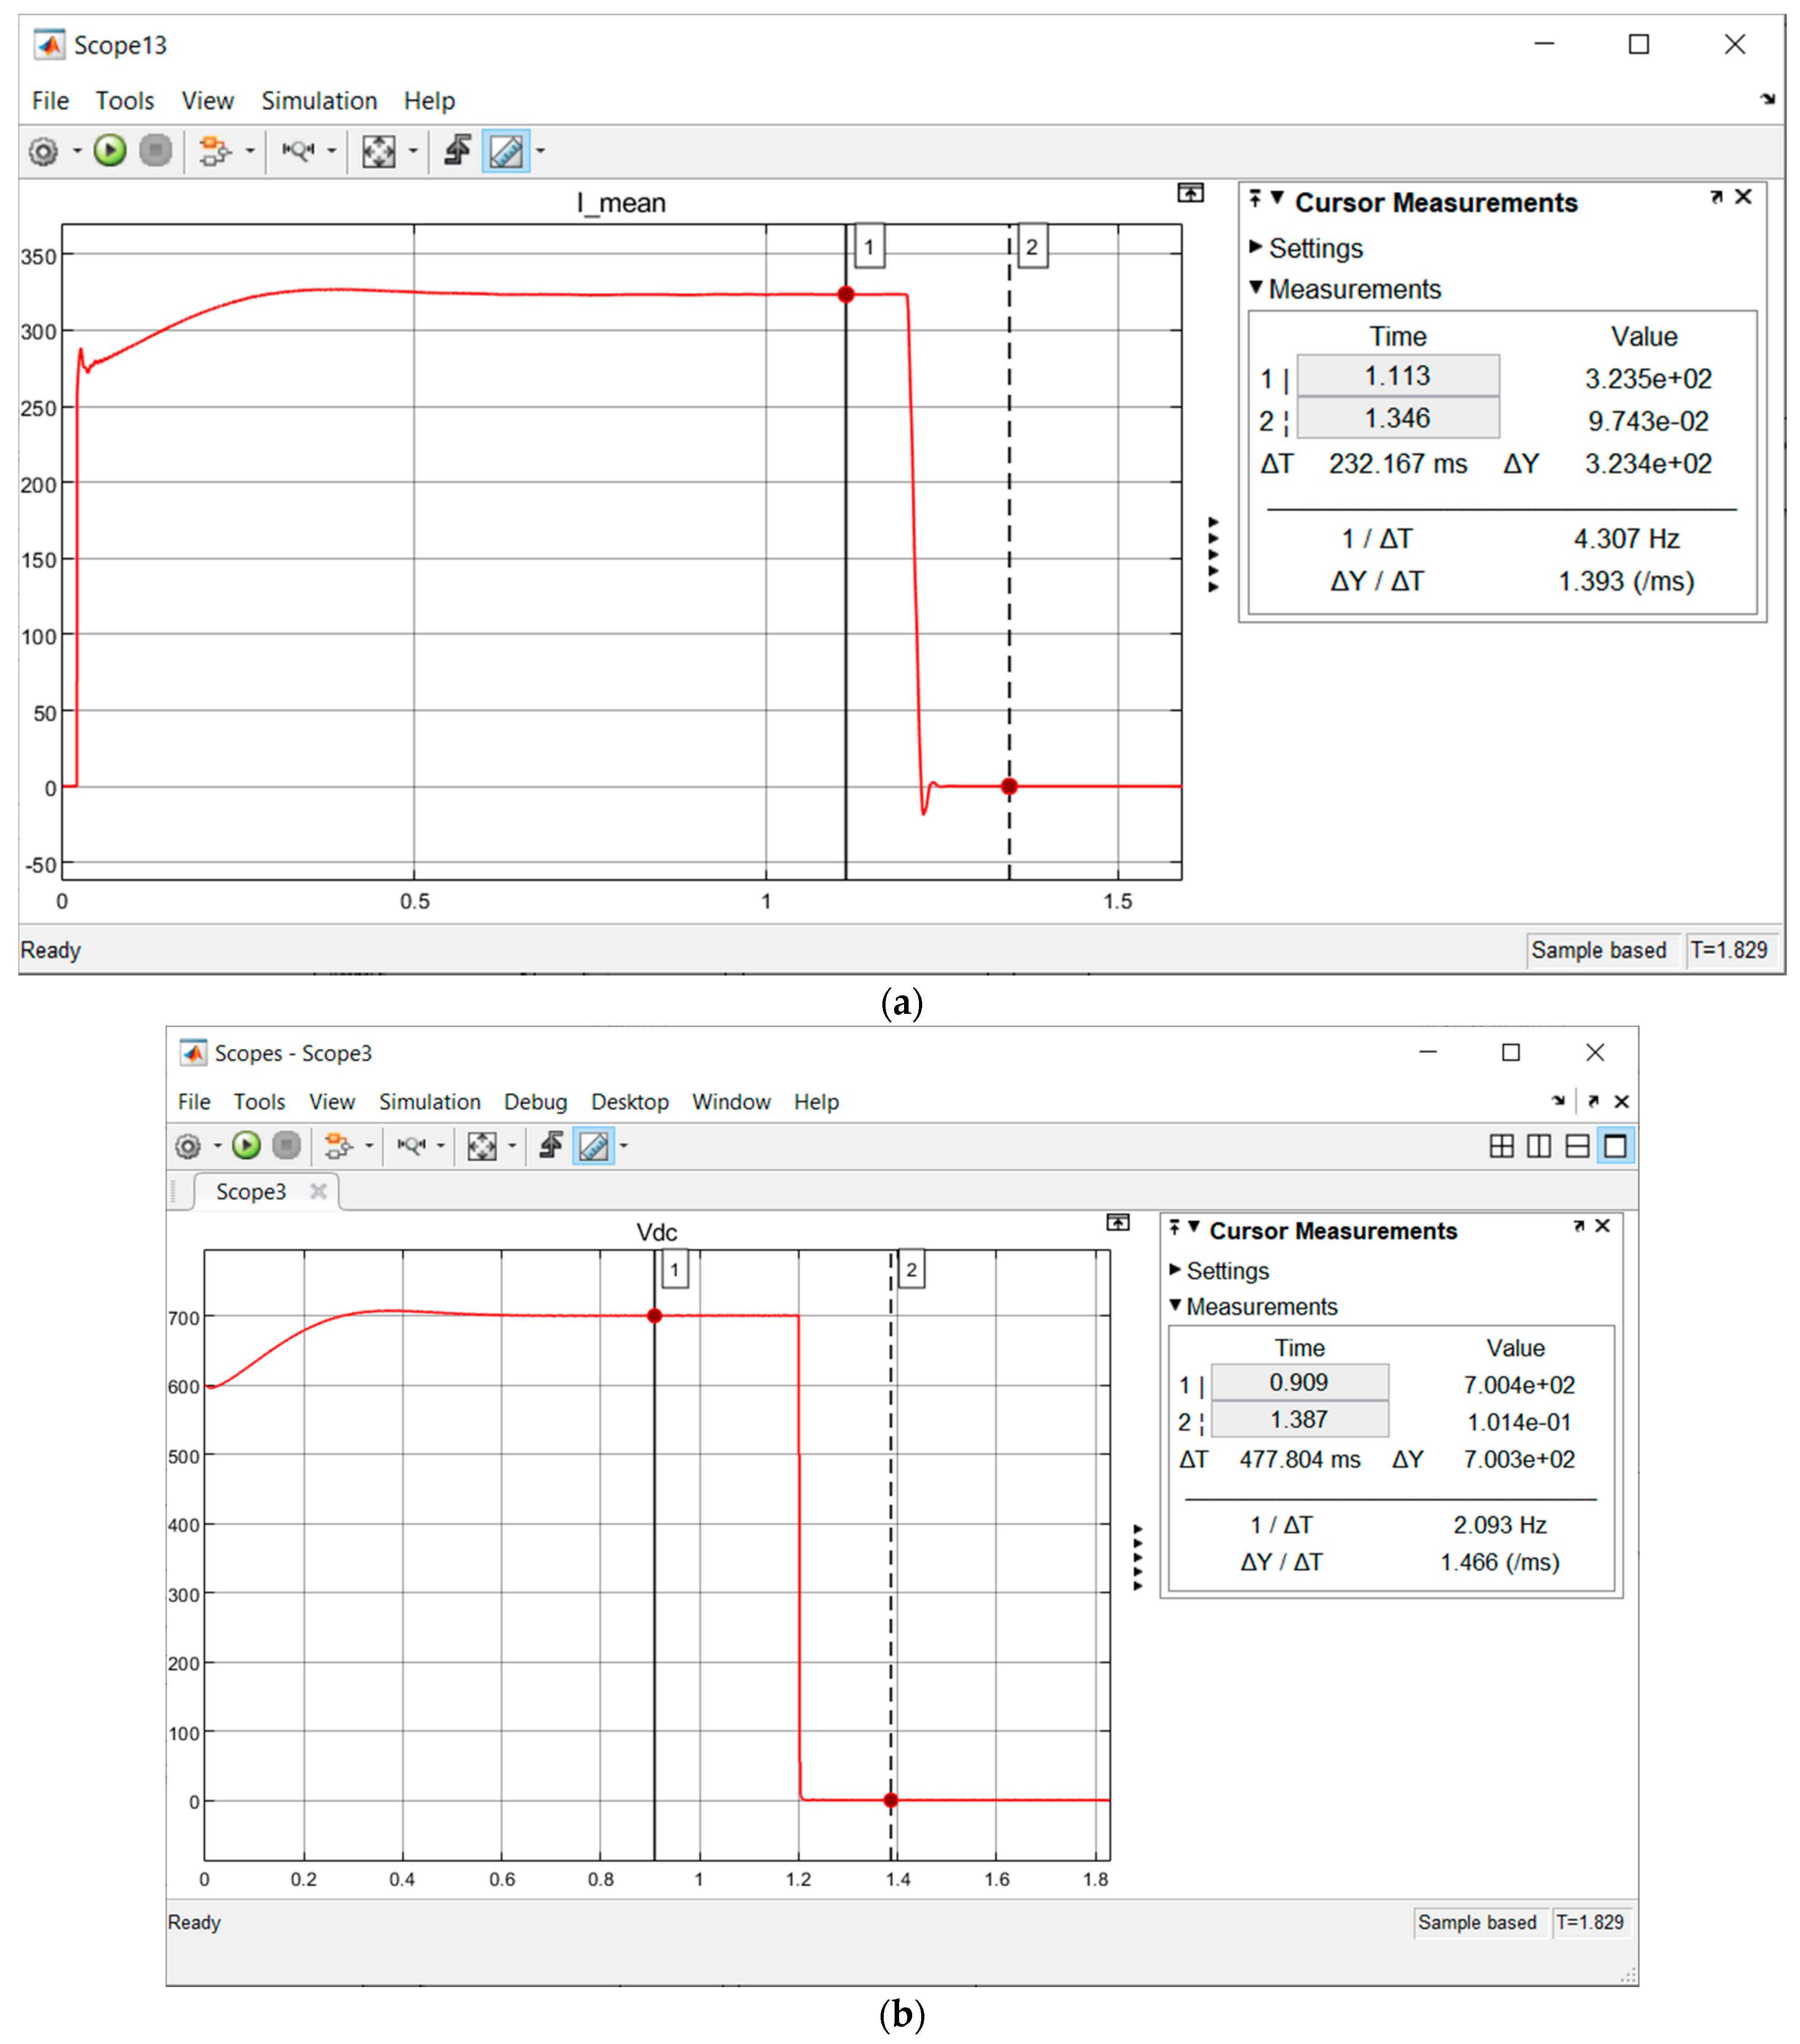
The results obtained for L-G, L-L, L-L-G and three-phase fault were based on Case 1 where the weather condition is rainy and there is no PV generation. Throughout the simulation time (0–7 s), the L-G fault period wa set from 1.2–1.4 s. In Figure 9a, initially before the fault occurred, VOC could regulate the Vdc voltage to the reference value at 700 V by VOC through power dispatch of the DC-Link. Without VOC control, the system experienced serious undervoltage with an output of 320 Vpeak (nominal voltage requires at least 531.1 Vpeak). This was due to the disruption of PV generation during the rainy scenario, causing the supply to fail to fulfil the heavy load demand through the long span (10 km) of line distance. However, the grid-feeding mode (VOC) could not react to a fault condition, causing a steep voltage drop at the Vdc, as shown in Figure 9a. This also led to fluctuation followed by a decreasing value for I_mean after 1.2 s, as shown in Figure 9b. Reduction of the voltage and current output (Vout and Iout) beyond −6% can be observed in Figure 9c. The Vdc reference voltage was set at 700 V to cater for losses at the LC filter so that the desired AC output (V_out) would be 565 Vpeak. The range of safe voltage margin for the Malaysian Distribution Network was within +10% (621.5 Vpeak) and −6% (531.1 Vpeak) based on a 565 Vpeak.
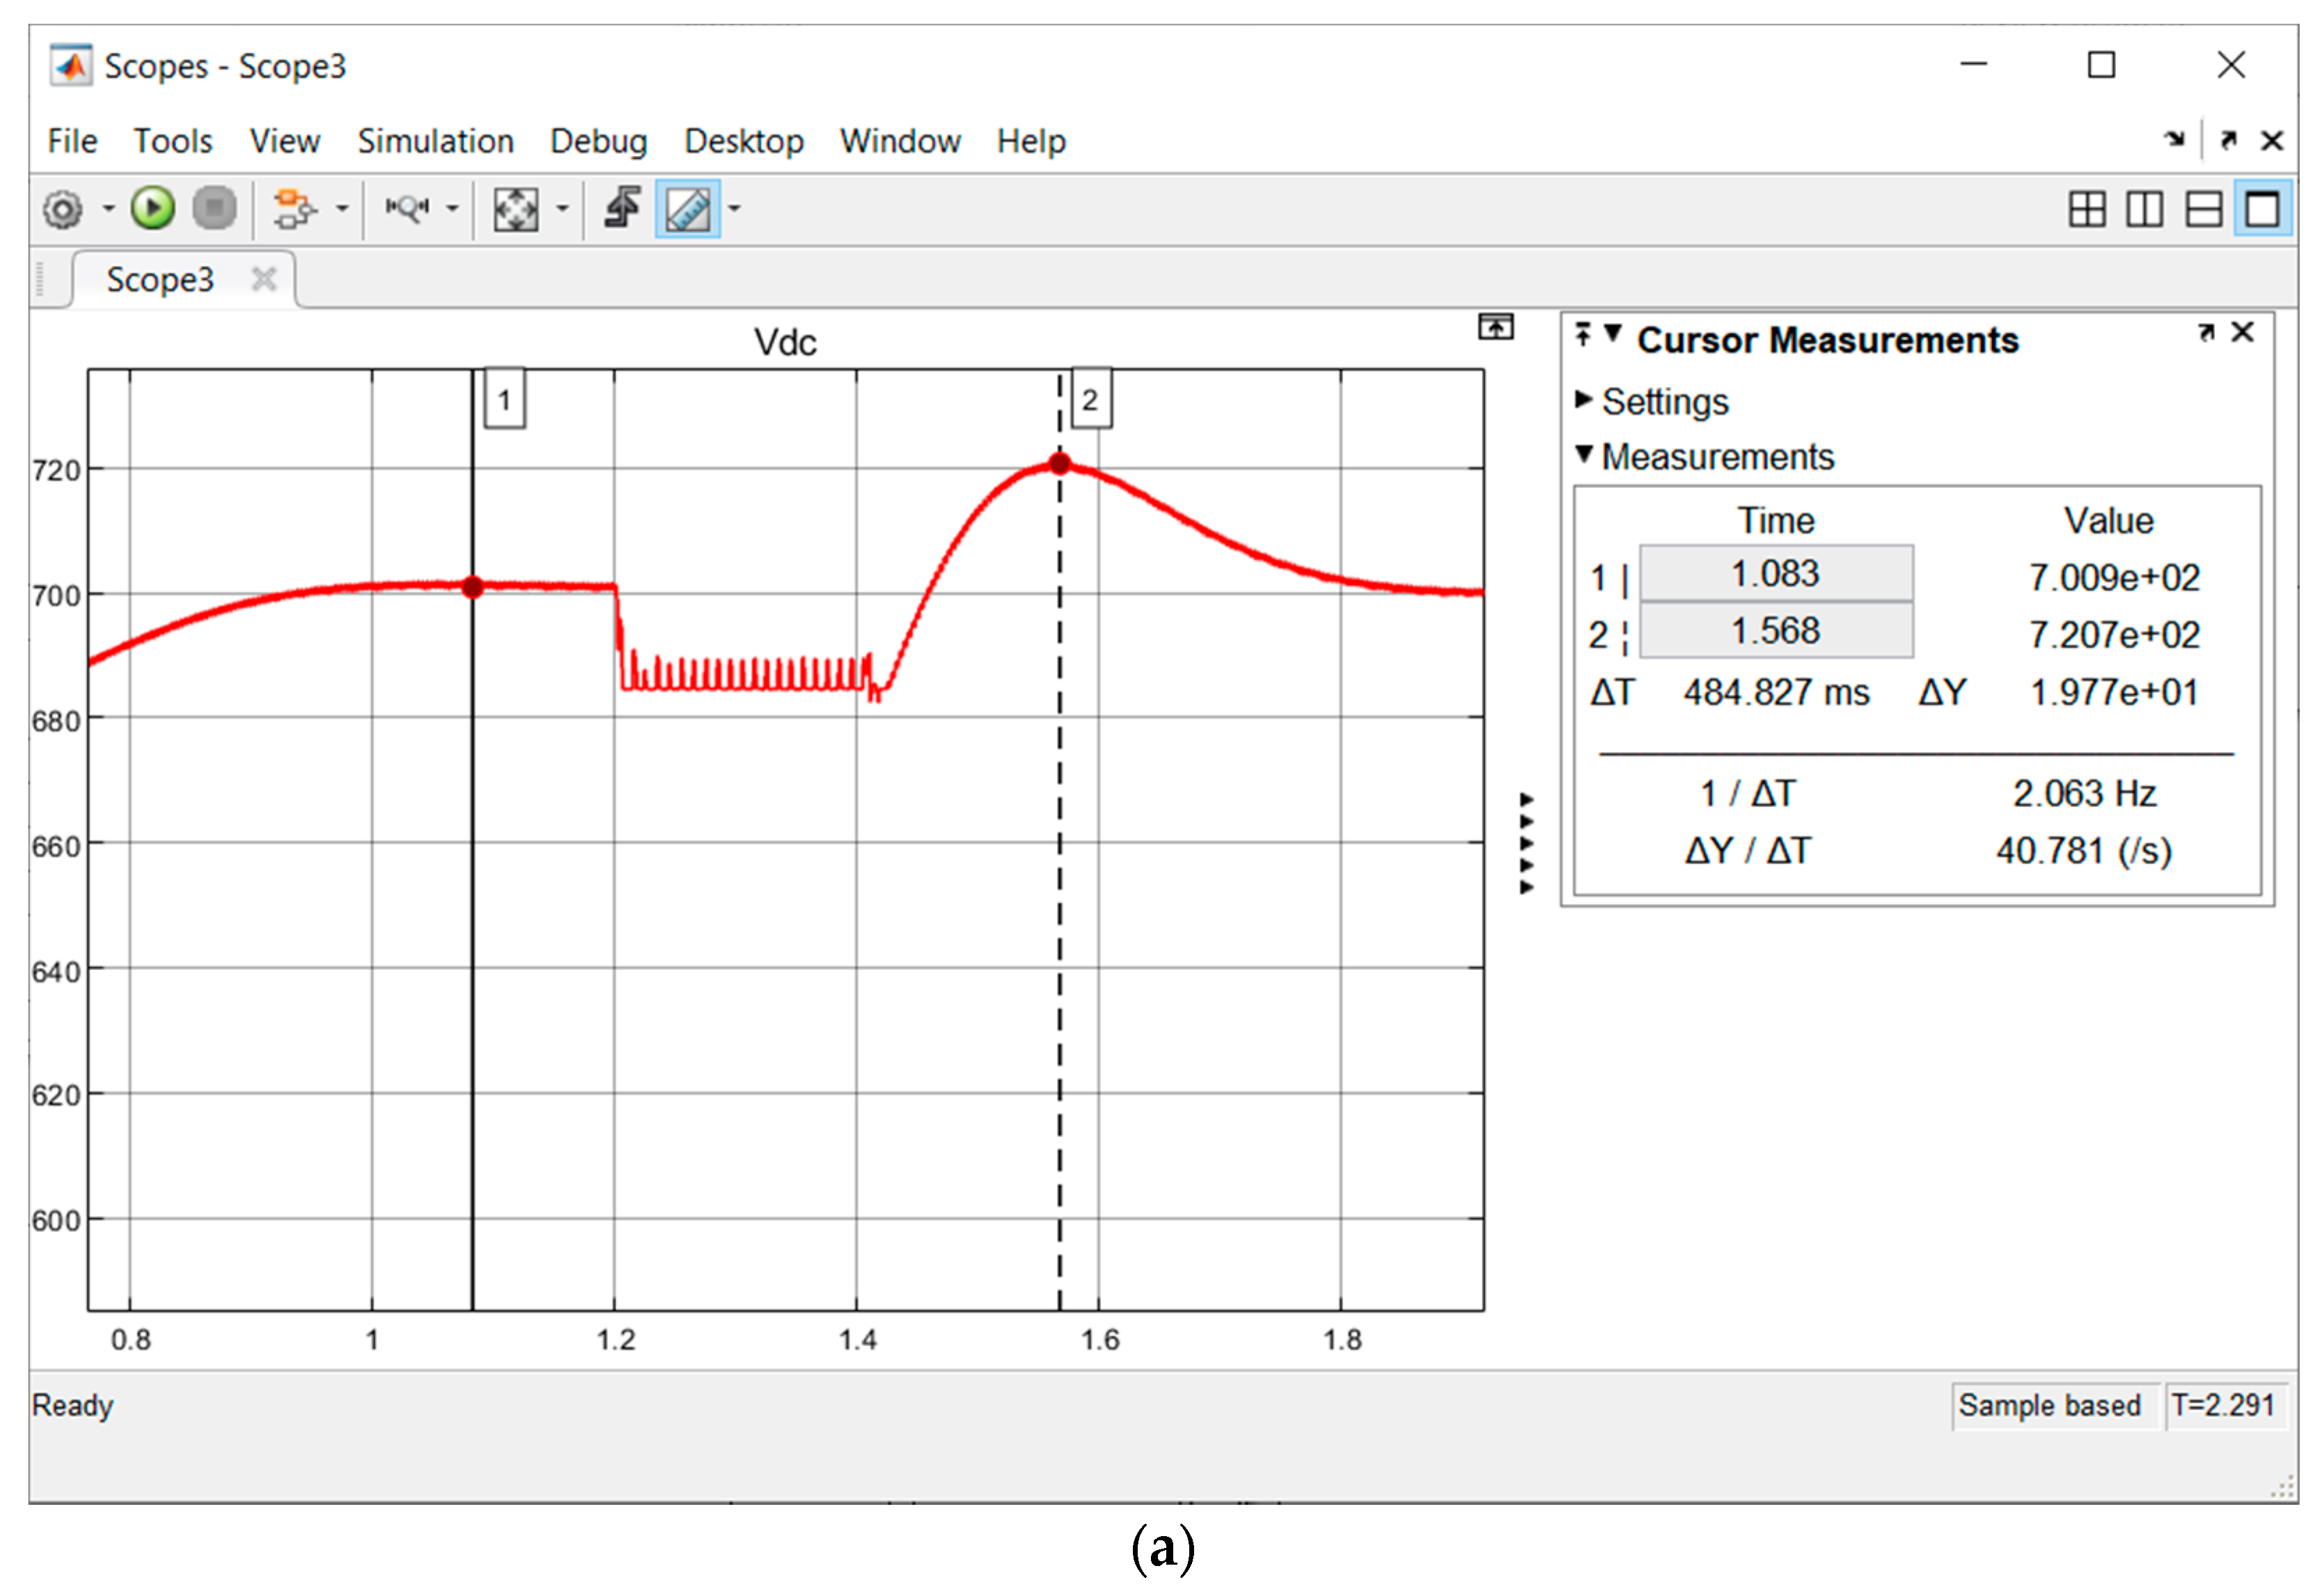
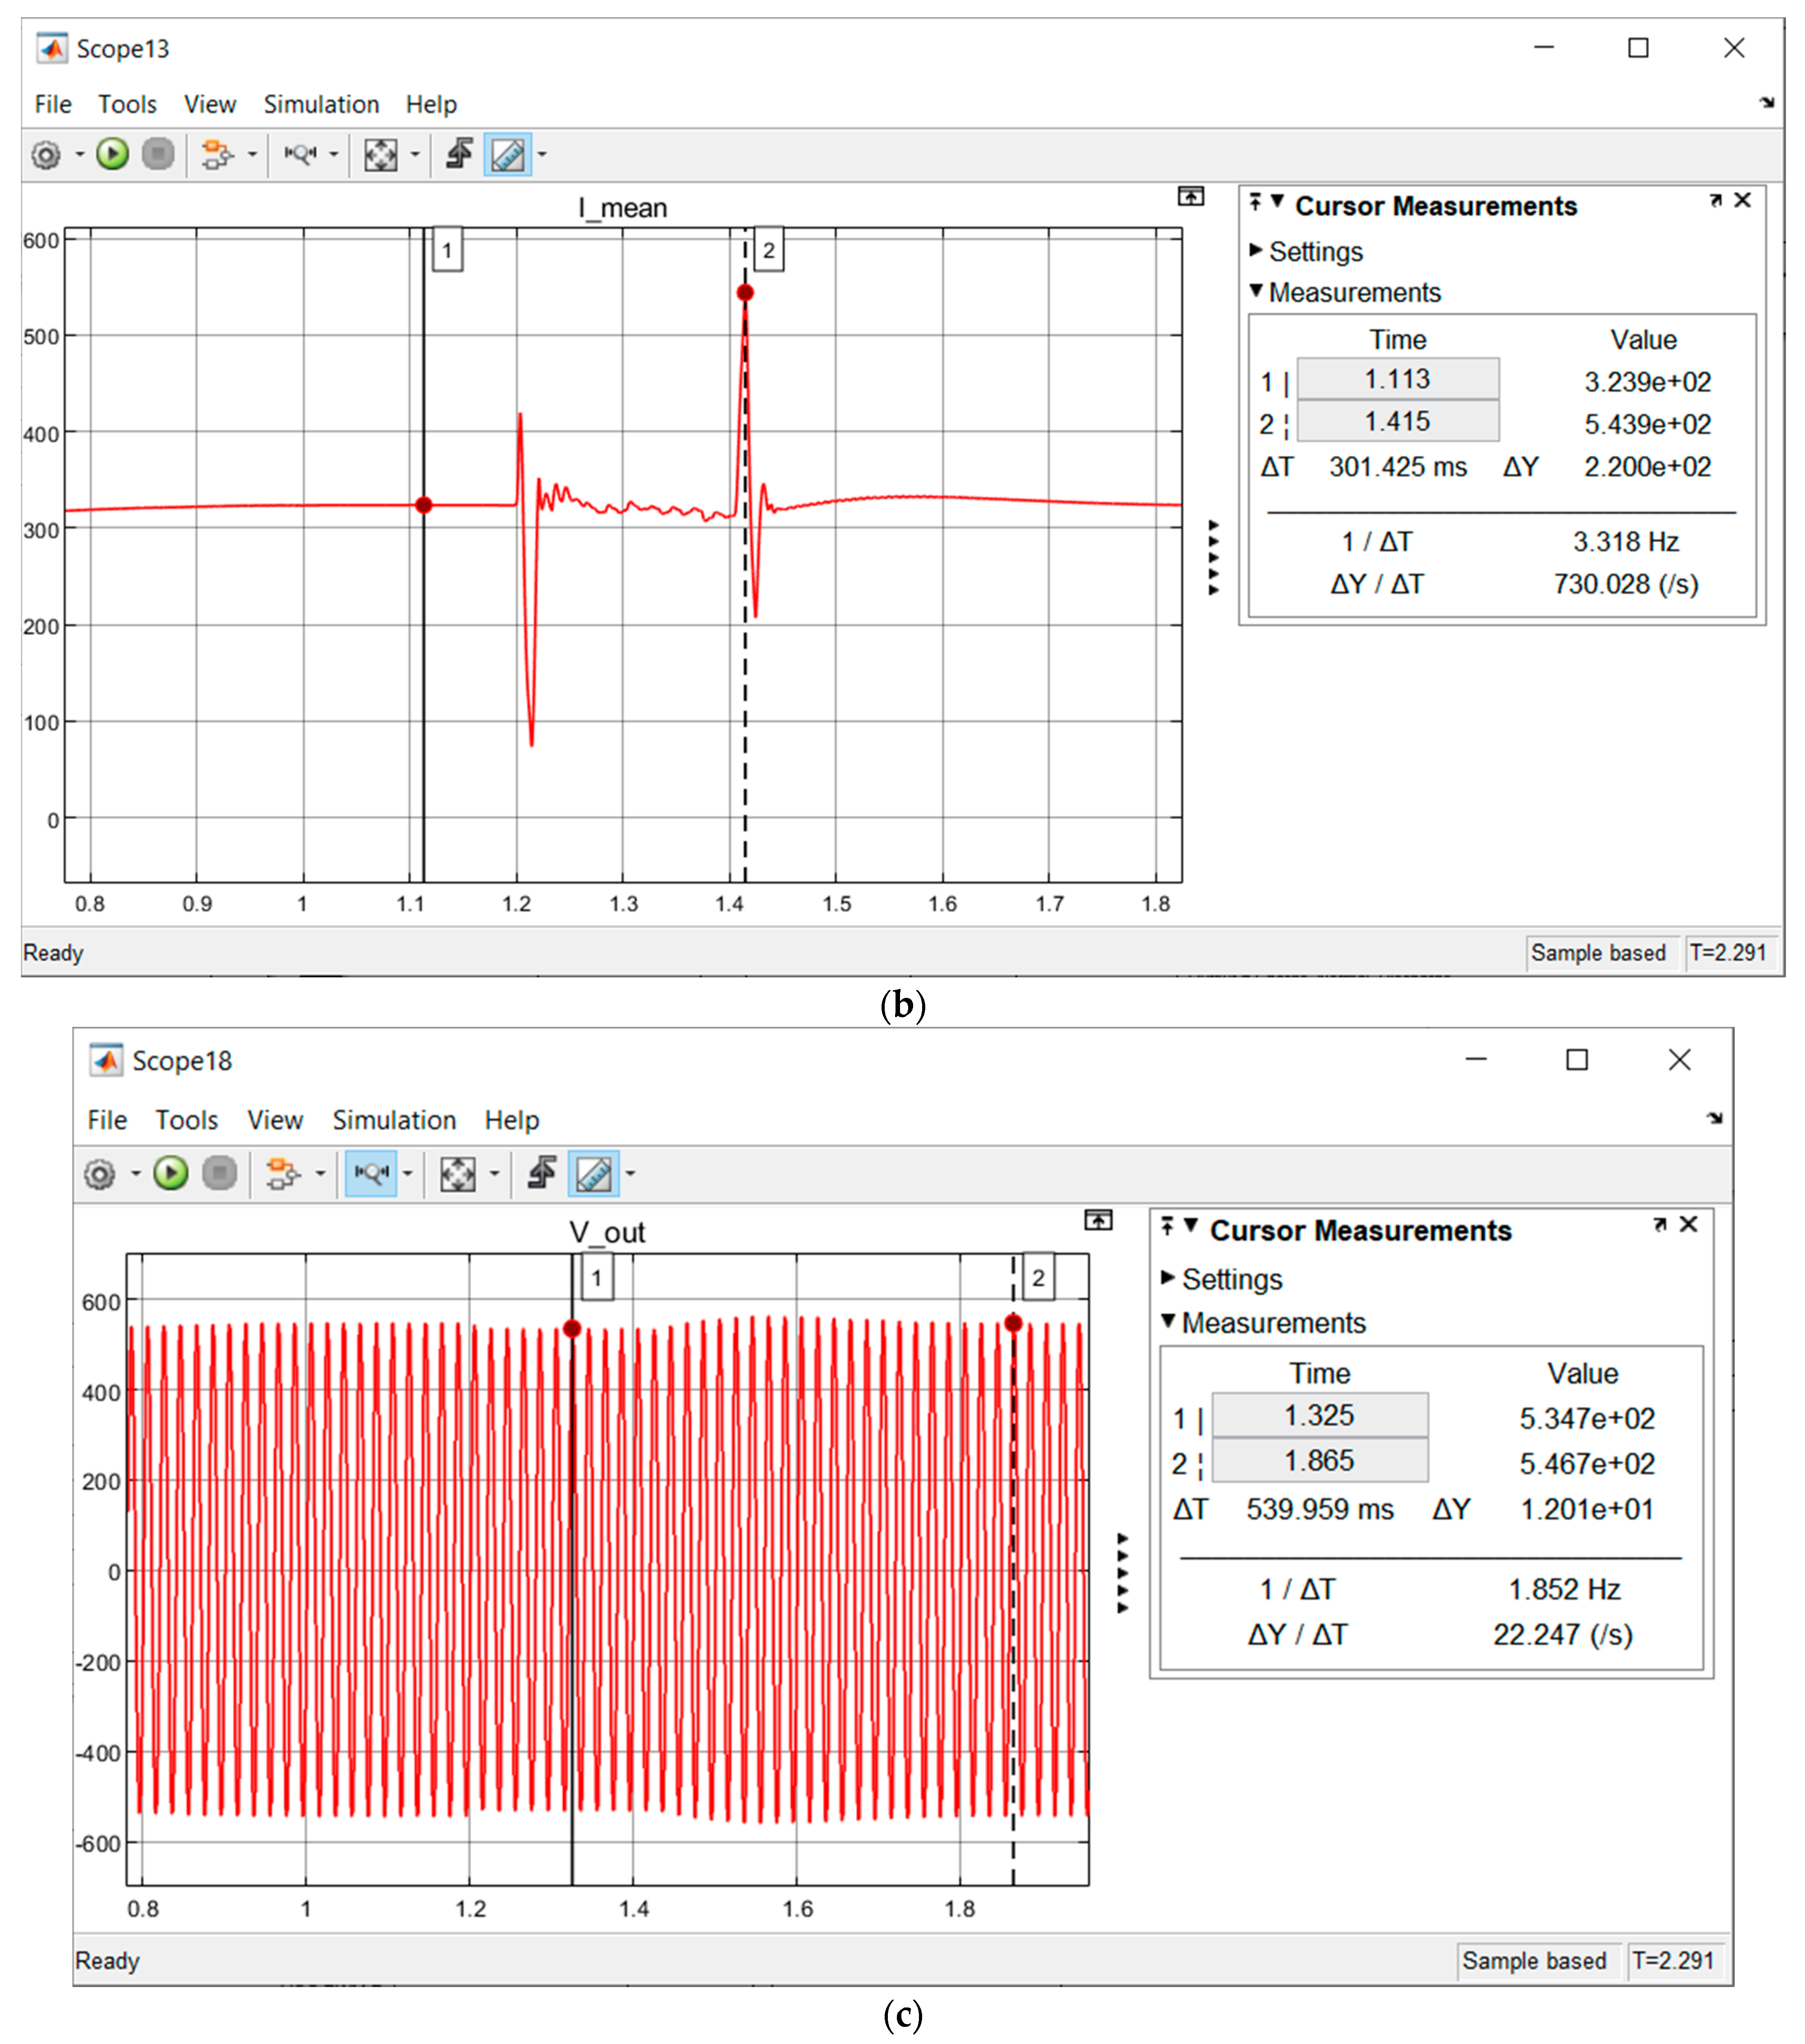
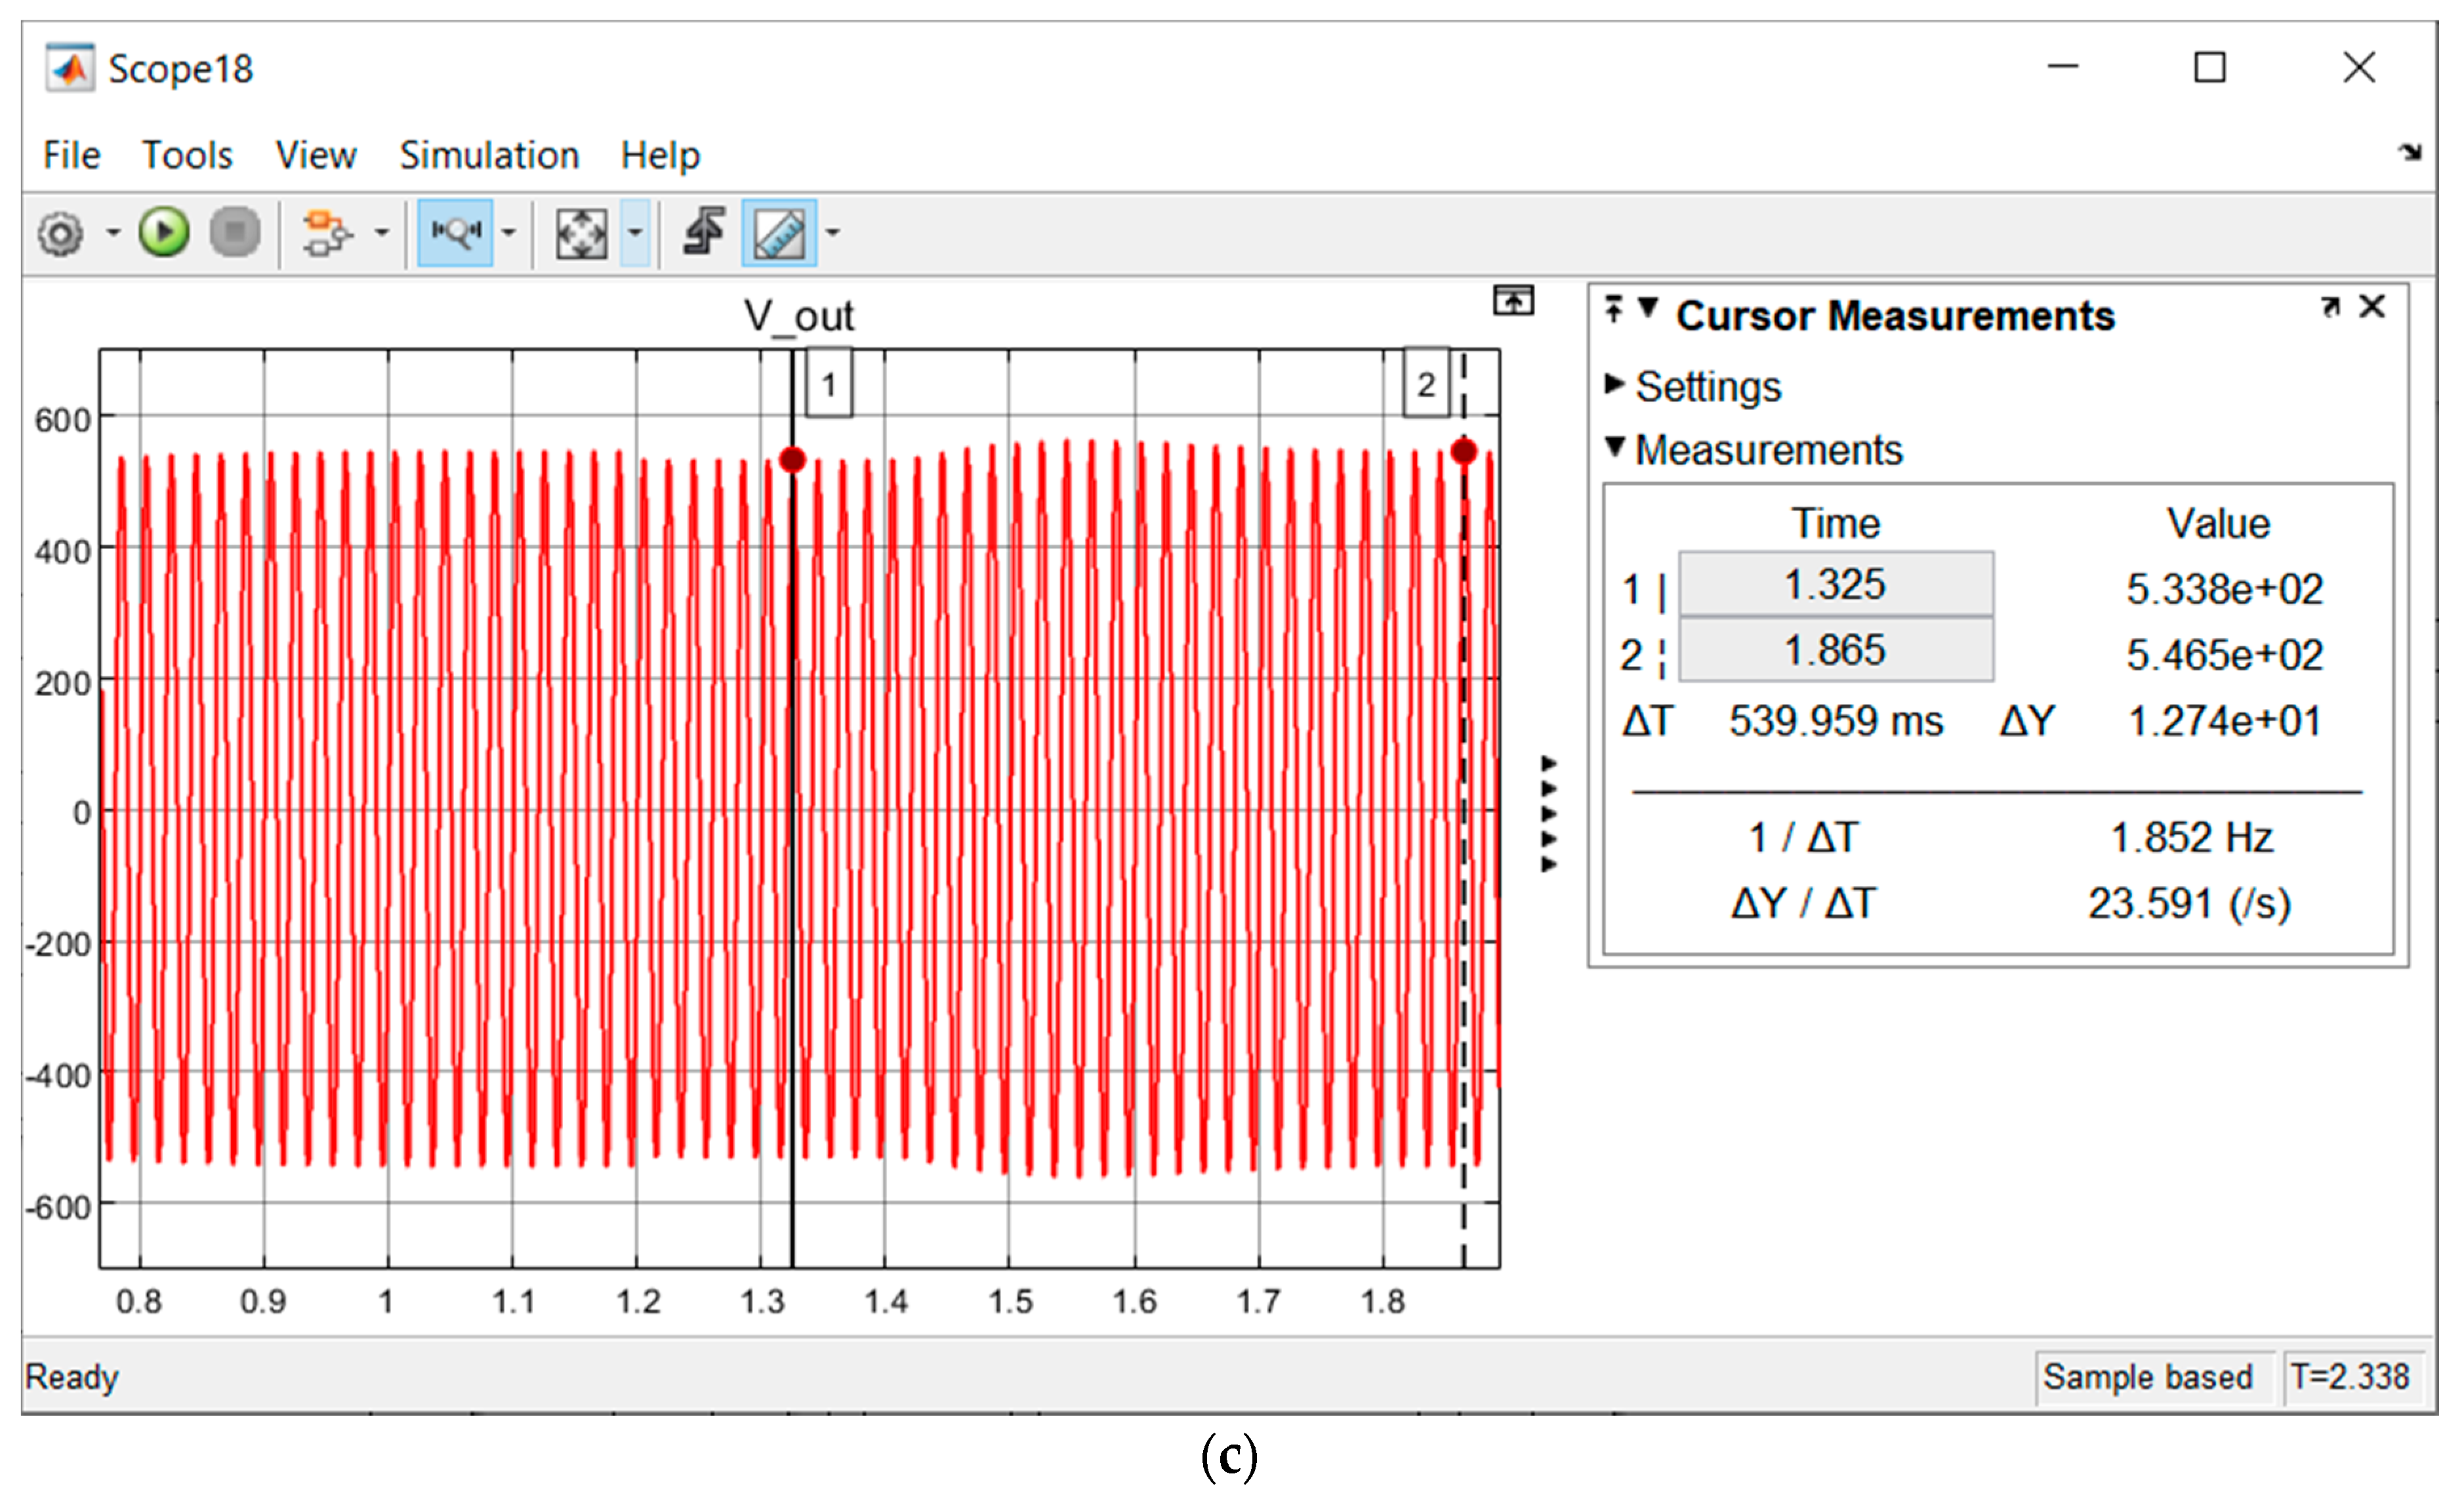
Referring to Figure 10a, after integrating fuzzy control into the power system, VOC was able to retain its reference voltage at 700 V before 1.2 s and fuzzy control was able to solve the L-G fault at 1.2–1.4 s by sustaining the Vdc at 685 V to prevent the system from collapsing. At the end of the fault occurrence time, VOC was able to move the Vdc back to 700 V at 1.8 s of simulation time. The spike of I_mean at 1.42 s of simulation time that can be seen in Figure 10b occurred due to a high inrush of current. However, this condition did not affect the voltage output (Vout) on the AC side. The fuzzy control was able to solve the L-G fault and after the fault period, VOC recovered the systems’ voltage back to its nominal value (within +10% and −6% based on 565 Vpeak), as shown in Figure 10c.

3.2. L-L Fault

For L-L Fault, the initial I_mean and Vdc were 323.5 A and 700 V, respectively. During fault occurrence at 1.2 s, both I_mean and Vdc in Figure 11a,b dropped to zero, indicating serious voltage instability within the power system.
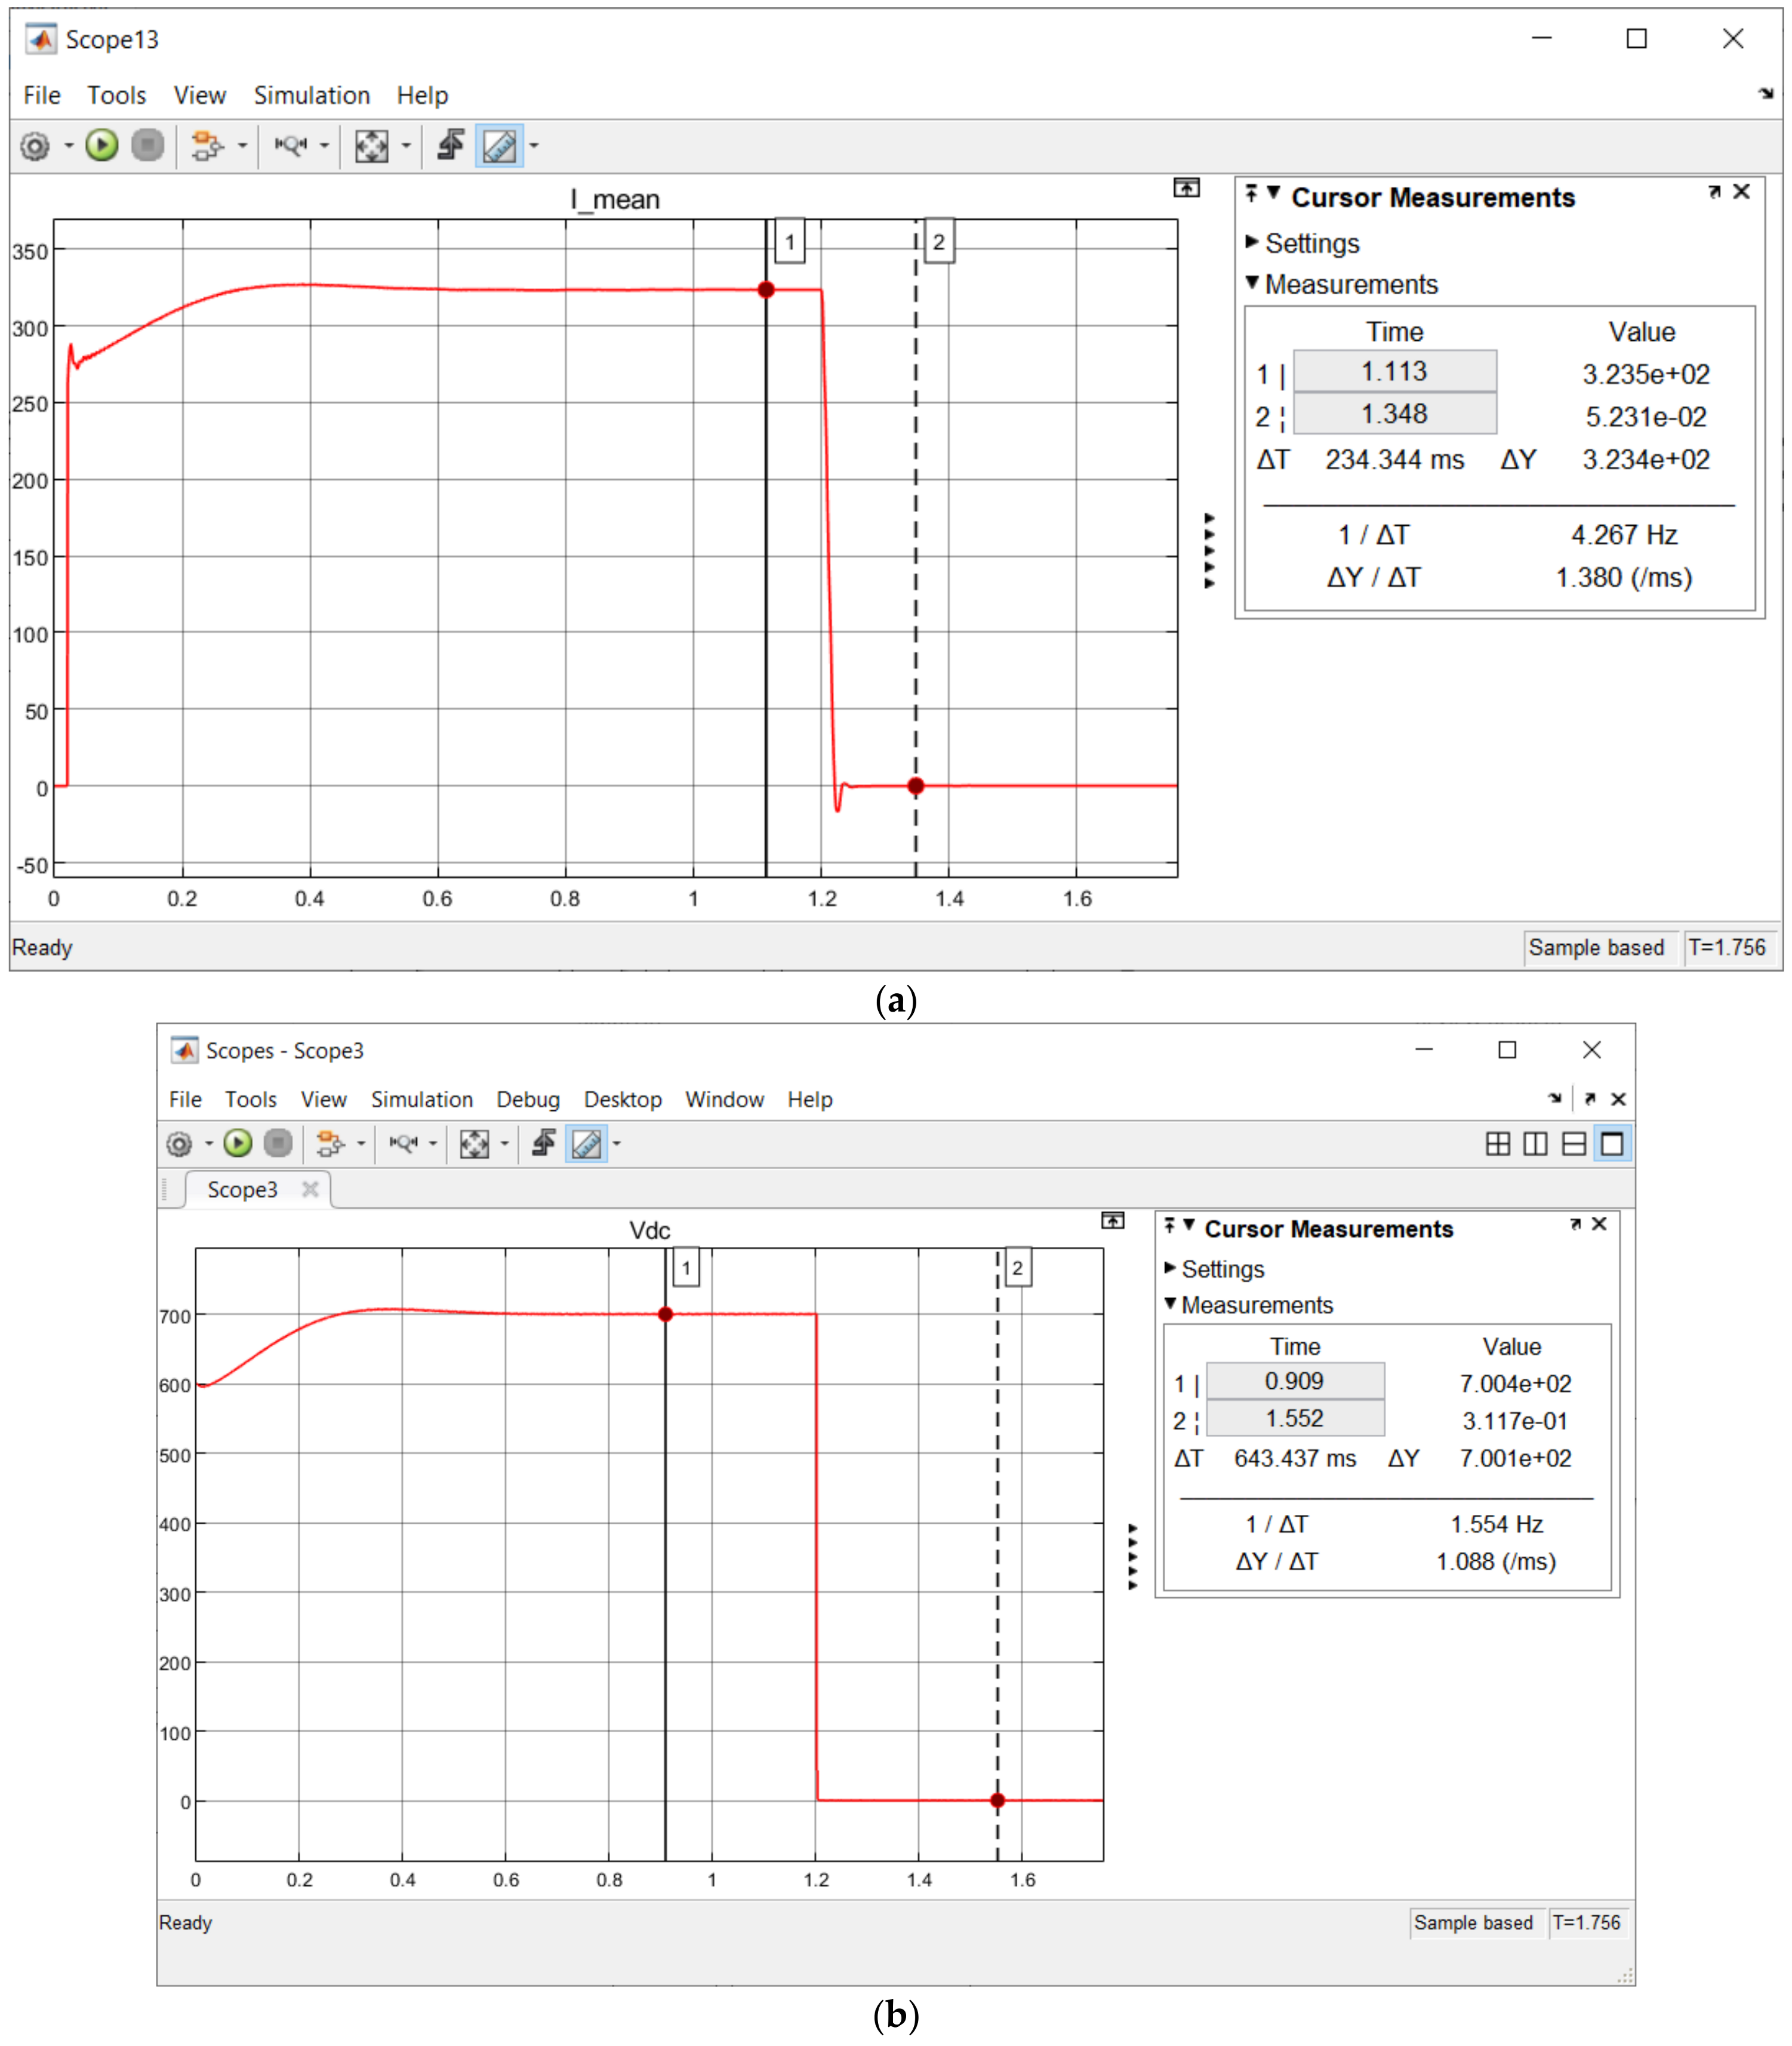
After integrating fuzzy control into the system, the L-L fault was solved as shown in Figure 12a by maintaining the Vdc at 684.7 V, followed by voltage recovery by VOC after the fault (1.4 s) to the desired ref voltage at 700 V. Meanwhile, the drop shown in I_meangraph (Figure 12b) at 1.2 s and 1.42 s were attributed to switching losses. The voltage output at AC side (V_out) was observed to be 533.8 V at the lowest level and 546.5 V at the highest level, which are within the nominal voltage range.

3.3. L-L-G Fault

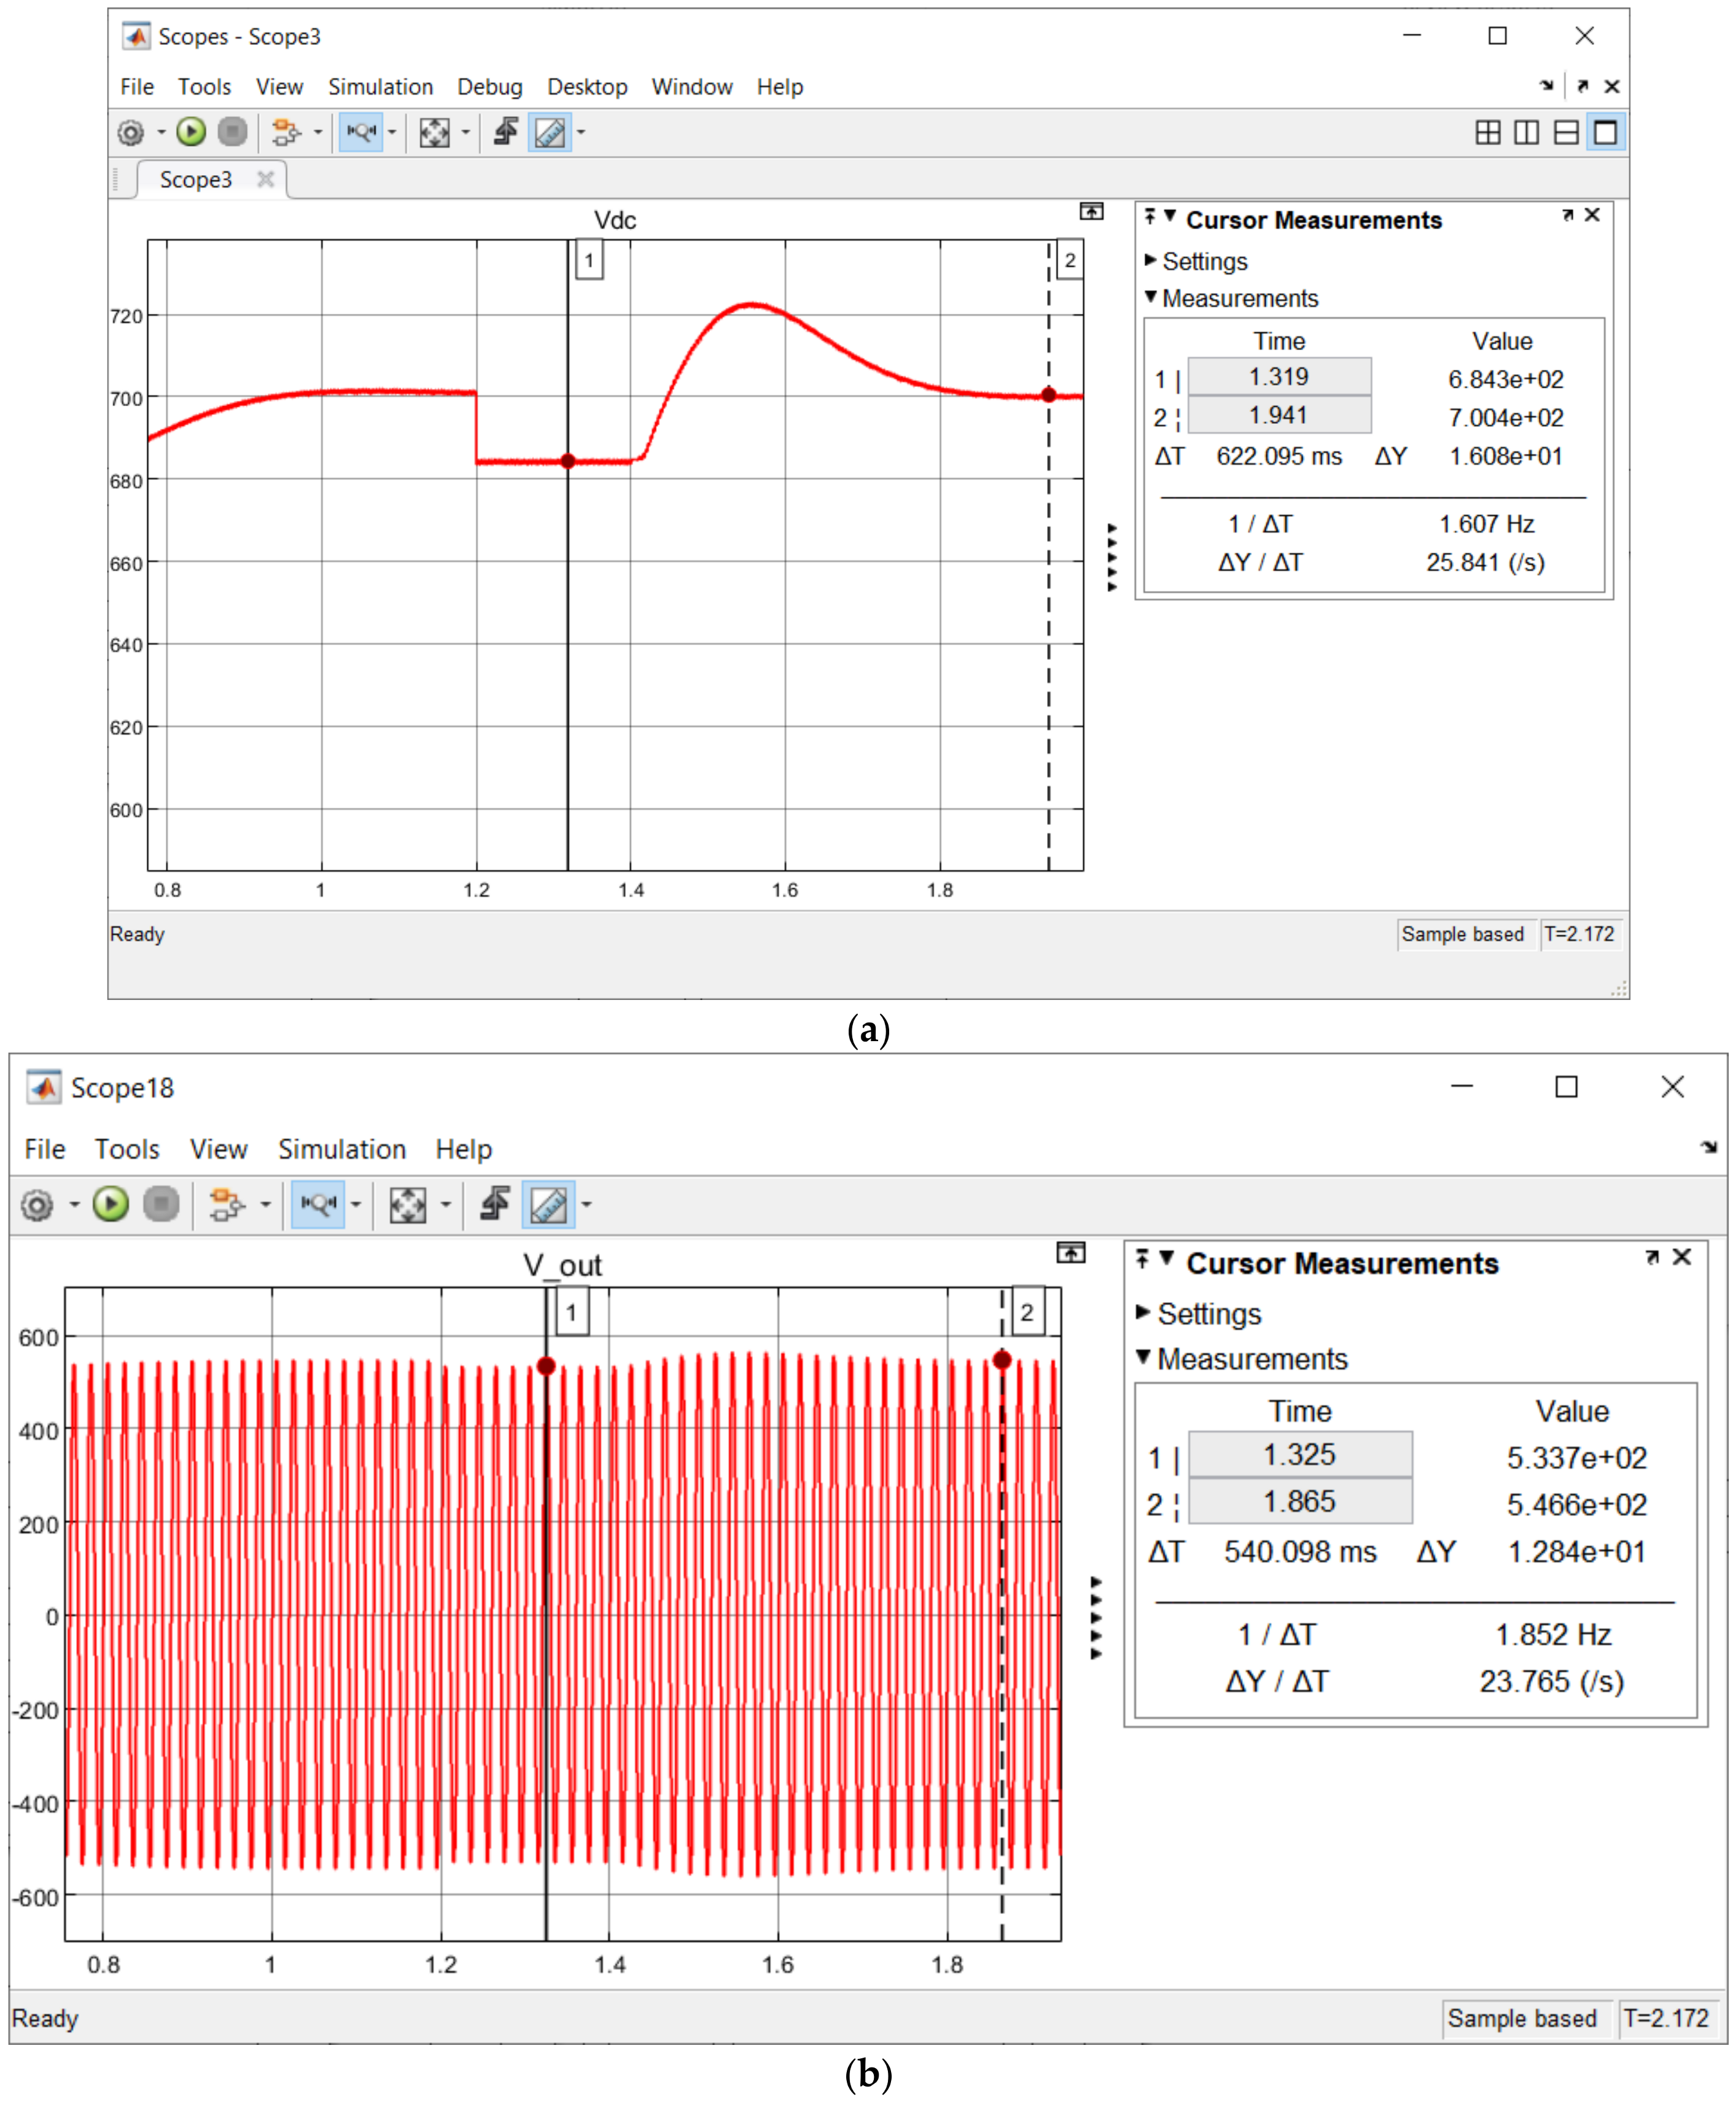
For an L-L-G Fault, the graph of I_mean and Vdc exhibited same characteristics as the waveform in Figure 11a,b. The integration of fuzzy control was able to retain the Vdc to 684.5 V which prevented a system collapse, as shown in Figure 13a. After fault clearance at 1.4 s, VOC regulated the system’s Vdc back to 700 V. The I_mean graph of L-L-G faults after integrating fuzzy control possessed a similar pattern to the one in Figure 12b. The voltage stability of the power system was maintained at 533.8 V (lowest) and 546.6 V (highest), as can be seen in the V_out graph in Figure 13b. The hybrid control of VOC and fuzzy in this work could resolve faults and regulate voltage within the power system, which demonstrates its potential to prolong the lifespan of the energy storage.

3.4. Three-Phase Fault

In Figure 14a,b, the initial I_mean and Vdc were 323.5 A and 700 V and during the fault occurrence at 1.2 s, the system could not fulfill the load demand, hence both Vdc and the I_mean dropped to zero. The VOC failed to regulate the voltage back to its nominal value during and after a fault condition without the aid of fuzzy control.
Once fuzzy control was integrated within the back-to-back converter, the Vdc was maintained at 684.3 Vdc during the fault condition, as shown in Figure 15a. At 1.4 s after the fault period, the VOC was able to recover the Vdc back to 700 V. The I_mean graph of three-phase fault after integrating fuzzy control was identical to the one in Figure 12b. With hybrid control of both VOC and fuzzy, the AC voltage output in Figure 15b was maintained within its nominal voltage range (533.7 V lowest and 546.6 V highest).

3.5. PV Intermittency (Fluctuation)

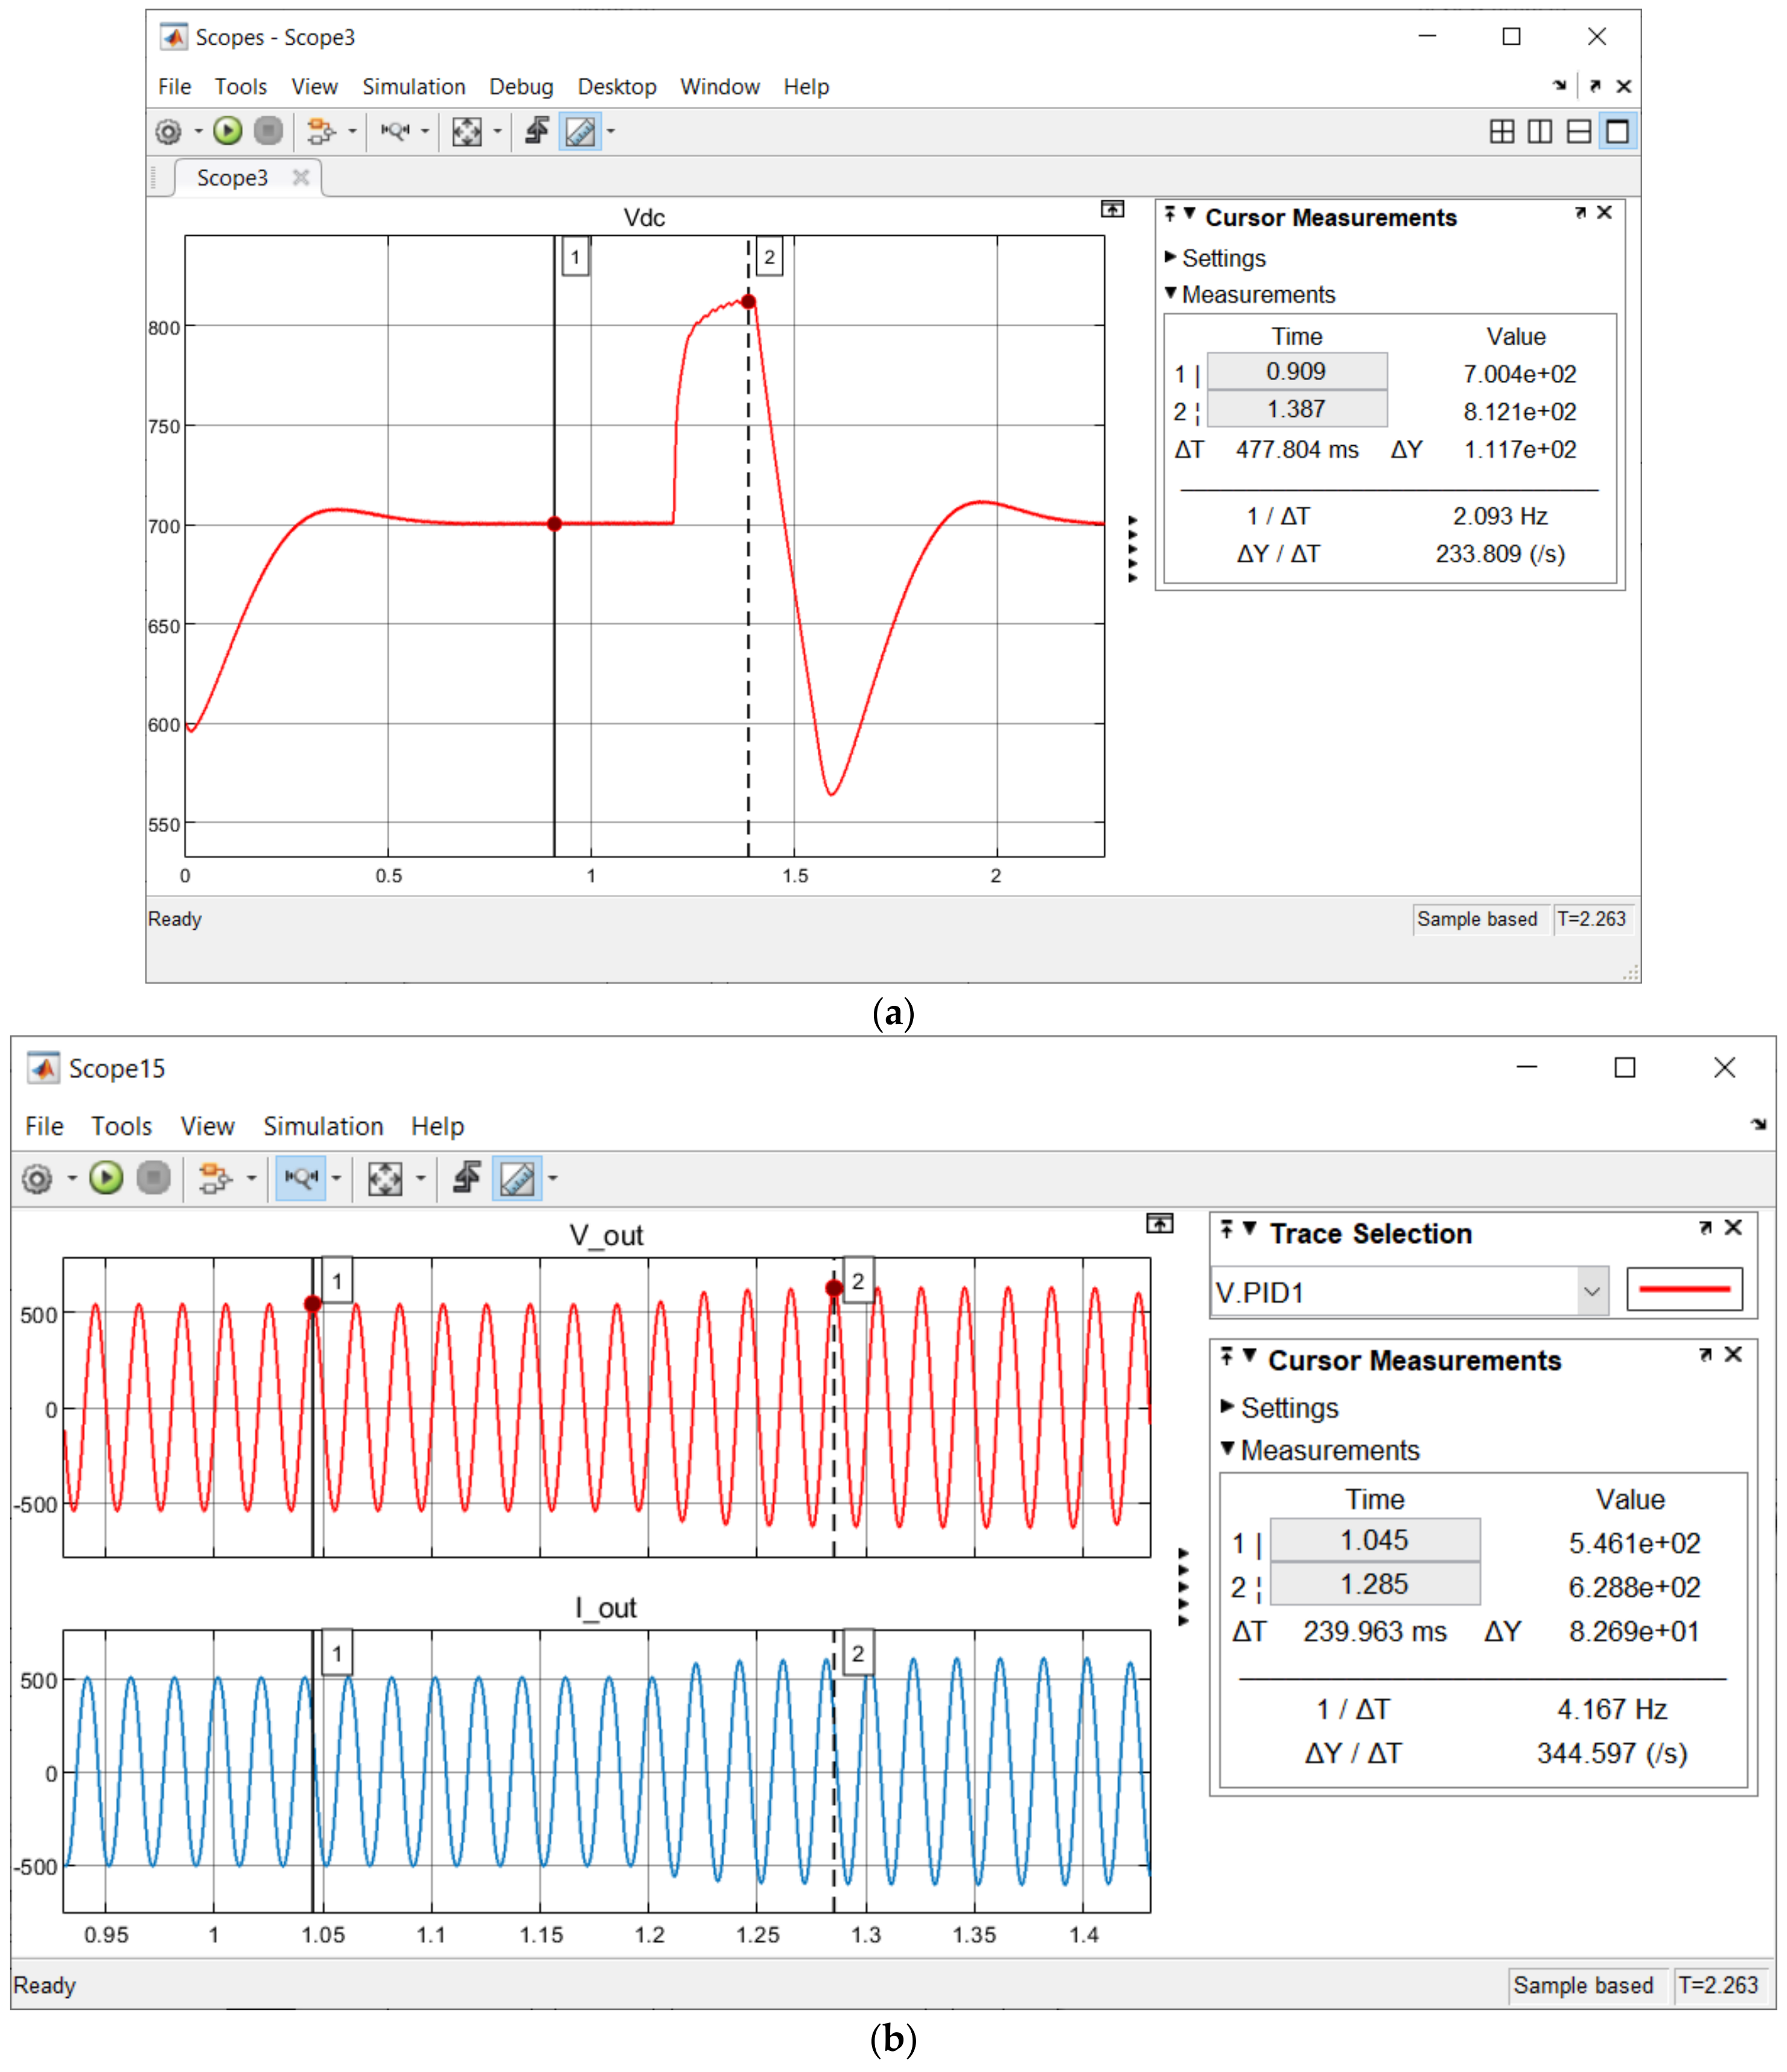
This part of the work is based on Case 2 where the weather conditions are cloudy and when PV generation is inconsistent. Referring to Figure 16a, voltage fluctuation caused by PV occurred between 1.2 s to 1.6 s simulation time. Before integrating fuzzy control, VOC was able to obtain the desired ref voltage (700 Vdc) before and after the voltage fluctuation period. However, the voltage fluctuation scenario caused the V_out in Figure 16b to exceed its nominal value (621.5 Vpeak), which is 628.8 Vpeak.
The integration of fuzzy control with VOC successfully retained the Vdc back to the reference voltage (700 V) and suppressed the voltage fluctuation by sustaining the Vdc at 720.8 Vdc, as shown in Figure 17. Nevertheless, switching losses were observed at the initial fluctuation state.
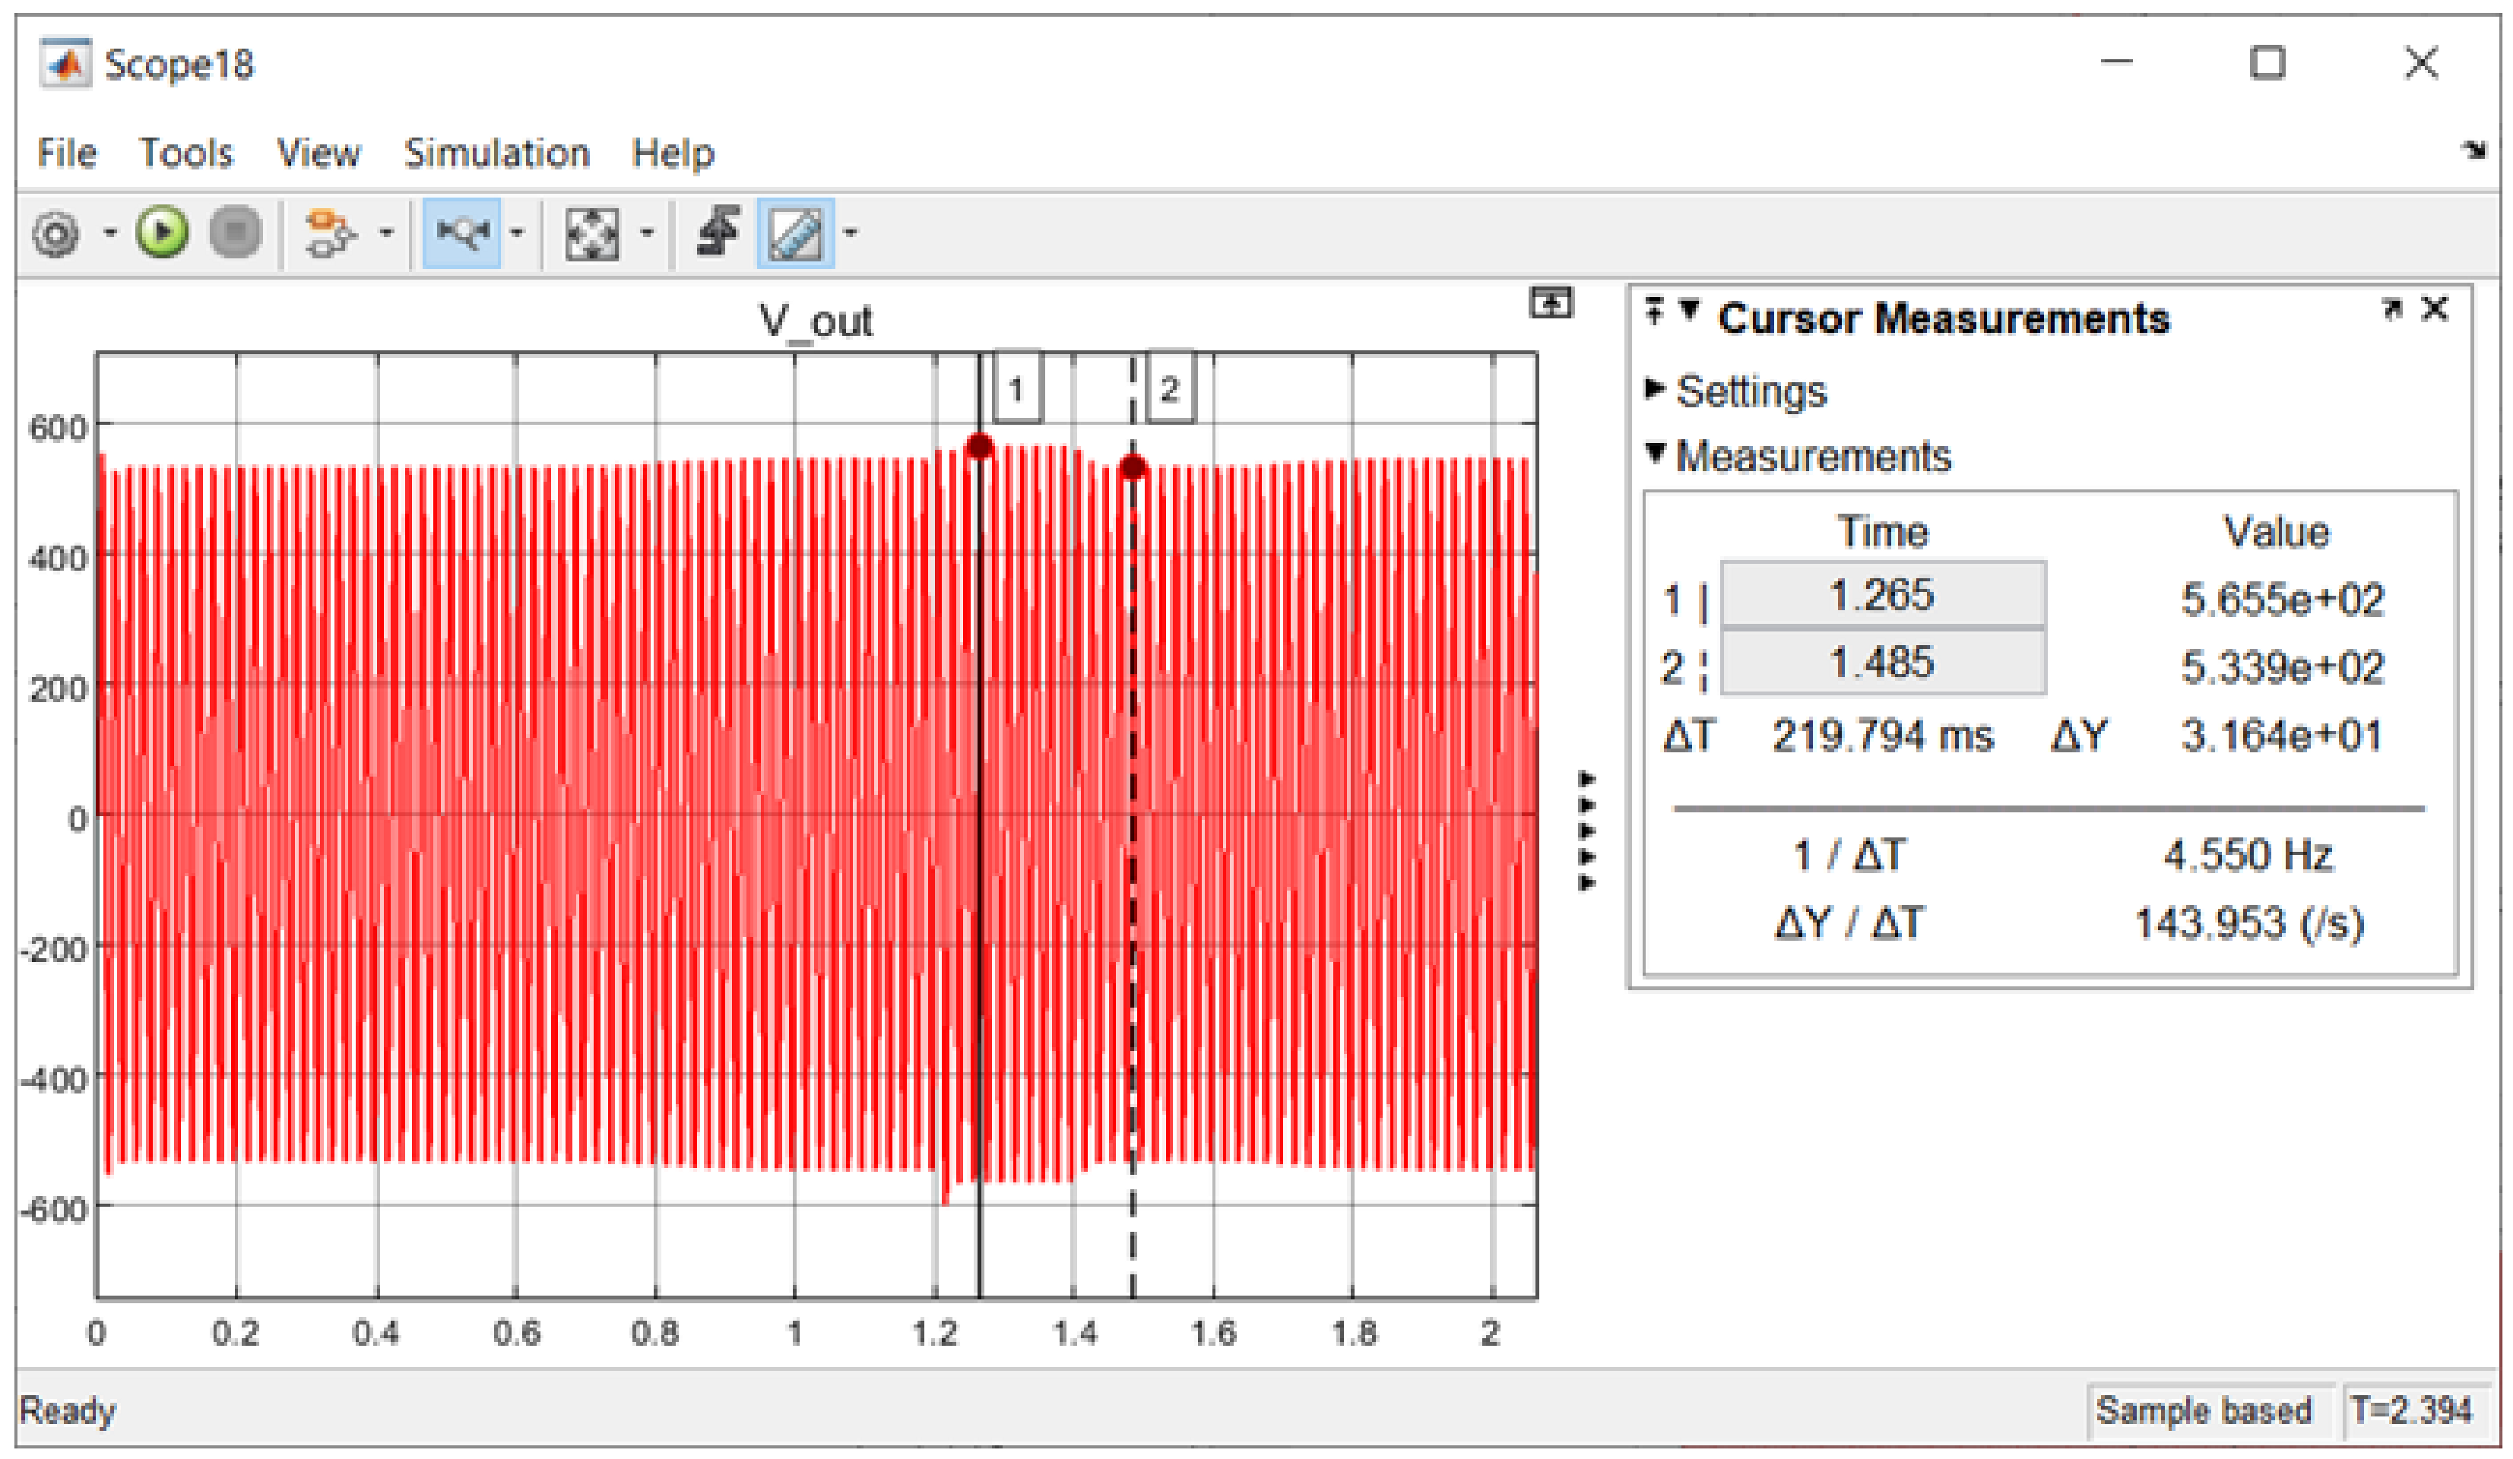
The observed flicker present during the initial of PV intermittency in Figure 17 did not affect much of the AC voltage output (V_out) in the grid system because the severity of the flicker was kept within the safe limit of the stipulated standard described in IEC 61000-4-15 [32]. Other than the concern stated, the grid system was recorded as stable, as shown in Figure 18.
The results of VOC and Fuzzy control performance for L-G, L-L, L-L-G, Three Phase fault and PV intermittency are organized in Table 8. The DC voltage (Vdc) and AC output voltage (Vout) before and after fuzzy integration were categorized for each fault and PV intermittency scenario. The L-L, L-L-G and Three-Phase fault were tabulated under same category as the obtained results, and were nearly identical. The nominal voltage range for both Vdc and Vout are indicated as tick symbols, whereas the unstable system is marked as a cross symbol.

4. Discussion

In this work, the hybrid control of grid-feeding mode (VOC) and fuzzy logic (FL) is meant to solve the undervoltage, fault (sag) and PV intermittency (fluctuation) problem in a PV-interconnected distribution network caused by unlikely weather conditions. Solely depending on energy storage to address all of the stated voltage dynamic problems would overstrain it, as demonstrated in Figure 19. After the fault period at 1.4 s, energy storage attempted to regulate the Vdc back to its desired voltage level (700 Vdc) and this is expected to eventually deteriorate the lifespan of the energy storage.
On the other hand, the grid-feeding mode (VOC) could not act as a standalone solution for the voltage dynamic problem due to its inability to solve faults. Based on the results obtained in Figure 16a, VOC is proven to have a slower response time that prevents it from reacting to fault conditions. Thus, the proposed hybrid control has shown its importance in solving a wide range of voltage dynamic problems without jeopardizing the lifespan of the energy storage. Another notable contribution of the Fuzzy Logic (FL) control is adoption of the DC fault detection method instead of conventional AC fault detection, which allows it to address faults more quickly. In AC system, it requires a few transformation techniques including Clarke and Park, which the detection scheme needs to interpret and this eventually increase the complexity of the detection scheme. However, in DC form, the value of voltage and current can be utilized directly by the control scheme. Therefore, this reduces the computational load and systems’ complexity that led to a faster Fault Clearance Time (FCT).
The fault period and post-fault period including the hybrid controls’ FCT have been displayed in a form of a timeline, as shown in Figure 20. The alphabet in Figure 20 represents the timing or compensation time for each fault (four types) and PV intermittency cases. The (a) and (c) indicate start and end time of the fault period (1.2 s and 1.4 s), whereas the annotation (b) is the end time of FCT. The post-fault period is represented by the start time of (c) and end time of (d). Additionally, (e) implies the duration of FCT and (f) implies the VOC solving time. The results for each case are then arranged accordingly in Table 9.
Referring to column (e) in Table 9, the FCT for:
  • L-G fault is 6 ms
  • L-L, L-L-G and three-phase fault are 20 µs
  • PV intermittency is 40 ms.
Due to the limitations of data in fault solving and Fault Clearance Time (FCT) available, the closest benchmark that can be used as a comparison to this work would be a matured technology, namely Solid-state Transfer Switch (SSTS) and a STATCOM research article in 2017 [33,34]. The SSTS has reported a FCT of 12 ms in solving three-phase fault, whereas this work only requires 20 µs for solving a three-phase fault. On the other hand, research work utilizing STATCOM to address L-G faults in minimum load condition has demonstrated a FCT of 0.16 s, which is still slower than the FCT for L-G faults in this work (6 ms). The FCT of PV intermittency is higher (40 ms) due to the behavior of PV being unpredictable, which requires a longer time for the control scheme to solve the voltage fluctuation. The grid-feeding mode (VOC) solving time is mostly at 0.4 s, except for in the case of PV intermittency. The reason PV intermittency demand is reduced compared to for VOC control in post-fault solving is because the DC-link is charged partially during the PV fluctuation. This reduces the time for the DC-link to be fully charged before performing a power dispatch towards the grid and overall inducing a faster VOC buffer time (0.2 s) for addressing the mentioned problems. In addition, during the VOC buffer time, the Vdc is kept strictly within the nominal range based on 700 Vdc (+10% and –6%), which further increases the voltage stability of the system.

5. Conclusions

The proposed hybrid control of grid feeding mode (VOC) and energy storage with fuzzy logic control has proven its capability to mitigate the stated voltage dynamic issues: undervoltage, voltage sag and fluctuation caused by high PV penetration, fault and PV intermittency via active power compensation to maintain the system’s voltage within its nominal range. The main contributions of this work are as follows:
  • The developed Grid-Feeding mode with Voltage Oriented Control (VOC) is able to solve the undervoltage problem, whereas the designed Fuzzy Logic (FL) control is capable of solving fault (sag) and PV intermittency issues in the grid-interconnected PV-RES. The novel hybrid control could potentially prolong the lifespan of batteries, which eventually lead to cost reductions in future deployment of energy storage.
  • A DC fault detection scheme using Fuzzy Logic is introduced for this work, which was proven to be more effective than AC schemes for fault detection. The reason is because AC detection in resolving PV intermittency (fluctuation) is still immature. However, the DC scheme could minimize the computational load and complexity of the system, thus inducing a faster Fault Clearance Time (FCT). In addition, the DC scheme with FL control has outperformed several available technologies in terms of the FCT.
  • The enhanced DC fault detection scheme has showed a more accurate computation in fault solving by utilizing the mean current (I_mean) instead of DC-Link current (Idc). By computing the average current in the system, the current ripple exhibited in the DC current can be omitted.
In the future, this work could contribute a huge impact to the energy storage field by providing a second life to batteries in terms of their cost effectiveness and by preserving the environment.

Author Contributions

Conceptualization, O.K.H., A.K.R. and L.J.Y.; methodology, O.K.H. and R.V.; software, M.B.M.; validation, A.K.R. and M.B.M.; formal analysis, O.K.H. and L.J.Y.; resources, M.B.M. and M.A.; writing—original draft preparation, O.K.H. and L.J.Y.; writing—review and editing, A.K.R. and R.V.; supervision, M.B.M.; project administration; funding acquisition, M.B.M. and M.A. All authors have read and agreed to the published version of the manuscript.

Funding

This research was funded by UNITEN-Pertamina Grant, grant number 2020002YCUPU.

Institutional Review Board Statement

Not applicable.

Informed Consent Statement

Not applicable.

Data Availability Statement

No new data were created or analyzed in this study. Data sharing is not applicable to this article.

Acknowledgments

The author would like to thank and acknowledge Universiti Tenaga Nasional (UNITEN) BOLD Publication Fund and UNITEN-Pertamina Grant code number 2020002YCUPU for funding the research work.

Conflicts of Interest

The authors declare no conflict of interest.

References

  1. Gandhi, O.; Kumar, D.S.; Rodríguez-Gallegos, C.D.; Srinivasan, D. Review of power system impacts at high PV penetration Part I: Factors limiting PV penetration. Sol. Energy 2020, 210, 181–201. [Google Scholar] [CrossRef]
  2. Kumar, D.S.; Gandhi, O.; Rodríguez-Gallegos, C.D.; Srinivasan, D. Review of power system impacts at high PV penetration Part II: Potential solutions and the way forward. Sol. Energy 2020, 210, 202–221. [Google Scholar]
  3. Chua, K.J. Maximum Penetration Level of Solar Photovoltaic to The Electrical Grid in Peninsular Malaysia. Master’s Thesis, Universiti Tenaga Nasional, Kajang, Malaysia, 2020. [Google Scholar]
  4. Aghaie, H. The impact of intermittent renewables on the resource adequacy in electricity markets. In Proceedings of the 2016 IEEE 25th International Symposium on Industrial Electronics (ISIE), Santa Clara, CA, USA, 8–10 June 2016; pp. 598–602. [Google Scholar]
  5. Steurer, M.; Fahl, U.; Voß, A.; Deane, P. Curtailment. In Europe’s Energy Transition—Insights for Policy Making; Elsevier: Amsterdam, The Netherlands, 2017; pp. 97–104. [Google Scholar]
  6. Bingham, R.P. Sags and Swells. Available online: https://www.dranetz.com/wp-content/uploads/2014/02/%0Asags-and-swells.pdf (accessed on 6 June 2021).
  7. Lee, J.Y.; Verayiah, R.; Ong, K.H.; Ramasamy, A.K.; Marsadek, M.B. Distributed Generation: A review on current energy status, grid-interconnected PQ issues, and implementation constraints of DG in Malaysia. Energies 2020, 13, 6479. [Google Scholar] [CrossRef]
  8. Rahman, S.A.; Janakiraman, P.; Somasundaram, P. Voltage sag and swell mitigation based on modulated carrier PWM. Int. J. Electr. Power Energy Syst. 2015, 66, 78–85. [Google Scholar] [CrossRef]
  9. IEEE. 1159-2019, IEEE Recommended Practice for Monitoring Electric Power Quality; IEEE: New York, NY, USA, 2019. [Google Scholar]
  10. Diaz De Leon, J., II; Lieblick, B.; Wilie, E. How facts on the distribution system are being used to improve power quality. CIRED Open Access Proc. J. 2017, 2017, 691–694. [Google Scholar] [CrossRef] [Green Version]
  11. Jirange, A.P.K.; Snehal, N. A review on power quality compensation devices. Int. J. Sci. Dev. Res. IJSDR 2017, 2, 29–36. [Google Scholar]
  12. Hua, Y.; Shentu, X.; Xie, Q.; Ding, Y. Voltage/frequency deviations control via distributed battery energy storage system considering state of charge. Appl. Sci. 2019, 9, 1148. [Google Scholar] [CrossRef] [Green Version]
  13. Chung, D.T.; Modarres, M.; Hunt, R.M. GOTRES: An expert system for fault detection and analysis. Reliab. Eng. Syst. Saf. 1989, 24, 113–137. [Google Scholar] [CrossRef] [Green Version]
  14. Jamil, M.; Sharma, S.K.; Singh, R. Fault detection and classification in electrical power transmission system using artificial neural network. SpringerPlus 2015, 4, 1–13. [Google Scholar] [CrossRef] [PubMed] [Green Version]
  15. Senapati, K.K.; Panda, M.B.; Syed, R.S. A novel algorithm for power quality improvement using dynamic voltage restorer with fuzzy logic. In Proceedings of the 2016 International Conference on Signal Processing, Communication, Power and Embedded System (SCOPES), Institute of Electrical and Electronics Engineers (IEEE). Paralakhemundi, India, 3–5 October 2016; pp. 376–381. [Google Scholar]
  16. Alcalá, R.; Alcalá-Fdez, J.; Gacto, M.J.; Herrera, F. Improving fuzzy logic controllers obtained by experts: A case study in HVAC systems. Appl. Intell. 2007, 31, 15–30. [Google Scholar] [CrossRef]
  17. Isermann, R. Fault detection with parity equations. In Fault-Diagnosis Systems; Springer: Berlin/Heidelberg, Germany, 2006; pp. 197–229. [Google Scholar]
  18. Alcantud, J.C.R. Fuzzy techniques for decision making. Symmetry 2017, 10, 6. [Google Scholar]
  19. Miljković, D. Fault detection methods: A literature survey. In Proceedings of the 34th International Convention (MIPRO 2011), Opatja, Croatia, 23–27 May 2011. [Google Scholar]
  20. Fagarasan, I.; Iliescu, S.S. Parity equations for fault detection and isolation. In Proceedings of the 2008 IEEE International Conference on Automation, Quality and Testing, Robotics, Cluj-Napoca, Romania, 22–25 May 2008; pp. 99–103. [Google Scholar]
  21. Zimmermann, H.-J. Practical Applications of Fuzzy Technologies; Springer: Boston, MA, USA, 1999. [Google Scholar]
  22. Devaraju, T. Role of custom power devices in Power Quality Enhancement: A Review. Int. J. Eng. Sci. Technol. 2010, 2, 3628–3634. [Google Scholar]
  23. Bhattacharya, S.; Shimray, B.A. Power quality improvement and mitigation of harmonic distortion using DSTATCOM with PI and Fuzzy Logic Controller. In Proceedings of the 2017 International Conference on Smart grids, Power and Advanced Control Engineering (ICSPACE), Bangalore, India, 17–19 August 2017; pp. 183–189. [Google Scholar]
  24. Sabberwal, J.S.S.B.; Rajakumar, P.; Saravanakumar, R. Review on power quality issues. Eng. Sci. Technol. An Int. J. 2012, 2, 90–95. [Google Scholar]
  25. Han, R.; Zhou, Q. Data-driven solutions for power system fault analysis and novelty detection. In Proceedings of the 2016 11th International Conference on Computer Science & Education (ICCSE 2016), Nagoya, Japan, 23–25 August 2016; pp. 86–91. [Google Scholar]
  26. Alsafasfeh, Q.H. Pattern Recognition for Fault Detection, Classification, and Localization in Electrical Power System. Ph.D. Thesis, Western Michigan University, Kalamazoo, MI, USA, 2010; p. 139. [Google Scholar]
  27. Bin Ibrahim, K.A.; Au, M.T.; Gan, C.K. Generic characteristic of medium voltage reference network for the Malaysian power distribution system. In Proceedings of the 2015 IEEE Student Conference on Research and Development (SCOReD), Kuala Lumpur, Malaysia, 13–14 December 2015; pp. 204–209. [Google Scholar]
  28. Tenaga, S. Guidelines for Solar Photovoltaic Installation on Net Energy Metering Scheme. Available online: https://policy.asiapacificenergy.org/node/4392 (accessed on 6 June 2021).
  29. Perumal, P.; Ramasamy, A.K.; Teng, A.M. Performance analysis of the DigSILENT PV model connected to a modelled Malaysian distribution network. Int. J. Control. Autom. 2016, 9, 75–88. [Google Scholar] [CrossRef]
  30. Lee, J.Y.; Verayiah, R.; Ong, K.H.; Ramasamy, A.; Marsadek, M.B. Voltage Oriented Control and Direct Power Control Strategies in solving under and overvoltage conditions for heavy load application on Malaysian Distribution Representative Network. Electr. Eng. 2021, 103, 1597–1612. [Google Scholar] [CrossRef]
  31. Nothing Unusual about the Rain, Other Factors Likely to Contribute to Flood. Available online: https://www.nst.com.my/news/nation/2020/09/623574/nothing-unusual-about-rain-other-factors-likely-contributor-flood?fbclid=IwAR3zKZwpf32b5DVZE3yDCsYf41pTCZz4SOPMZXjo9nr9DHIkYVHXJyXfDPY (accessed on 30 September 2020).
  32. IEEE. IEEE Recommended Practice for the Analysis of Fluctuating Installations on Power Systems; IEEE: New York, NY, USA, 2015. [Google Scholar]
  33. Hannan, M.A.; Mohamed, A.; Hussain, A. A simulation model of solid-state transfer switch for protection in distribution systems. J. Appl. Sci. 2006, 6, 1993–1999. [Google Scholar] [CrossRef] [Green Version]
  34. Saric, M. Generator dynamic response analysis and improvement following distribution network disturbance. Indones. J. Electr. Eng. Comput. Sci. 2017, 7, 356–363. [Google Scholar] [CrossRef]
Figure 1. Types of fault detection schemes [13,14,15,16].
Energies 14 03545 g001
Figure 2. Malaysian Representative Network (RN#1) with different types of load [30].
Energies 14 03545 g002
Figure 3. Power Demand for both Residential Load and PV Generation.
Energies 14 03545 g003
Figure 4. Grid-Feeding Mode (VOC) Configurations on the Weak Bus.
Energies 14 03545 g004
Figure 5. A representation of both the grid-feeding control strategy and the fuzzy-logic control scheme.
Energies 14 03545 g005
Figure 6. Proposed DC fault detection by replacing five AC detection with two conditions.
Energies 14 03545 g006
Figure 7. General representation of the workflow on the control scheme of the battery (i) Energy storage compensation margin (ii) Computation of Fuzzy Logic.
Energies 14 03545 g007
Figure 8. Representation of two inputs and one output of the Fuzzy Logic Controller.
Energies 14 03545 g008
Figure 9. (a) Vdc waveform, (b) I_mean waveform, (c) V_out and I_out AC waveform (L–G Fault Before Fuzzy Integration).
Energies 14 03545 g009aEnergies 14 03545 g009b
Figure 10. (a) Vdc waveform, (b) I_mean waveform, (c) V_out AC waveform (L–G Fault After Fuzzy Integration).
Energies 14 03545 g010aEnergies 14 03545 g010b
Figure 11. (a) I_mean waveform (b) Vdc waveform (L–L Fault Before Fuzzy Integration).
Energies 14 03545 g011
Figure 12. (a) Vdc waveform, (b) I_mean waveform, (c) V_out AC waveform (L–L Fault After Fuzzy Integration).
Energies 14 03545 g012aEnergies 14 03545 g012b
Figure 13. (a) Vdc waveform, (b) V_out AC waveform (L–L–G Fault After Fuzzy Integration).
Energies 14 03545 g013
Figure 14. (a) I_mean waveform (b) Vdc waveform (Three–Phase Fault Before Fuzzy Integration).
Energies 14 03545 g014
Figure 15. (a) Vdc waveform, (b) V_out AC waveform (Three–Phase Fault After Fuzzy Integration).
Energies 14 03545 g015
Figure 16. (a) Vdc waveform (b) V_out and I_out AC waveform (Voltage Fluctuation Before Fuzzy Integration).
Energies 14 03545 g016
Figure 17. Vdc waveform of Voltage Fluctuation (Case 2) After Integrating Fuzzy Control.
Energies 14 03545 g017
Figure 18. V_out AC waveform After Integrating Fuzzy Control.
Energies 14 03545 g018
Figure 19. Vdc Waveform without VOC after Post-Fault.
Energies 14 03545 g019
Figure 20. Fault Occurrence and Post-Fault Timeline (process (ae)).
Energies 14 03545 g020
Table 1. Description of the power quality issues involving a voltage interruption, fluctuation, sag and swell [5,6,9].
DescriptionCausesEffects
Interruption
  • Fault occurs at the feeder
  • Loose connection in wiring
  • Mostly a short-term effect arising from voltage sag
Voltage Sag
  • Fault occurrence within power system network
  • Sudden switching of heavy load or motor
  • Tripping issues
  • Overheating of inductive equipment
  • Flickering of light
  • Damage to sensitive equipment
Voltage Swell
  • Fault occurrence which results in a rise in unfaulted phases
  • Switching off large load application or switching on a capacitor bank
  • Damage to the insulator cable
  • Overheating of equipment
Voltage Fluctuation
  • PV Intermittency
  • Long transmission distance between source and load
  • Interference to electronic devices
  • Flickering of light
Table 4. Load flow analysis using DigSILENT Software for the RN#1 network.
LoadTerminalVoltage
Max. (p.u.)
Time
Point Max
Voltage
Min. (p.u)
Time
Point Min.
Type AResidential A (1)1.0351:00:00 PM1.0112:00:00 AM
Residential A (2)1.0331:00:00 PM112:00:00 AM
Residential A (3)1.0311:00:00 PM0.9912:00:00 AM
Residential A (4)1.031:00:00 PM0.9912:00:00 AM
Residential A (5)1.031:00:00 PM0.9912:00:00 AM
Type BSmall Residential (1)1.0385:00:00 AM1.0212:00:00 AM
Small Residential (2)1.0385:00:00 AM1.0212:00:00 AM
Small Residential (3)1.0375:00:00 AM1.0212:00:00 AM
Type CCommercial (1)1.0371:00:00 PM1.034:00:00 PM
Commercial (2)1.0361:00:00 PM1.034:00:00 PM
Commercial (3)1.0361:00:00 PM1.024:00:00 PM
Type DResidential B (1)1.0371:00:00 PM1.0212:00:00 AM
Residential B (2)1.0371:00:00 PM1.0212:00:00 AM
Residential B (3)1.0371:00:00 PM1.0112:00:00 AM
Residential B (4)1.0361:00:00 PM1.0112:00:00 AM
Residential B (5)1.0361:00:00 PM1.0112:00:00 AM
Type EResidential C (1)1.051:00:00 PM1.0212:00:00 AM
Residential C (2)1.051:00:00 PM1.0212:00:00 AM
Residential C (3)1.051:00:00 PM1.0212:00:00 AM
Residential C (4)1.051:00:00 PM1.0212:00:00 AM
Residential C (5)1.051:00:00 PM1.0112:00:00 AM
Table 5. Parameters of the weak bus network constructed.
ComponentsParameterDescription
Source Lline2 mHLine impedance
Rline0.05 Ω
Vinput400 Vrms (three-phase)Source
LC filter Lfilter1 mHTo remove ripple so that the inverted sinewave output from inverter will be smoother
Cfilter4.7 mF
Load at 4:00 pm Rload243 kWLoad
Lload108 kVAr
Inverter fs, inv2 kHzSwitching frequency
Rectifier fs,rect2 kHzSwitching frequency
C,dc-link150 μFDC-Link Rectifier
Solar panel Wmax200 kWMaximum power
Energy Storage V720 VDC source
Table 6. Scope of work based on load conditions at 4:00 p.m.
CaseWeather ConditionPV GenerationLoad Condition at 4:00 p.m.Voltage Dynamic Problem
1RainyNo Normal (243 kW) Undervoltage and Fault
2CloudyIntermittency Normal (243 kW)Fluctuation
Table 7. Rule Table for Fuzzy Logic Controller.
VeVLVNVH
Im
ILDISCNN
INNNN
IHNNC
Table 8. Results of VOC and fuzzy control performance in different fault conditions.
L-G FaultBefore Fuzzy Integration
Pre-Fault (VOC Control)FaultPost-Fault (VOC Control)
Vdc (V)700Steep decrease approaching zero ✘Steep decrease approaching zero ✘
Vout (Vp)In RangeOut of Range ✘Out of Range ✘
After Fuzzy Integration
Vdc (V)700685 ✔700 ✔
Vout (Vp)In Range534.7 ✔546.7 ✔
L-L, L-L-G and Three-Phase FaultBefore Fuzzy Integration
Pre-Fault (VOC Control)FaultPost-Fault (VOC Control)
Vdc (V)7000 ✘0 ✘
Vout (Vp)In RangeOut of Range ✘Out of Range ✘
After Fuzzy Integration
Vdc (V)700684.3–684.7 ✔700 ✔
Vout (Vp)In Range533.7–533.8 ✔546.5–546.6 ✔
PV IntermittencyBefore Fuzzy Integration
Pre-Fault (VOC Control)FaultPost-Fault (VOC Control)
Vdc (V)700Fluctuate reaching max Vdc at 812.1 ✘700 ✔
Vout (Vp)In RangeOut of Range ✘Out of Range ✘
After Fuzzy Integration
Vdc (V)700720 ✔700 ✔
Vout (Vp)In Range565.5 ✔533.9 ✔
Remarks: Nominal AC output voltage range (531.1 Vp–621.5 Vp); Nominal Vdc range (658 V–770 V), (✔ = In range, ✘ = Out of range).
Table 9. Fault occurrence and Post-Fault timeline with FCT and VOC solving time.
Type of Fault/Fluctuation(a)
Fault Start
(b)
FCT End
(c)
Fault End/Post-Fault Start
(d)
Post-Fault End
(e)
FCT
(f)
VOC
Buffer Time
Benchmark
(FCT)
L-G1.2 s1.206 s1.4 s1.8 s6 ms0.4 s0.16 s (STAT-COM)
L-L1.2 s1.20002 s1.4 s1.8 s20 µs0.4 s-
L-L-G1.2 s1.20002 s1.4 s1.8 s20 µs0.4 s-
Three-Phase1.2 s1.20002 s1.4 s1.8 s20 µs0.4 s12 ms (SSTS)
PV Intermittency1.2 s1.24 s1.4 s1.7 s40 ms0.2 s-
Publisher’s Note: MDPI stays neutral with regard to jurisdictional claims in published maps and institutional affiliations.