
Efficiency of Solar Shading Devices to Improve Thermal Comfort in a Sports Hall


Abstract
:
1. Introduction
1.1. Thermal Comfort in Sports Facilities
1.2. Shading Devices As Passive Protection Against Overheating
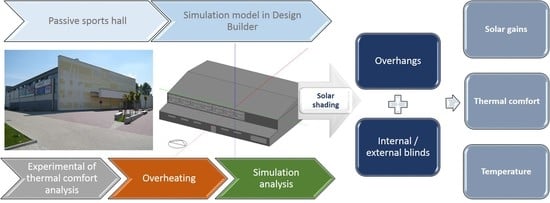
2. Object and Methodology
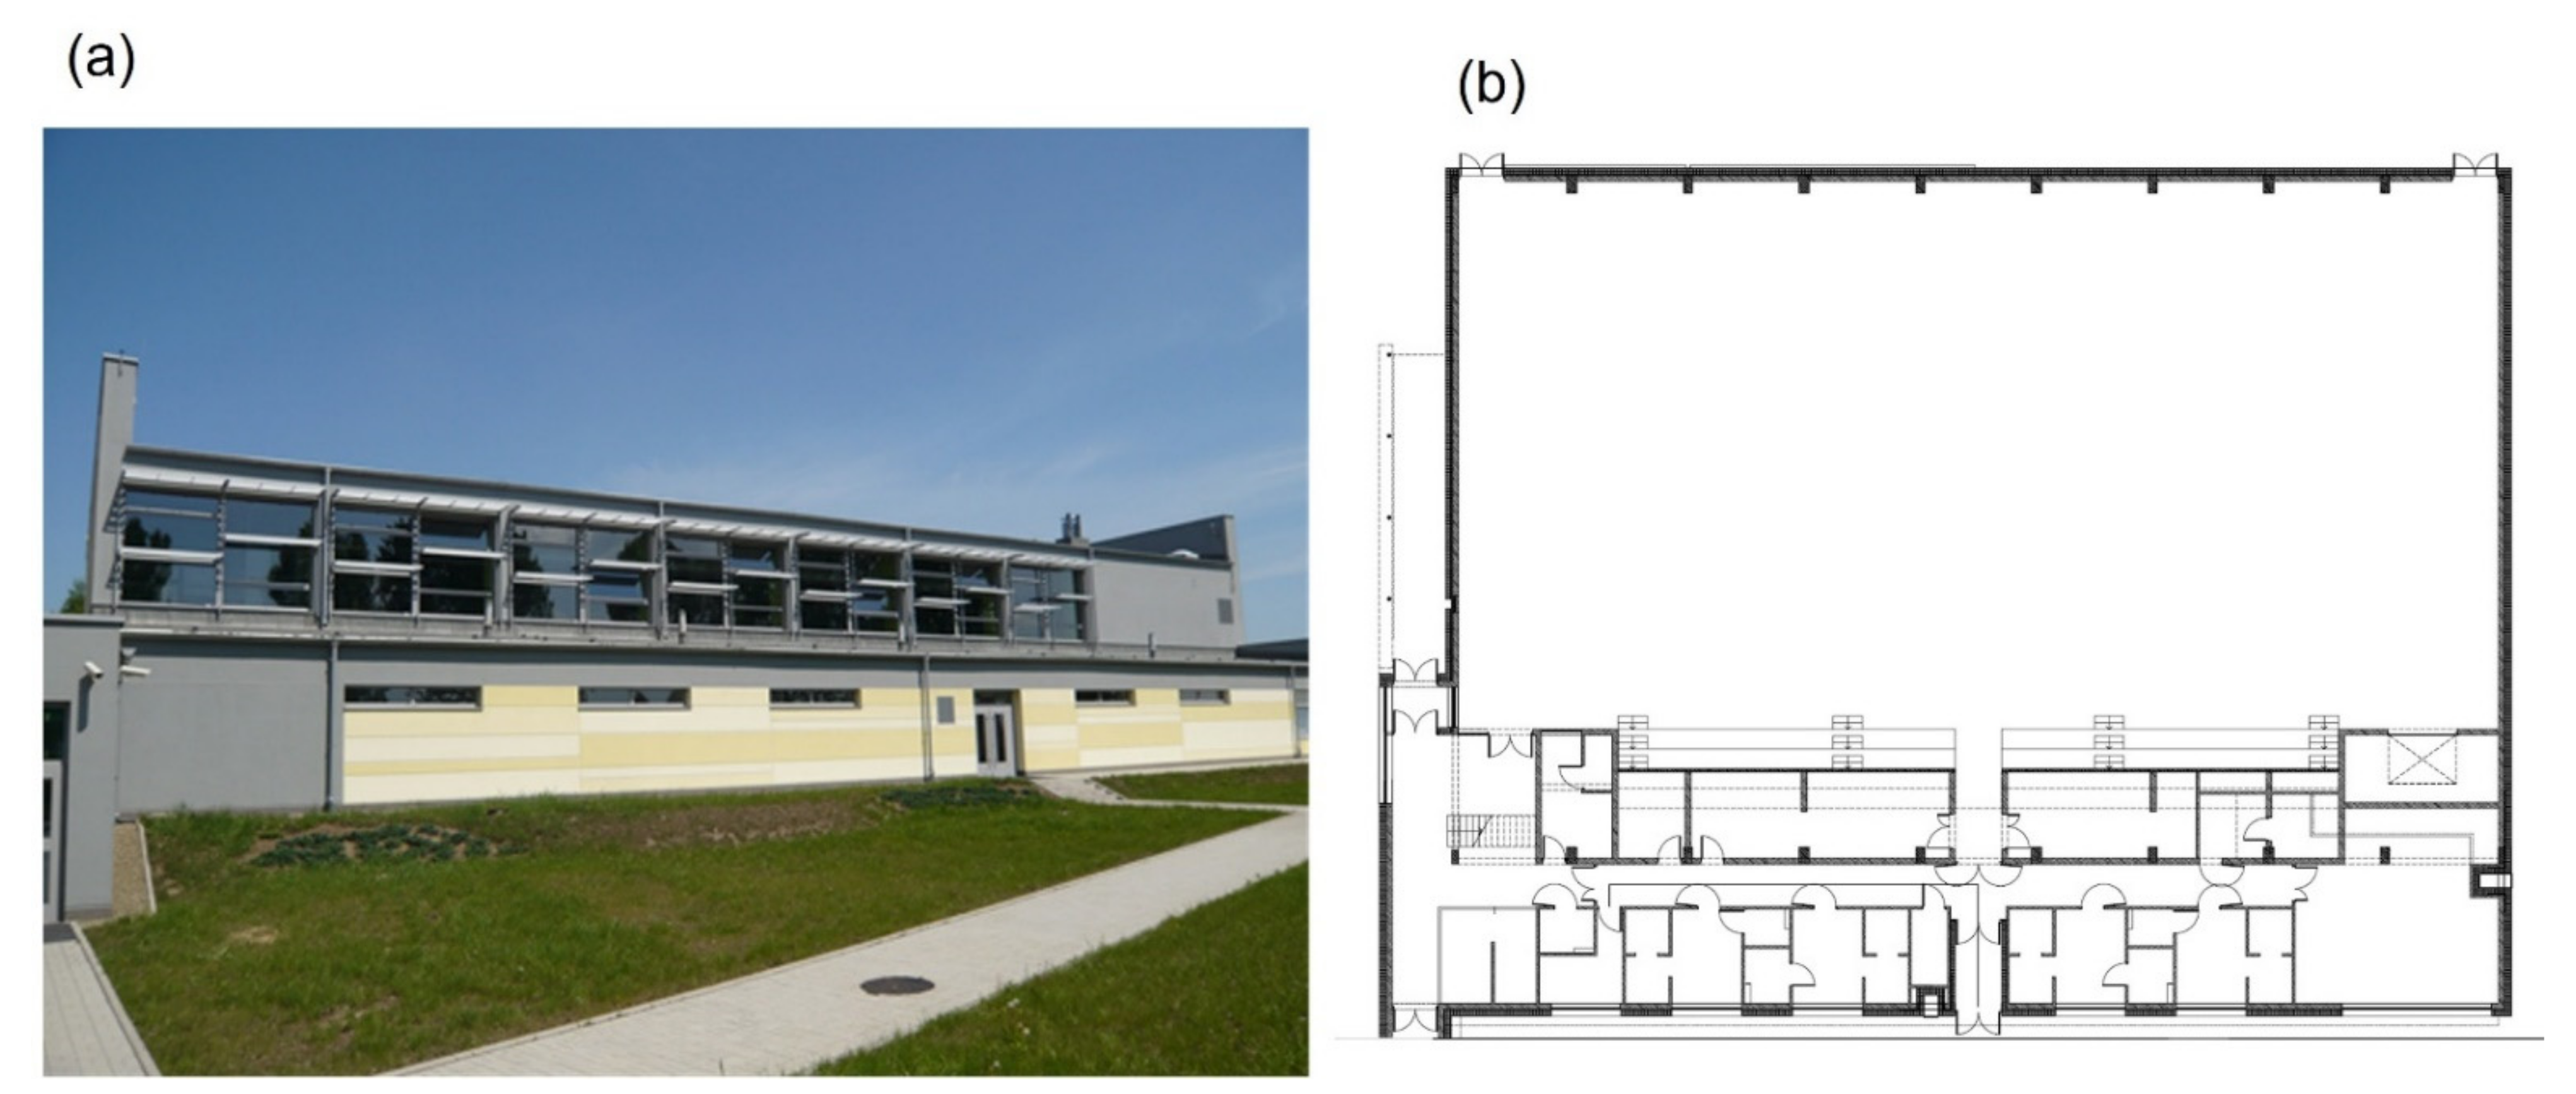
2.1. Passive Sports Hall in Słomniki
2.2. The Criterion for Ensuring Thermal Comfort
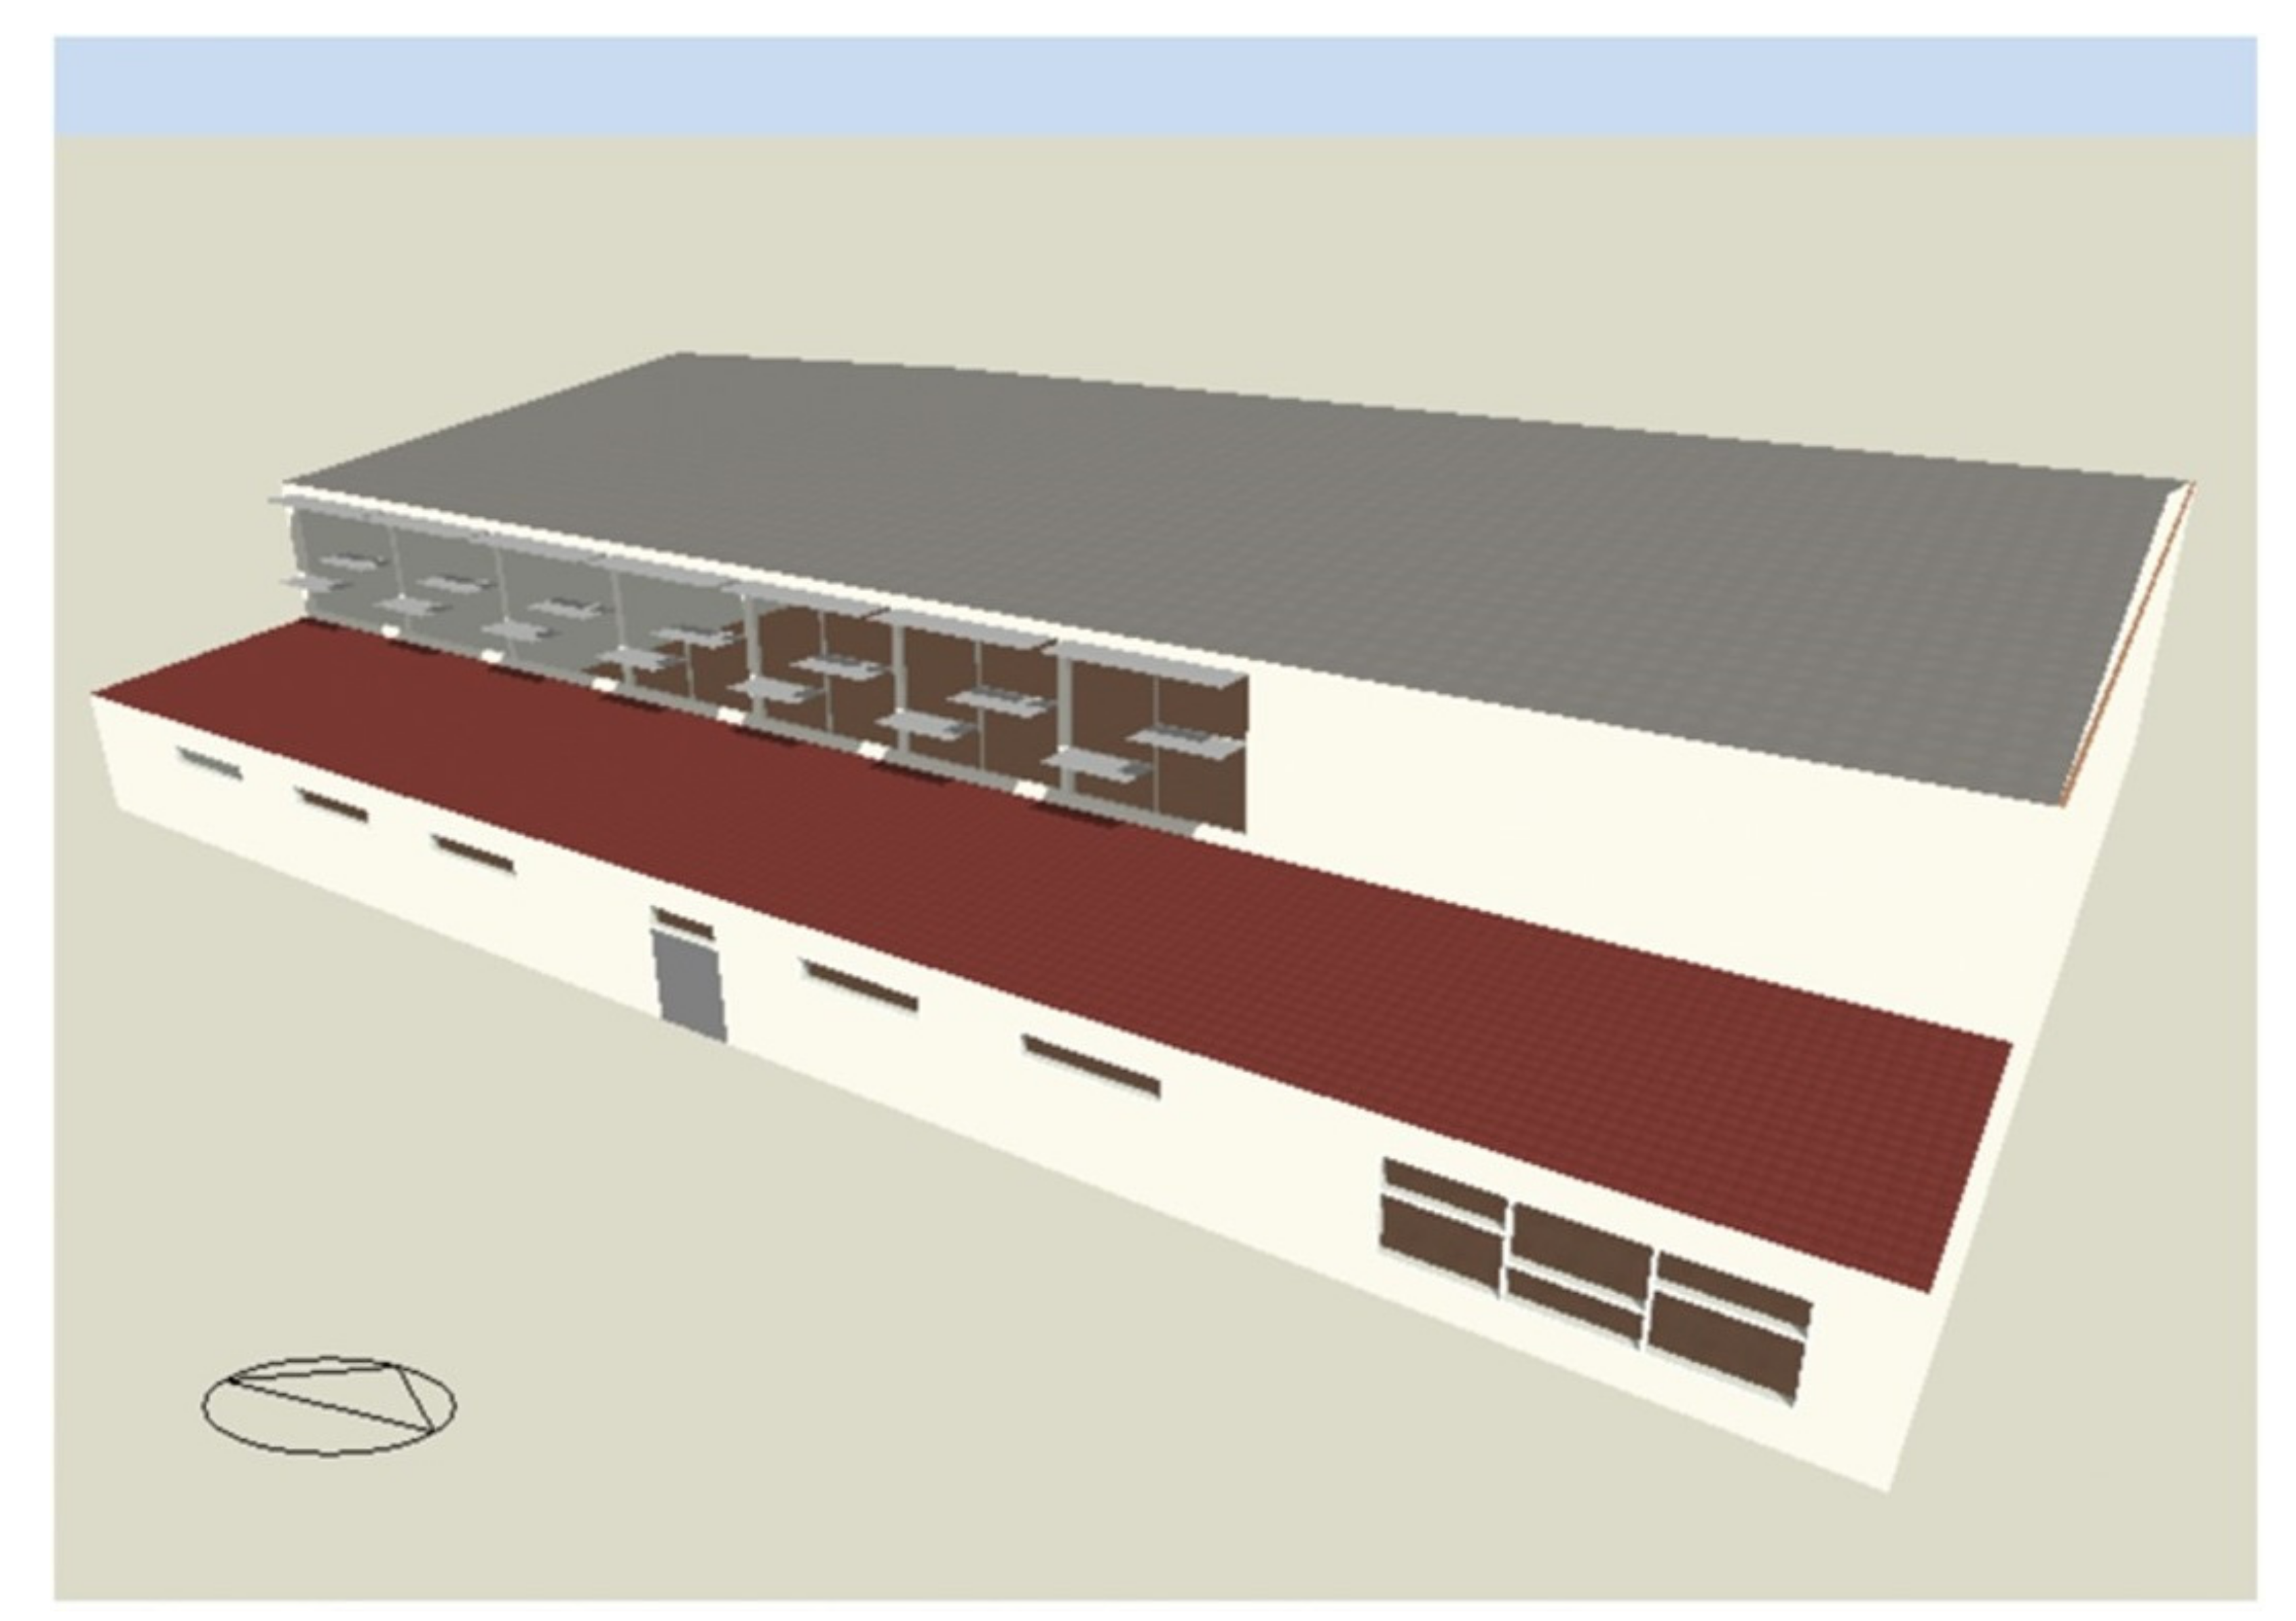
2.3. Simulation Model in DesignBuilder Program
- rate of energy storage in air (W)
- sum of the convective internal loads (W)
- convective heat transfer from zone surfaces (W)
- heat transfer due to interzone air mixing (W)
- heat transfer due to infiltration (W)
- air systems output (W)
- Normalized power density—3.3 (W/m2—100 lux);
- Radiant fraction—0.42;
- Visible fraction—0.18.
- Solar radiation transmittance—0.05;
- Solar radiation reflection—0.35;
- Thermal conductivity λ = 0.1 W/(mK).
3. Results of Thermal Comfort Analysis
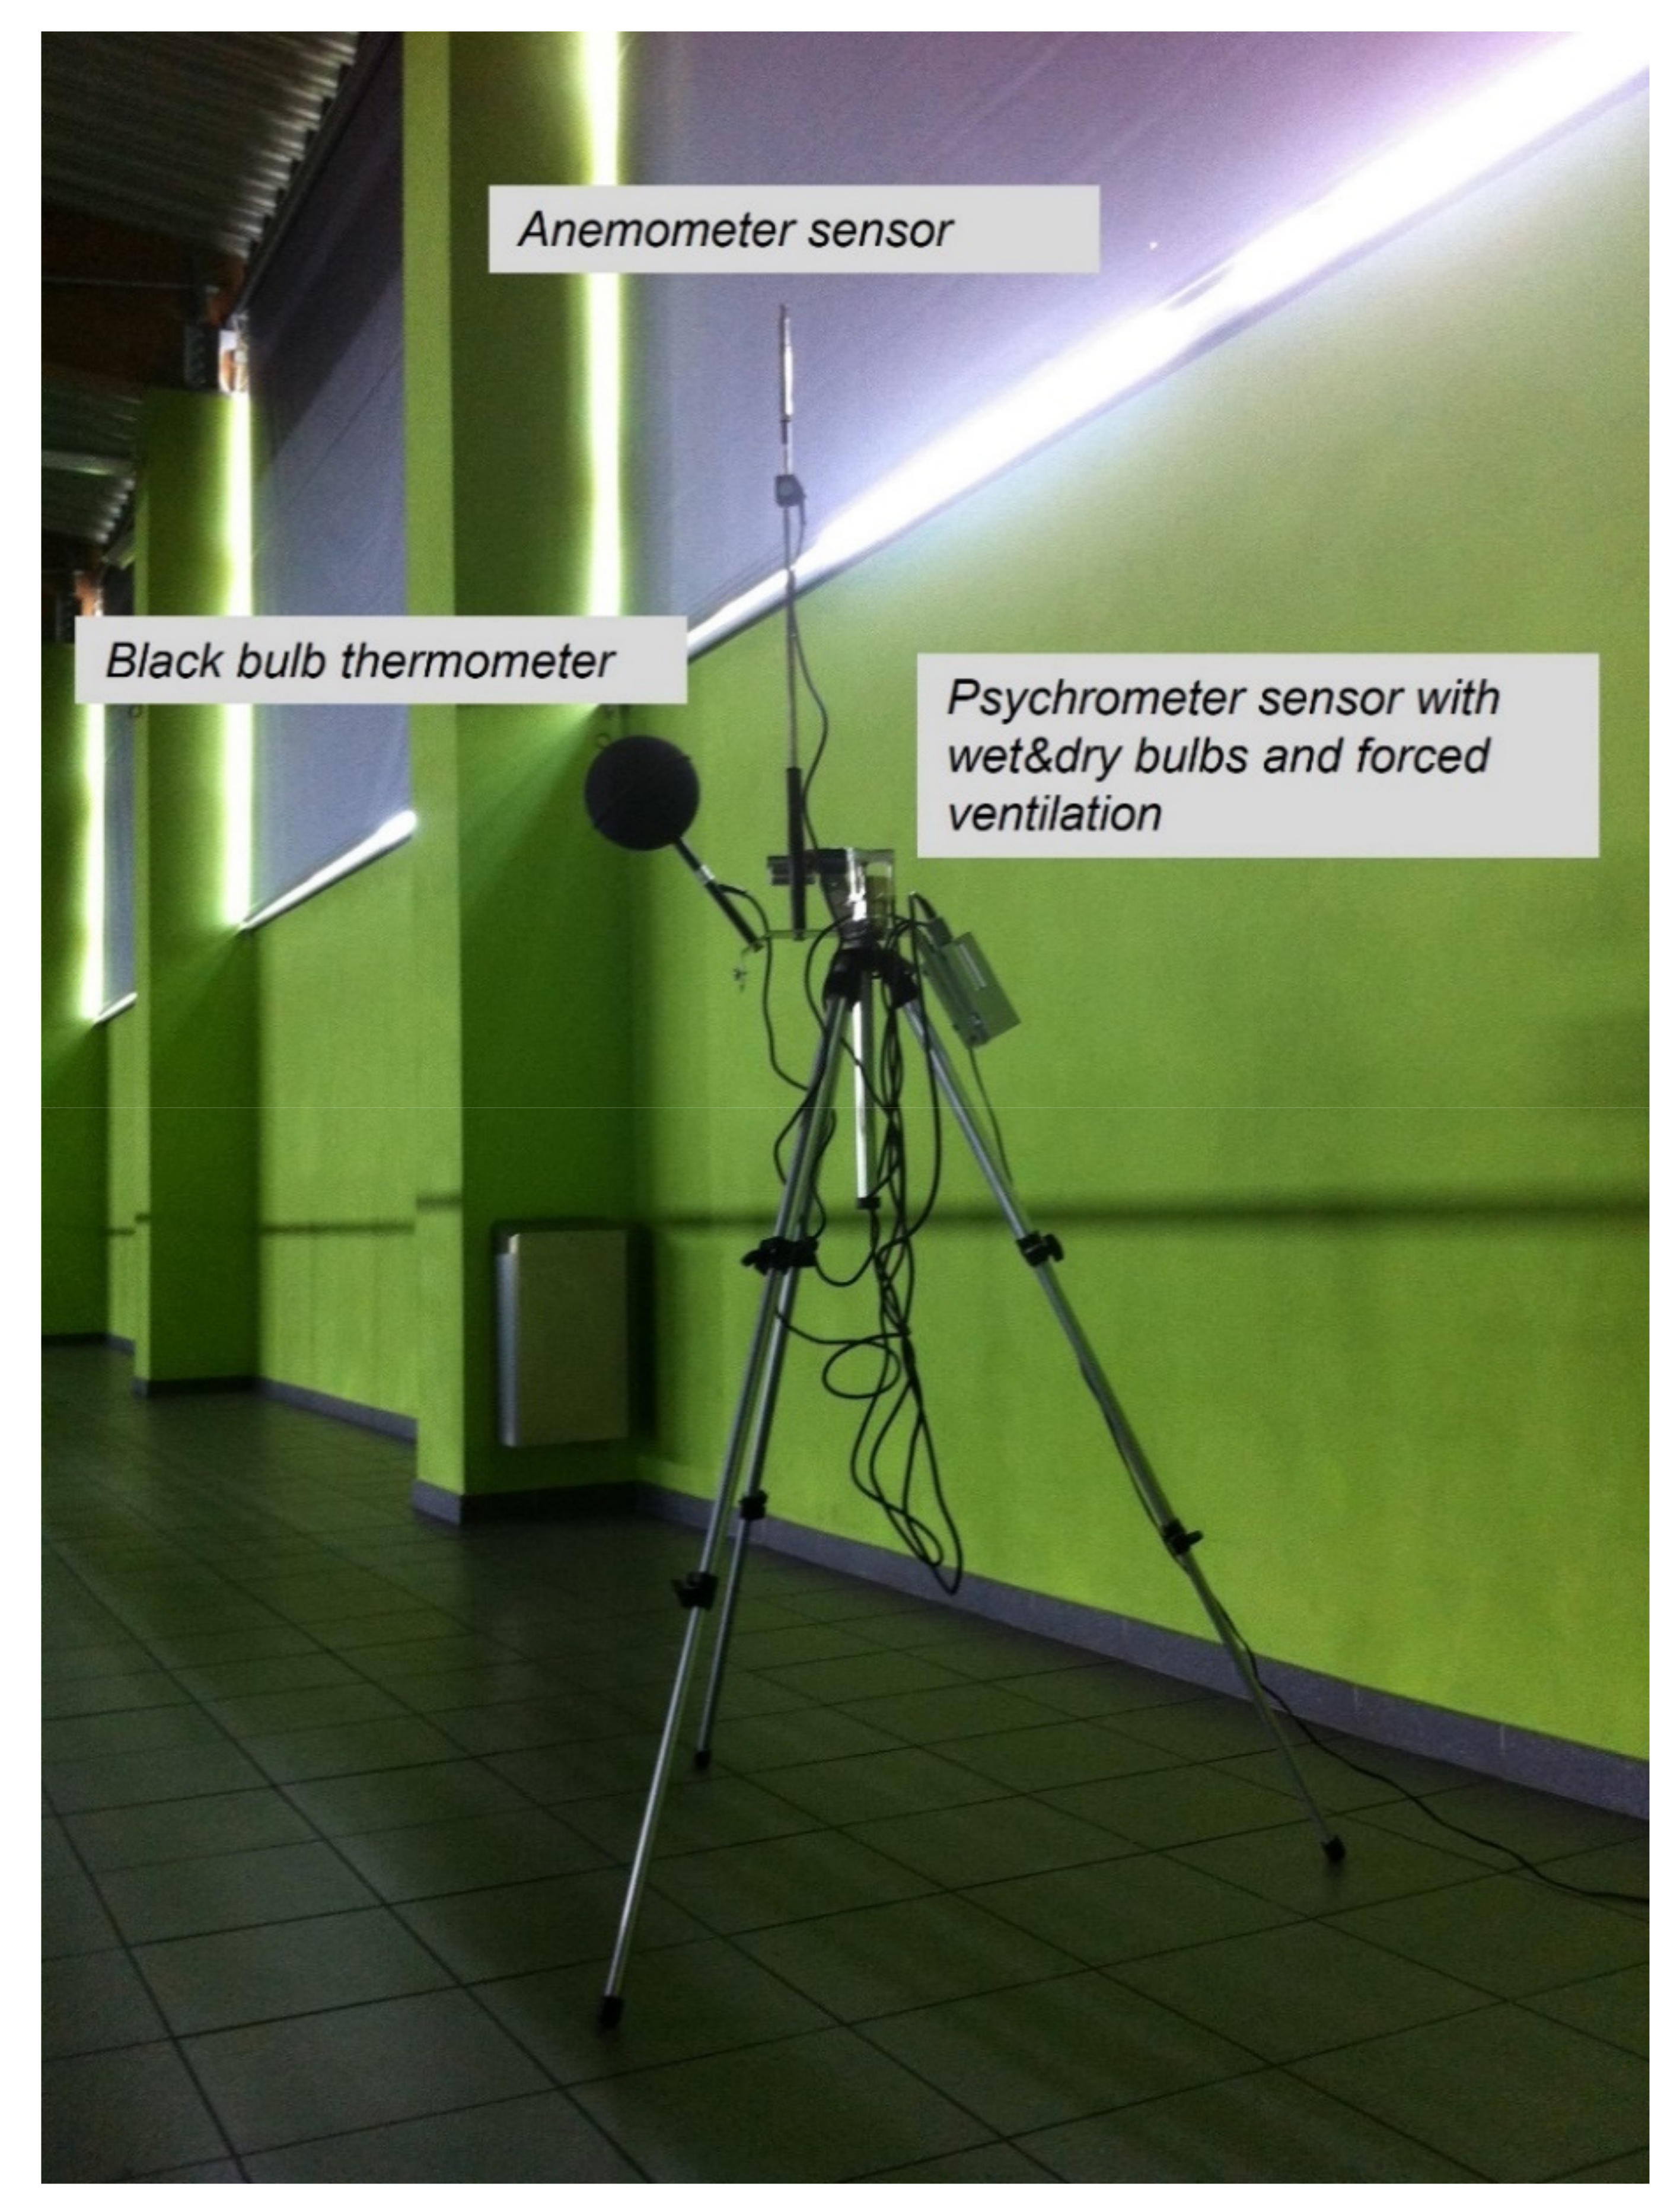
3.1. Experimental Analysis
3.2. Simulation Variants and Results
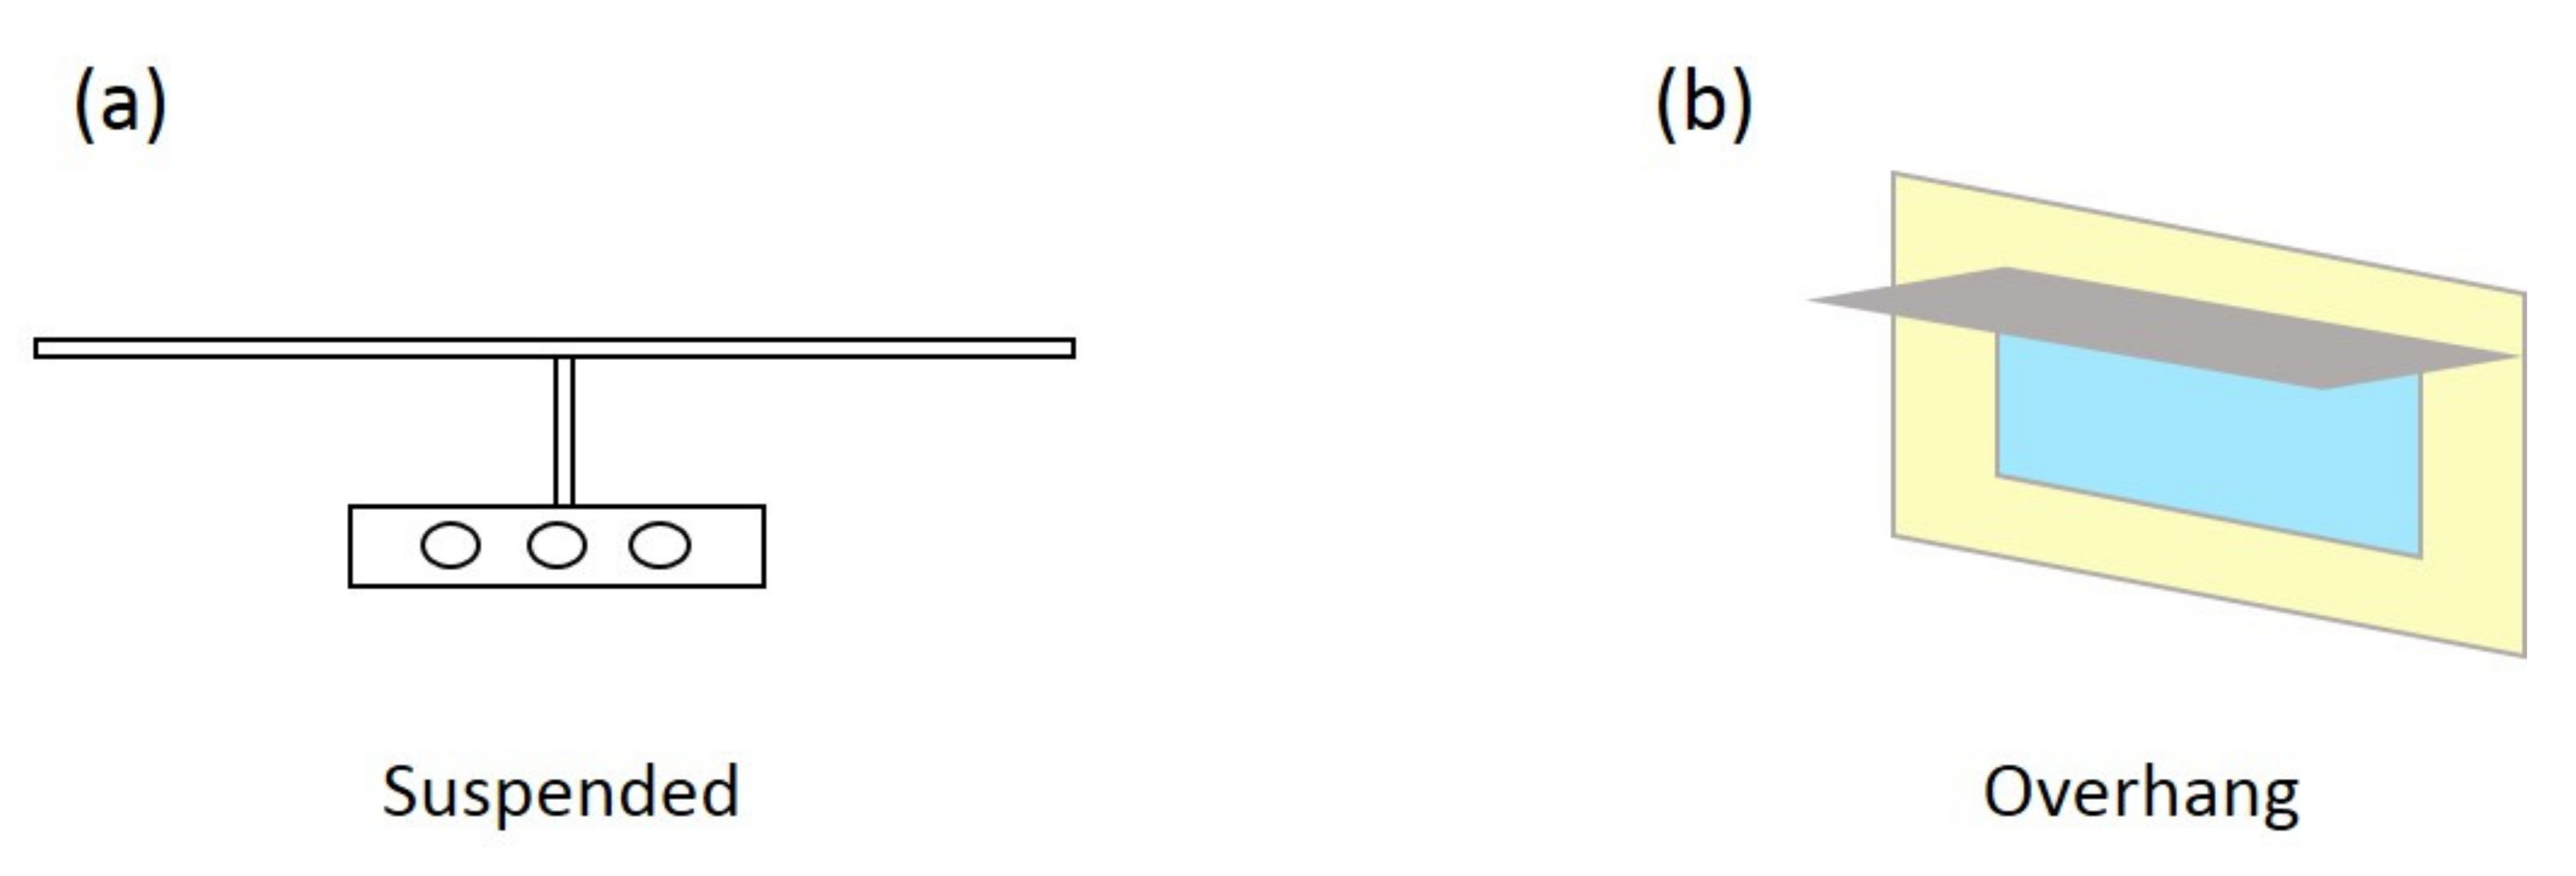
- Variant 1: Overhangs brise-soleils were used (Figure 5b) with an overhang of 1 m, and shading roller blinds located on the inner side of the window, assuming the following output parameters:
- ∘
- Solar energy transmittance of the blind—0.05;
- ∘
- Solar energy reflectance of the blind—0.35.
- Variant 2: no brise-soleils; shading roller blinds located on the external side of the window, with the parameters as above.
- Variant 3: Overhangs with a range of 2 m, shading roller blinds placed on the inner side of the window, with the same parameters as above.
- Variant 4: Overhangs with a reach of 1 m, shading roller blinds located on the internal side of the window, with the following parameters:
- ∘
- Solar energy transmittance of the window shade- 0.1;
- ∘
- Solar energy reflection of the window shade- 0.5.
- Variant 5: Overhangs with an overhang of 1 m, shading roller blinds located on the external side of the window and parameters:
- ∘
- Solar energy transmittance of the window shade—0.00;
- ∘
- Solar energy reflection of the window shade—0.35.
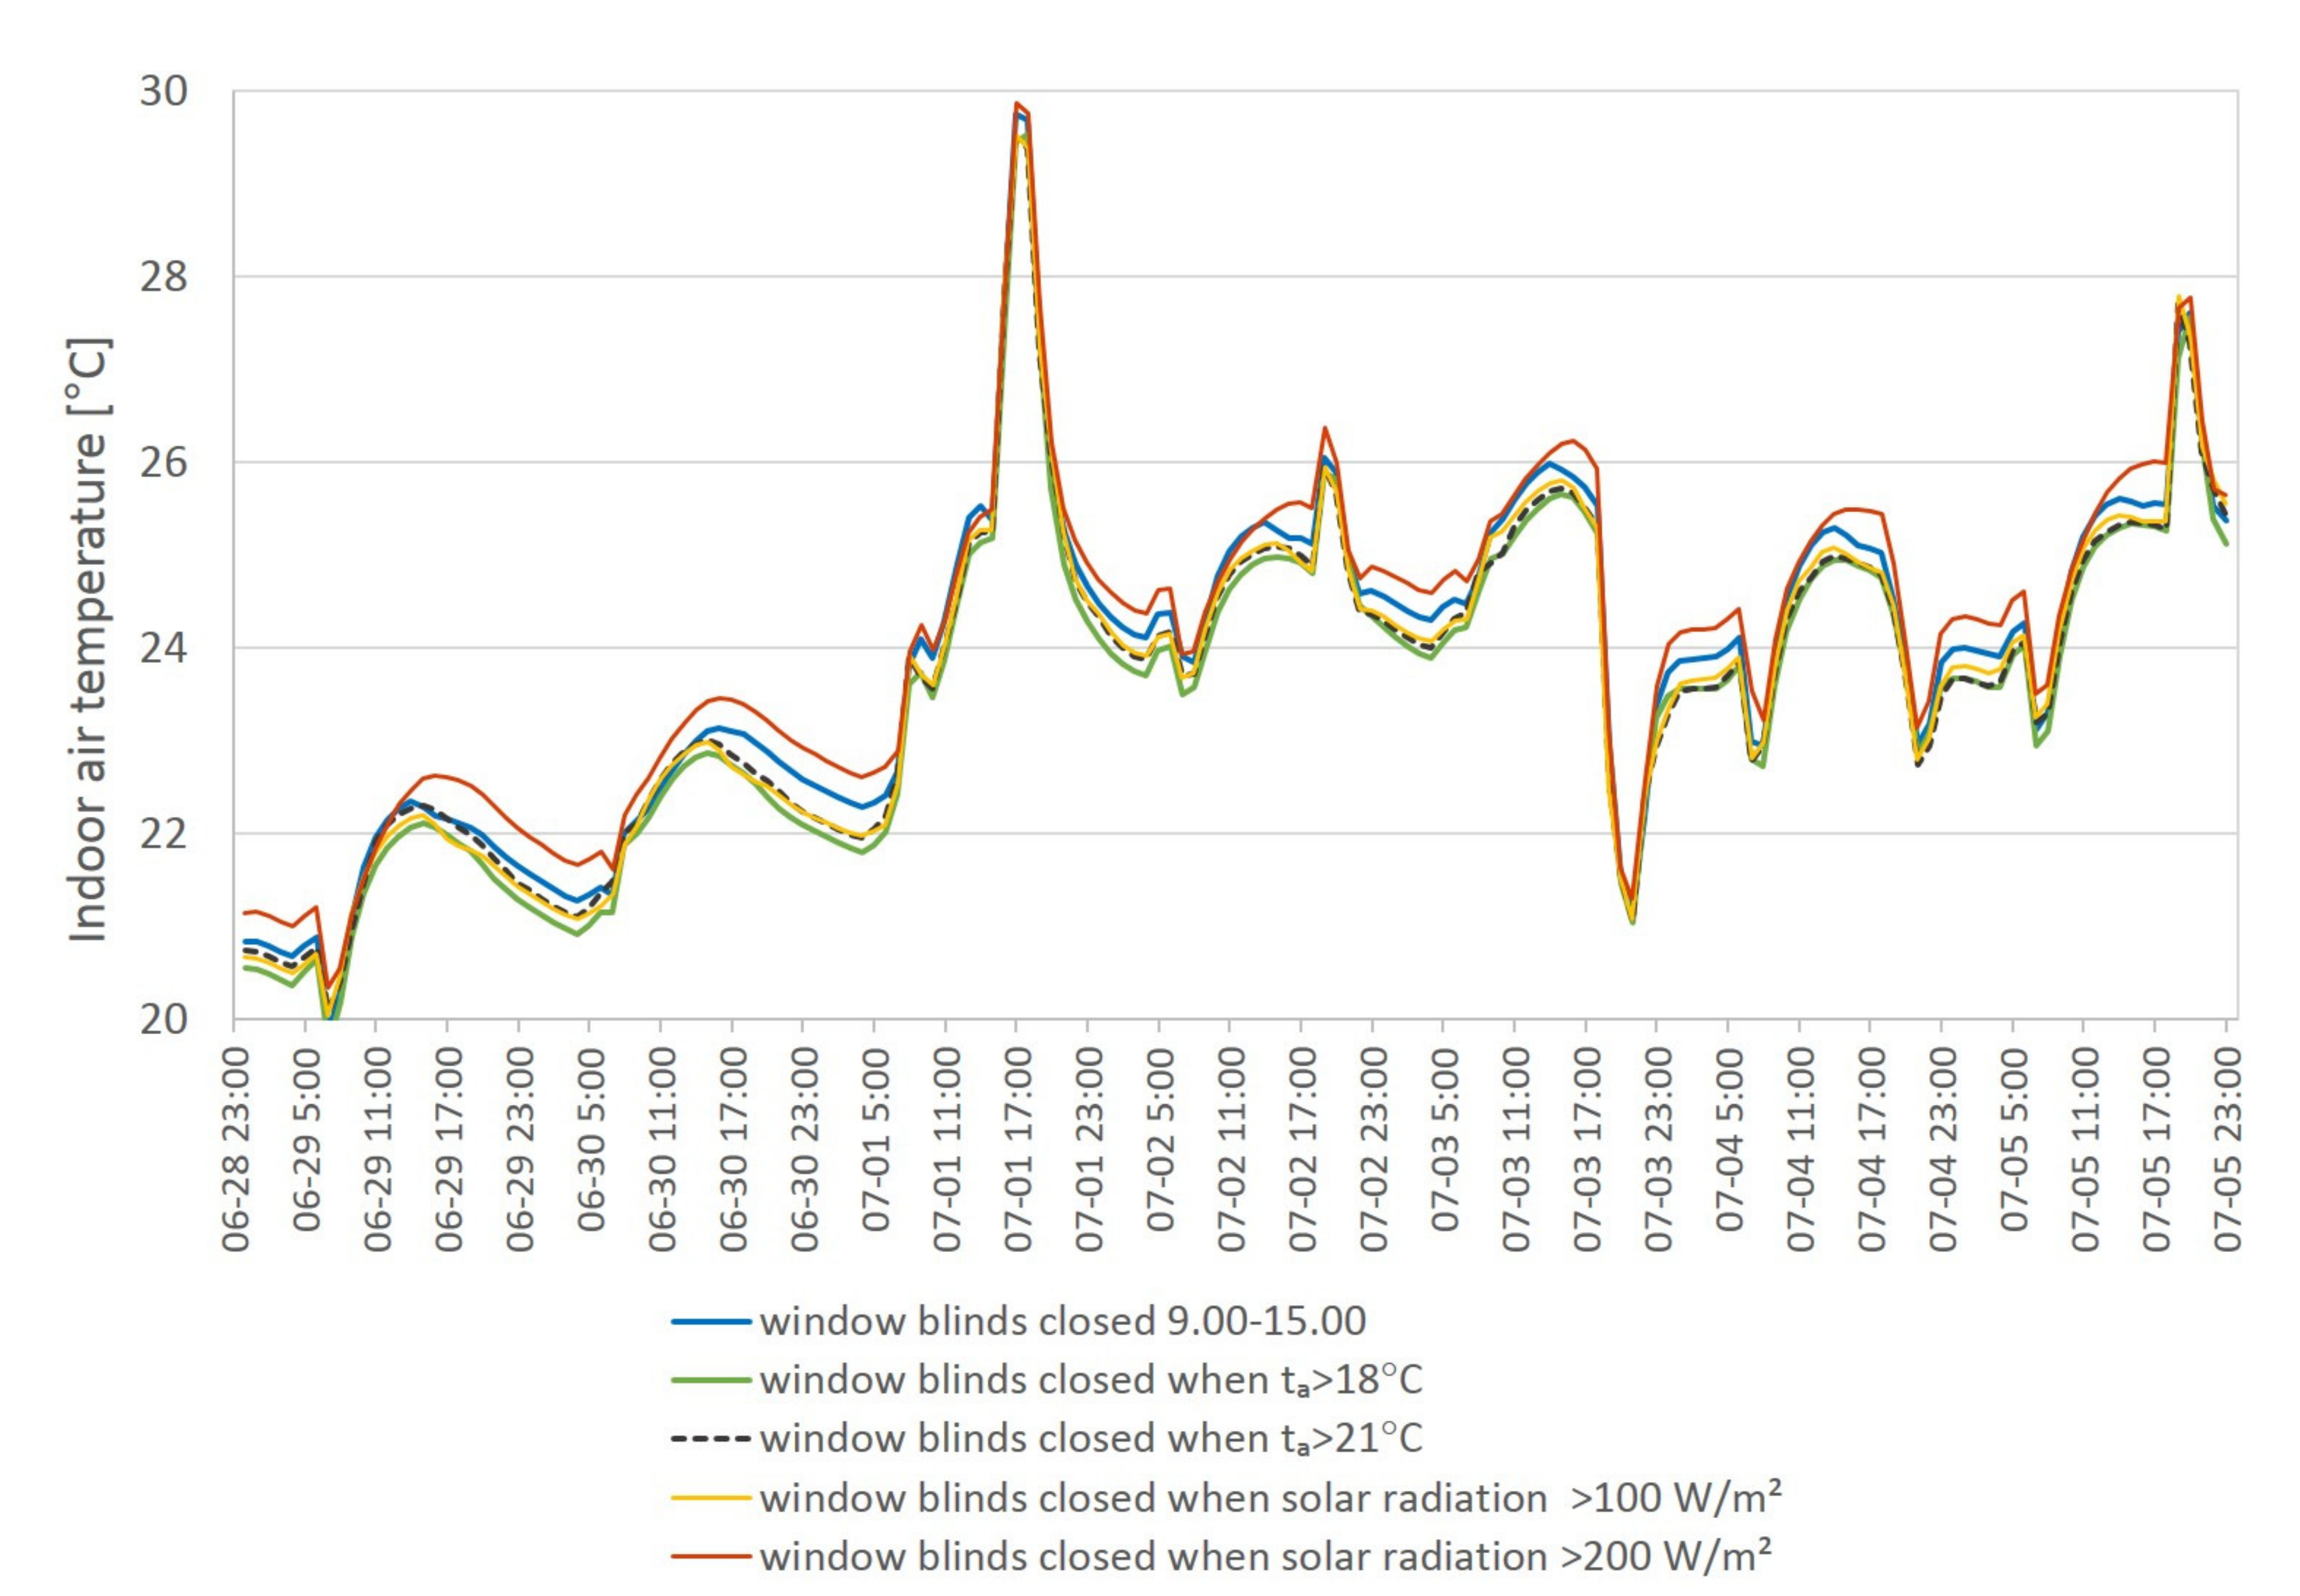
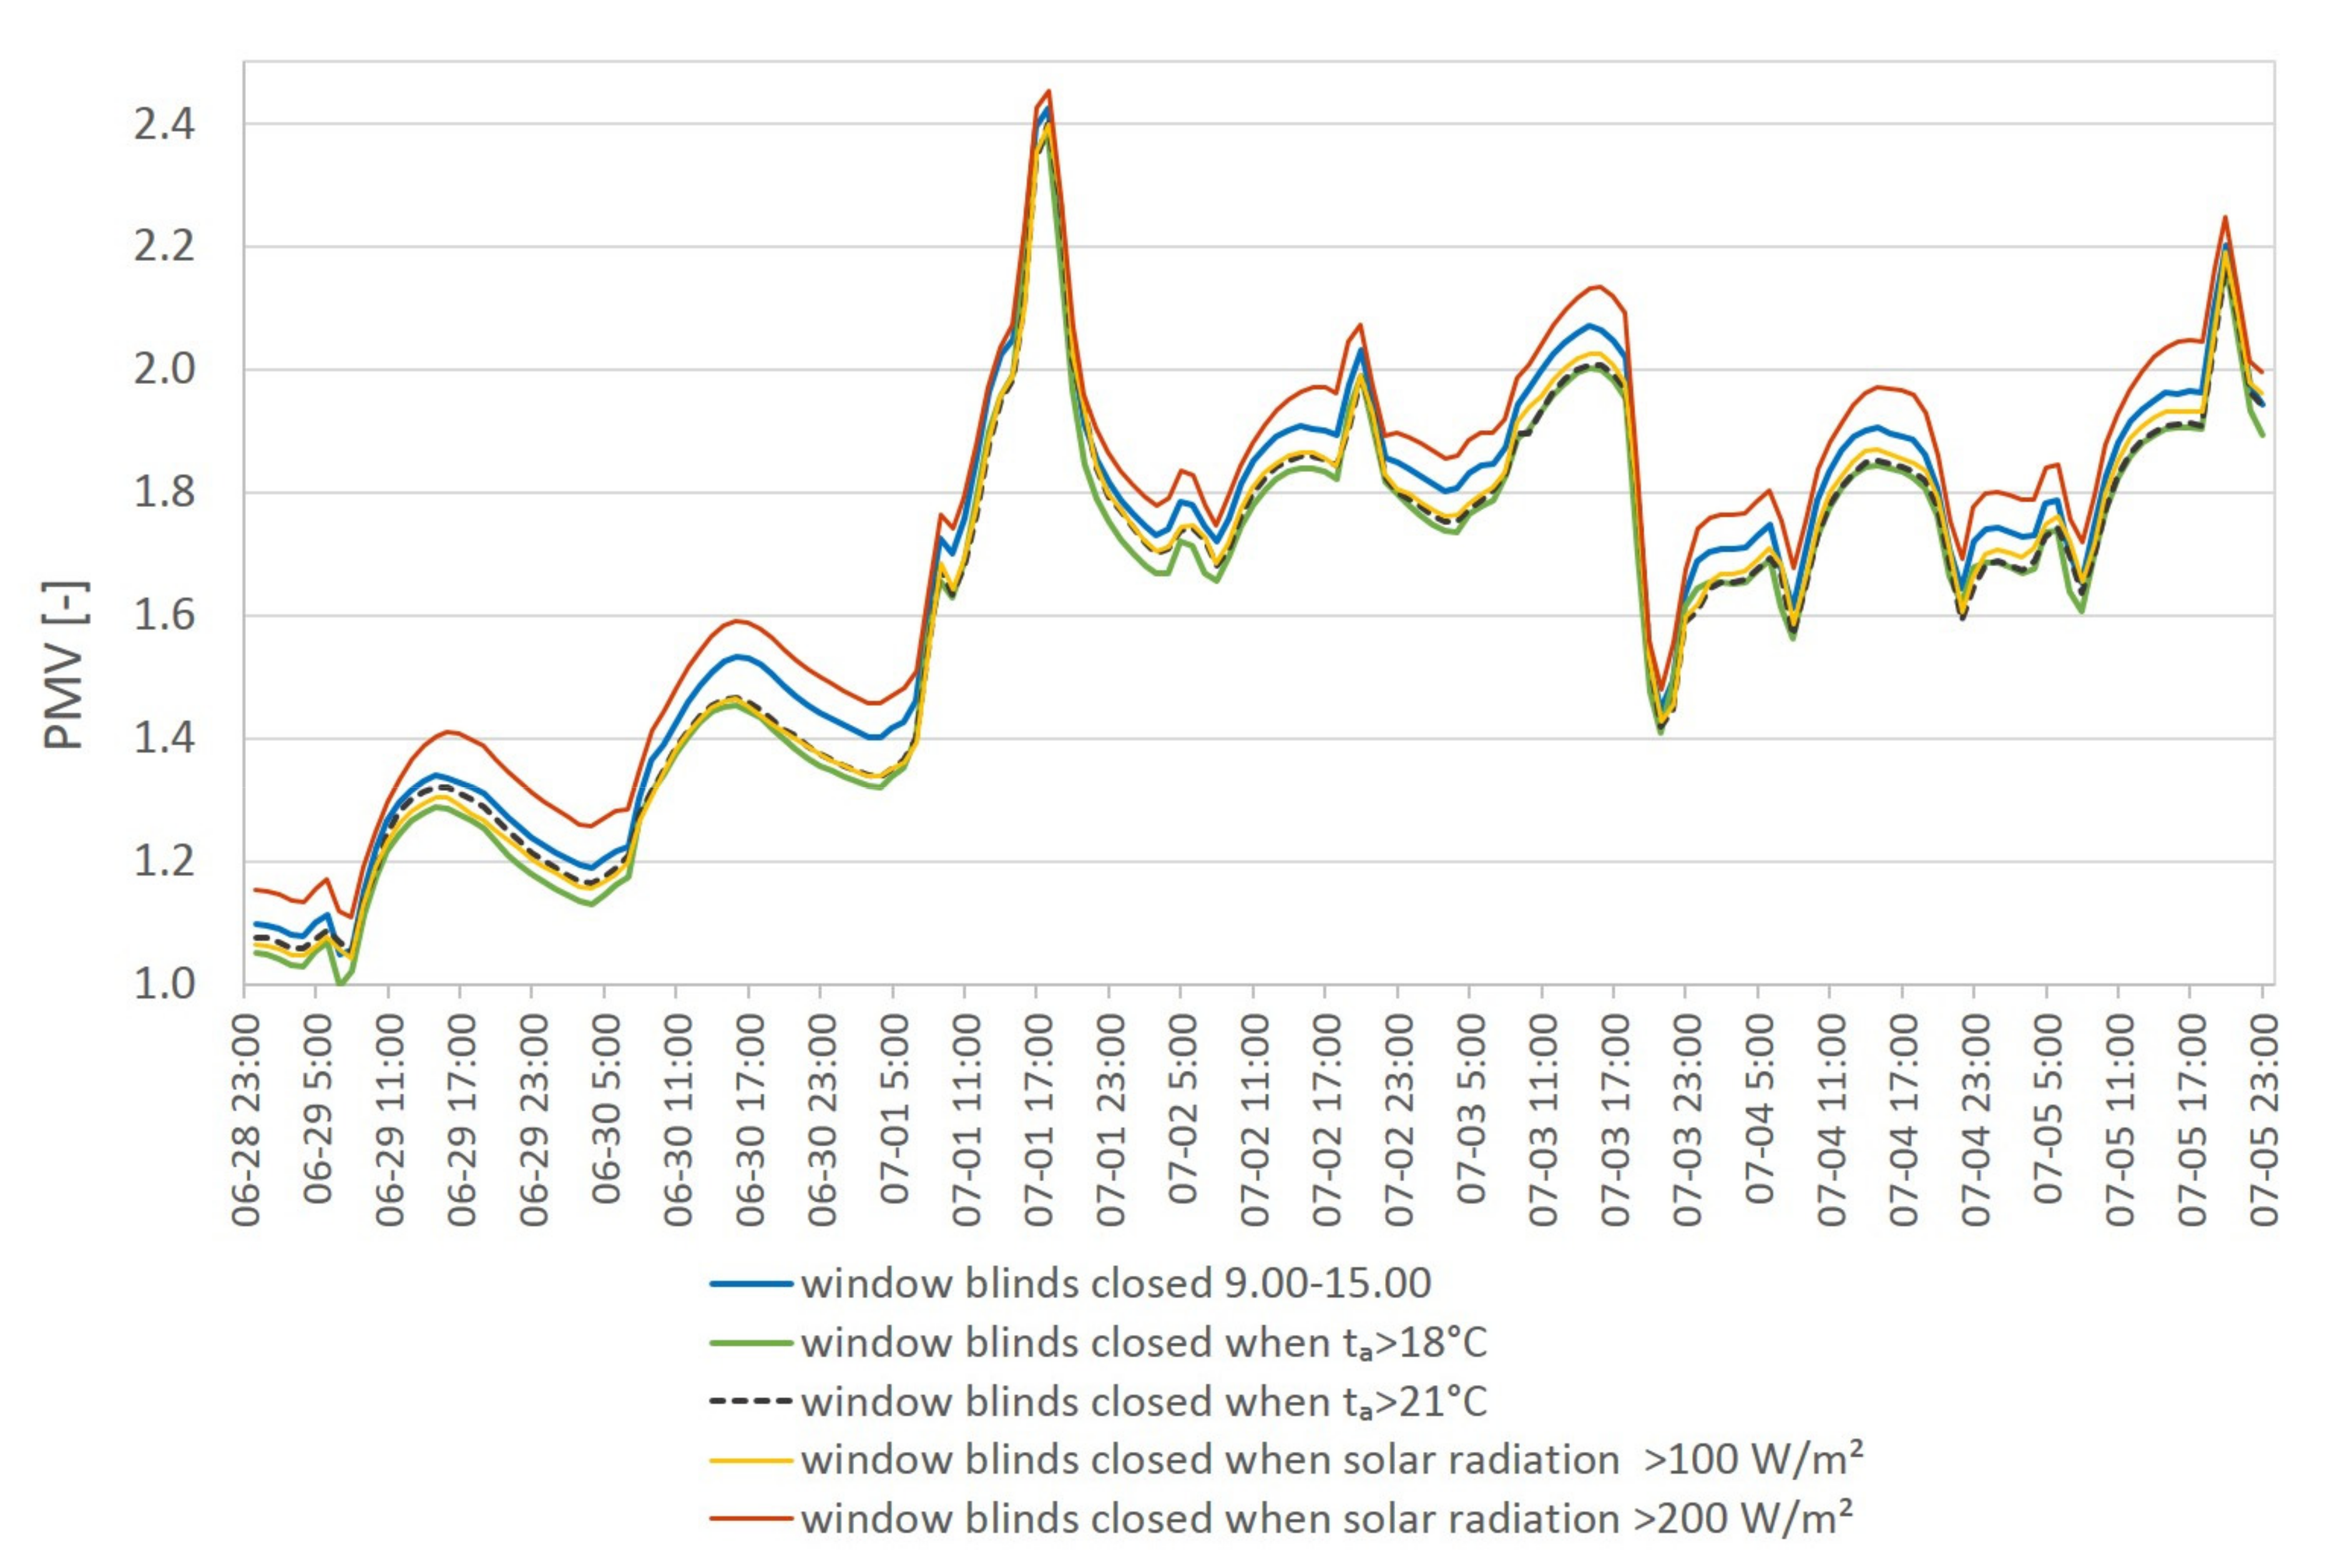
- Variant 1: assumptions as in point 3.2, roller blinds closed 9 a.m.–3 p.m. (except Saturdays)—this option has been included here only in order to be able to compare the applied modifications with the actual use of the facility;
- Variant 2—blinds closed when indoor air temperature > 18 °C;
- Variant 3—blinds closed when indoor air temperature > 21 °C;
- Variant 4—blinds closed when solar radiation intensity > 100 W/m2;
- Variant 5—blinds closed when solar radiation intensity >200 W/m2.
4. Discussion of Results
5. Conclusions
- Due to the very high level of user’s activity of a sports hall, thermal comfort conditions require a low operative temperature. Obtaining such conditions throughout the summer period by using only passive solutions is practically impossible, even in the temperate climate of Central Europe. The window cover solutions analyzed in the article only partially improve the internal conditions in the hall. At the same time, they are indispensable as part of all activities in this area;
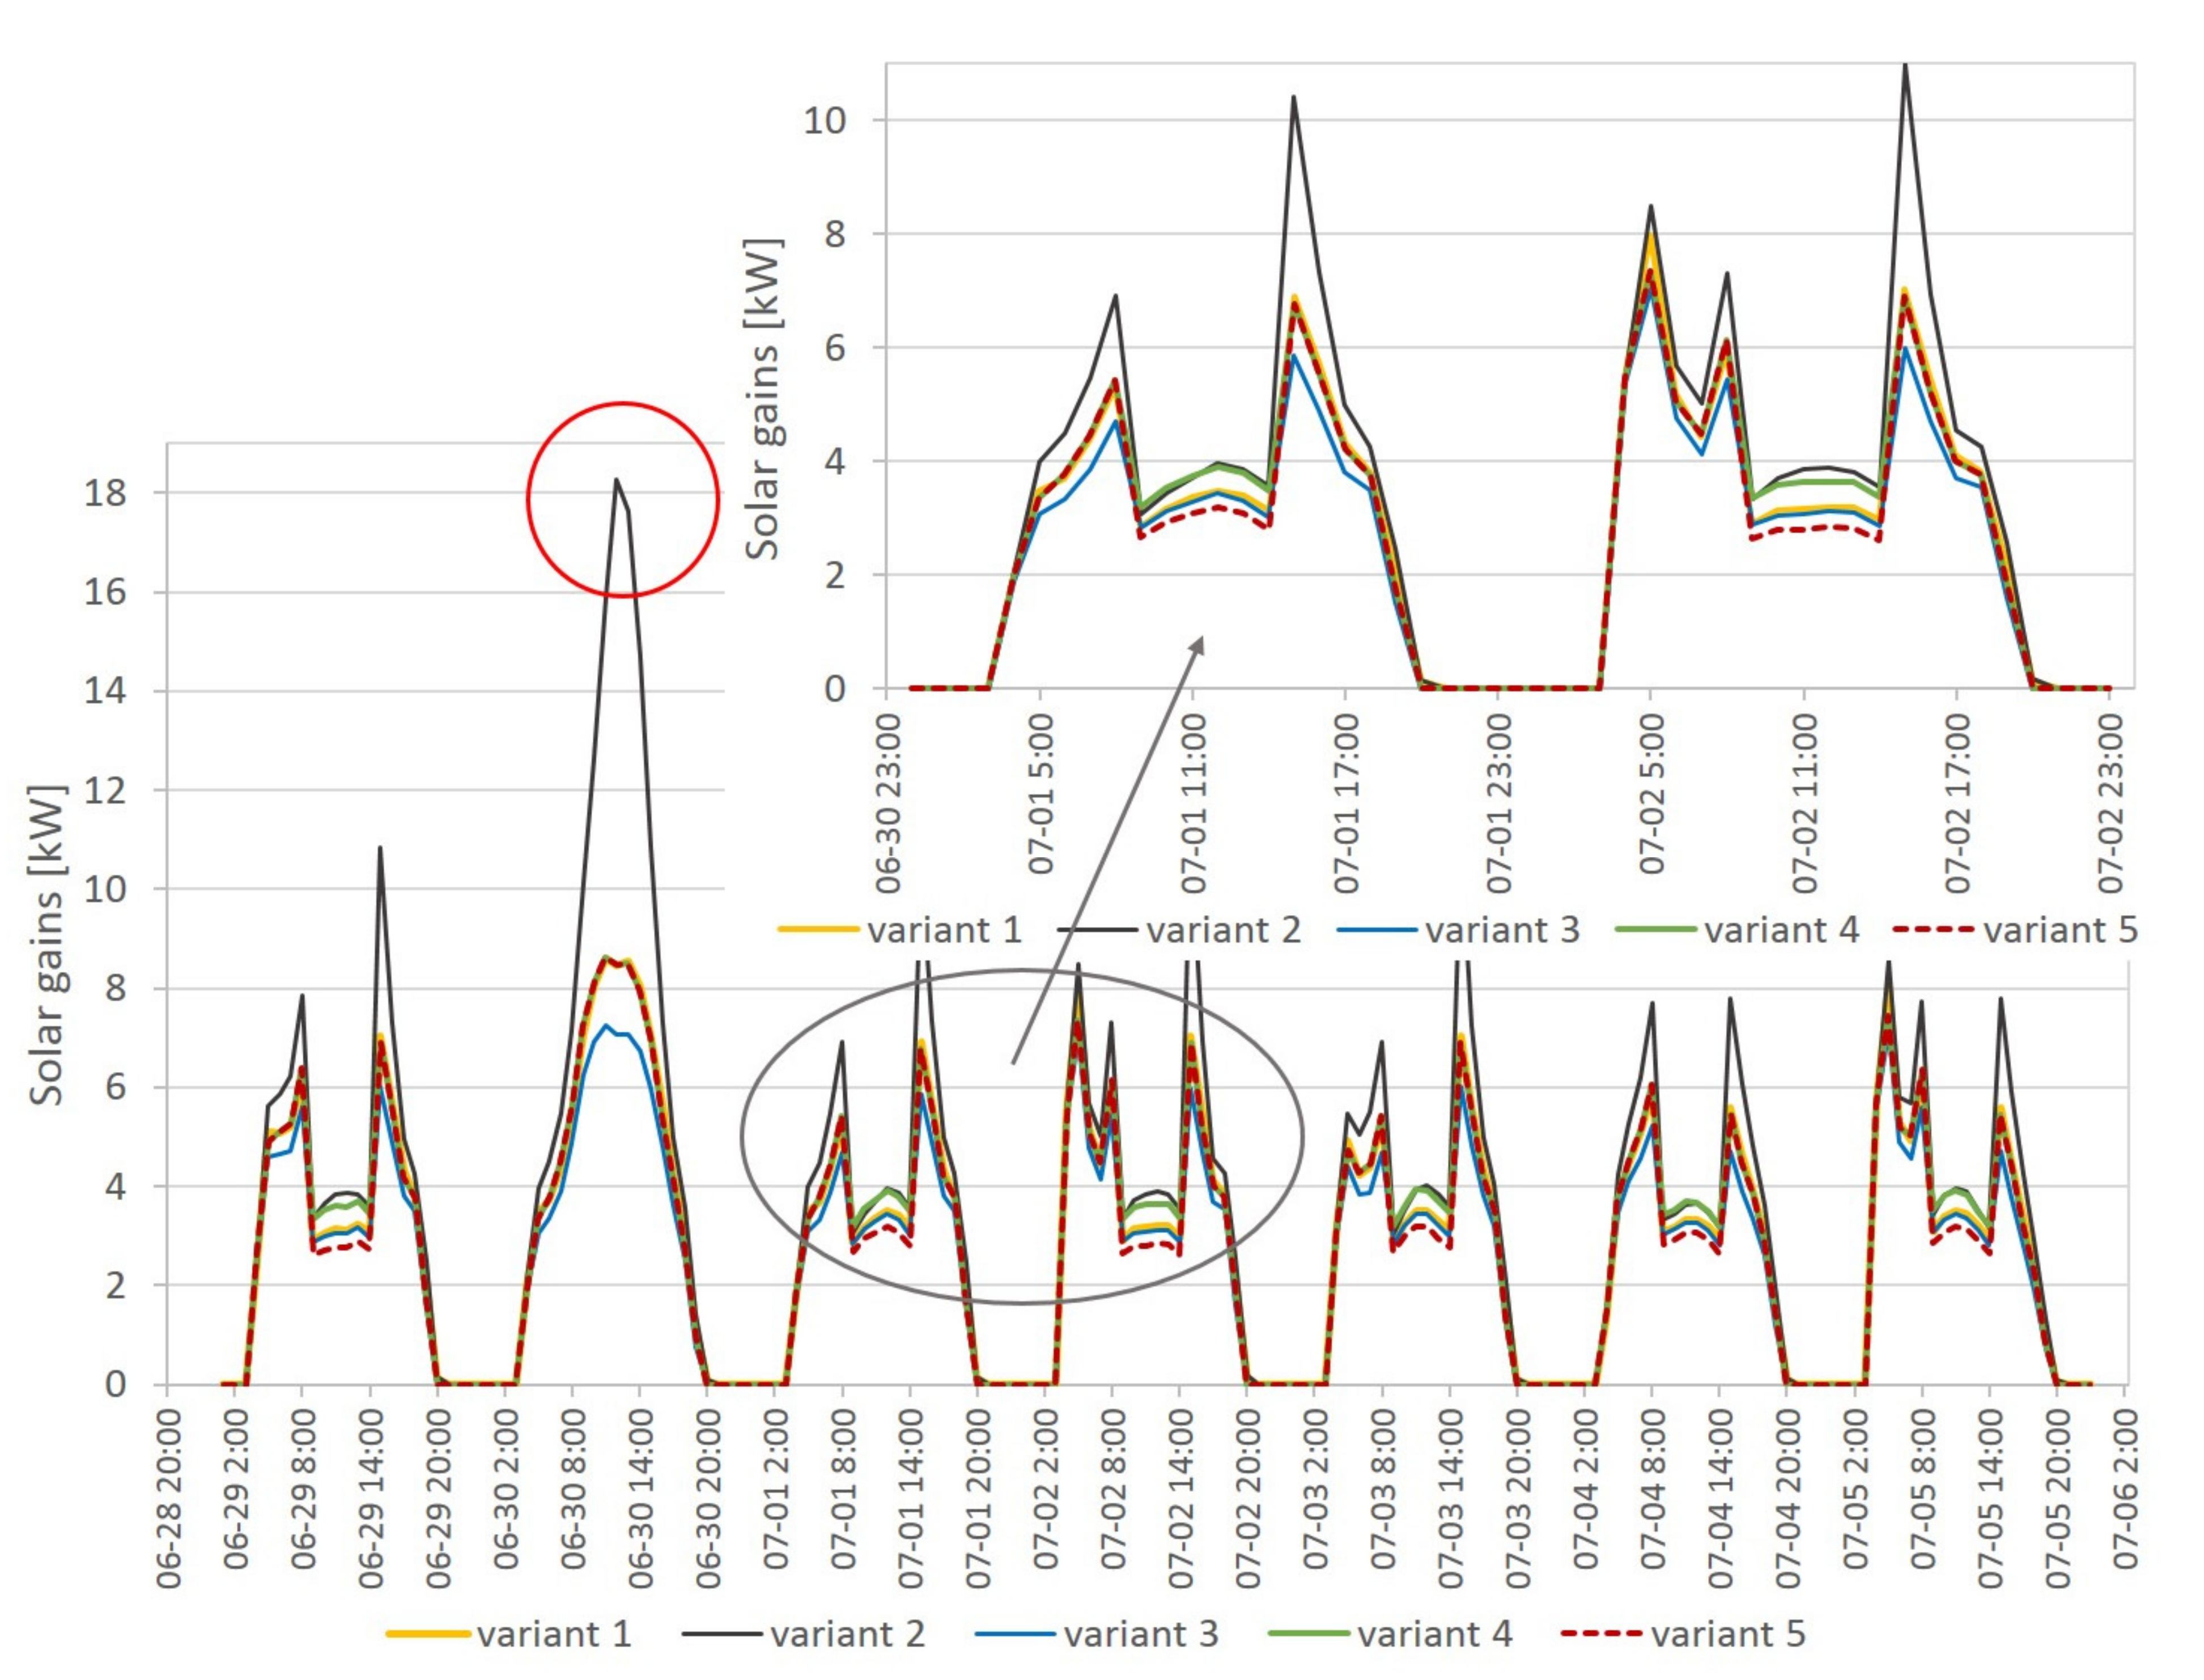
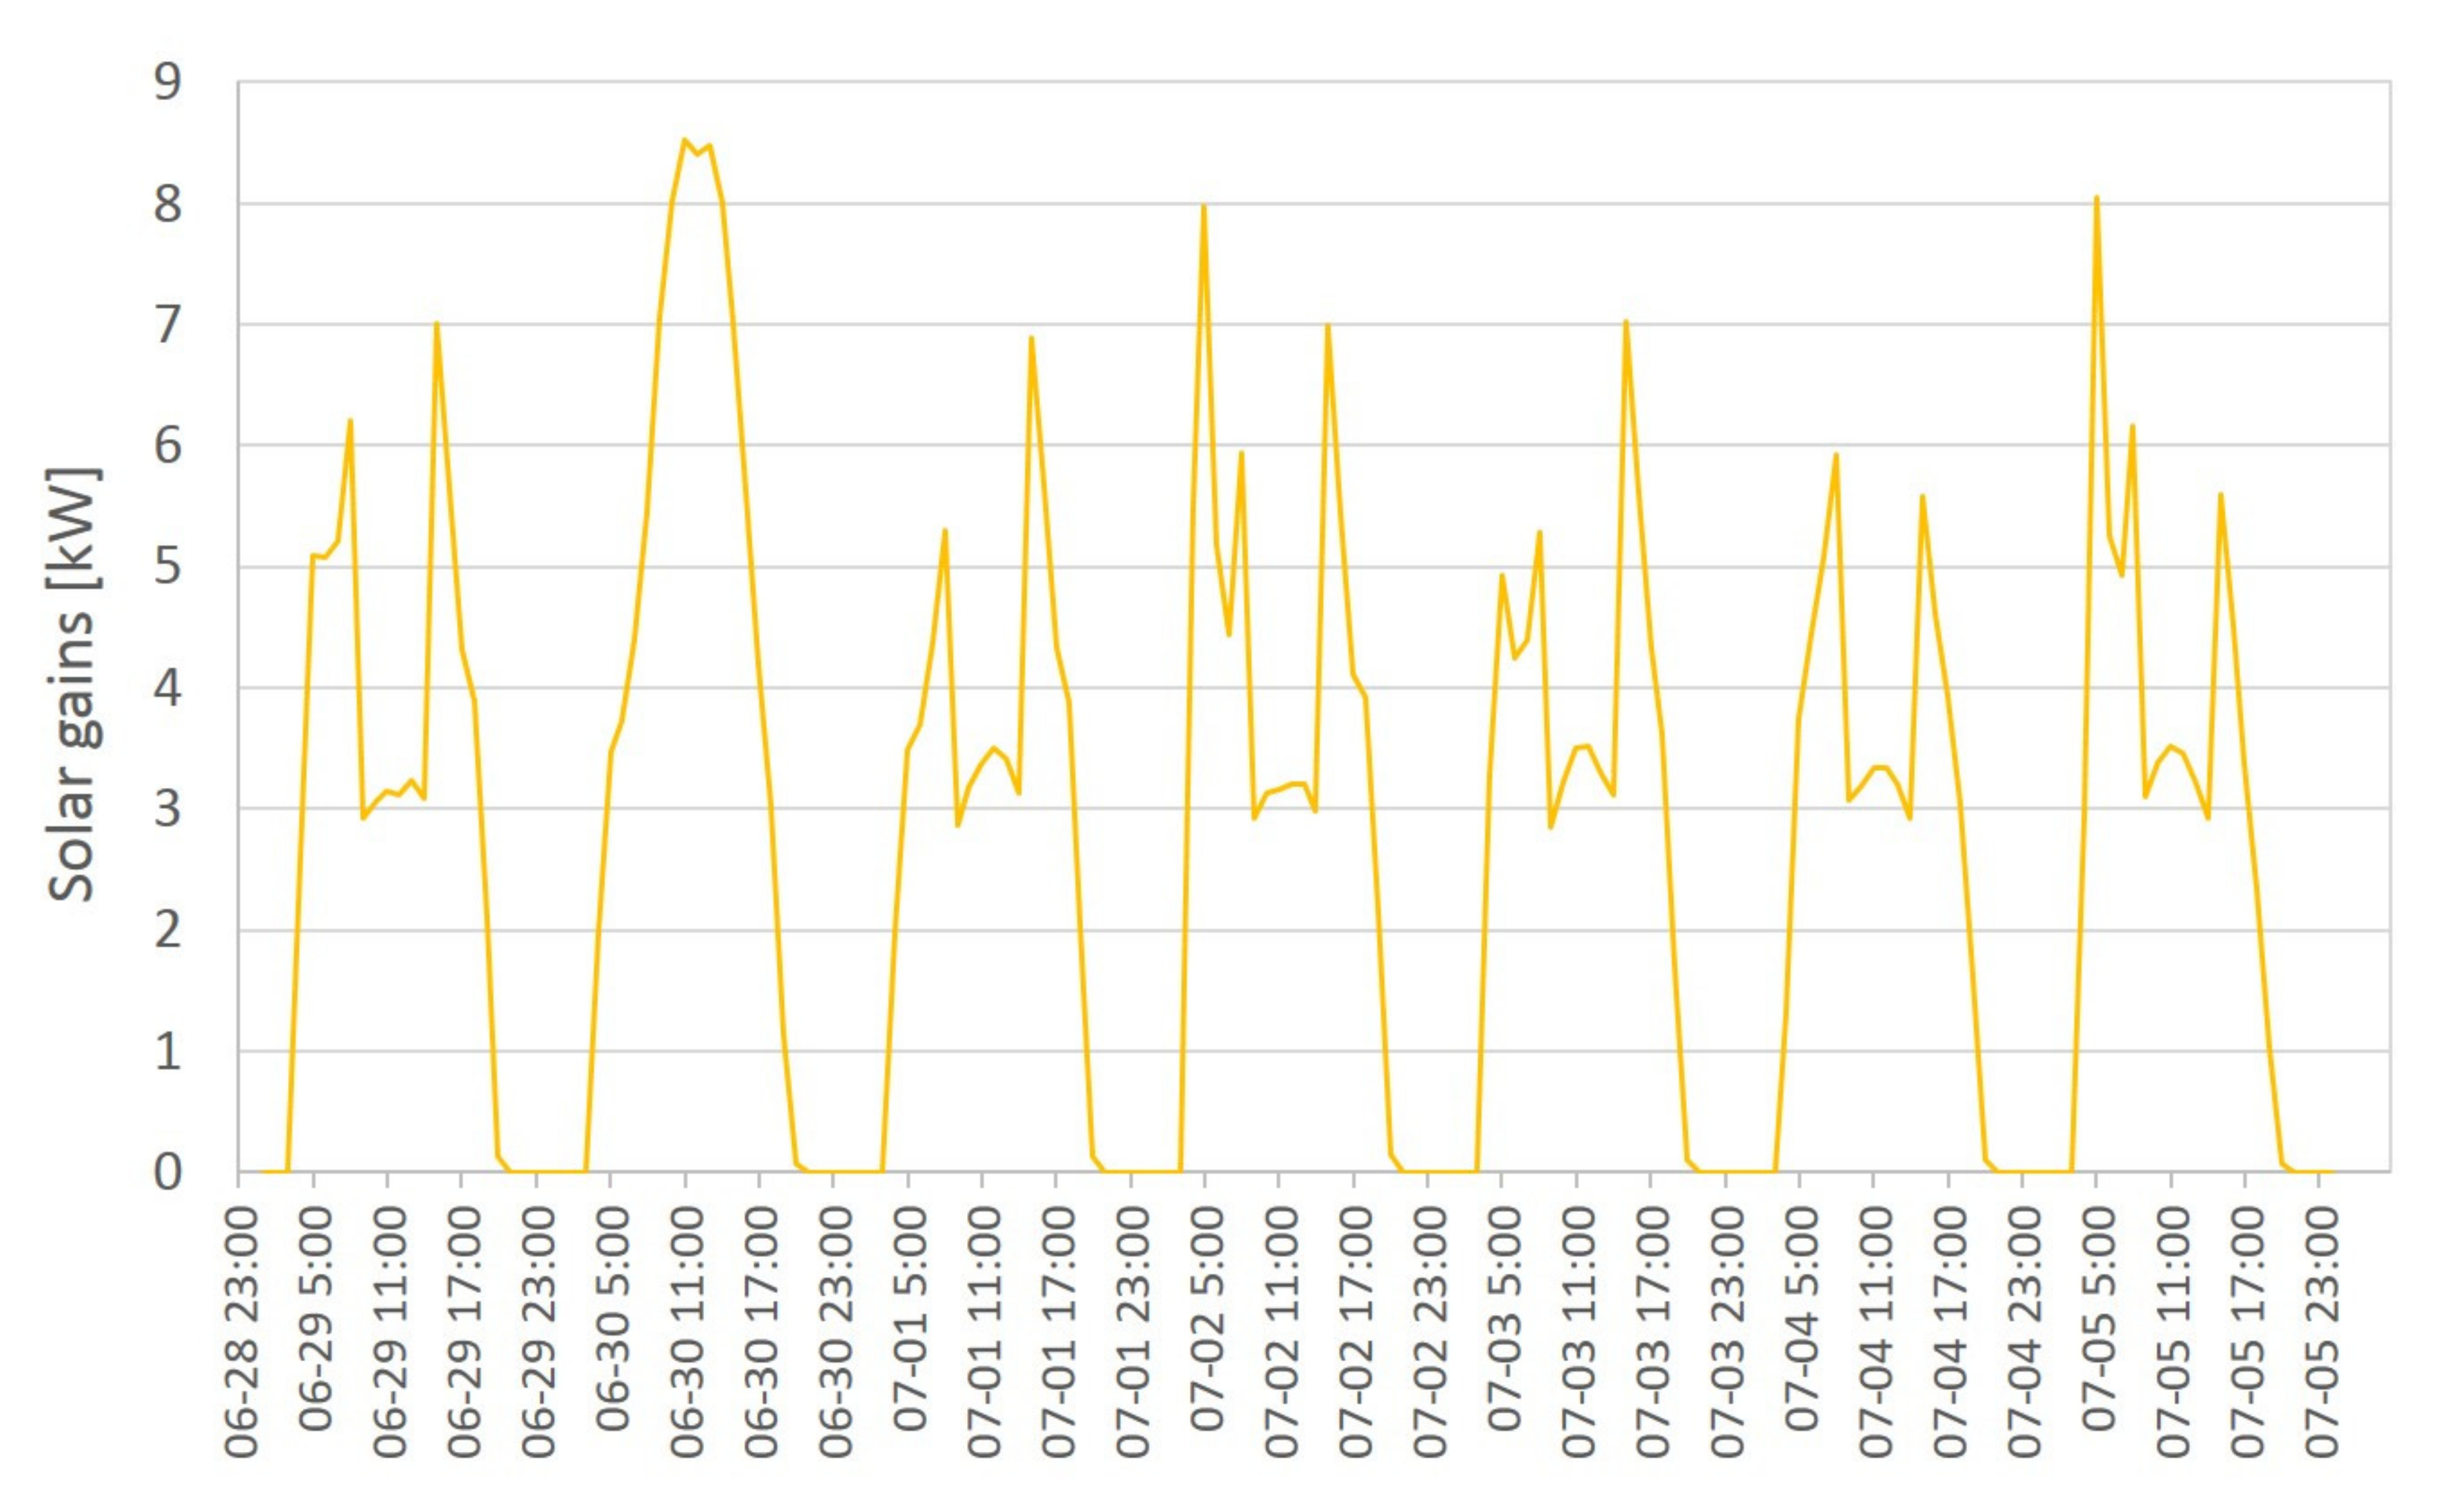
- External brise-soleils are able to limit the access of sunlight to the rooms by up to 30%, but this is not enough to guarantee thermal comfort inside. Increasing the range of the brise-soleils by 1 m reduces gains from radiation only by 6.8%. The angle of inclination of these covers is constant for all year; therefore, the impact of the overhang on lowering the temperature inside the summer is limited;
- The building should be protected from the south by external brise-soleils with appropriately selected overhang. Due to different angles of incidence of the sun’s rays (depending on the season of the year, time of the day, and intensity of sunlight), at the stage of designing the building, one can take into account the use of movable lamellas, enabling adjustment of the inclination of the window shade depending on the angle of radiation;
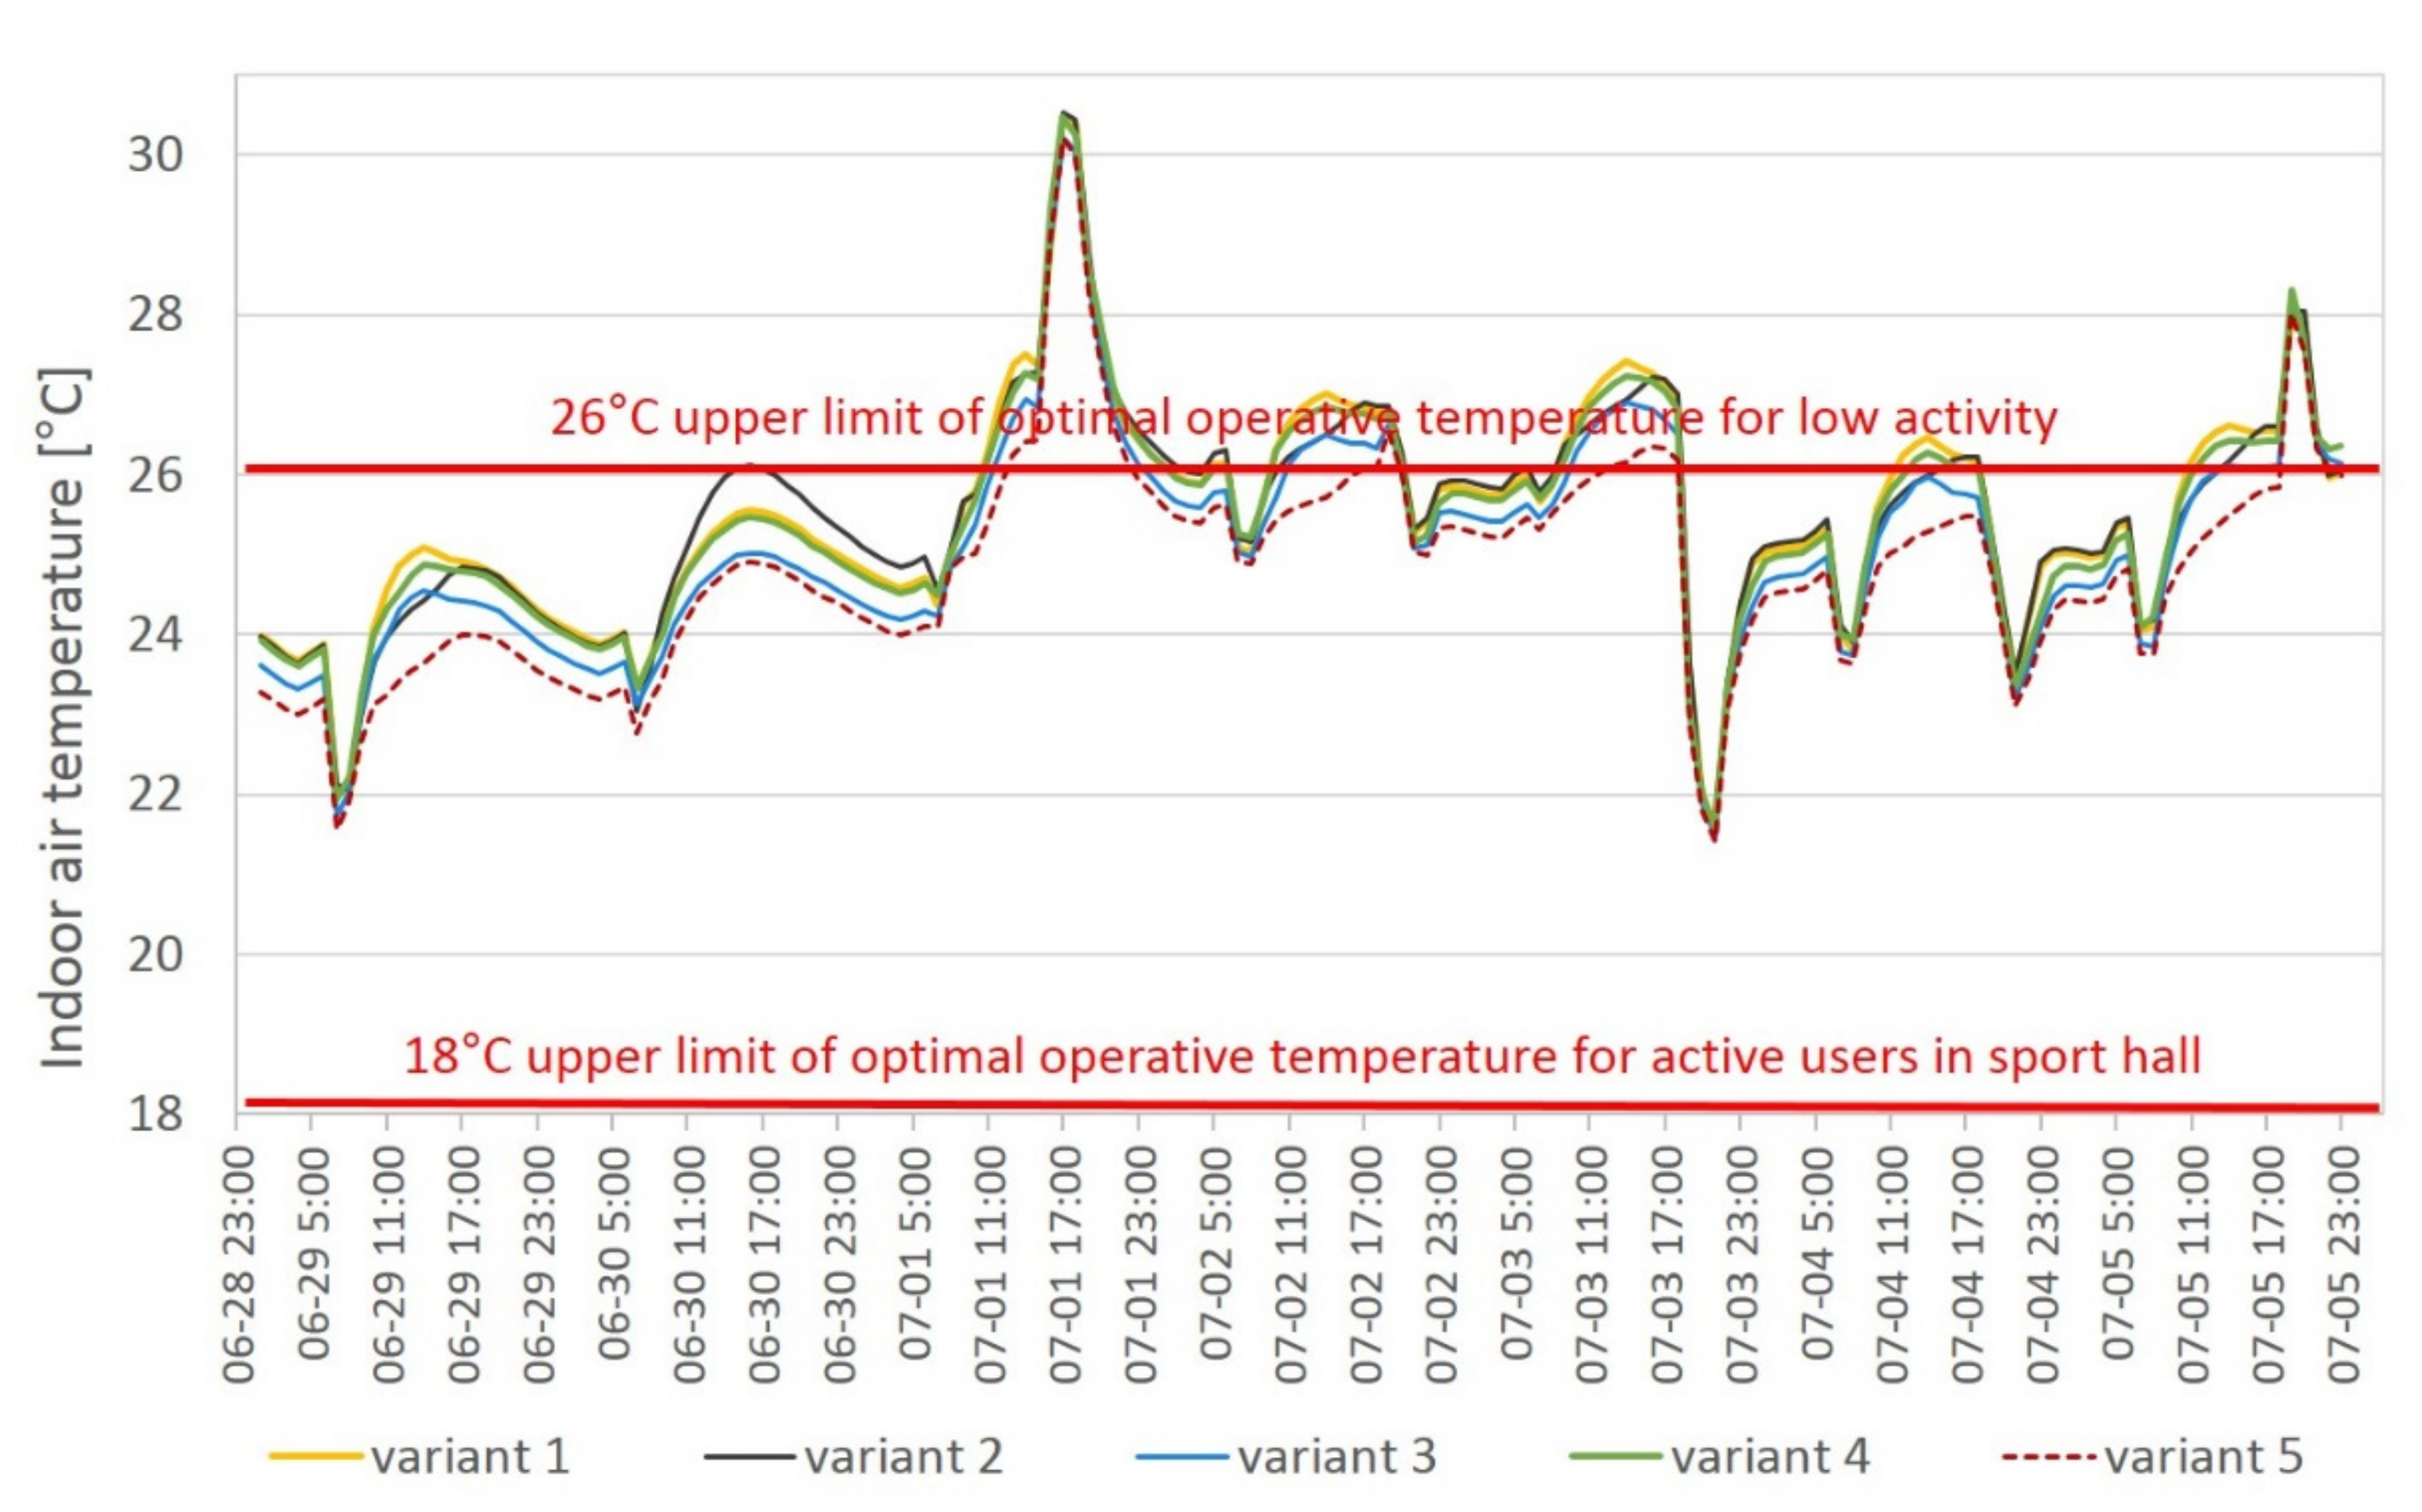
- Reduction in solar gains does not translate into a significant improvement of thermal conditions in the analyzed object. The difference in average values of indoor air temperature for the variants used is small and amounts to 0.1–0.6 °C;
- Overhangs and shading roller blinds used together in the most favorable fifth variant provide the most days in the comfort range, but it accounts for only 3.2% of the total time of the analyzed month. This result is completely inadequate in relation to the costs incurred for the blinds themselves and is not even perceptible to the user;
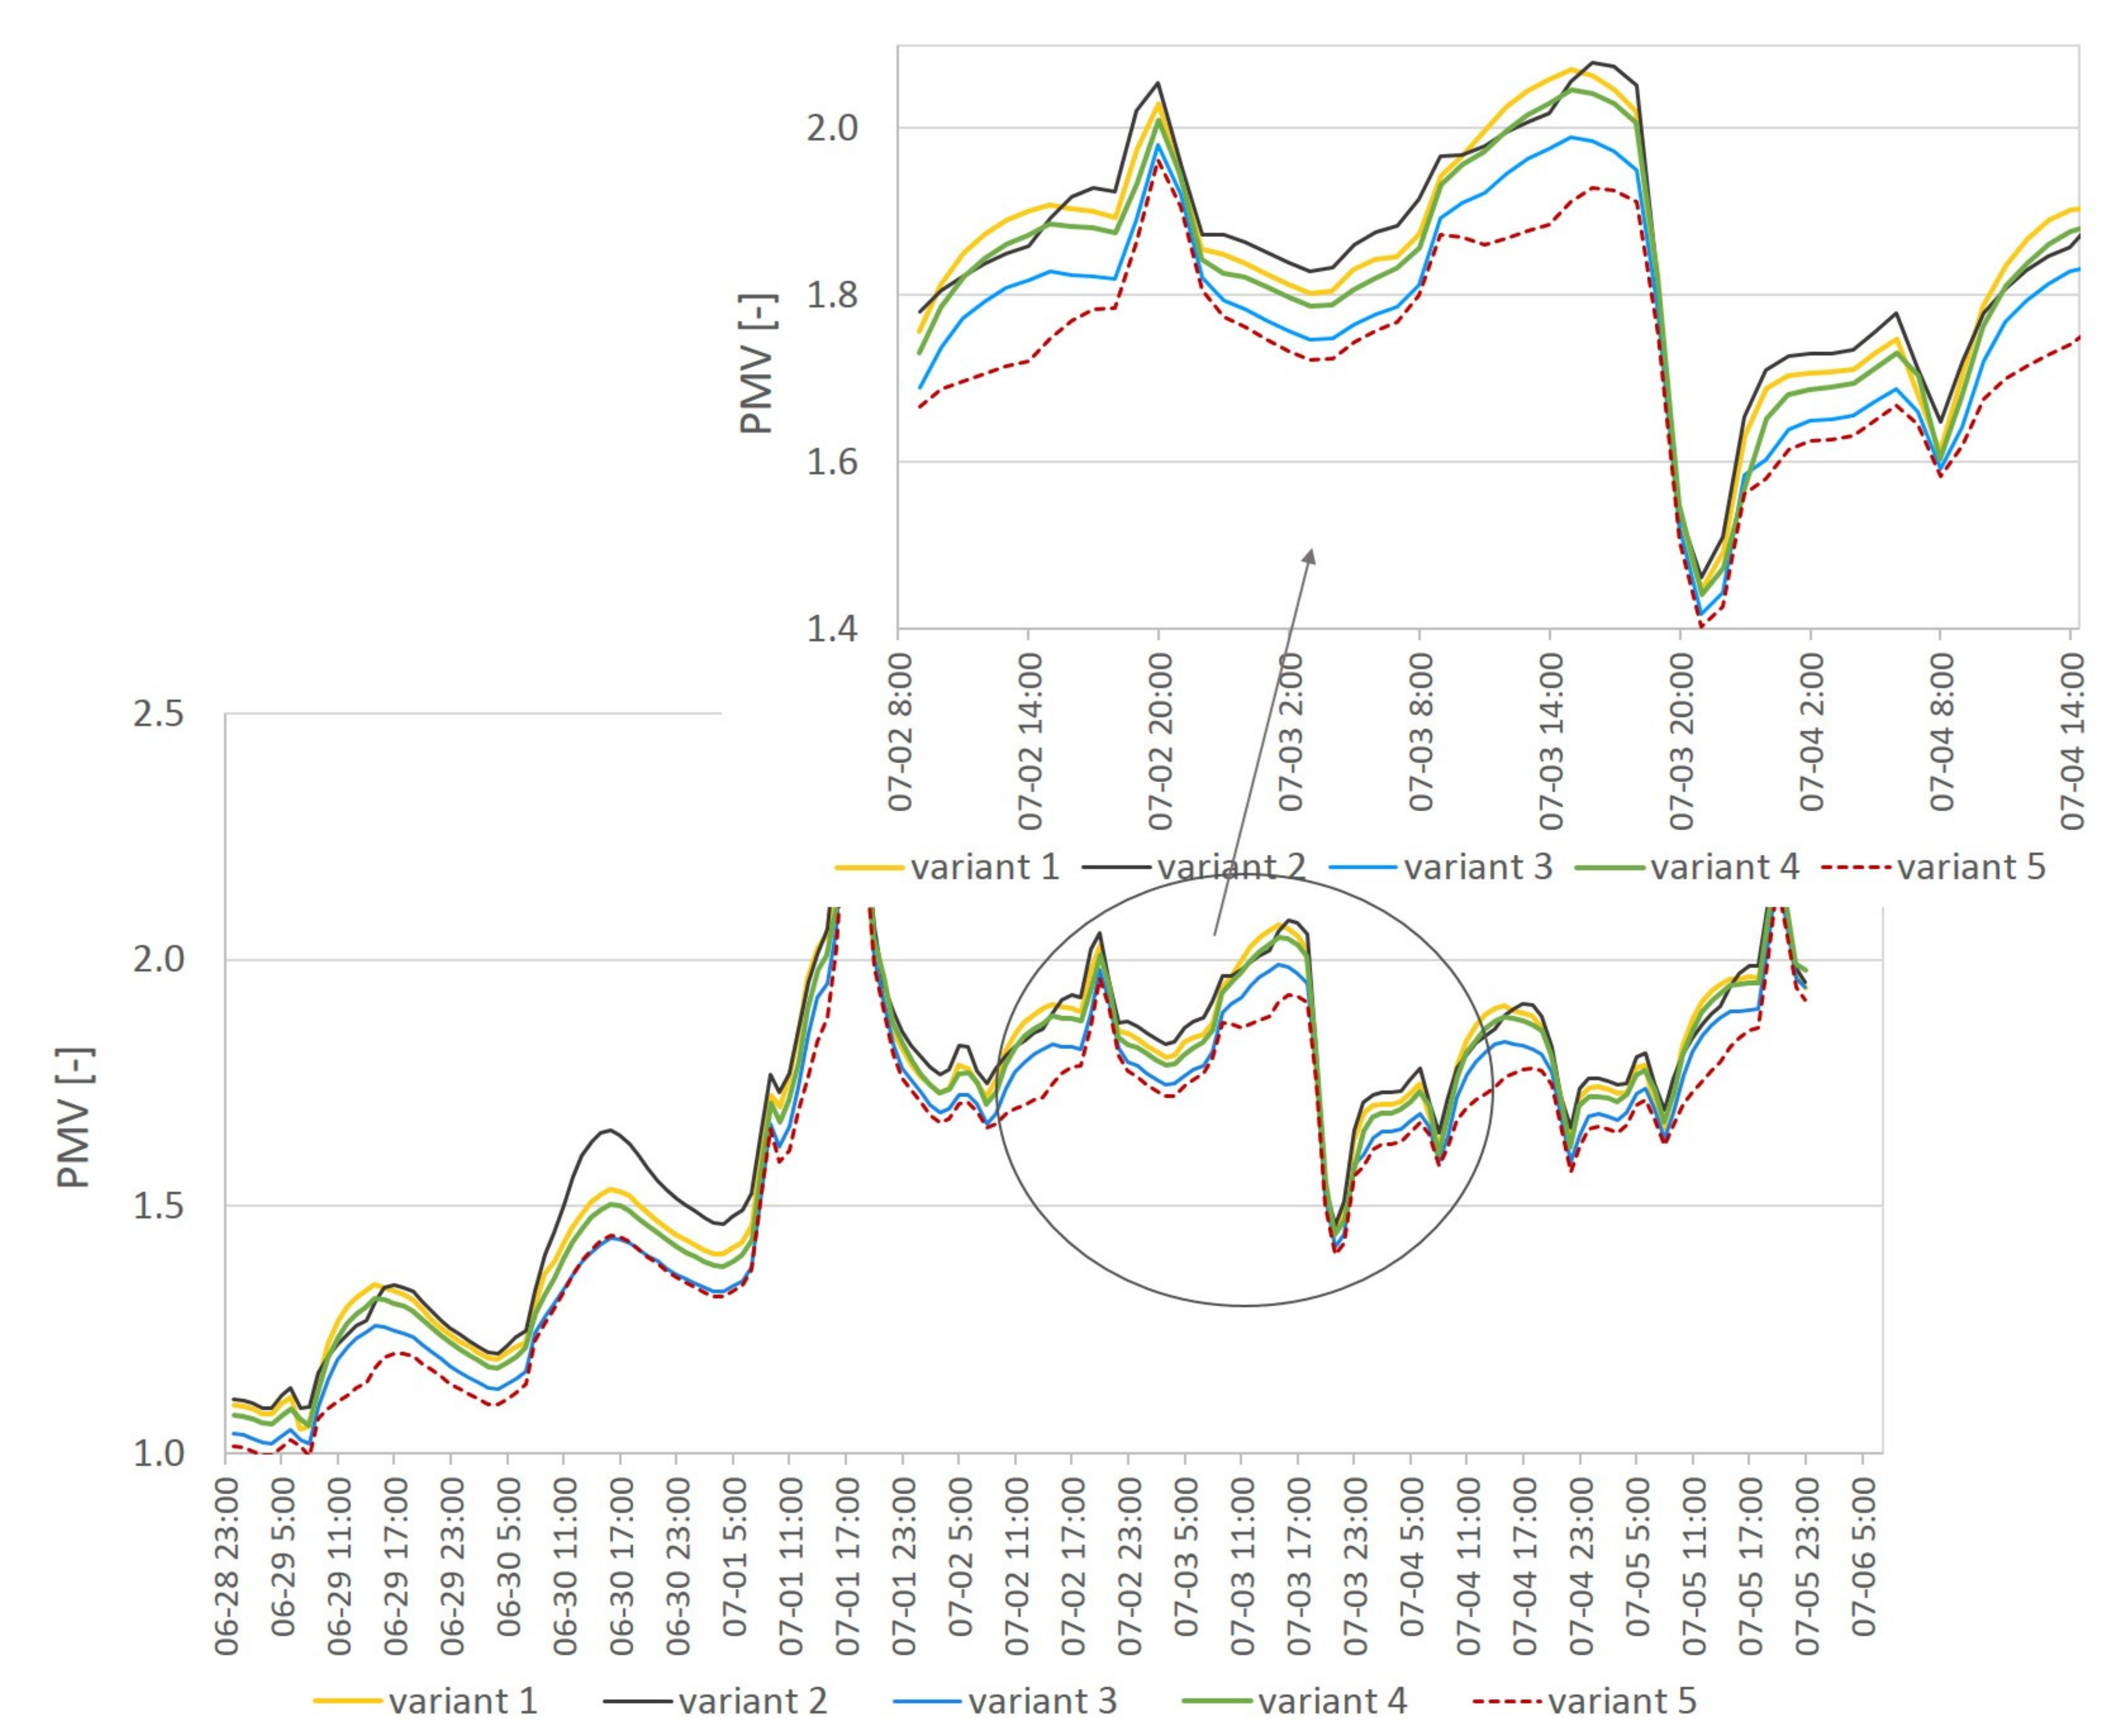
- Internal blinds do not play a significant role in shaping the interior microclimate and protecting from solar radiation. Temporary differences in PMV values for different patterns of closing the blinds (depending on the internal temperature or radiation intensity values) amount to a maximum of 0.2. However, they should be taken into account in design as a simple way to shade the interior and protect it against glare;
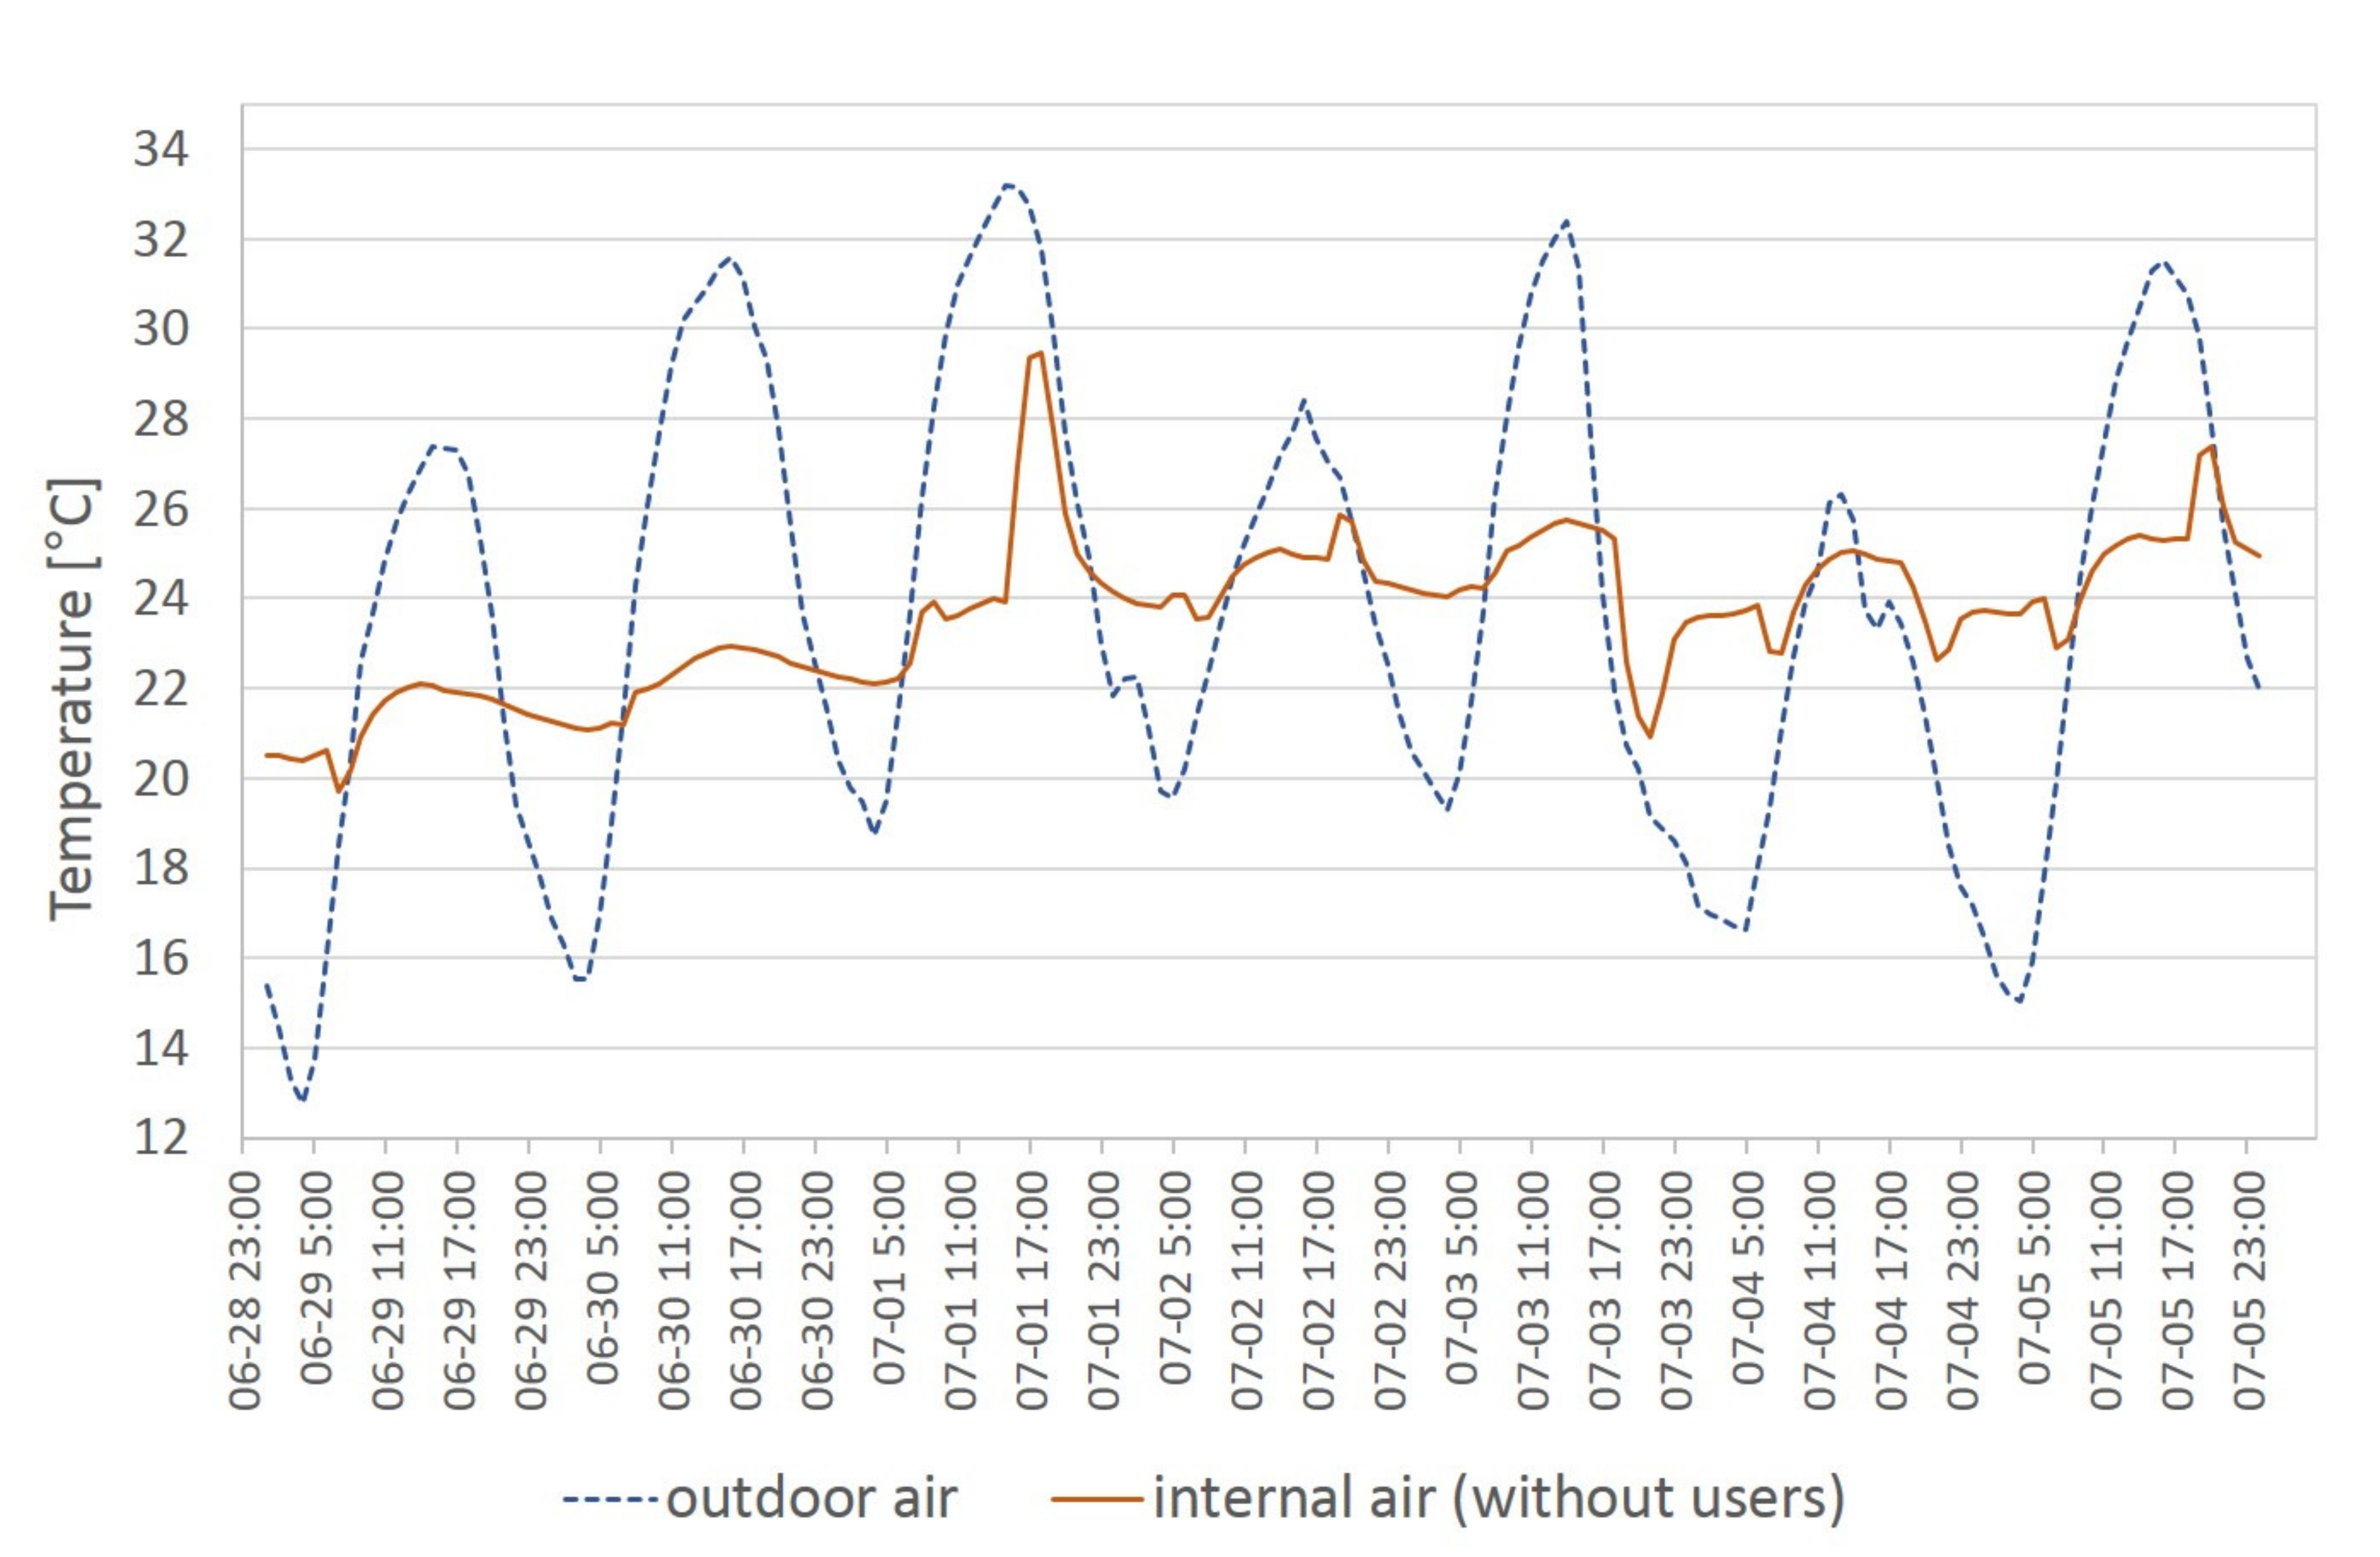
- The design of the building and its installations should take into account the possibility of natural night ventilation to reduce the accumulated excess solar and internal energy gains. In buildings with a large cubature of rooms (e.g., sports hall), opening windows in the early morning and evening is not sufficient to cool such a large volume of the facility and effectively reduce overheating;
- The way the examined building was actually used was far from the design assumptions, which have influenced the obtained results of measurements and simulations. Due to the positive daily energy balance in the effectively insulated partition of the building, even with a massive structure, its thermal capacity was not sufficient to prevent the building from overheating, as night mechanical or natural cooling was not used;
- Ground heat exchangers, recommended in low-energy public utility construction, are not used in the hall. This solution generates both additional investment and operating costs; therefore, investors still approach such a solution with skepticism. As can be seen from many studies and analyses, the mentioned installations favorably shape the thermal comfort in summer, but the operation of the heat pump is also associated with considerable input of electricity. Another aspect is the environmental and ecological assessment of buildings and their installations, as well as contemporary trends for the simplest possible solutions in the building industry while maintaining the principles of sustainable development. Due to the aforementioned economic and ecological considerations, investors often back off from expensive installations while accepting the increased risk of overheating the interior;
- According to Fanger’s comfort scale, conditions observed in the sports hall building should be defined as a hot environment out of the thermal comfort range. When using the adaptive comfort approach, the conditions could be assessed a bit more gently. Due to the higher activity level of the sports hall in Słomniki and the mechanical ventilation system used there, this facility cannot be analyzed according to the adaptive criterion. Thermal adaptation in sports building and intermittent use conditions is not yet recognized in the available bibliography. It must be stated that there is no specified objective method for thermal comfort evaluation in sports buildings.
Funding
Institutional Review Board Statement
Informed Consent Statement
Data Availability Statement
Conflicts of Interest
References
- Dudzińska, A.; Kisilewicz, T. Alternative Ways of Cooling a Passive School Building in Order to Maintain Thermal Comfort in Summer. Energies 2020, 14, 70. [Google Scholar] [CrossRef]
- Kwasnowski, P.; Fedorczak-Cisak, M.; Knap, K. Problems of Technology of Energy-Saving Buildings and Their Impact on Energy Efficiency in Buildings. Mater. Sci. Eng. 2017, 245. [Google Scholar] [CrossRef] [Green Version]
- Fantozzi, F.; Lamberti, G. Determination of Thermal Comfort in Indoor Sport Facilities Located in Moderate Environments: An Overview. Atmosphere 2019, 10, 769. [Google Scholar] [CrossRef] [Green Version]
- Kisilewicz, T.; Dudzińska, A. Summer overheating of a passive sports hall building. Arch. Civ. Mech. Eng. 2015, 15, 1193–1201. [Google Scholar] [CrossRef]
- Rajagopalan, P.; Luther, M.B. Thermal and ventilation performance of a naturally ventilated sports hall within an aquatic centre. Energy Build. 2013, 58, 111–122. [Google Scholar] [CrossRef]
- Bugaj, S.; Kosinski, P. Thermal comfort of the sport facilities on the example of indoor tennis court. In Proceedings of the IOP Conference Series: Materials Science and Engineering 415, Krakow, Poland, 11–13 September 2018. [Google Scholar] [CrossRef]
- Revel, G.M.; Arnesano, M. Perception of the thermal environment in sports facilities through subjective approach. Build. Environ. 2014, 77, 12–19. [Google Scholar] [CrossRef]
- Arnesano, M.; Revel, G.M.; Seri, F. A tool for the optimal sensor placement to optimize temperature monitoring in large sports spaces. Autom. Constr. 2016, 68, 223–234. [Google Scholar] [CrossRef]
- Revel, G.M.; Arnesano, M. Measuring overall thermal comfort to balance energy use in sport facilities. Measurement 2014, 55, 382–393. [Google Scholar] [CrossRef]
- Zhai, Y.; Elsworth, C.; Arens, E.; Zhang, H.; Zhang, Y.; Zhao, L. Using air movement for comfort during moderate exercise. Build. Environ. 2015, 94, 344–352. [Google Scholar] [CrossRef] [Green Version]
- Zora, S.; Balci, G.A.; Colakoglu, M.; Basaran, T. Associations between Thermal and Physiological Responses of Human Body during Exercise. Sports 2017, 5, 97. [Google Scholar] [CrossRef] [Green Version]
- Sivasankar, R.; Sivasubramanian, C.; Malarvannan, J.; Jeganathan, M.; Balakumari, M. Shading passive cooling and energy conservation in buildings–A case study. Indo Asian J. Multidiscip. Res. 2016, 2, 911–917. [Google Scholar] [CrossRef]
- Valladares–Rendón, L.G.; Shang–Lien, L. Passive shading strategies to reduce outdoor insolation and indoor cooling loads by using overhang devices on a building. Build. Simul. 2014, 7, 671–681. [Google Scholar] [CrossRef]
- Evola, G.; Gullo, F.; Marletta, L. The role of shading devices to improve thermal and visual comfort in existing glazed buildings. Energy Procedia 2017, 134, 346–355. [Google Scholar] [CrossRef]
- Bellia, L.; De Falco, F.; Minichiello, F. Effects of solar shading devices on energy requirements of standalone office buildings for Italian climates. Appl. Therm. Eng. 2013, 54, 190–201. [Google Scholar] [CrossRef]
- Pomfret, L.; Hashemi, A. Thermal Comfort in Zero Energy Buildings. Energy Procedia 2017, 134, 825–834. [Google Scholar] [CrossRef] [Green Version]
- Bazzocchi, F.; Ciacci, C.; Di Naso, V. Optimization of Solar Shading for a NZEB Kindergarten in Florence. Proceedings 2019, 16, 48. [Google Scholar] [CrossRef] [Green Version]
- Śliwińska, E.; Nowak, H.; Nowak, Ł.; Staniec, M. The influence of the shading structure on the thermal comfort in buildings by increasing the degree of glazing. Tech. Trans. 2012, 53, 415–422. [Google Scholar]
- Fedorczak-Cisak, M.M.; Gintowt, J.; Kowalska-Koczwara, A.; Pachla, F.; Stypuła, K.; Tatara, T. Thermal and Vibration Comfort Analysis of a Nearly Zero-Energy Building in Poland. Sustainability 2018, 10, 3774. [Google Scholar] [CrossRef] [Green Version]
- Szagri, D.; Nagy, B.; Szalay, Z. Heatwave Vulnerability Assessment of Nursing Homes Based on Dynamic Simulations. In Proceedings of the 16th IBPSA Conference, Rome, Italy, 2–4 September 2019; pp. 3392–3398. [Google Scholar]
- Polish Committee for Standardization. PN-EN ISO 10456:2009, Building Materials and Products–Hygrothermal Properties–Tabulated Design Values and Procedures for Determining Declared and Design Thermal Values; Polish Committee for Standardization: Warsaw, Poland, 2009. [Google Scholar]
- European Committee for Standardization. EN ISO 6946:2017, Building Components and Building Elements—Thermal Resistance and Thermal Transmittance —Calculation Methods; European Committee for Standardization: Brussels, Belgium, 2017. [Google Scholar]
- Architectural and Construction Design of the Sports Hall at Al. November 29 in Krakow, Passive Architecture Pyszczek I Stelmach Sp. J. Available online: http://architekturapasywna.pl/portfolio/typowe-pasywne-hale-sportowe/ (accessed on 1 March 2021).
- Polish Committee for Standardization. Thermal Performance of Buildings–Determination of Air Permeability of Buildings–Fan Pressurization Method; Polish Committee for Standardization: Warsaw, Poland, 2002. [Google Scholar]
- Fanger, P.O. Thermal Comfort; Arkady: Warszawa, Poland, 1974. [Google Scholar]
- Polish Committee for Standardization. Ergonomics of the Thermal Environment—Analytical Determination and Interpretation of Thermal Comfort Using Calculation of the PMV and PPD Indices and Local Thermal Comfort Criteria; Polish Committee for Standardization: Warsaw, Poland, 2013. [Google Scholar]
- Humphreys, M.; Nicol, F. The validity of ISO-PMV for predicting comfort votes in every-day life. Energy Build. 2002, 34, 667–684. [Google Scholar] [CrossRef]
- European Committee for Standardization. Indoor Environmental Input Parameters for Design and Assessment of Energy Performance of Buildings Addressing Indoor Air Quality, Thermal Environment, Lighting and Acoustics; European Committee for Standardization: Brussels, Belgium, 2019. [Google Scholar]
- Dudzińska, A.; Kotowicz, A. Features of materials versus thermal comfort in a passive building. Procedia Eng. 2015, 108–115, 1877–7058. [Google Scholar] [CrossRef] [Green Version]
- Polish Committee for Standardization. Ergonomics of the Thermal Environment-Instruments for Measuring Physical Quantities; Polish Committee for Standardization: Warsaw, Poland, 2013. [Google Scholar]
- EnergyPlus Version 9.5.0 Documentation, Engineering Reference; U.S. Department of Energy’s (DOE) Building Technologies Office (BTO): Washington, DC, USA, 2021.
- DesignBuilder Help. Available online: http://www.designbuilder.co.uk/ (accessed on 1 March 2021).
- Ainsworth, B.; Herrmann, S.; Meckes, N.; Bassett, D.; Tudor-Locke, C.; Greer, J.; Vezina, J.; Whitt-Glover, M.; Leon, A. Compendium of Physical Activities: A Second Update of Codes and MET Values. Med. Sci. Sports Exerc. 2011, 43, 1575–1581. [Google Scholar] [CrossRef] [Green Version]
- European Committee for Standardization. EN 12464-1:2011, Light and Lighting—Lighting of Work Places—Part 1: Indoor Work Places; European Committee for Standardization: Brussels, Belgium, 2011. [Google Scholar]
- Jóźwiak, J.; Podgórski, J. Statistics from Scratch; PWE: Warsaw, Poland, 2009. [Google Scholar]
- Regulation of the Minister for Infrastructure of 12 April 2002 on the Technical Conditions to be Met by Buildings and Their Location. 2002. Available online: https://www.global-regulation.com/translation/poland/3353940/regulation-of-the-minister-of-infrastructure-of-12-april-2002-on-technical-conditions%252c-which-should-correspond-to-the-buildings-and-their-location.html (accessed on 1 March 2021).
- Jelonek, J. Thermoregulation! What Happens to Us While Running? 2014. Available online: https://bieganie.pl/ (accessed on 1 March 2021).
- The Chartered Institution of Building Services Engineers. CIBSE Guide B, Heating, Ventilating, Air Conditioning and Refrigeration; CIBSE: London, UK, 2005. [Google Scholar]
- Trianti-Stourna, E.; Spyropoulou, K.; Theofylaktos, C.; Droutsa, K.; Balaras, C.A.; Santamouris, M.; Asimakopoulos, D.N.; Lazaropoulou, G.; Papanikolaou, N. Energy conservation strategies for sports centers: Part A. Sports halls. Energy Build. 1998, 27, 109–122. [Google Scholar] [CrossRef]
- Buriak, J. Assessment of Insolation Conditions and Design of Solar Power Plants with the Use of Dedicated Software and Databases. Sci. J. Fac. Electr. Control Eng. 2014, 40, 29–32. [Google Scholar]
- Dudzińska, A.; Kisilewicz, T. Efficiency of night ventilation in limiting the overheating of passive sports hall, MATBUD’2020–Scientific-Technical Conference: E-mobility. Sustain. Mater. Technol. 2020, 322. [Google Scholar] [CrossRef]
- ASHRAE. ANSI/ASHRAE Standard 55-2013 Thermal Environmental Conditions for Human Occupancy; ASHRAE: Atlanta, GA, USA, 2017. [Google Scholar]
- Buratti, C.; Ricciardi, P. Adaptive analysis of thermal comfort in university classrooms: Correlation between experimental data and mathematical models. Build. Environ. 2009, 44, 674–687. [Google Scholar] [CrossRef]
- De Dear, R.J.; Brager, G.S. Developing an adaptive model of thermal comfort and preference. Ashrae Trans. 1998, 104, 145–167. [Google Scholar]
- Nicol, J.; Humphreys, M. Adaptive thermal comfort and sustainable thermal standards for buildings. Energy Build. 2002, 34, 563–572. [Google Scholar] [CrossRef]
- Hellwig, R.T.; Teli, D.; Schweiker, M.; Choi, J.-H.; Lee, M.C.J.; Mora, R.; Rawal, R.; Wang, Z.; Al-Atrash, F. A framework for adopting adaptive thermal comfort principles in design and operation of buildings. Energy Build. 2019, 205. [Google Scholar] [CrossRef]


| External Walls | Thickness (m) | Density ρ (kg/m3) | Thermal Conductivity λ (W/(m·K)) | Specific Heat c (J/(kg·K)) | Heat Capacity C (MJ/m3·K) |
|---|---|---|---|---|---|
| Interior plaster | 0.015 | 1000 | 0.40 | 840 | 0.84 |
| Silicate blocks | 0.25 | 1900 | 0.80 | 880 | 1.67 |
| Expanded polystyrene (EPS) | 0.30 | 15 | 0.04 | 1400 | 0.02 |
| External plaster | 0.02 | 1800 | 0.82 | 840 | 1.51 |
| Date | Maximum Outdoor Air Temperature (°C)—Meteorological Station Kraków Balice | Closed Internal Roller Blinds | Tilted Windows N (25% of Total Window Opening) | Tilted Windows S (15% of Total Window Opening) |
|---|---|---|---|---|
| 29 June Friday | 27.5 | Yes | 7.00–9.00 | 7.00–9.00 |
| 30 June Saturday | 31.6 | No | 7.00–9.00 | 7.00–9.00 |
| 1 July Sunday | 33.3 | Yes | 7.00–9.00 and 15.00–19.00 | 7.00–9.00 and 15.00–19.00 |
| Environmental Parameter | Average Value |
|---|---|
| Indoor air temperature ta (°C) | 25.1 |
| Radiation temperature tr (°C) | 25.8 |
| Operative temperature to (°C) | 25.3 |
| PMV (-) | 2.6 |
| PPD (%) | 93.1 |
| Variants of the Simulation | Internal Gains (kWh) | |||
|---|---|---|---|---|
| Solar | Lighting | People | ∑ | |
| Variant 1 | 2053.2 | 191.1 | 236.3 | 2480.5 |
| Variant 2 | 2607.7 | 183.7 | 236.3 | 3027.8 |
| Variant 3 | 1868.2 | 199.5 | 236.3 | 2304.0 |
| Variant 4 | 2108.3 | 195.3 | 236.3 | 2539.9 |
| Variant 5 | 2004.6 | 195.4 | 236.3 | 2436.4 |
| Simulation Variants | Indoor Air Temperature ta (°C) | Radiation Temperature tr (°C) | Operative Temperature to (°C) |
|---|---|---|---|
| Variant 1 | 23.1 | 23.3 | 23.2 |
| Variant 2 | 23.2 | 23.5 | 23.3 |
| Variant 3 | 22.8 | 22.9 | 22.9 |
| Variant 4 | 23.0 | 23.2 | 23.1 |
| Variant 5 | 22.6 | 22.8 | 22.7 |
| Simulation Variants | Number of Hours in the Thermal Comfort Range | Number of Hours with PMV > 0.5 | Number of Hours with PMV > 2.0 |
|---|---|---|---|
| Variant 1 | 4 | 740 | 96 |
| Variant 2 | 4 | 740 | 104 |
| Variant 3 | 11 | 733 | 67 |
| Variant 4 | 5 | 739 | 96 |
| Variant 5 | 24 | 720 | 41 |
Publisher’s Note: MDPI stays neutral with regard to jurisdictional claims in published maps and institutional affiliations. |
© 2021 by the author. Licensee MDPI, Basel, Switzerland. This article is an open access article distributed under the terms and conditions of the Creative Commons Attribution (CC BY) license (https://creativecommons.org/licenses/by/4.0/).
Share and Cite
Dudzińska, A. Efficiency of Solar Shading Devices to Improve Thermal Comfort in a Sports Hall. Energies 2021, 14, 3535. https://doi.org/10.3390/en14123535
Dudzińska A. Efficiency of Solar Shading Devices to Improve Thermal Comfort in a Sports Hall. Energies. 2021; 14(12):3535. https://doi.org/10.3390/en14123535
Chicago/Turabian StyleDudzińska, Anna. 2021. "Efficiency of Solar Shading Devices to Improve Thermal Comfort in a Sports Hall" Energies 14, no. 12: 3535. https://doi.org/10.3390/en14123535
APA StyleDudzińska, A. (2021). Efficiency of Solar Shading Devices to Improve Thermal Comfort in a Sports Hall. Energies, 14(12), 3535. https://doi.org/10.3390/en14123535