Article

Power Quality Improvement in Distribution Grids via Real-Time Smart Exploitation of Electric Vehicles

1
Institute for Automation of Complex Power Systems, E.ON Energy Research Center, RWTH Aachen University, 52074 Aachen, Germany
2
E:E Consulting GmbH, Eichenweg 2 b, D-21521 Aumühle, Germany
3
Schleswig-Holstein Netz AG, Kieler Straße 47, 24768 Rendsburg, Germany
4
Centre for Research and Technology—Hellas, Information Technologies Institute, P.O. Box 60361, 5700 Thessaloniki, Greece
*
Author to whom correspondence should be addressed.
Energies 2021, 14(12), 3533; https://doi.org/10.3390/en14123533
Submission received: 19 April 2021 / Revised: 3 June 2021 / Accepted: 8 June 2021 / Published: 14 June 2021
(This article belongs to the Special Issue Monitoring and Distributed Control for Power Systems)

Abstract

:
Integration of electric vehicles into electric power system brings both challenges and solutions in the operation of power grids. On the one hand, simultaneously charging a large number of electric vehicles causes branch congestion or large voltage drop. Operating the electric vehicles in the discharging mode, on the other hand, introduces the provision of several ancillary services like peak power shaving and spinning reserves. From the electric vehicles operation point of view, thus, the distribution system operators require a real-time monitoring infrastructure to capture the states of electric vehicle chargers and accordingly operate their grids in the safe mode with respect to the power quality standards (e.g., EN 50160). In this context, the real-time smart charging and storage platform of the EU Horizon 2020 “MEISTER” project, based on the information and communication technology, manages the availability of electric vehicles as a potential source of energy in the need of one or more flexibility services demanded by low voltage distribution system operators. In addition to the implemented information and communication technology platform, this paper presents how the smart use of the electric vehicle resources supports the power quality of the distribution system in terms of system voltage support, bidirectional power flow management, harmonic alleviation and power factor control.

1. Introduction

To address climate change, exploiting electric vehicles (EVs) instead of fossil-fuel counterparts has been considered as one of the main solutions combatting the increase of greenhouse gas emissions [1]. From the grid point of view, seemingly, such vehicles are treated as new loads to be fed. In this context, the distribution system operators (DSOs) have encountered several grid-operation challenges like line capacity, voltage instability and voltage fluctuations and system harmonic. To tackle loading issues, grid line reinforcement is the long-lasting solution but the expensive one. Thanks to the controllability feature of EV battery inverters, however, these new grid inhabitants can be treated as active elements which can contribute towards improving the quality of the power system [2,3,4,5] based on power quality standards like EN 50160 [6] and EN 61000 [7] and delay the need for power line reinforcement. In this respect, [8] takes into account the loading limits of the distribution transformer and distribution lines to evaluate the maximum EV penetration that can be integrated in the upcoming years without infrastructure reinforcement. In this context, moreover, the optimal size and the location of the EV charging stations on the road network can be obtained based on equilibrium traffic flow studies [9,10]. Additionally, the prediction of traffic flow can provide valuable information (in terms of the number of EVs at different time intervals and locations) for these studies. In this way, the system operators can use the obtained results from these studies to determine system bottlenecks. Accordingly, the operators should apply possible countermeasures (in terms of system design, control schemes and so on) to overcome probable congestions. From an economical point of view, nevertheless, DSOs prefer applying smart charging and discharging strategies to alleviate the abnormal operating conditions causing grid collapses. In this respect, numerous studies have been conducted to increase the penetration of EVs in the distribution systems. To tackle the uncertain behavior of the EVs associated with the availability of EVs in the parking station (in terms of the number EVs and the parking duration, arrival time, departure time), the EV battery size, the uncertainty in the available discharging capacity due different day-to-day driving behavior [11] and so on, a real-time algorithm for managing the power system with EV facilities is considered in [12]. However, [12] assumed that the automation and control systems are installed at all power system levels (from substation through ISO to the load center). Real-time data acquisition and data transmission approaches are not considered. From an experimental point of view, the impact of EVs on a real Danish distribution grid considering three ancillary services, i.e., congestion management, local voltage support and primary frequency control (PFC), was studied in [13]. The applied droop controller in [13] complies with international IEC 61851 and SAE J1772 standards. To deal with grid technical management and market operation, a conceptual framework consisting of both centralized and decentralized control schemes is introduced in [14]. The centralized control approach manages the branches’ congestion levels and enables the EVs to participate in the electricity markets. The decentralized one locally decreases charging rates through a voltage droop control that deals with voltage drops. However, the impact of EV integration on the transformers was not considered in this work. In this respect, [15] assesses the impact of EV charging management along with load shifting on aging of transformers. From the load modeling point of view, a data-driven modeling technique based on fuzzy logic is used in [16] taking into account the stochastic nature of EVs in terms of arrival time, departure time and daily mileage. Moreover, a two-layer evolution strategy particle swarm optimization (ESPSO) algorithm is also considered in [16] that provides ancillary services in residential distribution grids. To improve the quality of performance for the parking lot operators, moreover, [17] proposes a fuzzy logic weight-based charging scheme (FLWCS) to optimally distribute the charging power among the most appropriate EVs. This fuzzy inference mechanism correlates the required state of charge, remaining parking duration and available power in real time and computes weight values for each of the EVs requesting charging operations. Nonetheless, the impact of renewable energy resources (RES) is not considered in [16,17]. In a stochastic framework [18], a self-adaptive modified symbiotic organism search (MSOS) algorithm is used to employ the distribution feeder reconfiguration (DFR) as a reliability-enhancing strategy to coordinate the EVs. Nevertheless, the voltage regulation service is indirectly addressed as an active power support service. Apart from the aforementioned strategies in the operation of EV systems, the information and communication technology (ICT) network is a key prerequisite in the operation of smart grids to exchange the required metering data among the active players and the system operator. In this respect, [19] analyzed the rising interdependencies between the future power grid featuring increased dependence on ICT, the ICT network, and the future transportation network focusing more on electrified mobility. Moreover, a scalable method for optimal allocation of the power and bandwidth resources in the power and communication networks has been described in [20]. However, from an experimental point of view, in a laboratory scale, [21] shows a test set-up in which the implemented intelligent energy management (iEMS), running in Labview on a computer, exchanges data with the vehicle via the ZigBee communication protocol. To assess the real-time impact of the vehicle-to-grid (V2G) technology on the power distribution grids based on the power quality criteria while both the power and communication networks (as the two main components of the smart grids) are taken into account, this paper proposes an ICT technology which is coupled on the one end to the field (in this case the real time digital simulator (RTDS)) and on the other end to the smart grid integration software (SGIP) developed under the framework of the EU Horizon 2020 “MEISTER” project [22]. Additionally, this paper shows how the real-time exploitation of EVs can address some grid issues (like voltage drop, harmonic distortions, RES reverse power flow and the reactive power management) in an active distribution system including Photovoltaic (PV) and wind generation units. Nevertheless, the optimal management of the charging stations based on the SGIP system is not evaluated in this paper [23]. Additionally, as in [24,25], reliability indices (e.g., SAIFI and SAIDI) have not been taken into account in this paper. The specific contribution of this paper is:
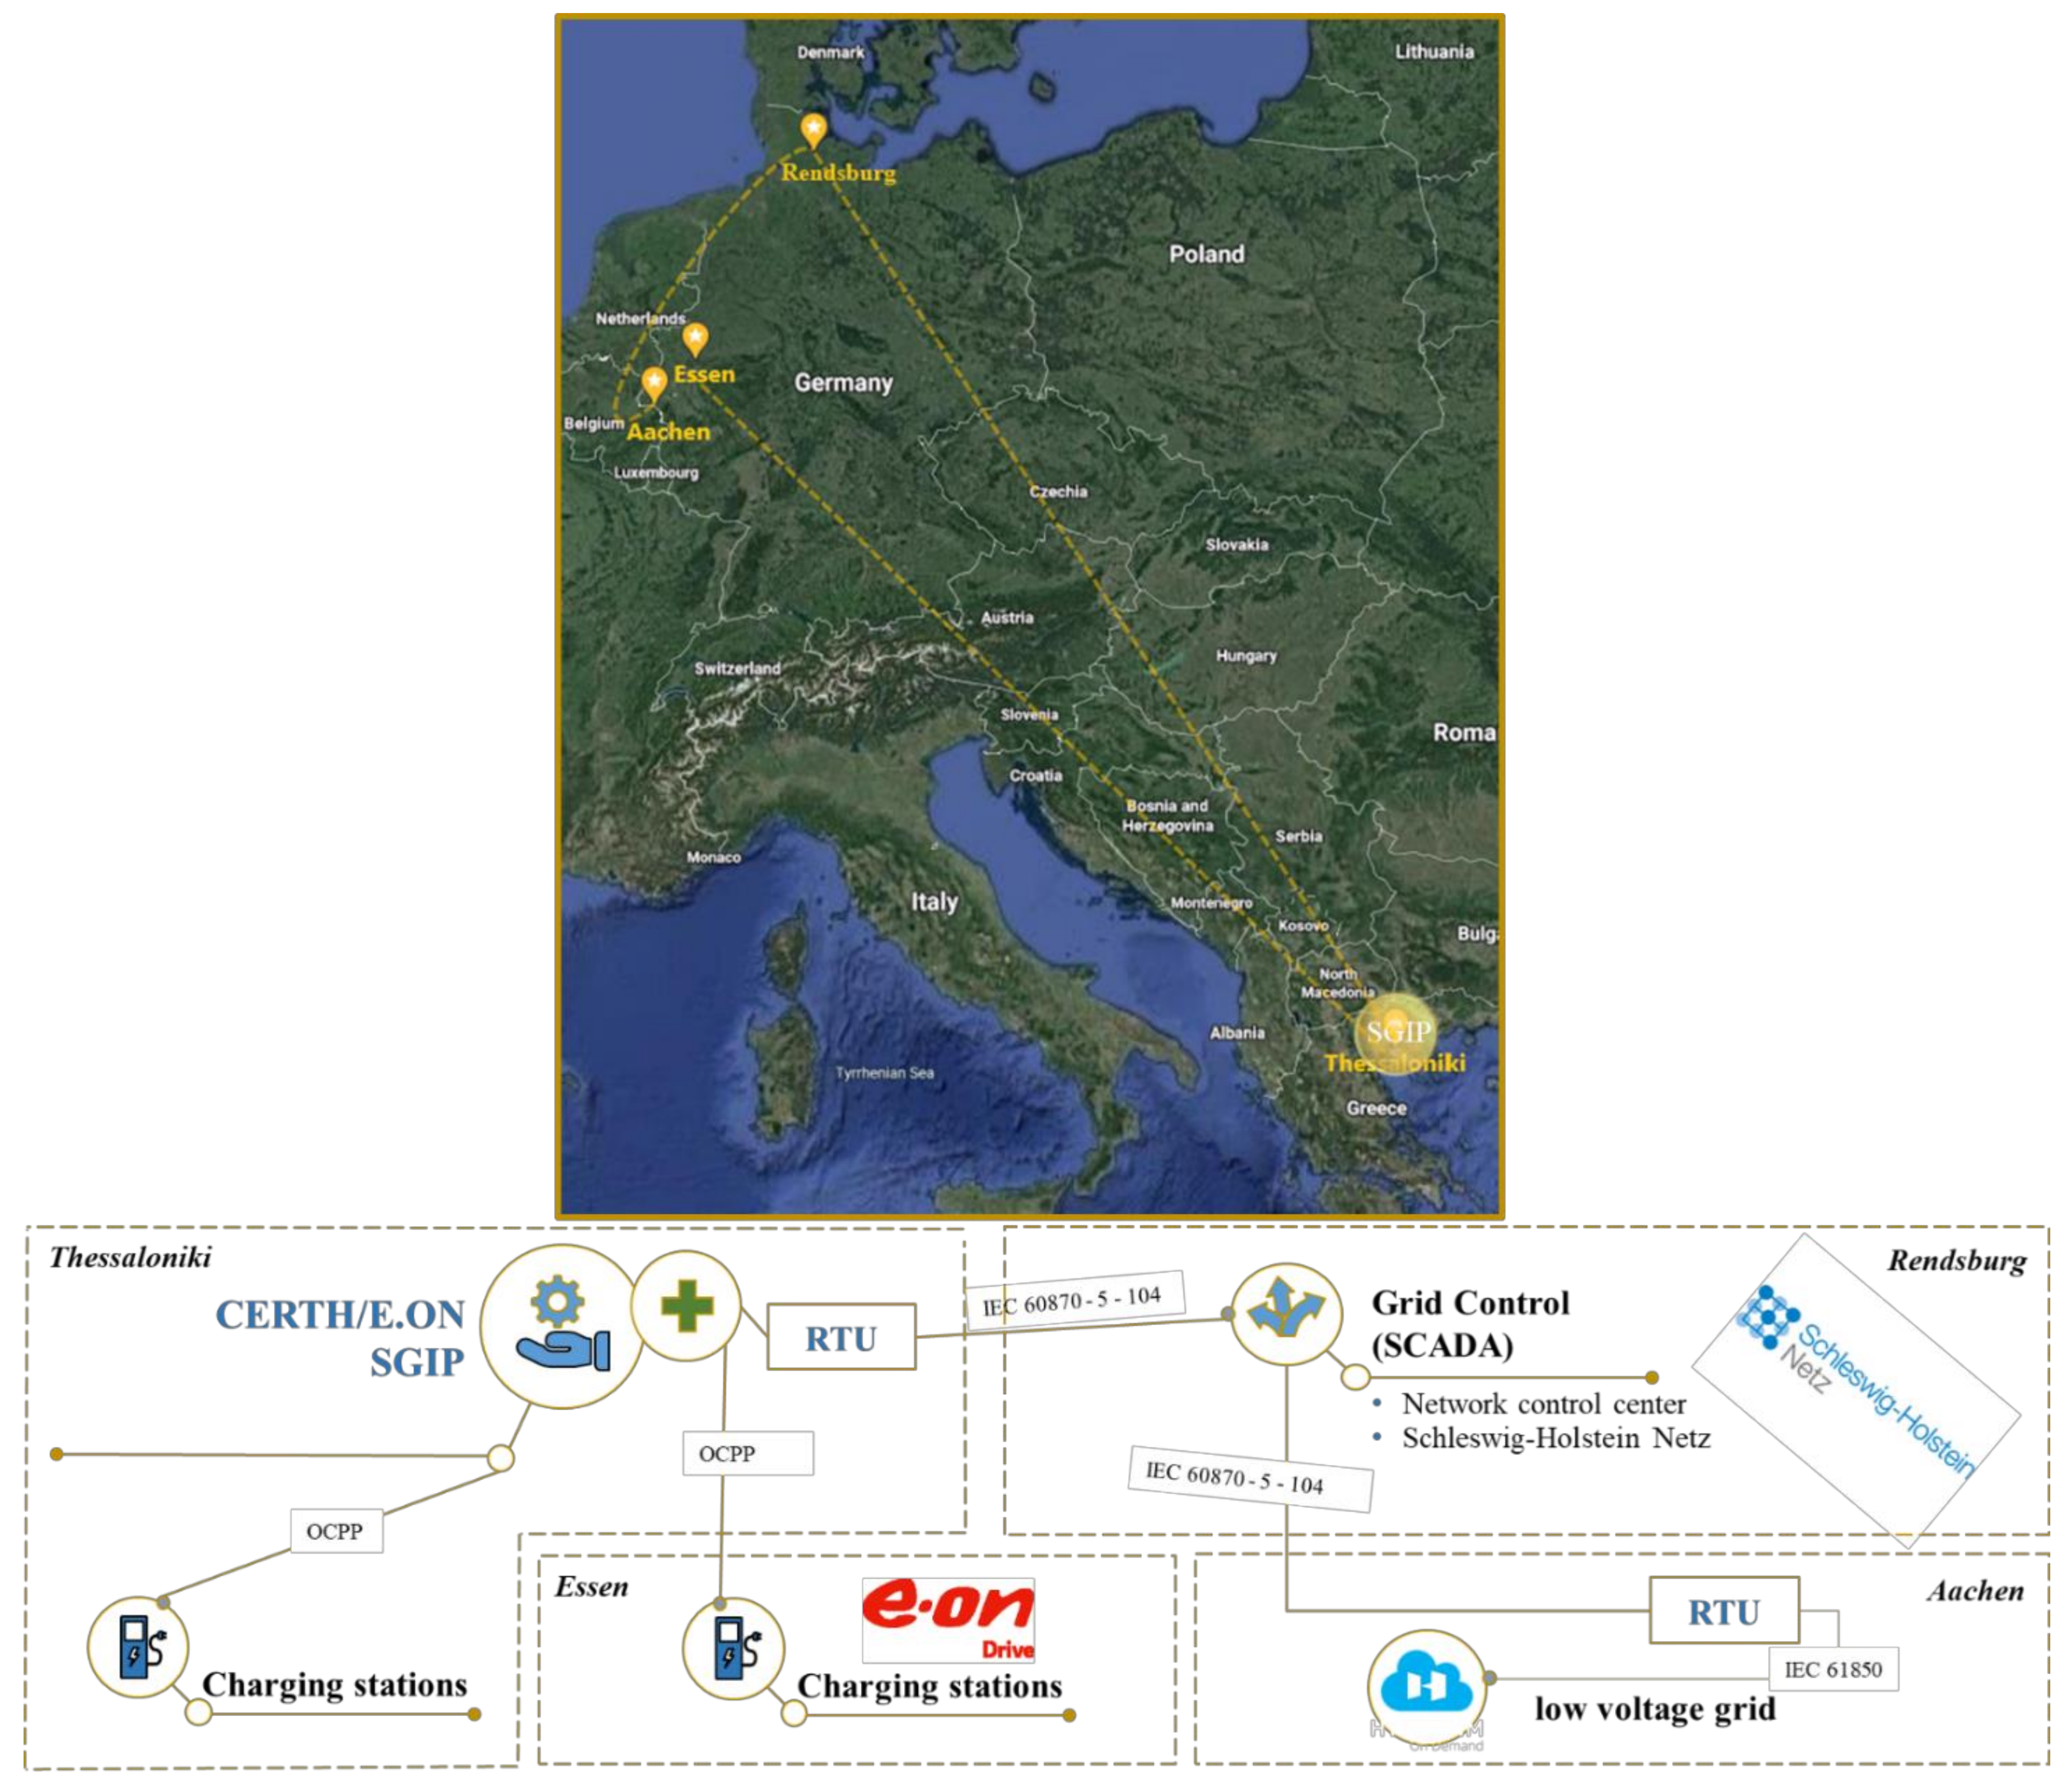
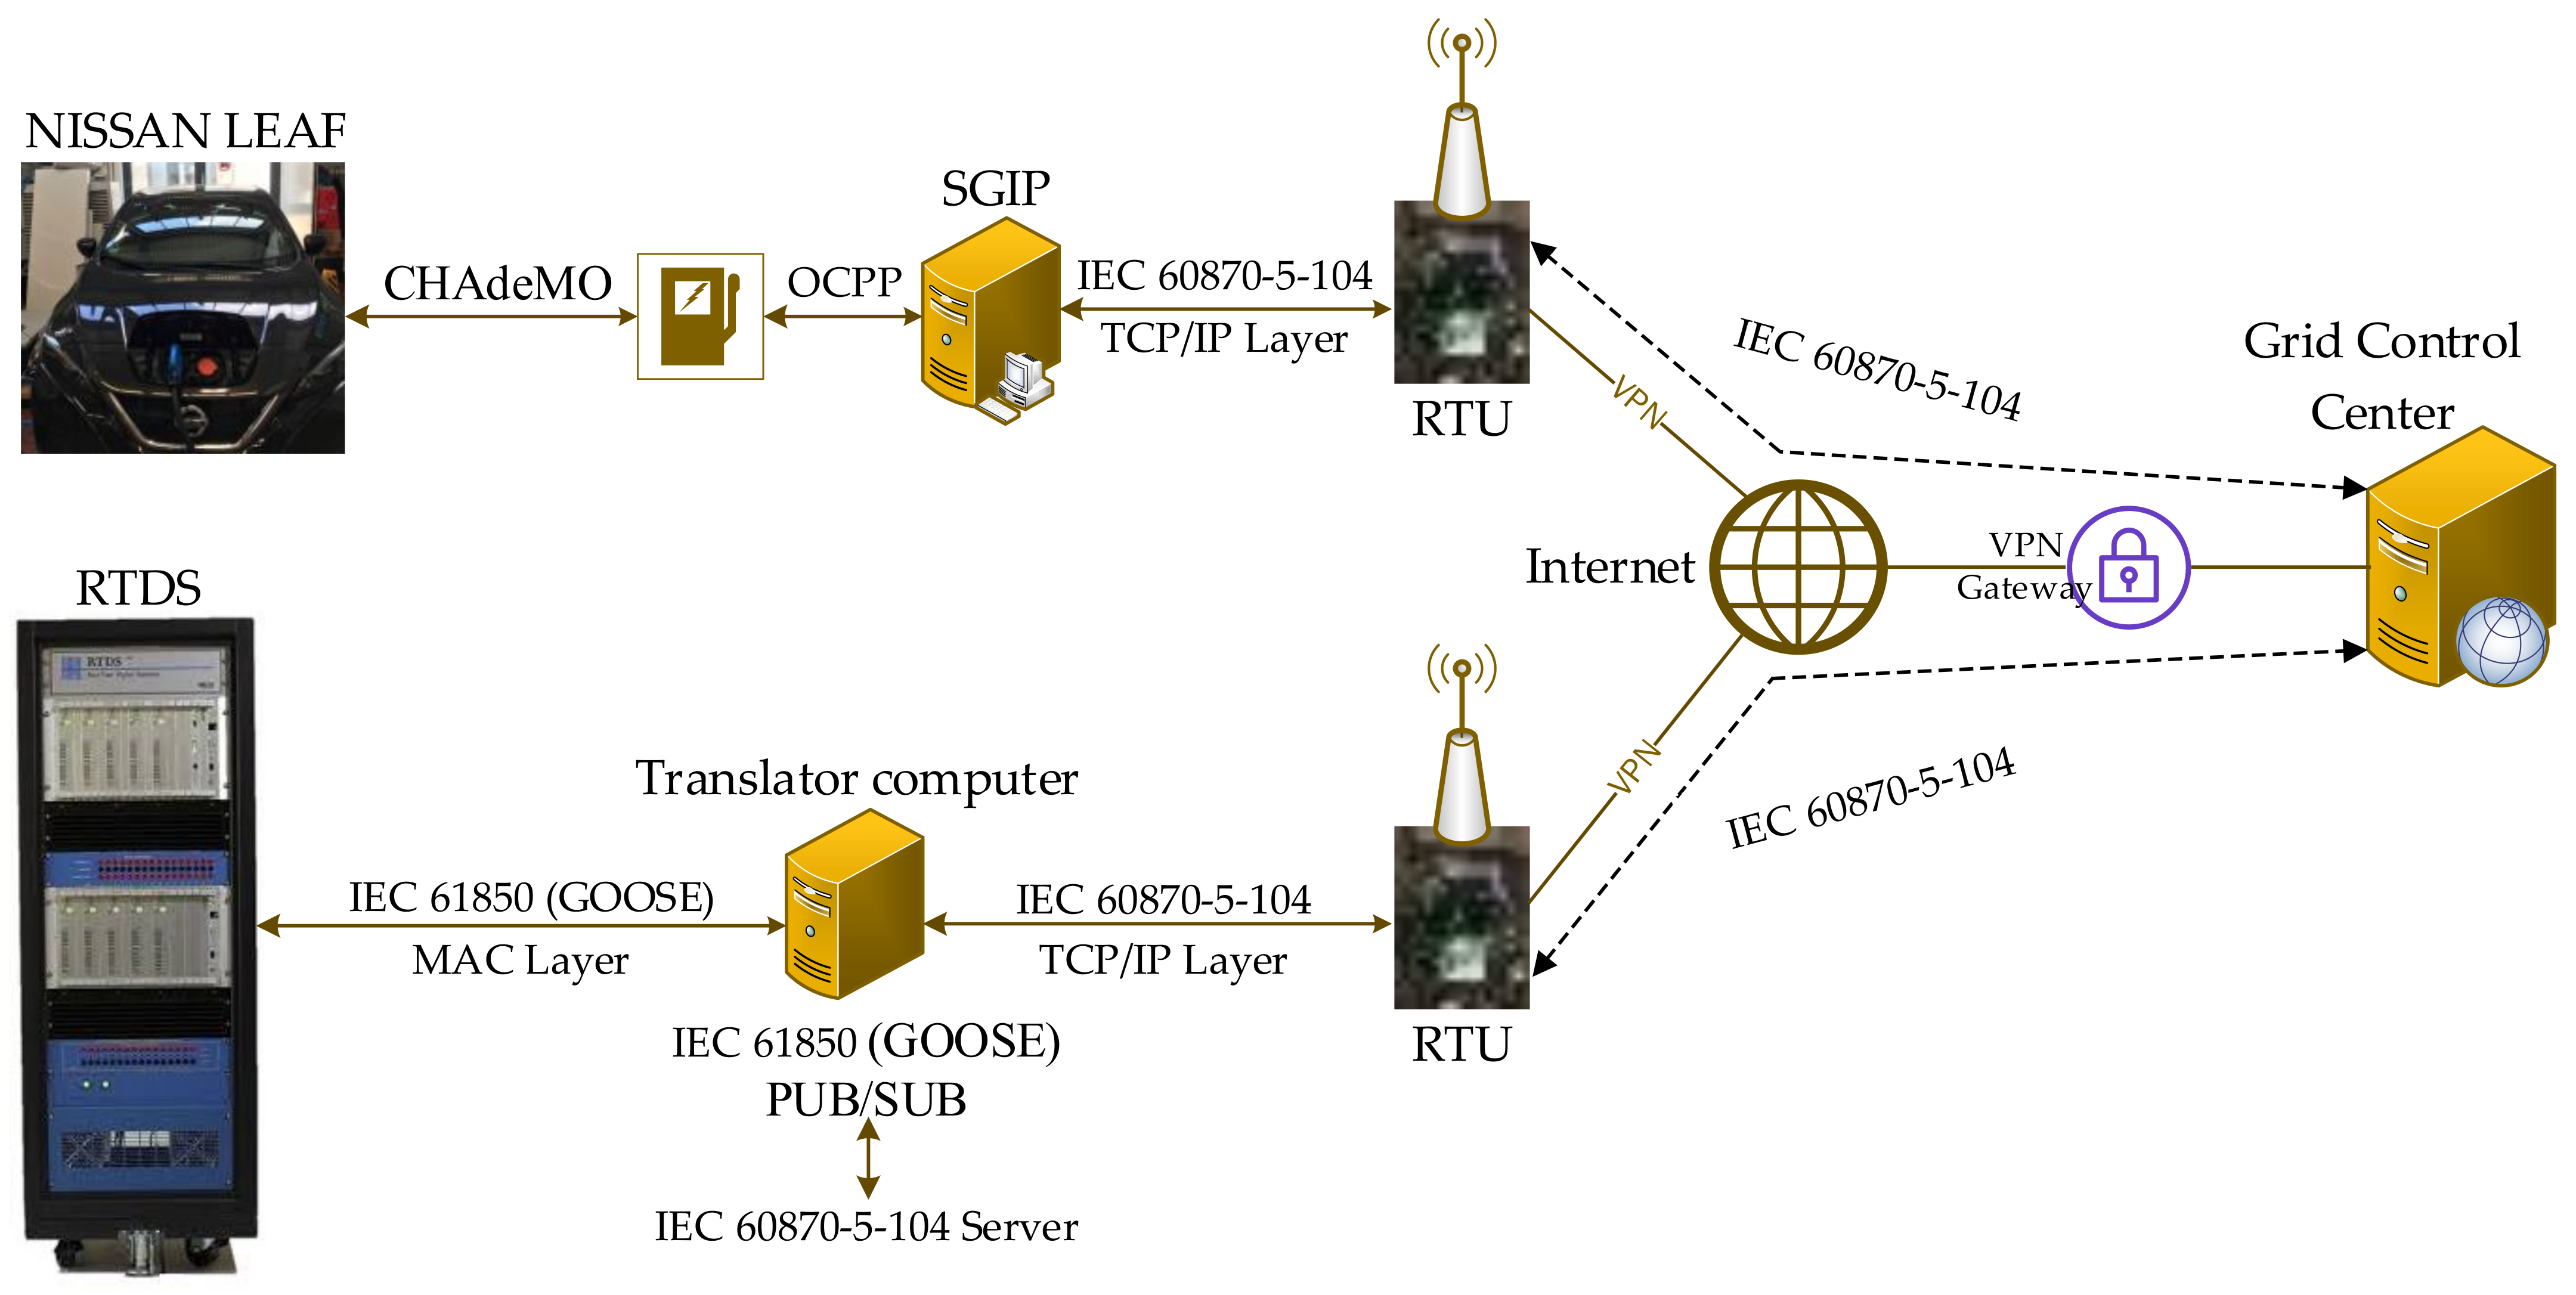
  • to describe the implemented ICT system based on different communication protocols (IEC 61850, IEC 60870-5-104 and OCPP). The proposed ICT system transmits data among the field (active distribution system including EV resources), the control center and SGIPs geographically dispersed across Europe (i.e., Aachen, Essen, Rendsburg in Germany and Thessaloniki in Greece).
  • to evaluate of the flexibility of the EV systems (in terms of voltage support, harmonic alleviation, RES reverse power flow and reactive power management) on the safe operation of the active distribution systems.
The rest of the paper is organized as follows: Section 2 explains the aim of the MEISTER project and describes the implemented ICT platform which transmit the data among the test sites. The impact of EVs on the power quality is explained in brief in Section 3. The modelling of the implemented grid (including EV charging stations, PV and wind systems and the load) in RSCAD (RTDS software user interface) is described in Section 4. The test results are shown in Section 5 and finally the conclusion is found in Section 6.

2. MEISTER Project Scope and ICT Platform

The aim of the MEISTER project is the smart exploitation of the EV technology to provide the DSOs with flexibility and stabilization services. Considering the uncertain behavior of the EVs, a fast control and operating scheme is essential to utilize the EVs as source of flexibility and stabilization measures. To this end, an ICT scheme as one of the main elements in real-time and smart operation of distribution grids was implemented to be coupled with the SGIP to perform centralized control over a wide geographical area shown in Figure 1. This system is called smart charging and storage platform (SCSP). In this context, measured electrical variables are sent from the field to a grid control entity where the system amber phase is evaluated [26]. To put it differently, the grid control entity determines whether a potential network bottleneck exists in a defined network segment. In case of any abnormal conditions, the grid control center (GCC) sends the flexibility requests to the SGIP. Then, the SGIP manages (via OptiV2G algorithm [27]) the market participants in the network segment to address the flexibility requests. The flow-chart of the mentioned control scheme is shown in Figure 2.
In the context of this paper, the data is transmitted as follows [23]:
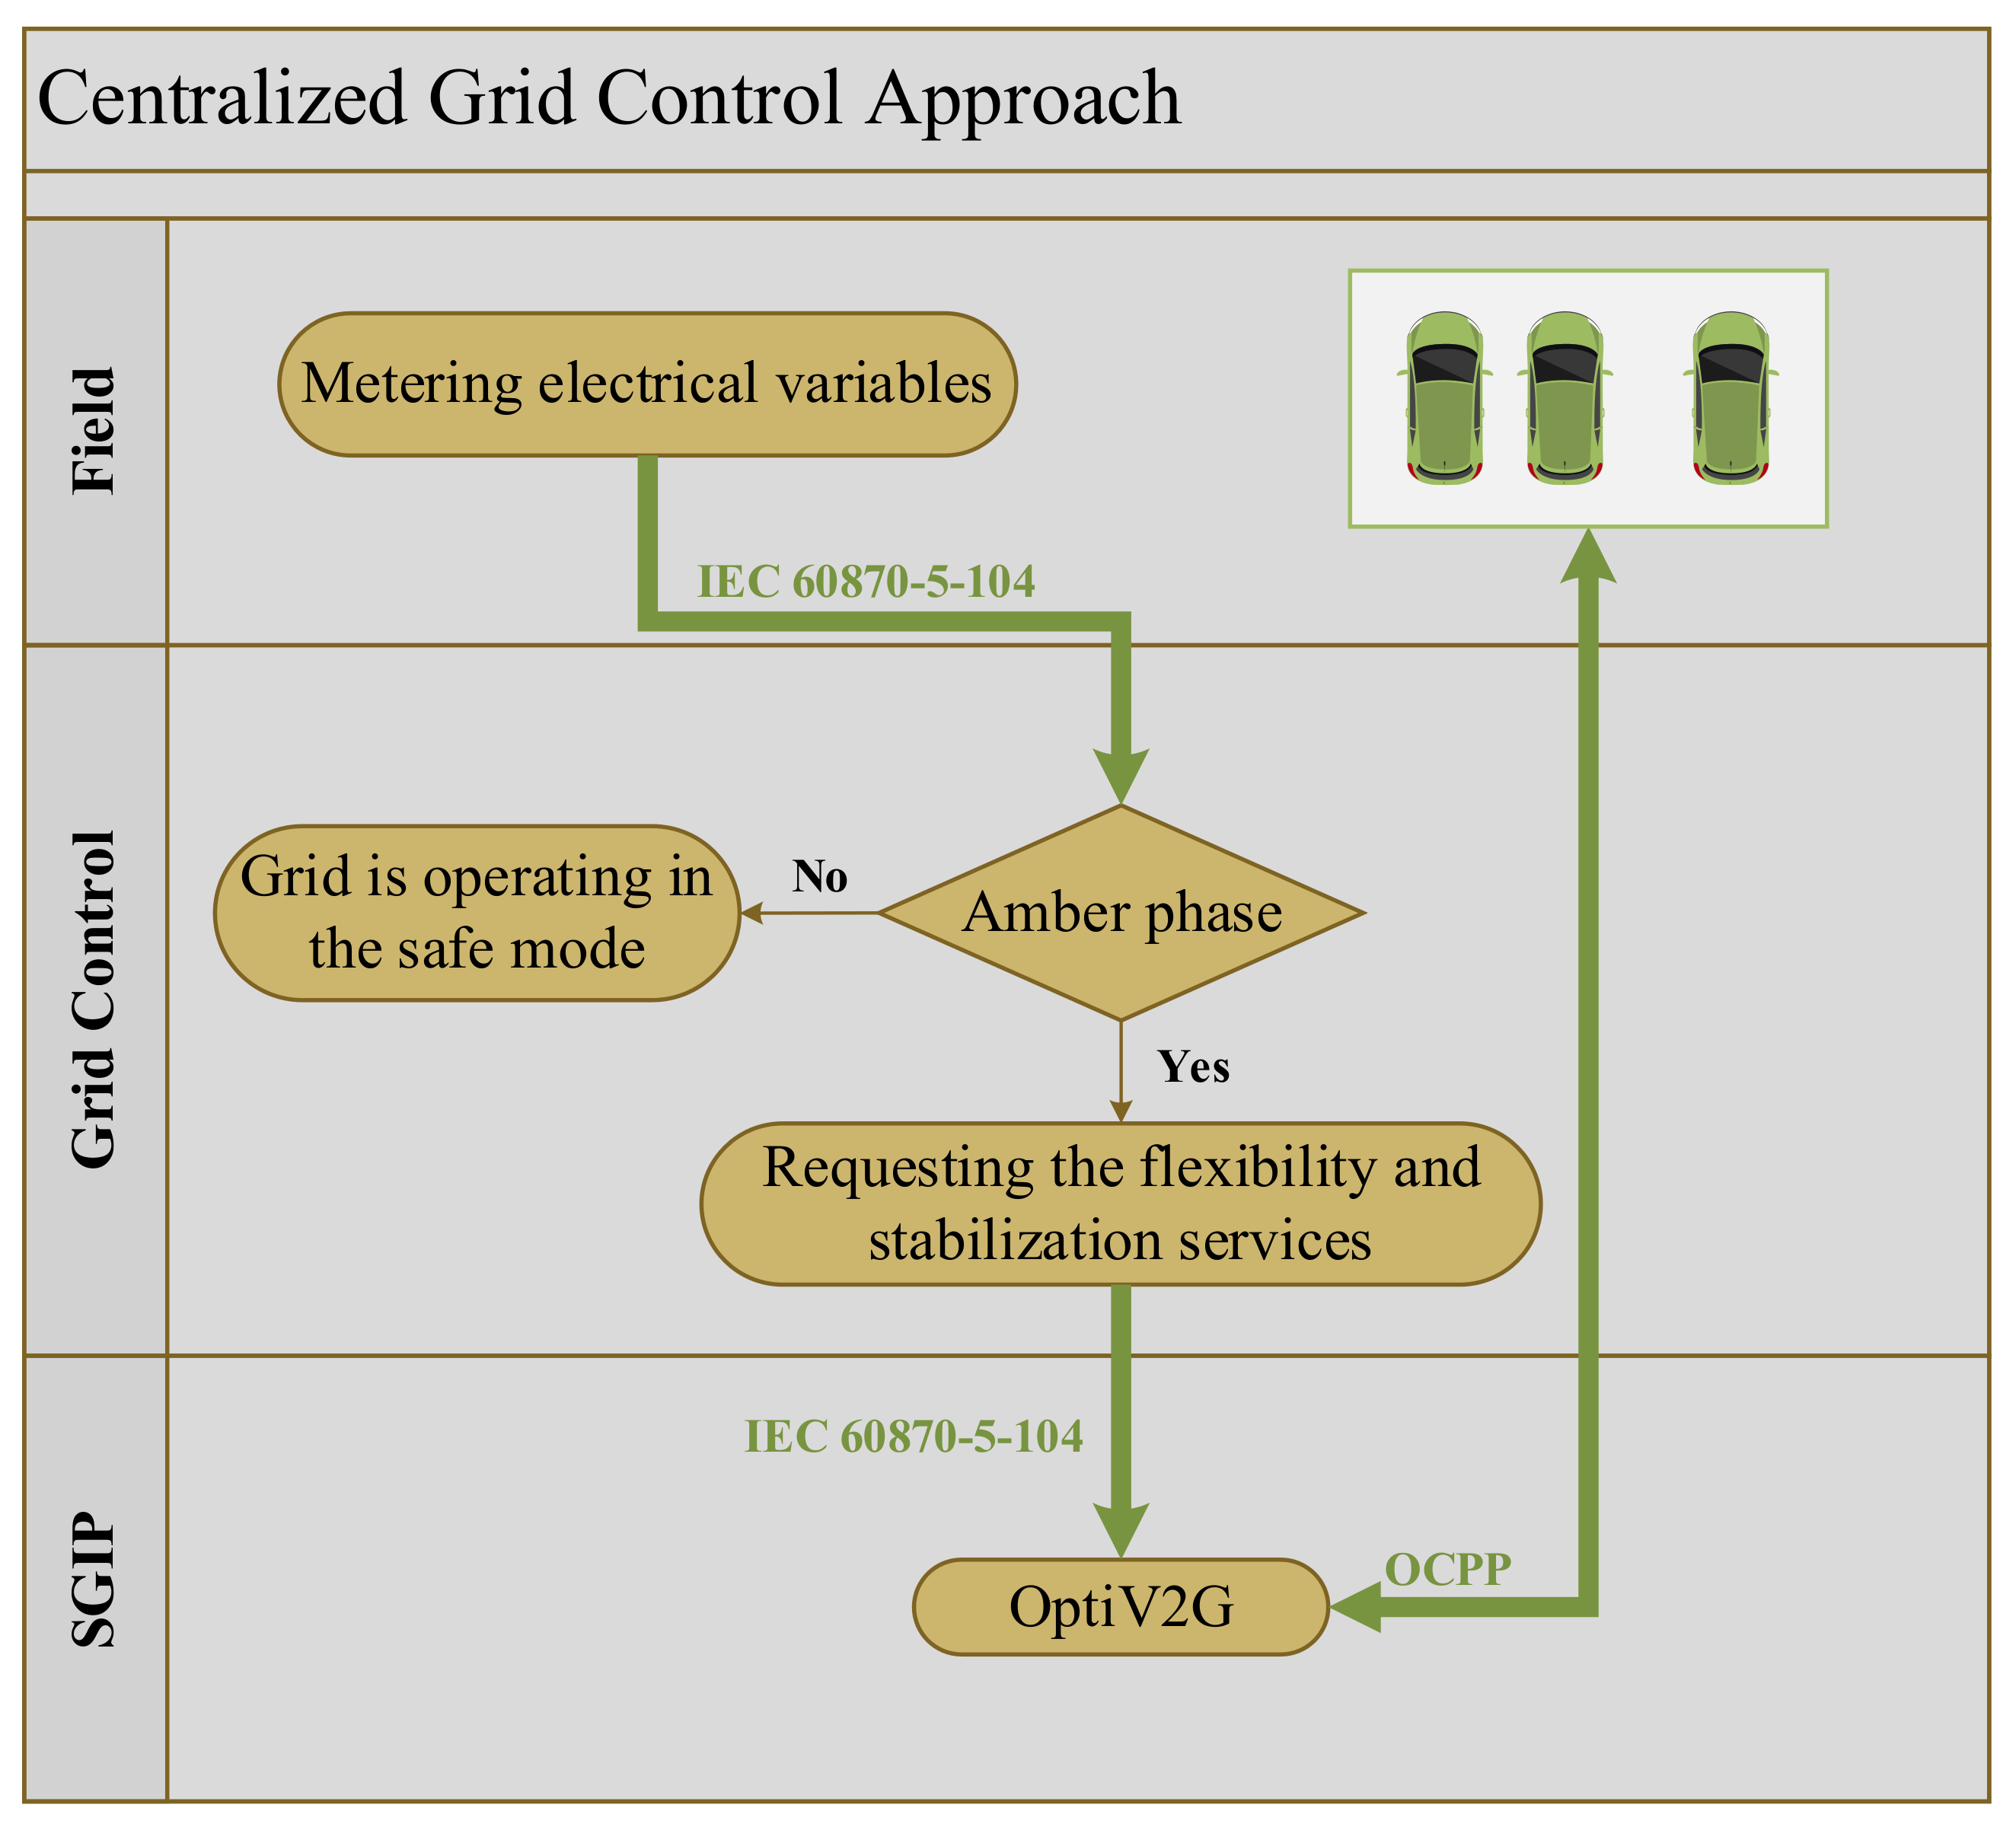
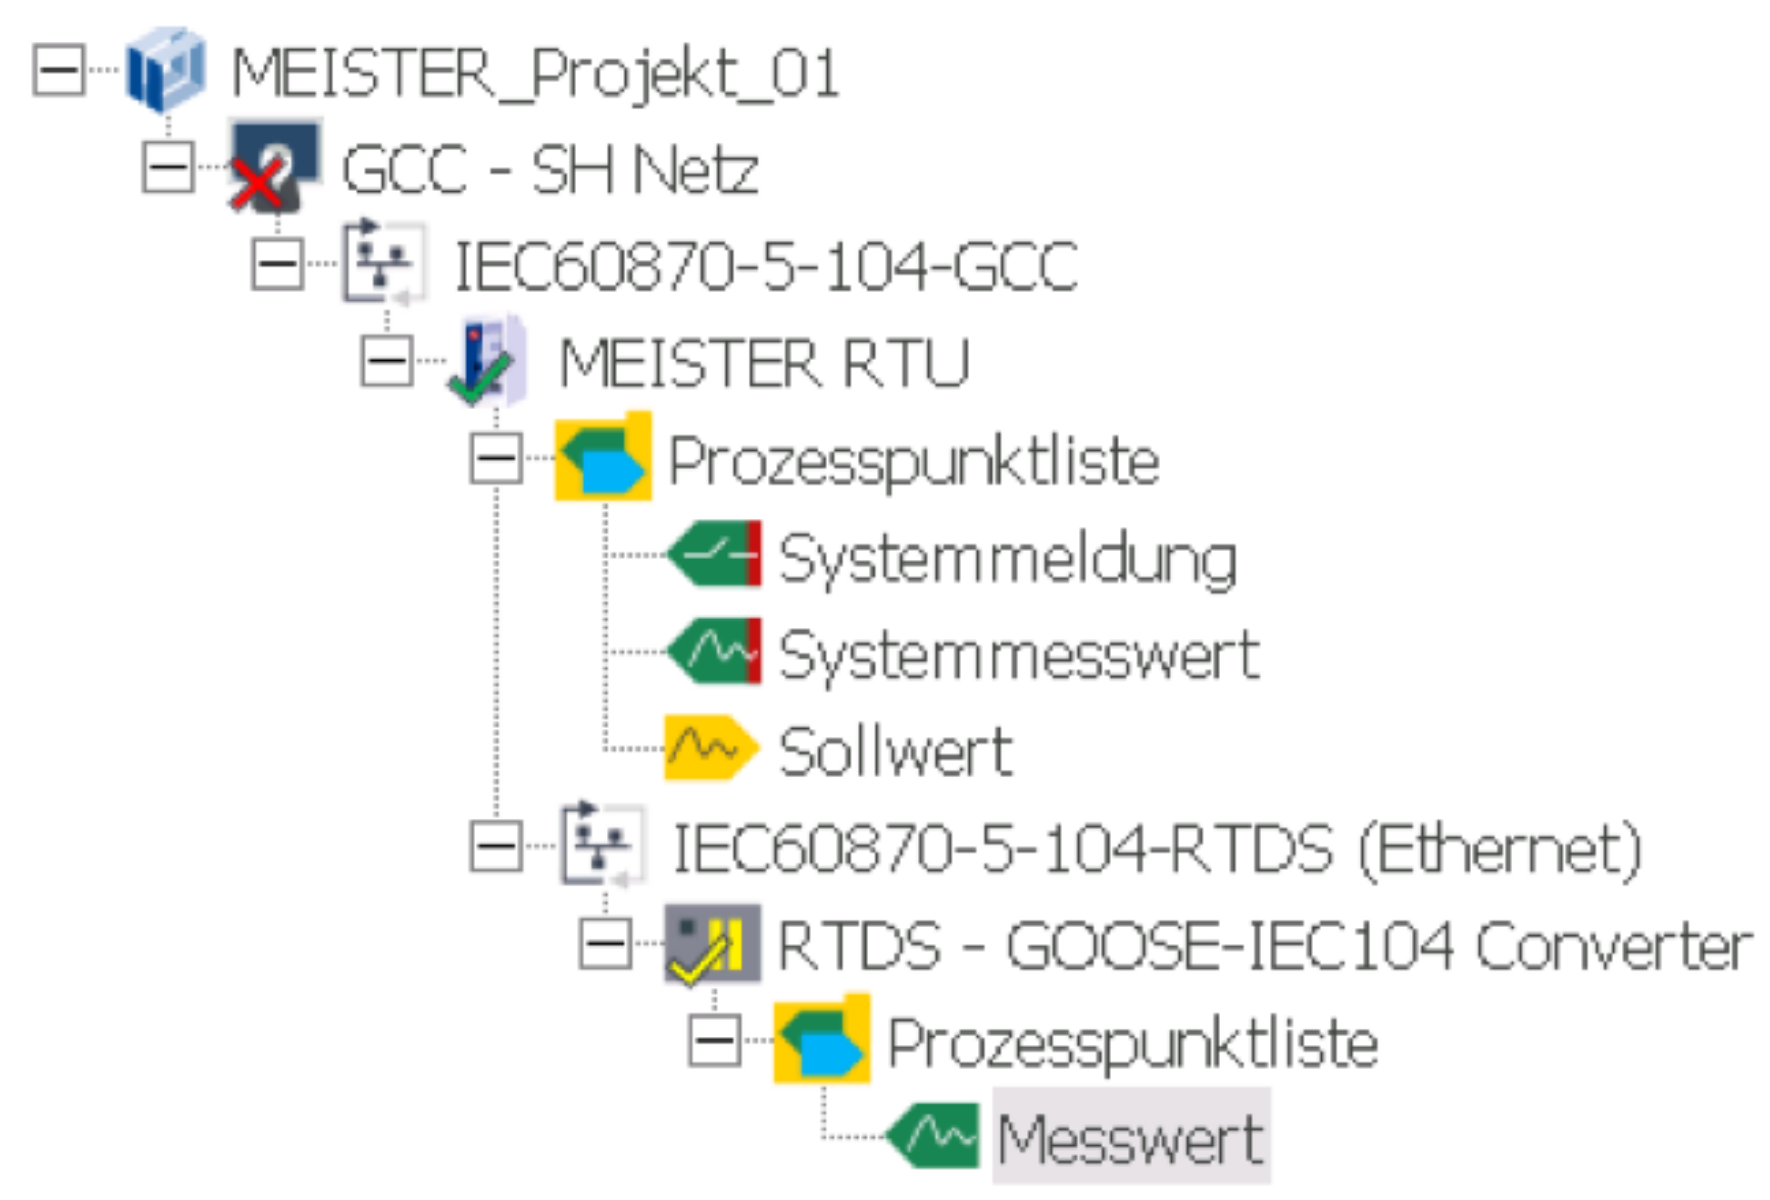
  • Transmitting the measured electrical variables from RTDS in the E.ON ERC LAB site located in Aachen to the grid control center of Schleswig Holstein Netze AG (SHN, located in Rendsburg) where the system amber phase is evaluated.
    • The utilized communication protocols: IEC 61850 and IEC 60870-5-104.
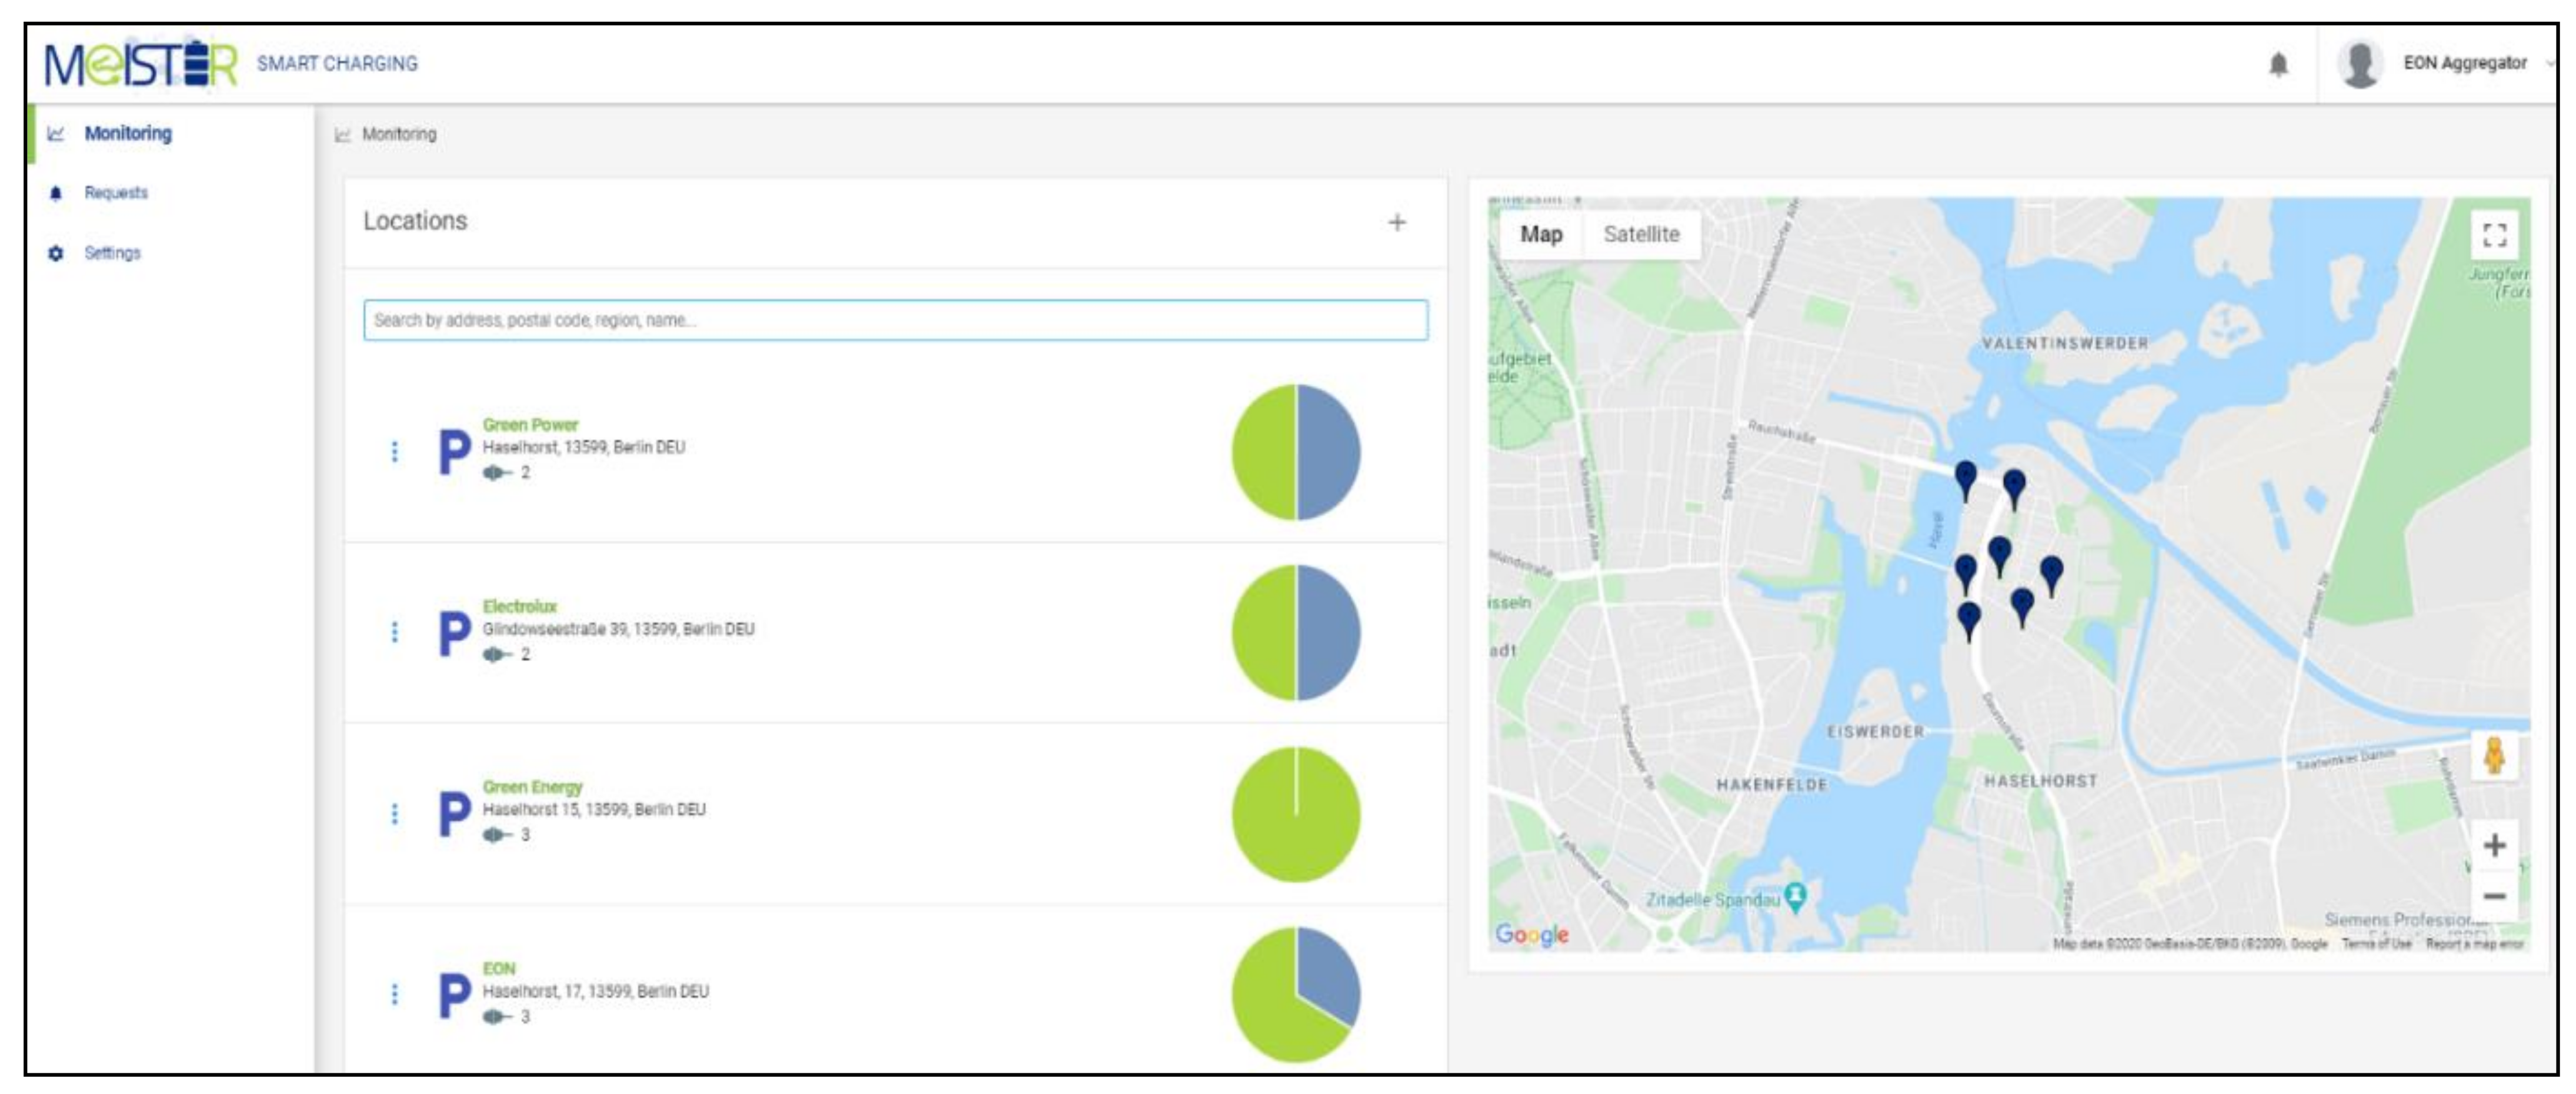
  • Transmitting the grid flexibility requests from the grid control center of Schleswig Holstein Netze AG (SHN) to the smart grid integration platform (SGIP) (located in Thessaloniki) from where the operation of the EVs is managed.
    • The utilized communication protocol: IEC 60870-5-104.
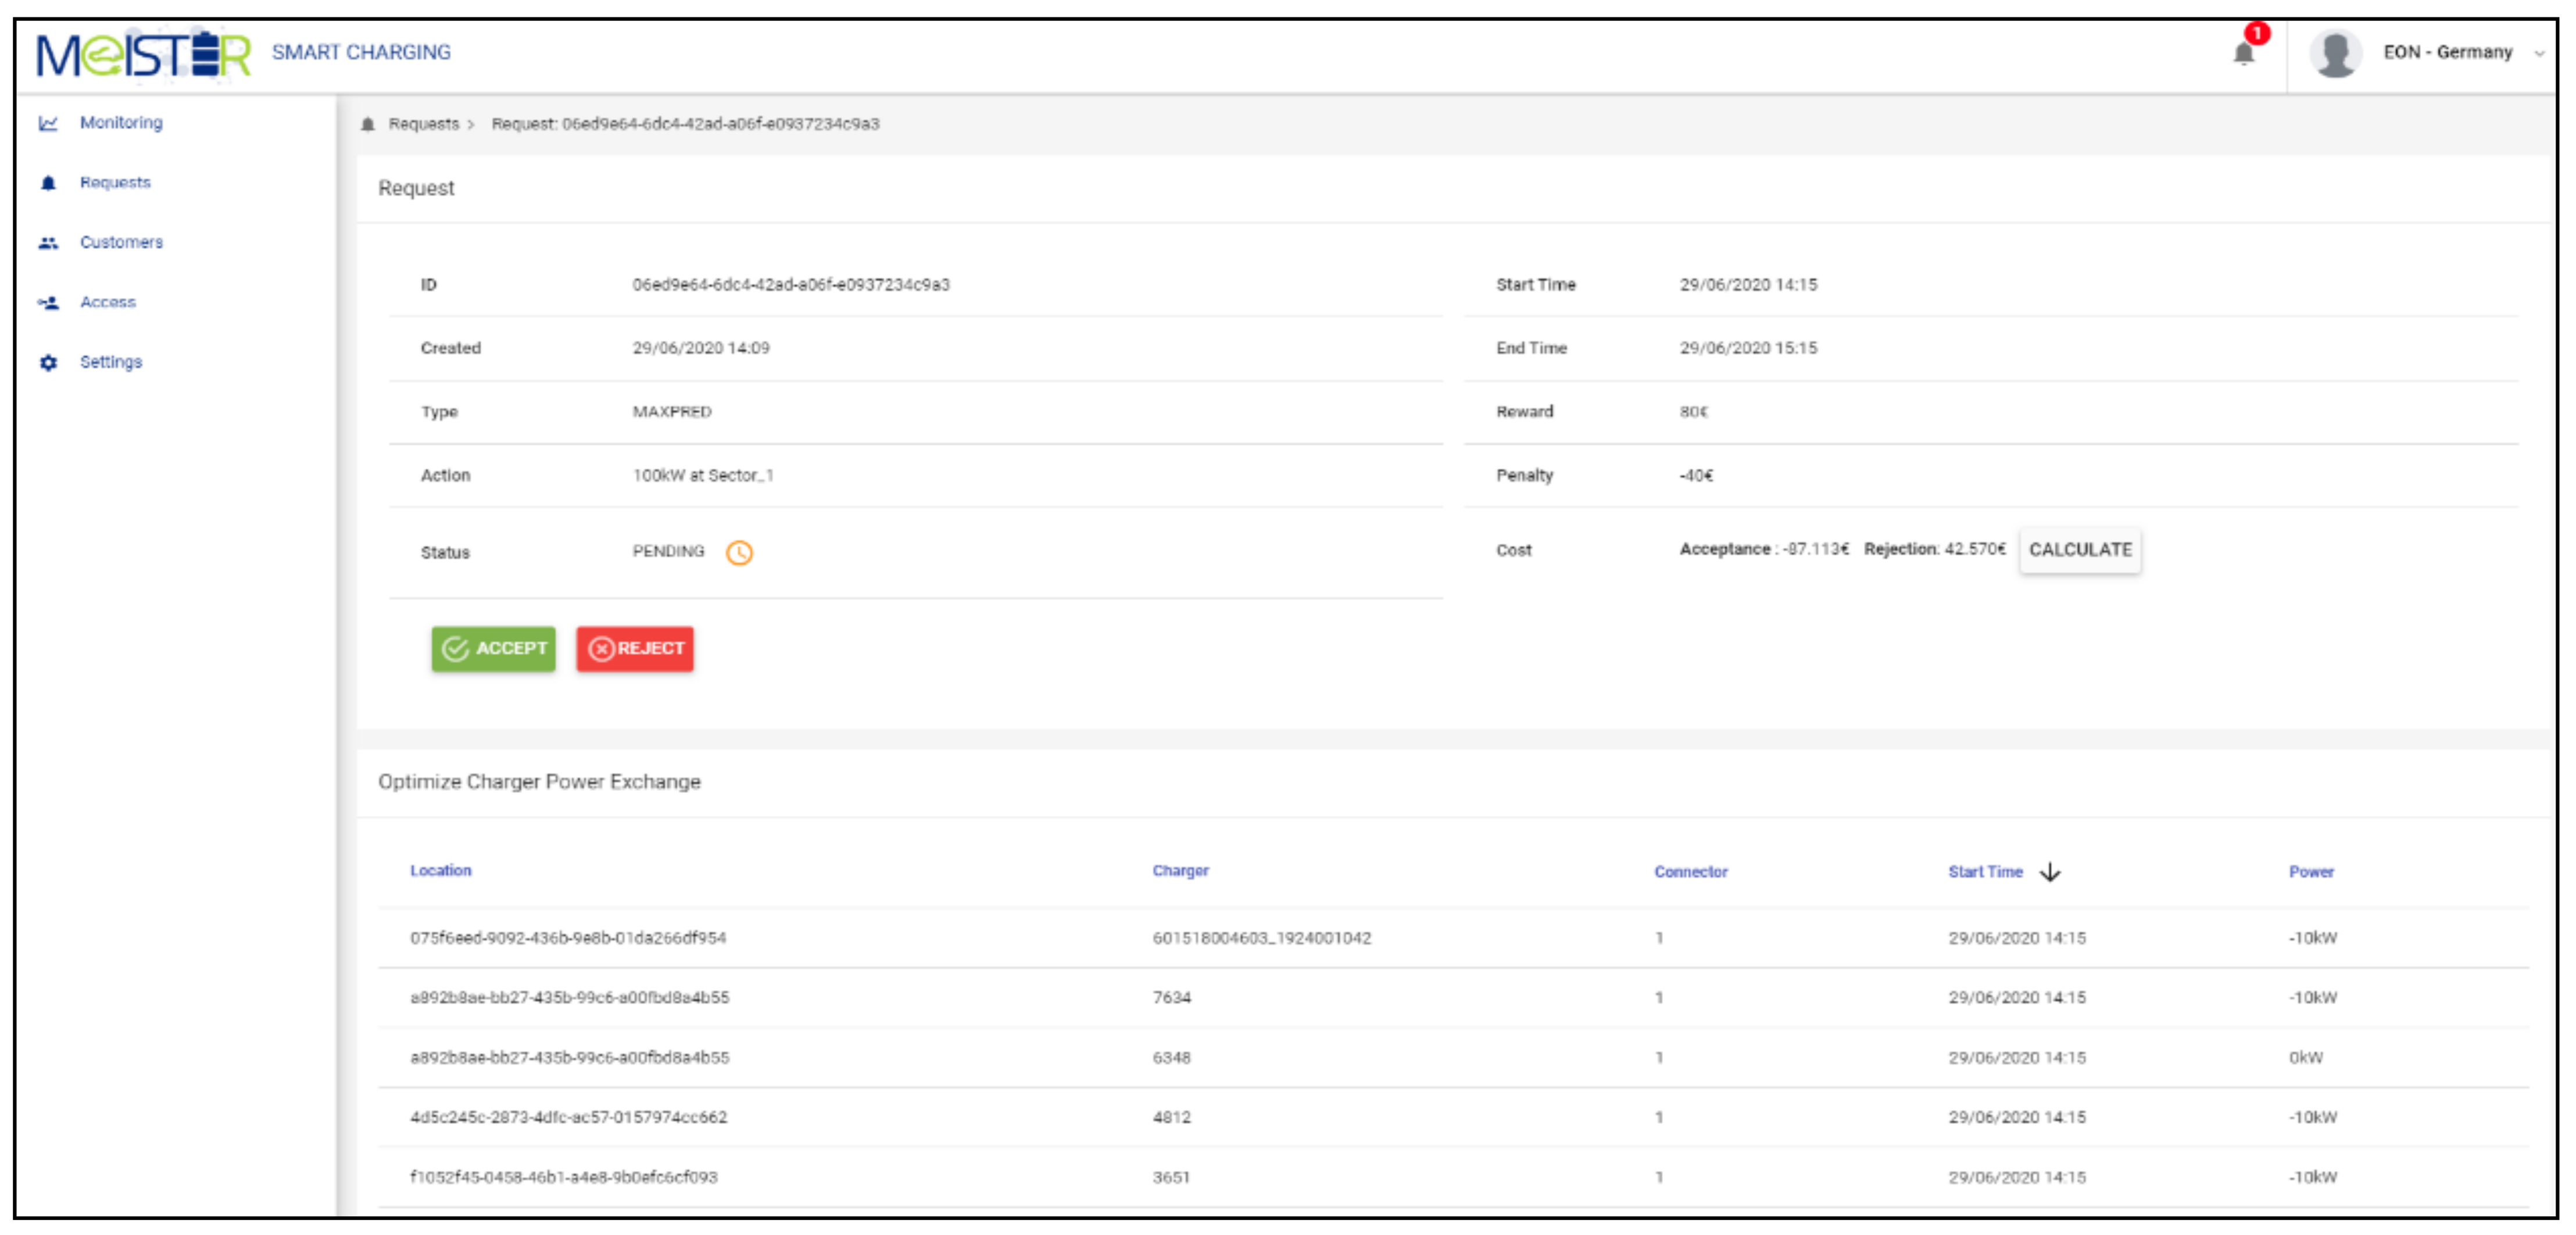
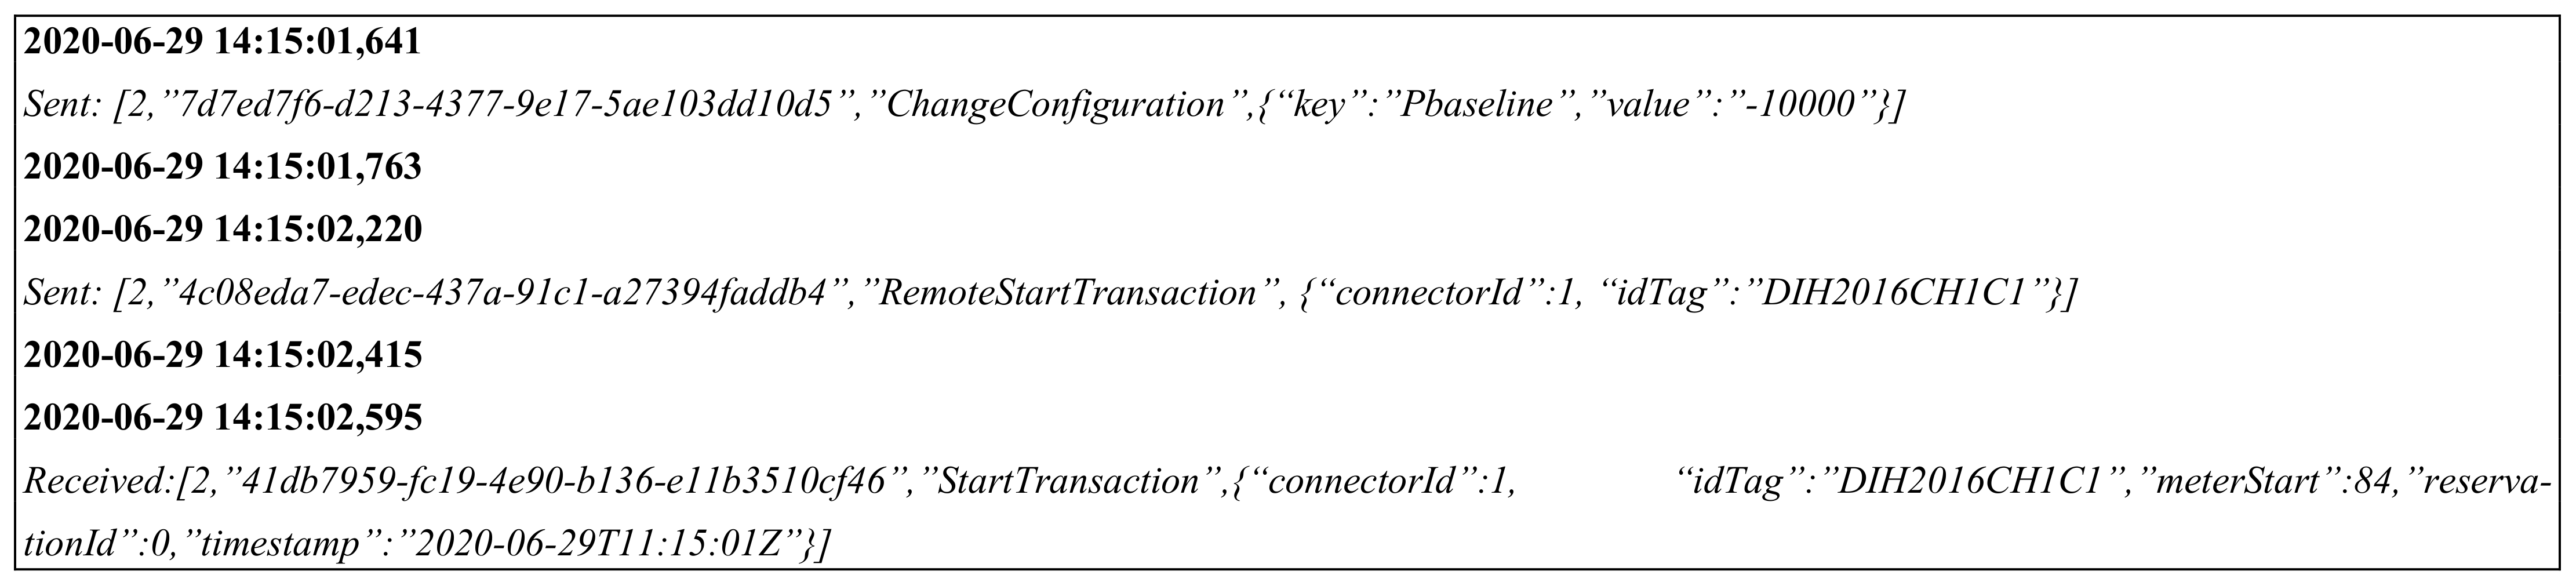
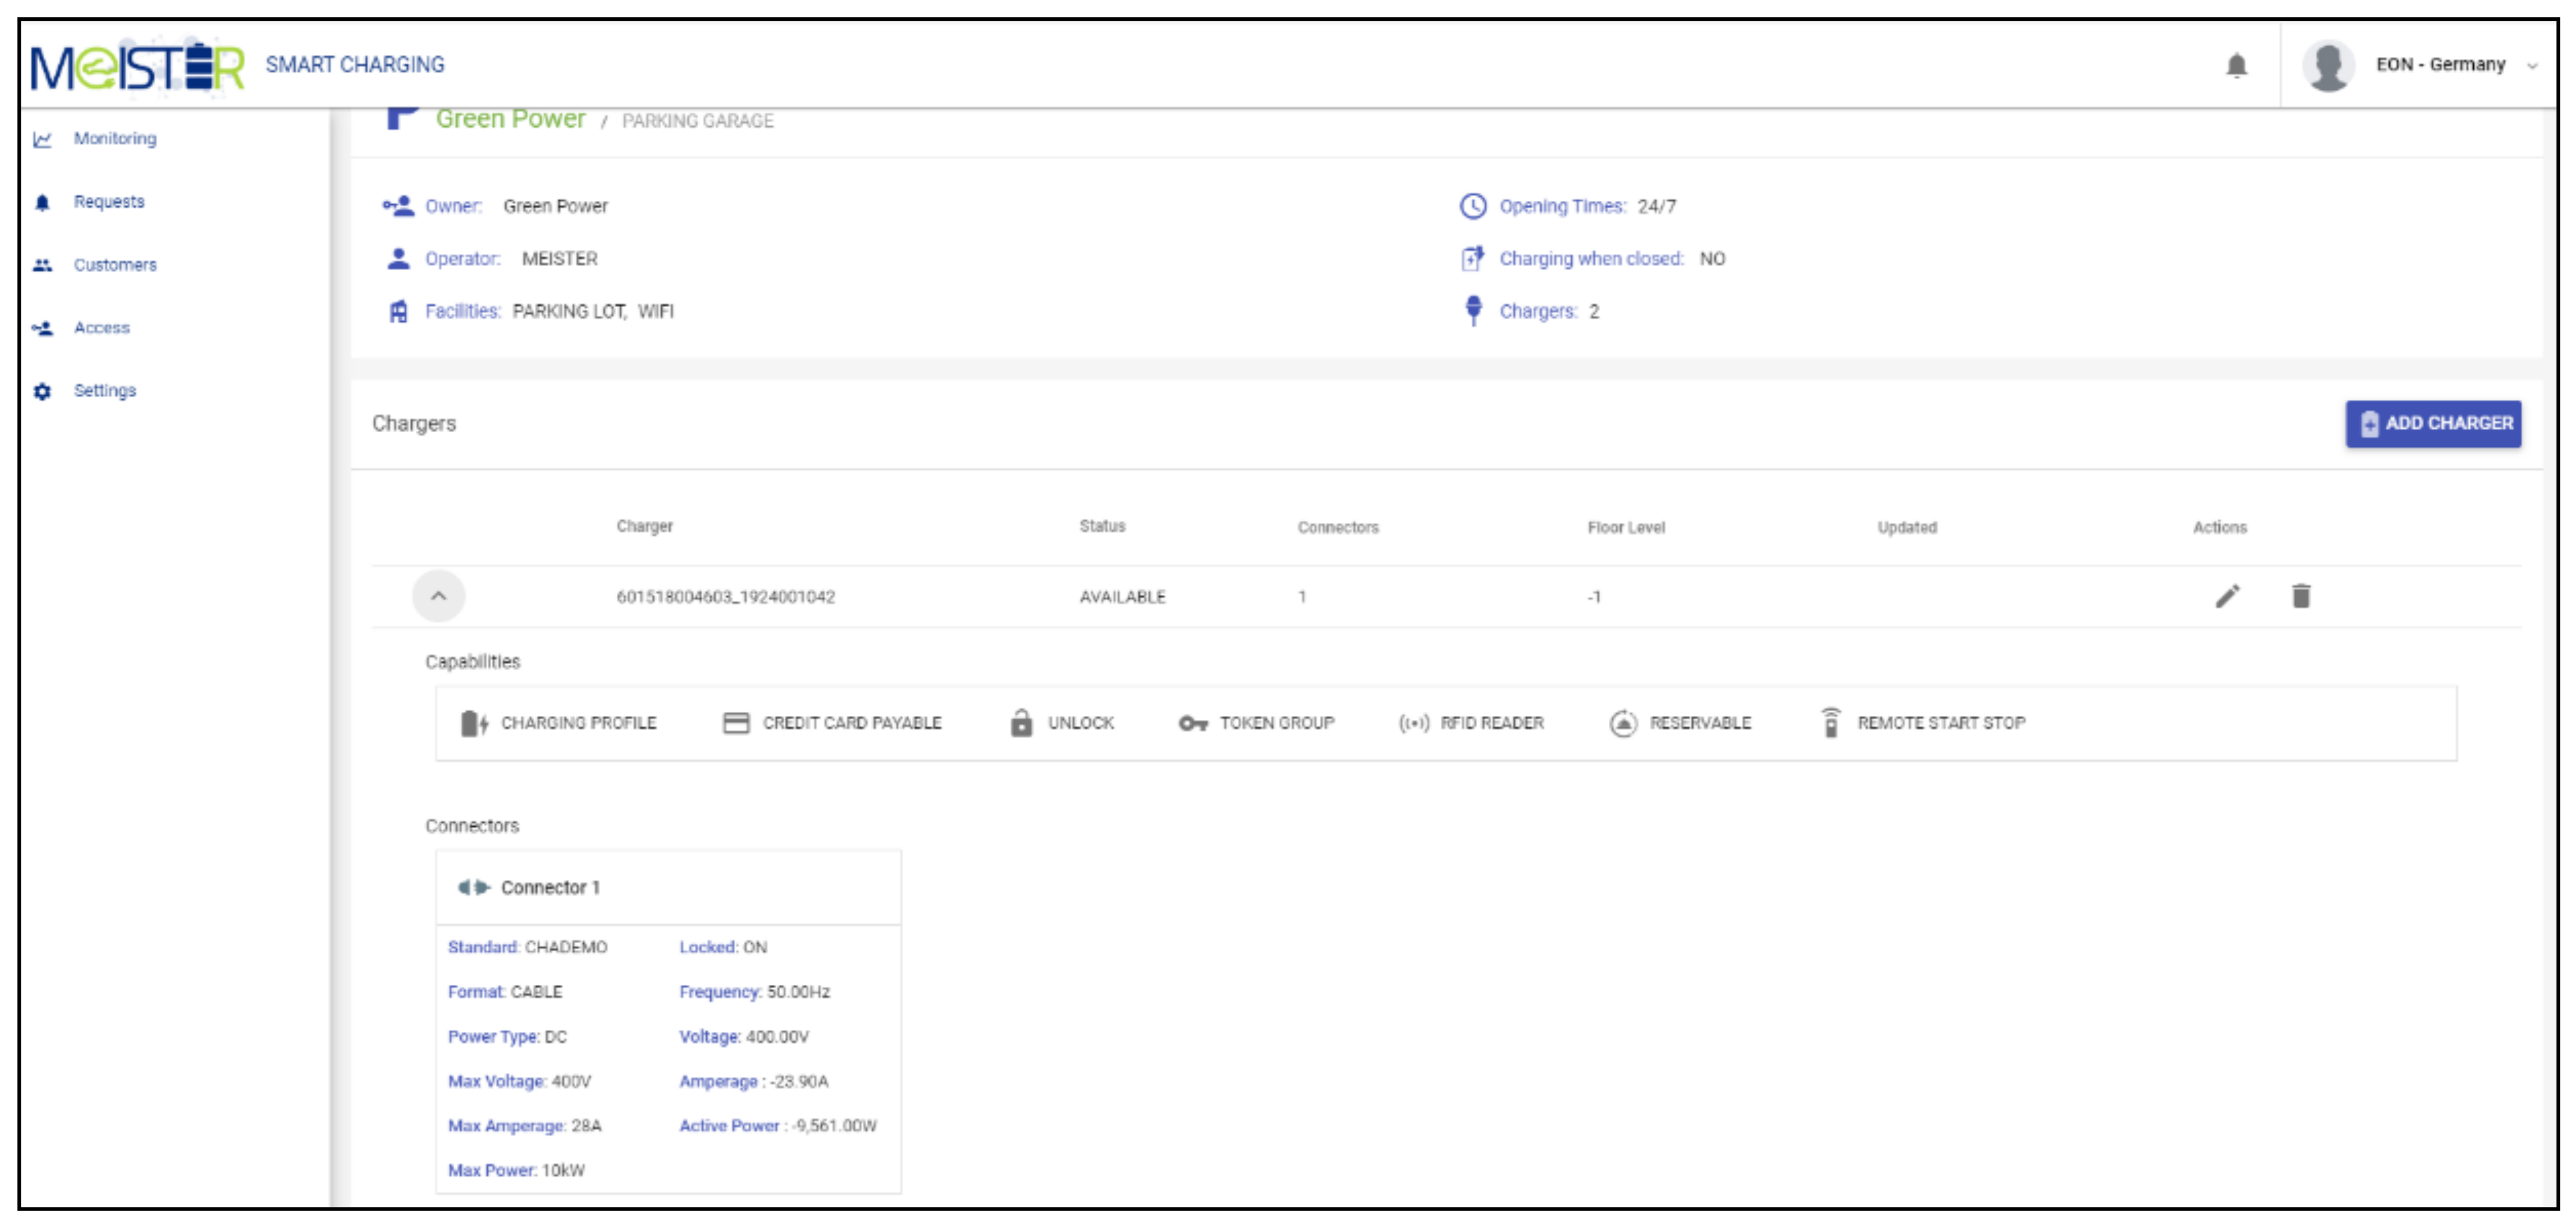
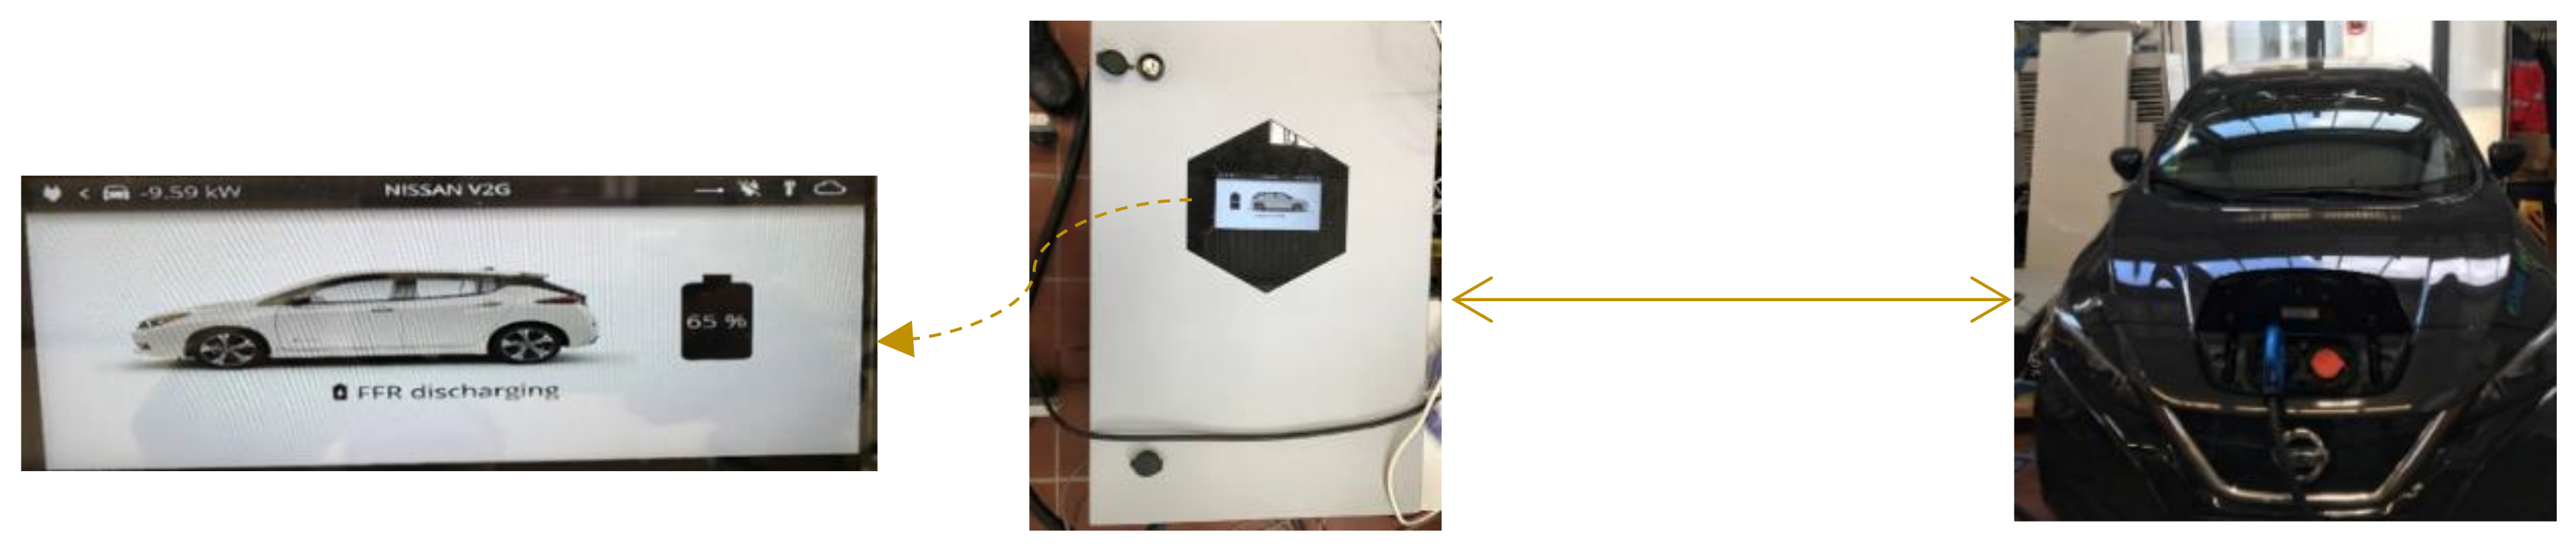
  • Transmitting the charging and discharging control signals from the SGIP to the EV chargers located in E.ON Essen (Germany) and in CERTH in Thessaloniki (Greece).
    • The utilized communication protocol: OCPP 1.6.
To evaluate the flexibility of the EV resources for grid support, hardware/software-in-the-loop simulations via real time digital simulator (RTDS) were performed in this project. The utilized software parts are the ones in the GCC and in the SGIP. On the other hand, the hardware parts are the EV chargers and the connected EVs. These parts communicate among each other with the MEISTER ICT platform. In this context, the considered communication designed solution is aligned with defined interoperability layers of CEN/CENELEC SGAM reference architecture [28]. The corresponding MEISTER SGAM architecture, including all five different interoperability layers, is shown in Figure 3. Each layer is separately shown in Figure 4. However, the lower four layers (component, communication, information and function) are taken into account in this paper:
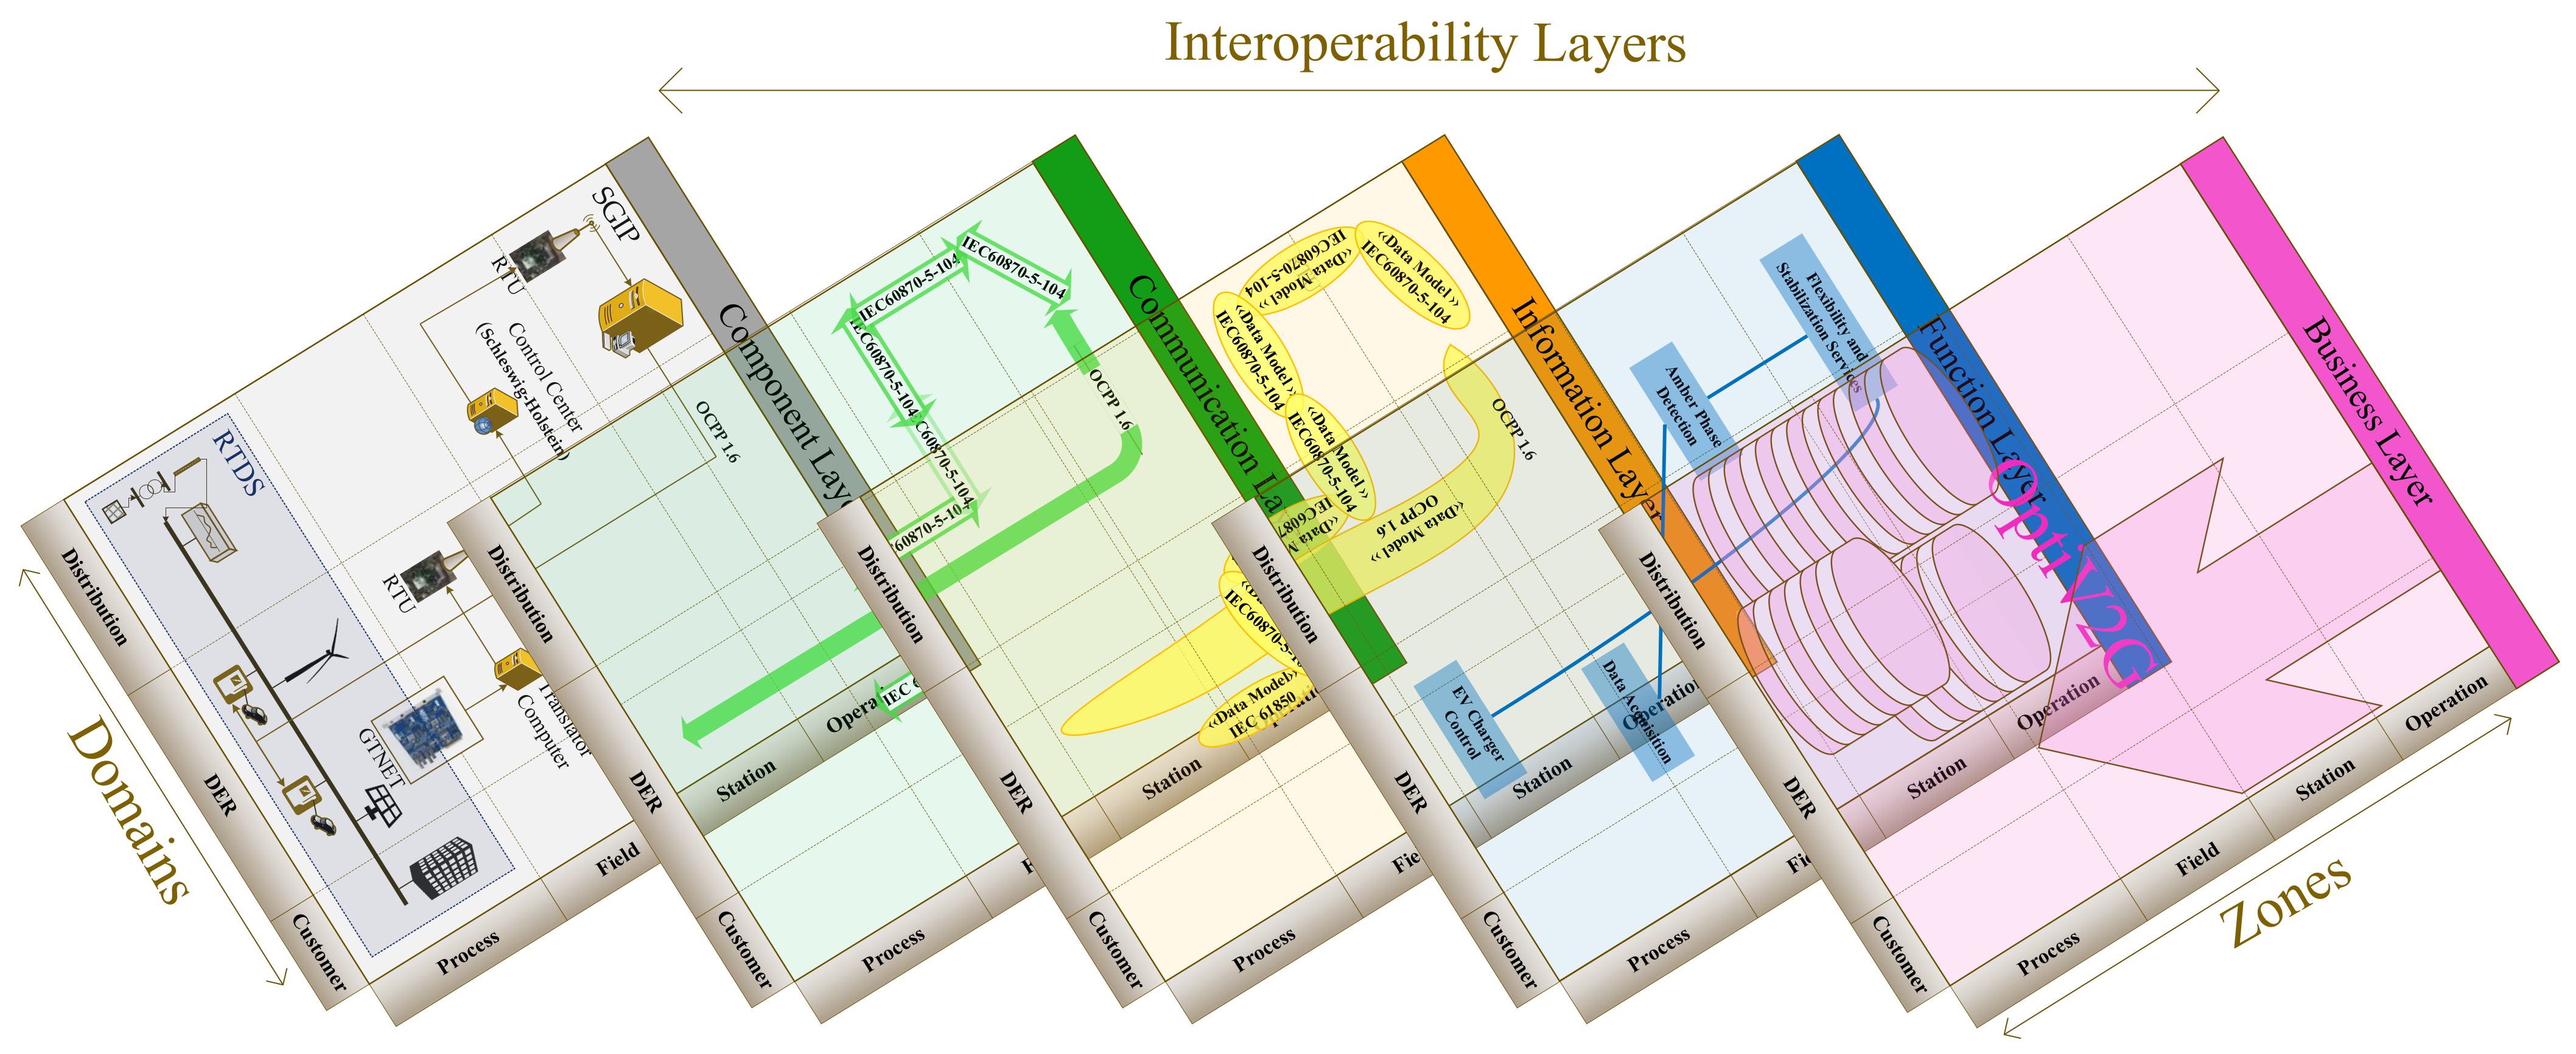
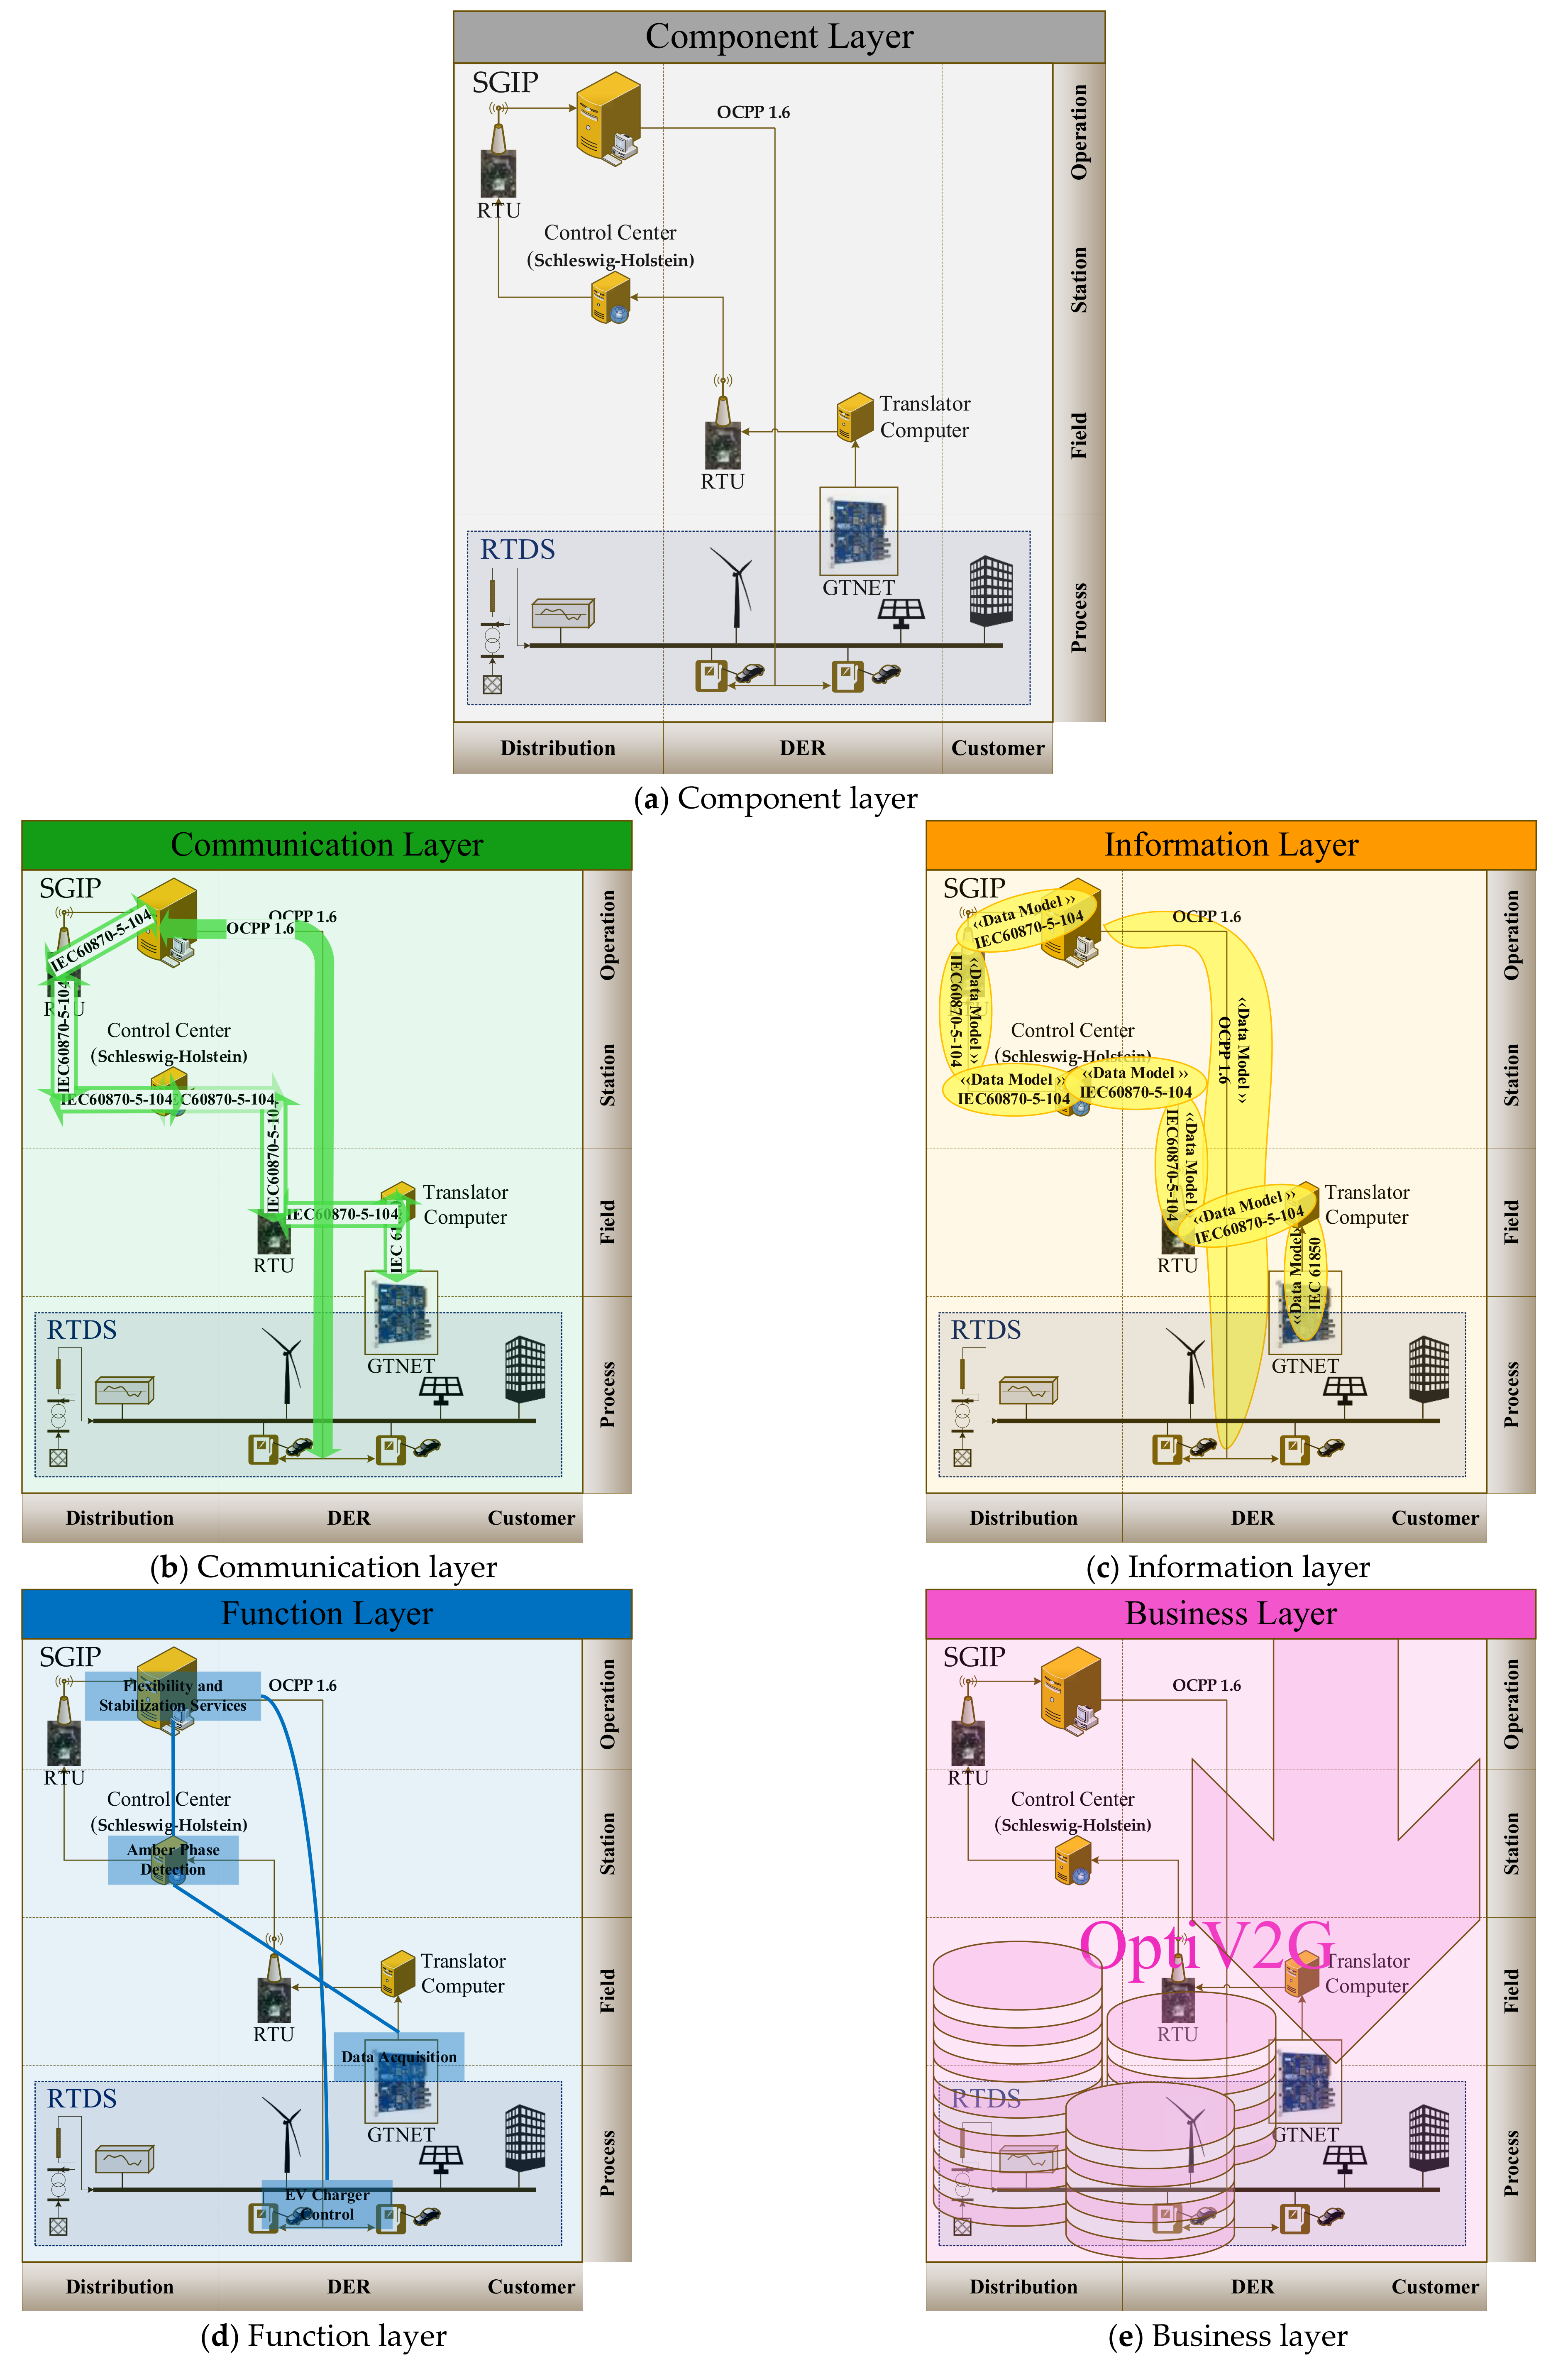
  • Component Layer: the focus of this layer is on the available physical components which are exploited in operation of a smart grid. This includes system actors, applications, power system equipment (typically located at process and field levels), protection and telecontrol devices, network infrastructure (wired/wireless communication connections, routers, switches, servers) and any kind of computers. The real-time simulation component architecture involves all the zones from process to operation levels. The domain of the tests is confined to the distribution system in this work. Figure 4a shows that this layer was built under the framework of the MEISTER project.
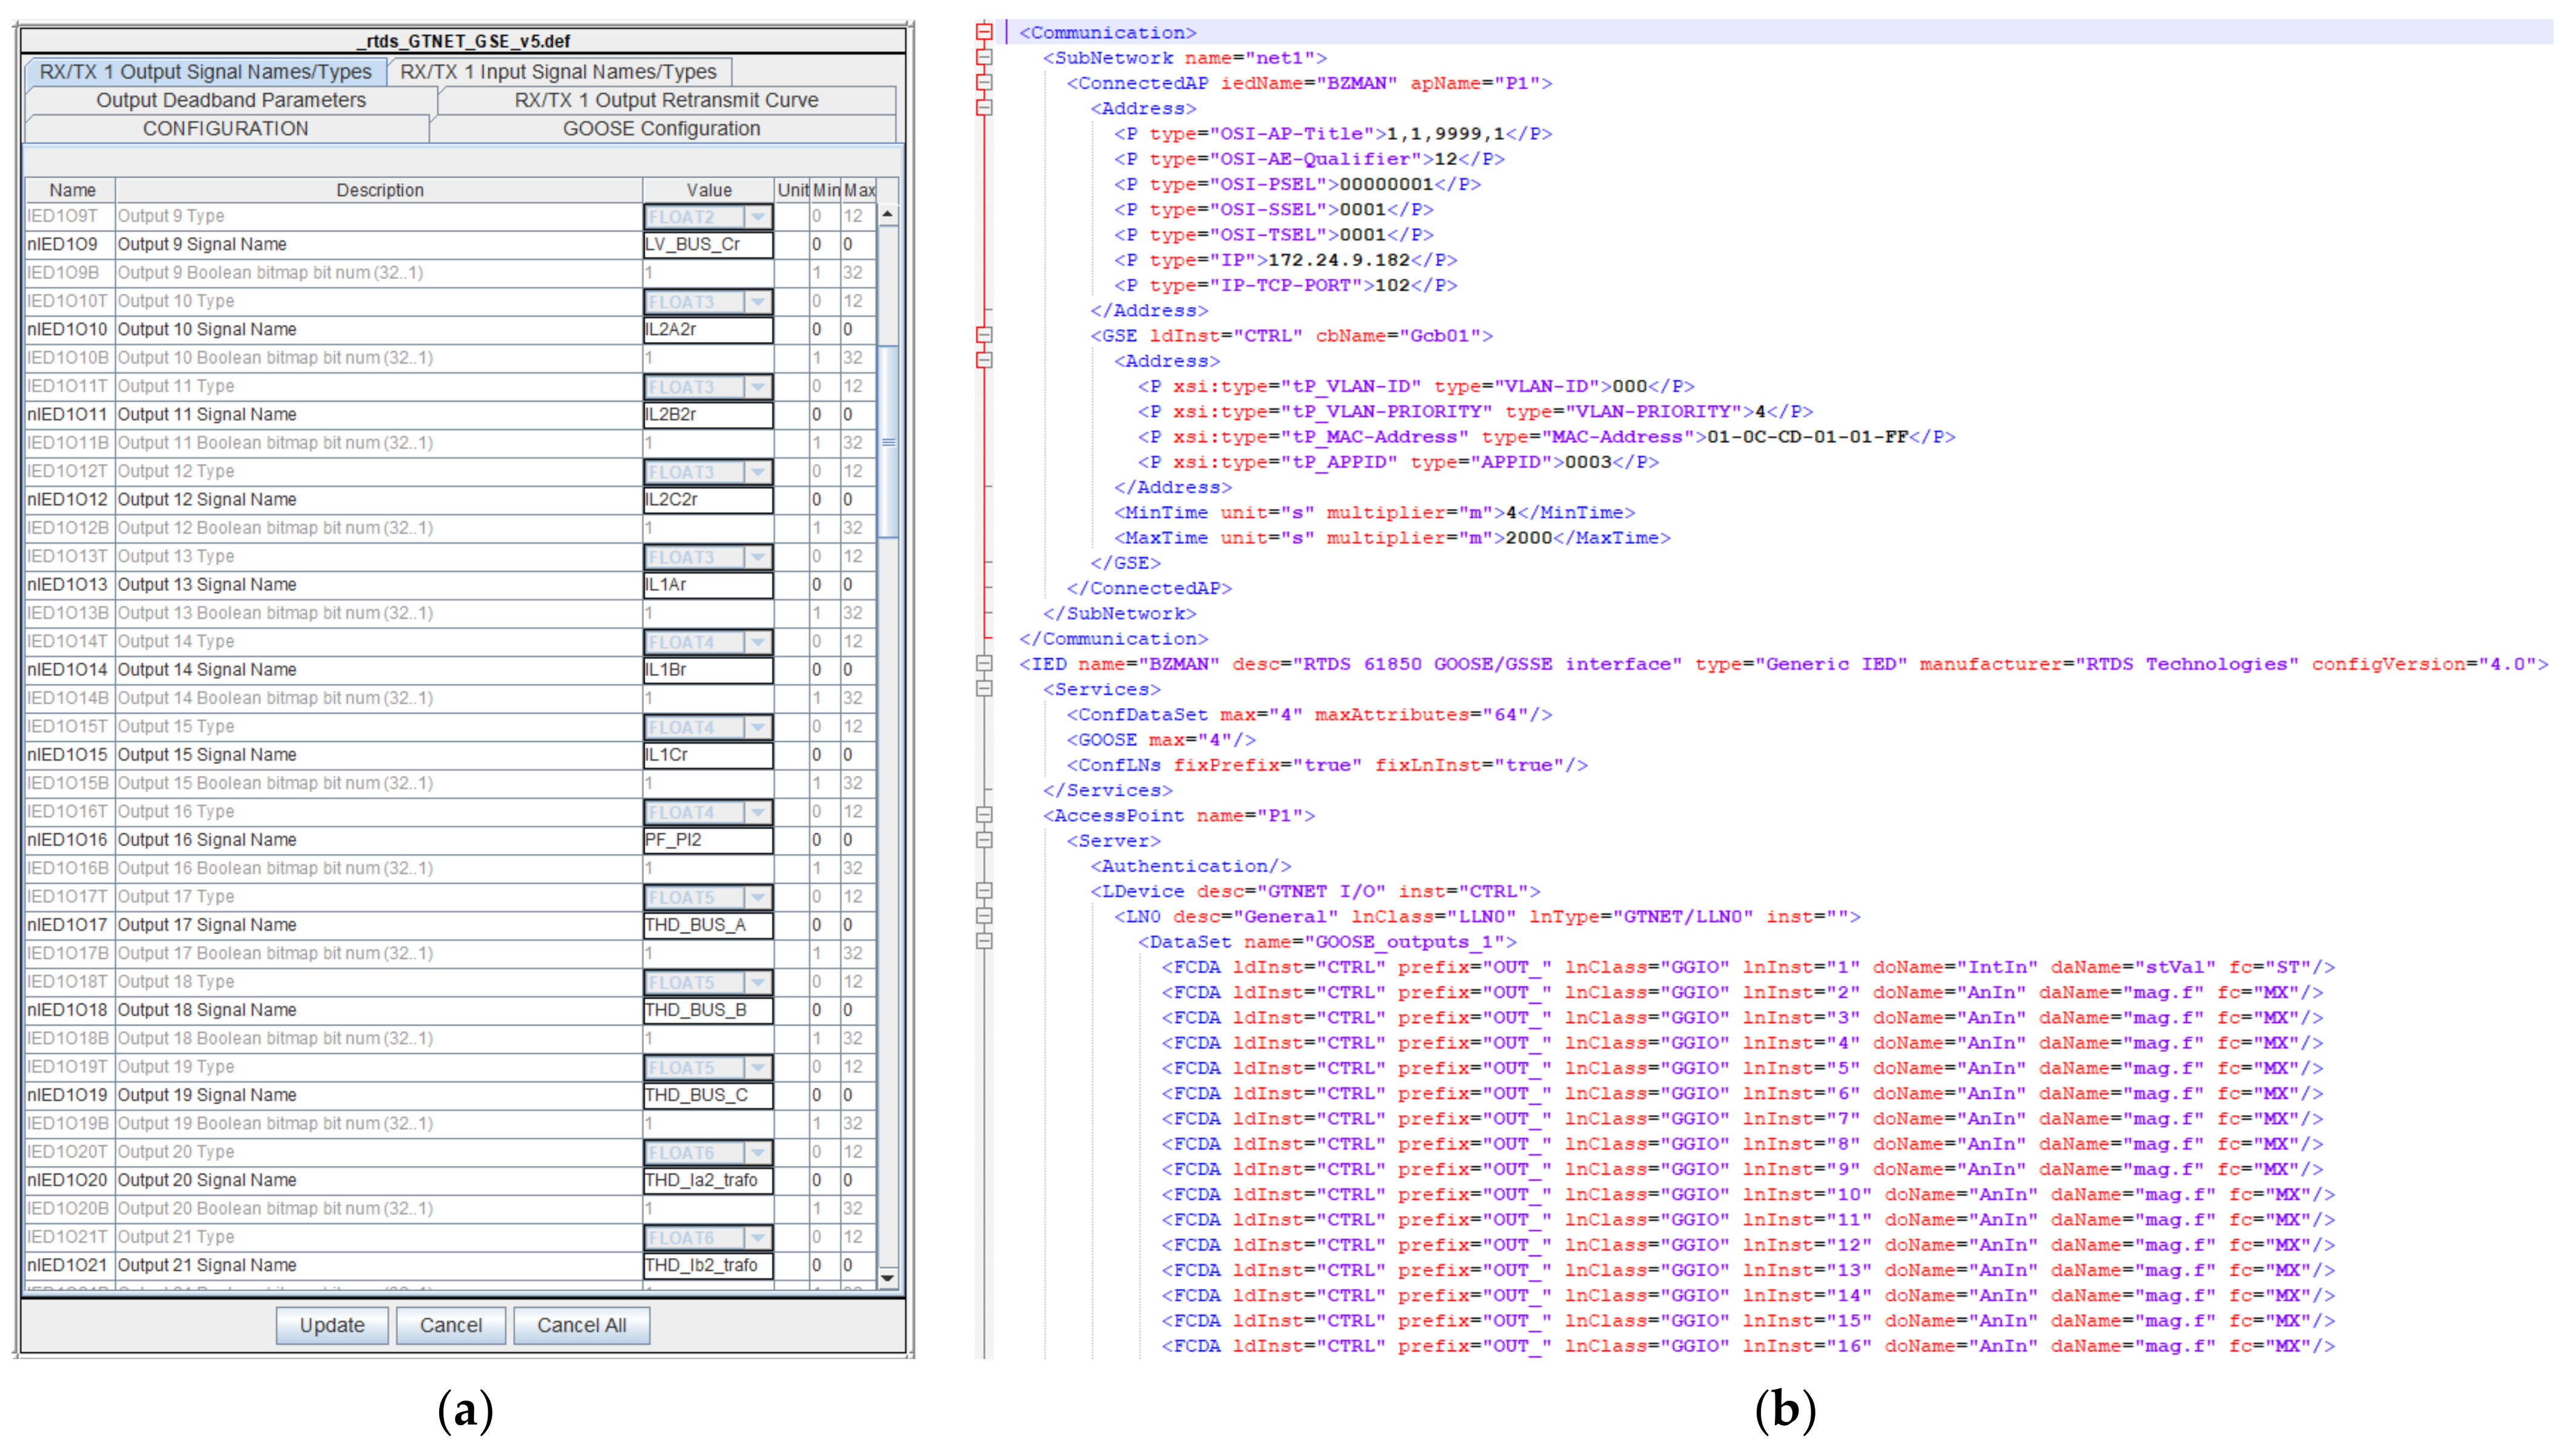
  • Communication layer: the emphasis of the communication layer is to describe protocols and mechanisms for the interoperable exchange of information between components in the context of the underlying use case, function or service and the related information objects or the data models. Under the framework of the MEISTER project, the communication protocols, IEC 61850, IEC 60870-5-104 and OCPP, were utilized (as shown in Figure 4b). Section 2.1 describes this layer in more detail.
  • Information layer: the required information (objects and the canonical data models) to be used and exchanged among functions, services and components are described in this layer. This information represents the common semantics for functions and services in order to allow an interoperable information exchange via communication means. As shown in Figure 4c, the standards considered to be used for data exchange are IEC 61850, IEC 60870-5-104 and OCPP in this work.
  • Function layer: the function layer (Figure 4d) shows the functions and services which are needed to be considered in operation of a smart grid with respect to the domains and the zones of the SGAM diagram. Upon detecting abnormal grid conditions, the SGIP provides the system operator with flexibility measures which can be considered as different use cases in the operation of the smart grid. Each use case contains some function and the sub-functions. In this paper, four different use cases (high load reduction, local RES consumption, filtering of harmonics and reactive power injection) are studied in details in the Results section (Section 5).
It should be noted that this paper focuses only on the feasibility of the ICT platform to be used for the real-time applications and also focuses on how the smart control of the EVs in real-time can overcome some related power quality issues. However, the way in which the abnormal conditions are determined and accordingly how the optimal flexibility services are issues by the SGIP are not considered in the scope of this paper.

2.1. Test Sites and the Communication Interface

More information about the test sites and the applied communication interfaces is provided in this subsection. To interconnect the laboratory at RWTH Aachen, the GCC of Schleswig Holstein Netze AG (SHN), SGIP, EV charger and the EV, the set-up shown in Figure 5 was implemented. It can be seen that the communication network consists of different segments. The first segment is between the RTDS and a translator computer. On this network segment, a MAC layer communication using IEC 61850 GOOSE [29,30] is used to transfer set points and measurements between the RTDS and the protocol translator via a LAN cable connection. In the second segment, which is also a LAN connection, the communication is done based on the IEC 60870-5-104 [31], which transmits measurements via TCP/IP to the RTU provided by Schleswig-Holstein Netz AG. The translator computer is needed since the RTDS hardware does not implement IEC 60870-5-104 and the implemented version of IEC 61850 GOOSE does not support routing. The third segment utilizes a VPN to interconnect the laboratory at RWTH Aachen and the grid control center of Schleswig Holstein Netze AG (SHN). In fact, the VPN connection is used to isolate the depicted infrastructure from the public internet. This is realized with a wireless LTE connection, representing the connection between sensors or actors in the field and the control center. From the grid control center, the data is transmitted through the RTU to the SGIP where the EVs are controlled in real-time. Furthermore, a wireless LTE connection was implemented between the control center and the RTU. For the following communication between the RTU and the SGIP a wired connection is used. The SGIP communicates with the EV chargers based on the OCPP protocol and the interface description between charge point and central system (SGIP) is described in [32]. Finally, the EV charger communicates with the EV, or more precisely, with the battery management system of the EV via the CHAdeMO protocol (IEC 61851-24/ IEEE 2030.1.1). It should be noted that the data can be transmitted from the field to the EV resources in less than a second through this ICT platform. To optimally use any number of the available EVs plugged into the chargers, however, the SGIP is equipped with an optimization V2G engine (OptiV2G) which minimizes operation cost whilst the GCC request gets fulfilled [27]. This optimization problem is solved using a real-time pricing scheme. To this end, the required time resolution is equal to 15 min, meaning that all incoming and outcoming timeseries include data/set-points for each quarter of the hour. Thus, the EV chargers are given the power set-points at the beginning of a quarter and they should keep it absolutely constant for the remaining quarter. In this way, the constant power load/generation operation for all participating inverters and thus, power balance is assured [23]. In this respect, the observed communication latency in this work is negligible compared to the required optimization interval of 15 min. This particular implementation is a proof of concept for the optimization and therefore the aspects of IT security and redundant infrastructure are not considered in this discussion. However, the communication network requirements for voltage stability and the operation of EVs in smart grids are provided in [33,34] and the observed latency in this work is comparable with them.
  • E.ON Research Centre, RWTH Aachen (ERC)
To evaluate the impact of RESs including PV, wind and EV systems on the grid power quality and assess the EVs flexibility measures, the grid model of an exemplary distribution grid of Waterkant Berlin was simplified and modelled in RSCAD (RTDS software user interface) at the ERC RWTH Aachen as shown in Figure 6. The RTDS simulator is capable of simulating complex networks using a typical time step of 50 μs. As the developed algorithms of SGIP is not considered in the scope of this paper, RTDS has been used instead, to replicate some SGIP flexibility and stabilization services. This simulator has the ability to perform hardware/software-in-the-loop simulation which is ideal for assessing the real-time feasibility of the MEISTER ICT platform. In this respect, it has a feature to communicate the simulated signals (metering and the control values) based on different communication protocols via a physical electronic board called a GTNET card. The GTNET card is used to interface the RTDS with the external equipment over a LAN connection using various standard network protocols. Therefore, the GTNET card can be thought of as a protocol converter. Data from the RTDS simulation is placed into a packet and put out on the LAN where it will be picked up by the devices assigned to accept the data [35]. In the MEISTER project, the GSE/ GOOSE protocol was used for data transmission. When transmitting GOOSE messages from the GTNET, the content in the GOOSE messages by the GTNET is configured through the GTNET draft component parameters and the RSCAD substation configuration description (SCD) file. Figure 6a shows the assigned grid parameters for the GTNET draft component in RSCAD. The list of these parameters is available in Table 1. Based on the IEC 61850 standard, the RSCAD SCD configurator provides the data model (which is shown in Figure 6b) in accordance with the defined parameters in the GTNET draft component. In fact, the SCD configurator is able to import the system specification, description of the single line diagram of the substation and the configuration files describing in detail the capabilities of the used monitoring, control and the protection devices in operation of the grid. Considering the mentioned imported information, then, the RSCAD SCD configurator generates the SCD file.
A translator computer is responsible for translating the IEC 61850 GOOSE to IEC 60870-5-104. This translator computer is a general-purpose desktop computer running Linux Mint 19.3 [36]. To this end, two open-source software components in [37,38] covering the needed protocols are used. The implementation can handle bidirectional communication. The software is implemented in C and can be compiled for any Linux based computer. In addition to the translator software, an IEC 61850 GOOSE client and an IEC 60870-5-104 client is implemented to test the translator functionality. A screenshot of the software and the IEC 61850 GOOSE test client is depicted in Figure 7.
b.
Schleswig Holstein Netze AG (SHN)
The test environment of the GCC of SHN is used in order to receive the data which is simulated at ERC RWTH Aachen. As explained, the dedicated Schleswig-Holstein Netz RTU is the interface in between. The received measured data from the RTU is visualized by SetIT software as shown in Figure 8.
The complete list of the electrical variables that were transmitted by the proposed ICT platforms is found in Table 1.
The user interface of the SetIT uses the widely known tree structure. Every component inside the tree structure (shown in Figure 9) has been configured regarding the communication parameters, process point parameters and protocol parameters.
The RTU from Schleswig-Holstein Netz AG is set up with a net-line FW-5-GATE [39] from SAE IT-Systems and an LTE industrial router MC MRL from MC Technologies. The LTE industrial router has the function of establishing the communication with the GCC and gives the option of remotely connecting to the FW-5-GATE inside the RTU. An antenna is connected to the MC-MRL and is placed in the most suitable position to obtain a good connection. The FW-5-GATE is a compact and communicative micro remote terminal unit. It has two separated LAN connection ports, 2 RS-485 field interfaces, a temperature sensor (−25 to 100 °C) and an integrated 24 V DC power supply. Both LAN ports are used in this RTU. The first LAN connection port X100 is for the communication with the LTE industrial router and the second LAN connection port X104 is for the communication to the RTDS.
Figure 10 shows a graphical representation of the RTU and includes its structure and wiring. The RTU is placed in the E.ON ERC in Aachen near the RTDS. The FW-5-GATE supports different protocols including IEC 60870-5-104 TCP/IP. The algorithms declaring the grid status as being in the amber phase is implemented at SHN where the request for flexibility services is generated.
c.
CERTH/ ITI Hellas
The MEISTER SGIP is installed at the CERTH/ITI premises in Greece. This platform provides innovative and advanced functionalities for the smart management of the electric vehicles supply equipment (EVSE) and the charging processes of the electric vehicles (EVs).Therefore, it could be used by charging point operators—CPO (or aggregators), to optimize the dis-/charging of EVs (i.e., vehicle-to-grid, V2G operation), making it possible to use them as dynamic and flexible distributed energy storage systems. This smart dis-/charging modifies on-demand electricity consumption curves, by fully controlling the electricity stored within EV batteries. The main window of the graphical user interface (GUI) of this platform is shown in Figure 11.
The developed platform fully supports V2G capabilities, meaning that electrical power can be fed back to the local grid when needed, responding to the flexibility requests from the distribution system operators (DSOs). In this respect, the SGIP is responsible for communication with both the GCC and the EV chargers. To validate and evaluate the examined scenarios described in this paper, four-quadrant power converters are necessary so that both active and reactive power flows are bidirectional. However, there are no commercial four-quadrant EV chargers. There are only very few V2G models—which allow only bidirectional active power flow—available on the market with most of them being used only for testing purposes in research centers. Consequently, only the use cases corresponding to active power setpoints can be tested with commercial products. Therefore, the experimental testbed for the eligible use cases corresponds to one sector of the Berlin distribution grid, which contains one V2G EV charger (manufacturer AME, rated power at 10 kW), installed at the EON ESSEN lab, connected to a set of virtual similar EVs (15 in total, with varying rated powers), simulated by the SGIP. With this setup, both the physical connections and the aggregated control of several EV chargers can be evaluated. In the first examined use case, the GCC requires the injection of 200 kW from the EV parking. Based on the flexibility that each CPO can provide, the GCC decided to send a request for 100 kW to the SGIP through the RTU, see Figure 12. Consecutively, the SGIP investigates whether support can be provided to the electrical grid by utilizing any number of available EVs plugged into the chargers of this specific region. In order to accomplish that, the platform is equipped with an optimization V2G engine (OptiV2G), developed by CERTH. The OptiV2G engine achieves minimized operation cost whilst the GCC request gets fulfilled, the EVs schedules are followed along with the technical constraints deriving from the EV batteries and EV chargers. The OptiV2G engine was based on [27], essentially being an expansion of it. Further elaboration regarding the OptiV2G algorithm is beyond the scope for this paper and it will be available to the readers as a future publication from the authors of CERTH.
As depicted in Figure 12, the OptiV2G engine indicated that the AME charger (id = 601518004603_1924001042) should discharge 10 kW of power in order to support the electricity grid. The SGIP forwards this set-point to the charger through OCPP. In Figure 13, the sequence of the communication between SGIP and EV charger is presented.
As soon as the AME charger has received the setpoint and the “Start Transaction” command, it starts absorbing power from the EV battery and feeding it into the grid. The SGIP is able to monitor all the interconnected EV chargers in real time. In Figure 14, all the electrical measurements coming from the AME charger are shown, where it is evident that the EV battery started to discharge approximately 9.56 kW. At the same time, the same indication is observed on the screen of the AME charger, where a Nissan Leaf is plugged in, Figure 15.
d.
E.ON Essen
At the E.ON lab in Essen, the V2G charger (AME charger) connected to a Nissan Leaf car was tested. To assess the OCPP 1.6 protocol the charger in the E.ON test lab could be reached via Internet.

3. Power Quality Management via EV Chargers

After passing through transmission and distribution systems, the produced electrical power is used by consumers in distribution grids. As a product, the energy consumers expect to receive the electricity based on the requirements defined in power quality standards like EN 50160 (some main indices are tabulated in Table 2). Although the intermittent behavior of RESs deteriorates the quality of the delivered power, the controllability of their connected inverters gives the DSOs some degree of freedom to operate these distributed generation units to contribute to the improvement of the power quality. Among the integrated RESs, however, EVs have more flexibility since they can be operated as both generation and consumption units. Under the framework of the MEISTER project, some case studies were considered to show how the smart exploitation of the EVs can improve some power quality indices. These studies are elaborated in the result section in this paper.

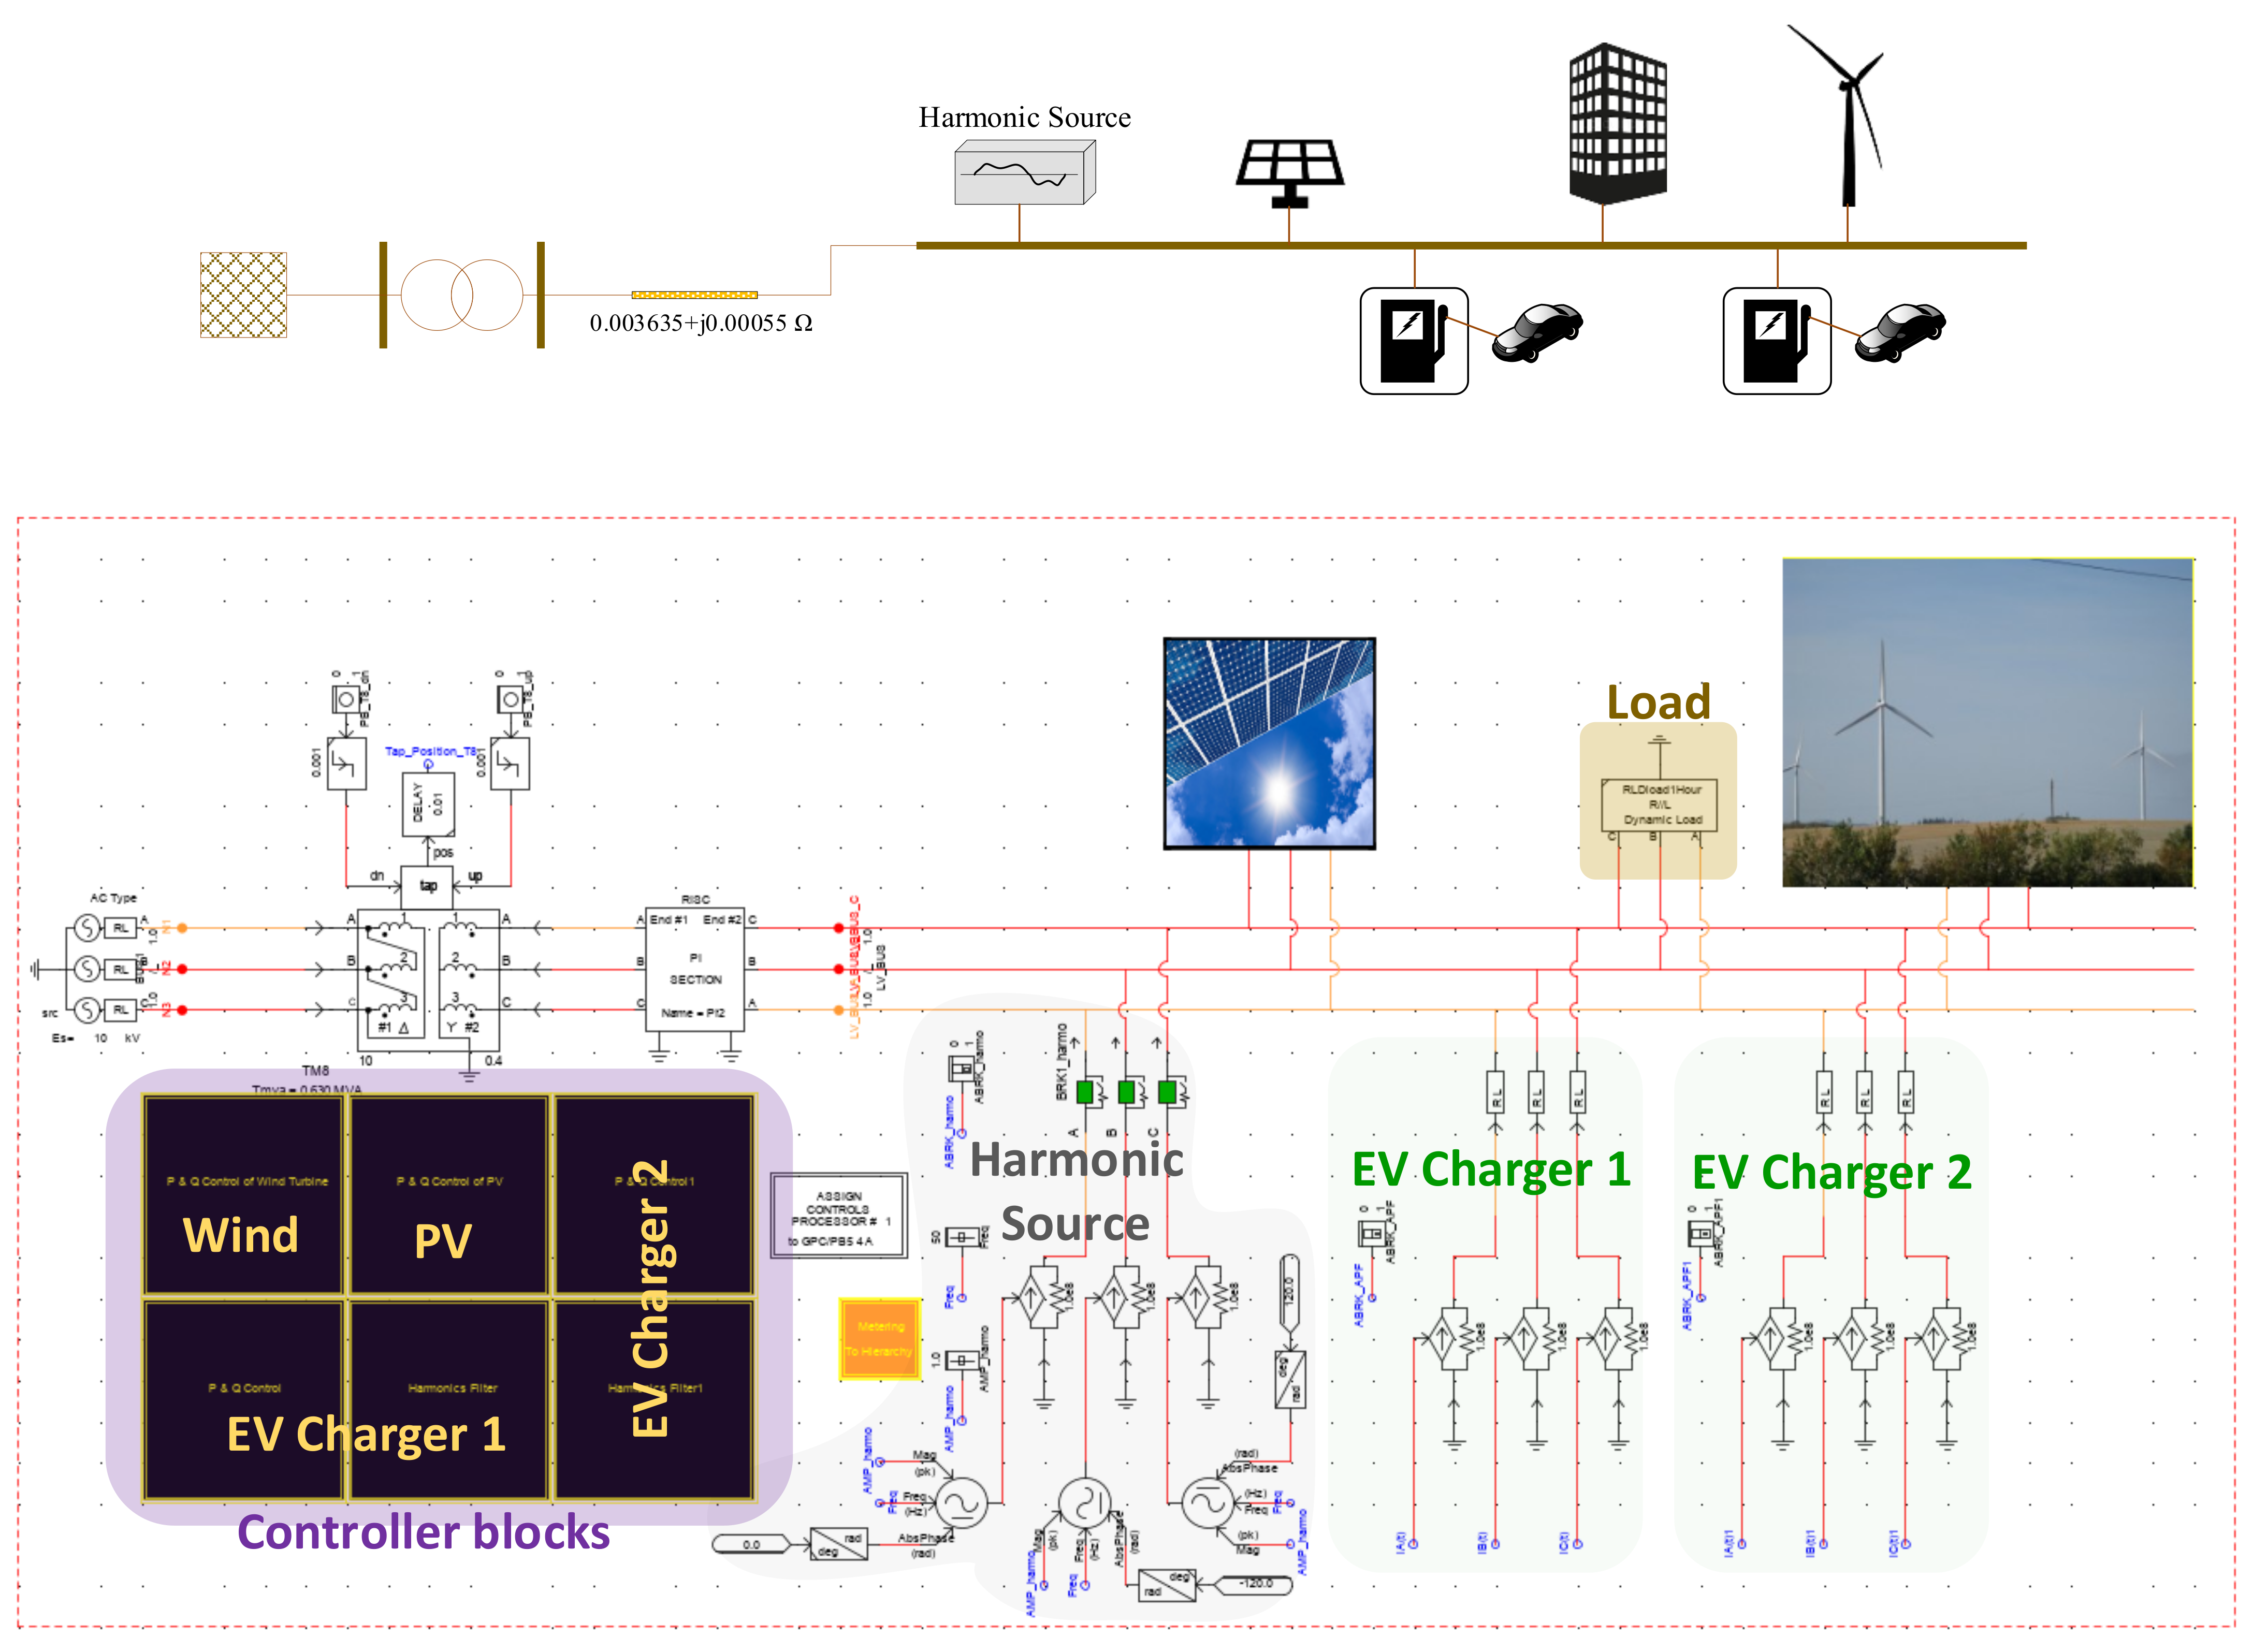
4. EV Charging Station and Grid Modelling

From a modelling point of view, the RSCAD model of a grid segment of Waterkant Berlin was implemented and shown here alongside its schematic in Figure 16.
The RSCAD is composed of two modelling steps. In the first step, the electrical model of the system is built with components from the RSCAD library in the draft file. In the second step, the required signals for the power system analysis are extracted in the runtime that can be visualized via plots and meters. In addition to this, there is the ability to control the values and the statuses of some system components in the runtime via switches, push buttons and sliders. The corresponding runtime environment for the MEISTER grid is shown in Figure 17. The control inputs include:
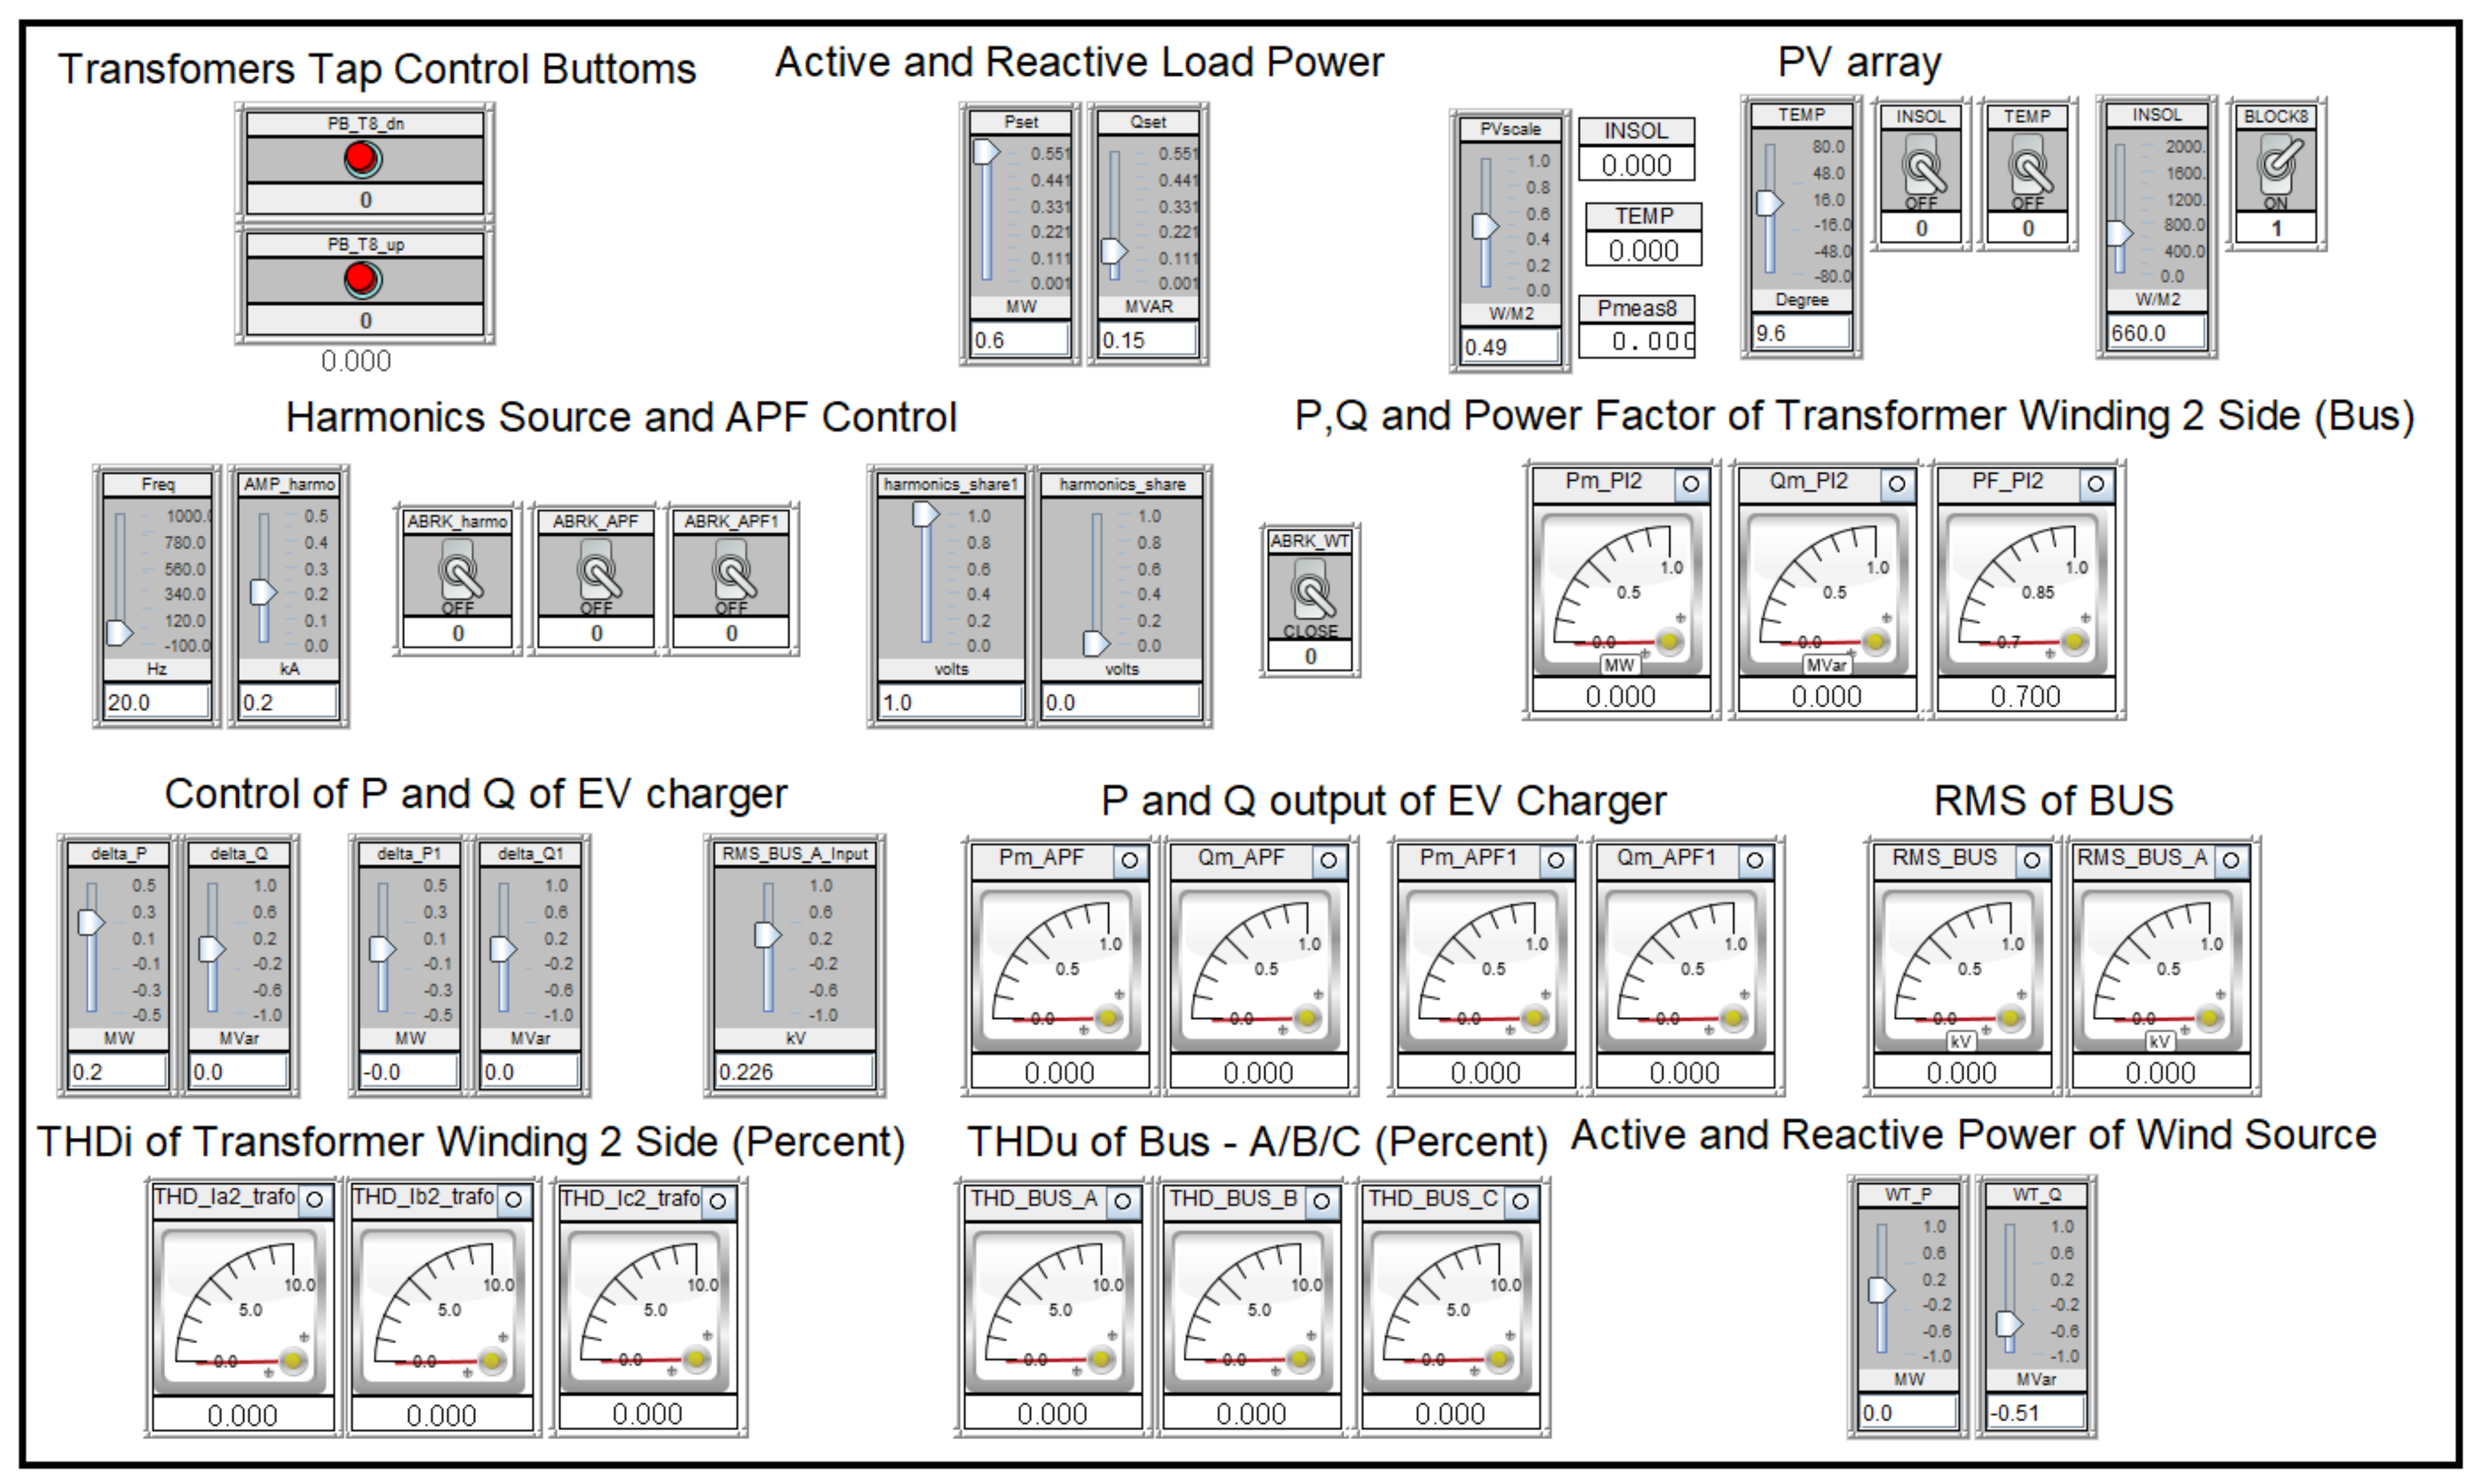
  • Transformer tap control: through the “up” and “down” button, the tap of the transformer can be adjusted accordingly.
  • Active and reactive load power: setting of the active and power consumption of the load.
  • PV array: switching on/off of the PV device. The control input values of the PV array are the temperature and the radiation, which are regulated separately.
  • Harmonics source and APF control: the three switches correspond to the harmonics source, and the filtering function of two EV chargers. The amplitude and frequency of the harmonic current injected by the harmonics source are controlled by the two sliders to the left. The contribution factors between 0 and 1 of the two EV chargers in the harmonics filtering are controlled by the two sliders to the right.
  • Control of P and Q of the wind turbine: the output active and reactive power of the wind turbine are regulated separately.
  • Control of P and Q of EV charger: the output active and reactive power of the EV chargers are regulated separately.
The inverters of the two EV chargers are modelled as three-phase controlled current sources, whose output currents are determined according to the targets of active and reactive power generation, and harmonics filtering. The concepts are explained as follows.
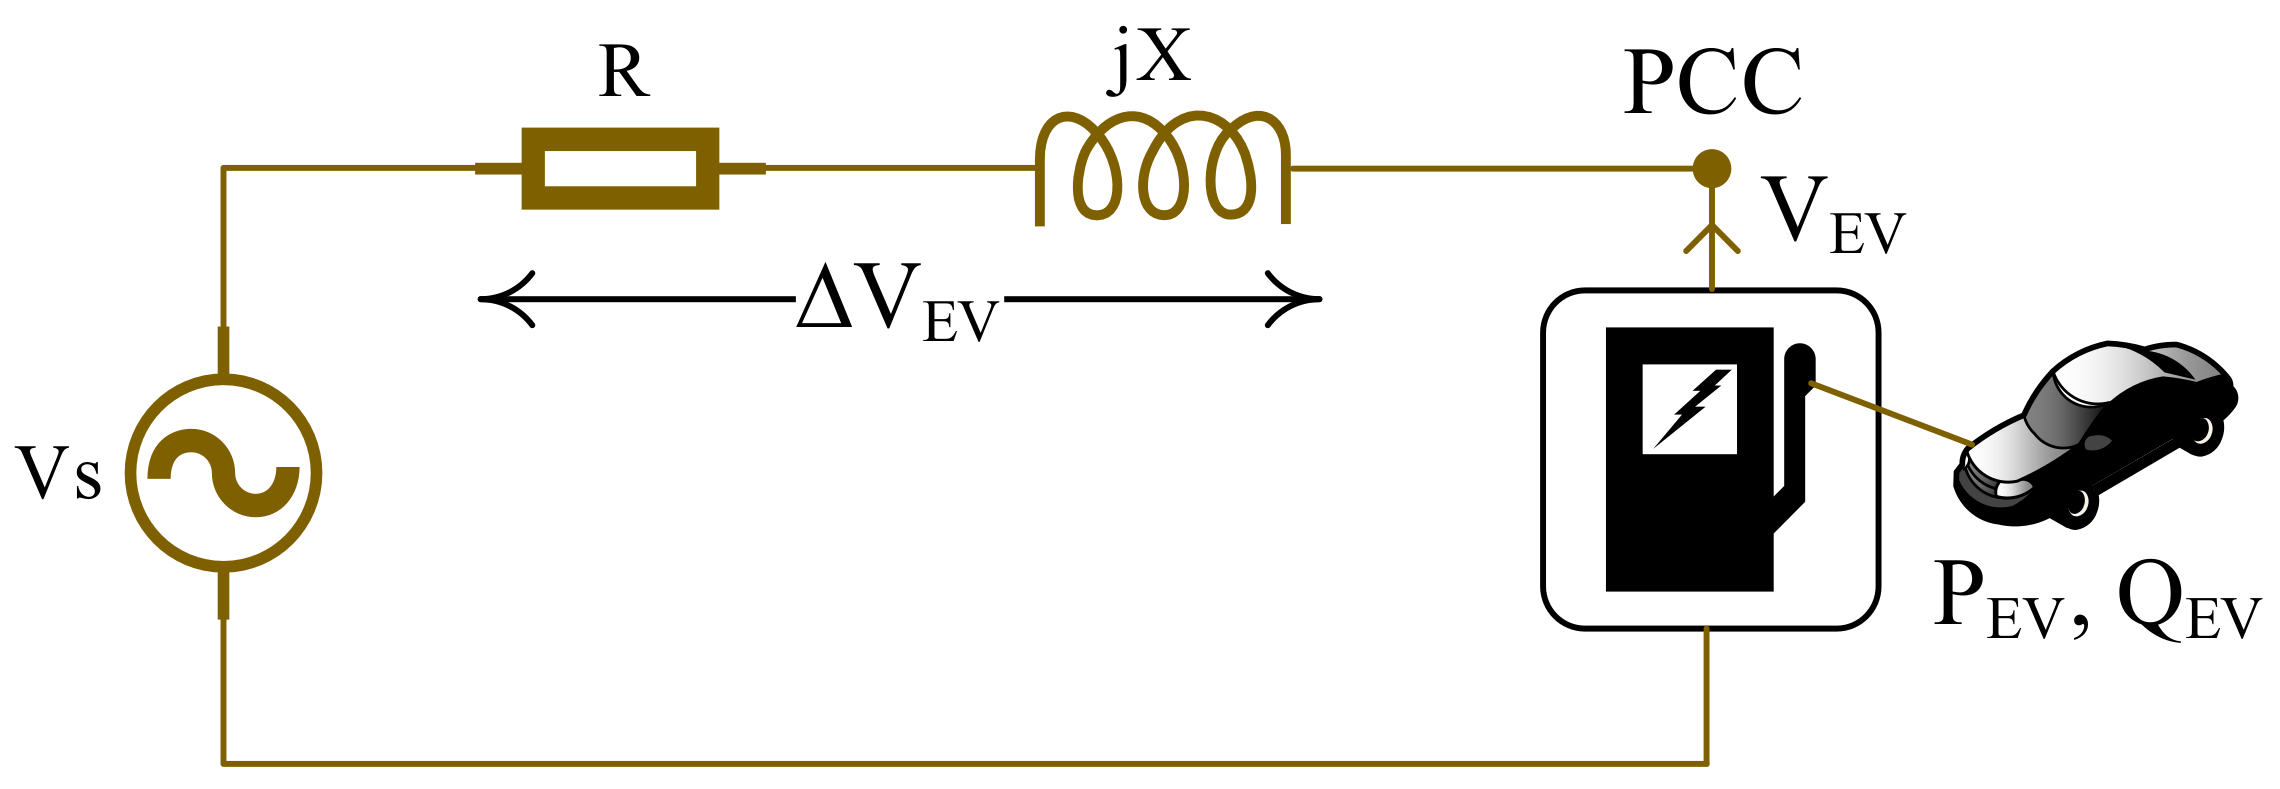
  • Active and reactive power generation: the currents (I_P) and (I_Q), which are components in the EV output currents to meet the demands of active and reactive power from EV the charger, are calculated separately based on the values of required active and reactive power, and the rated system voltage level.
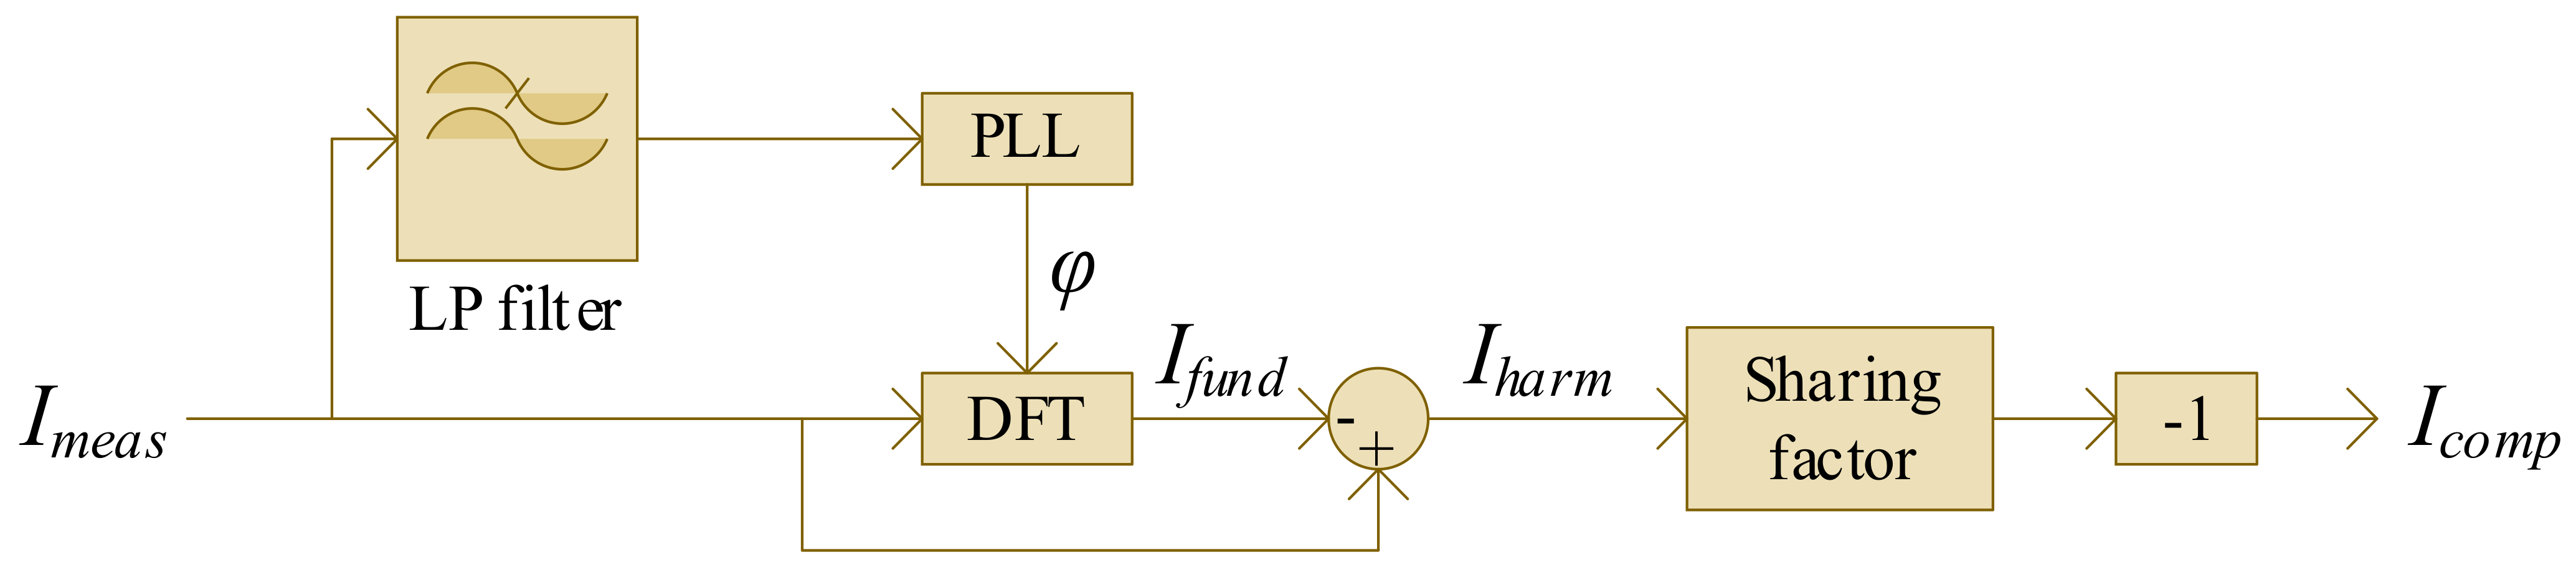
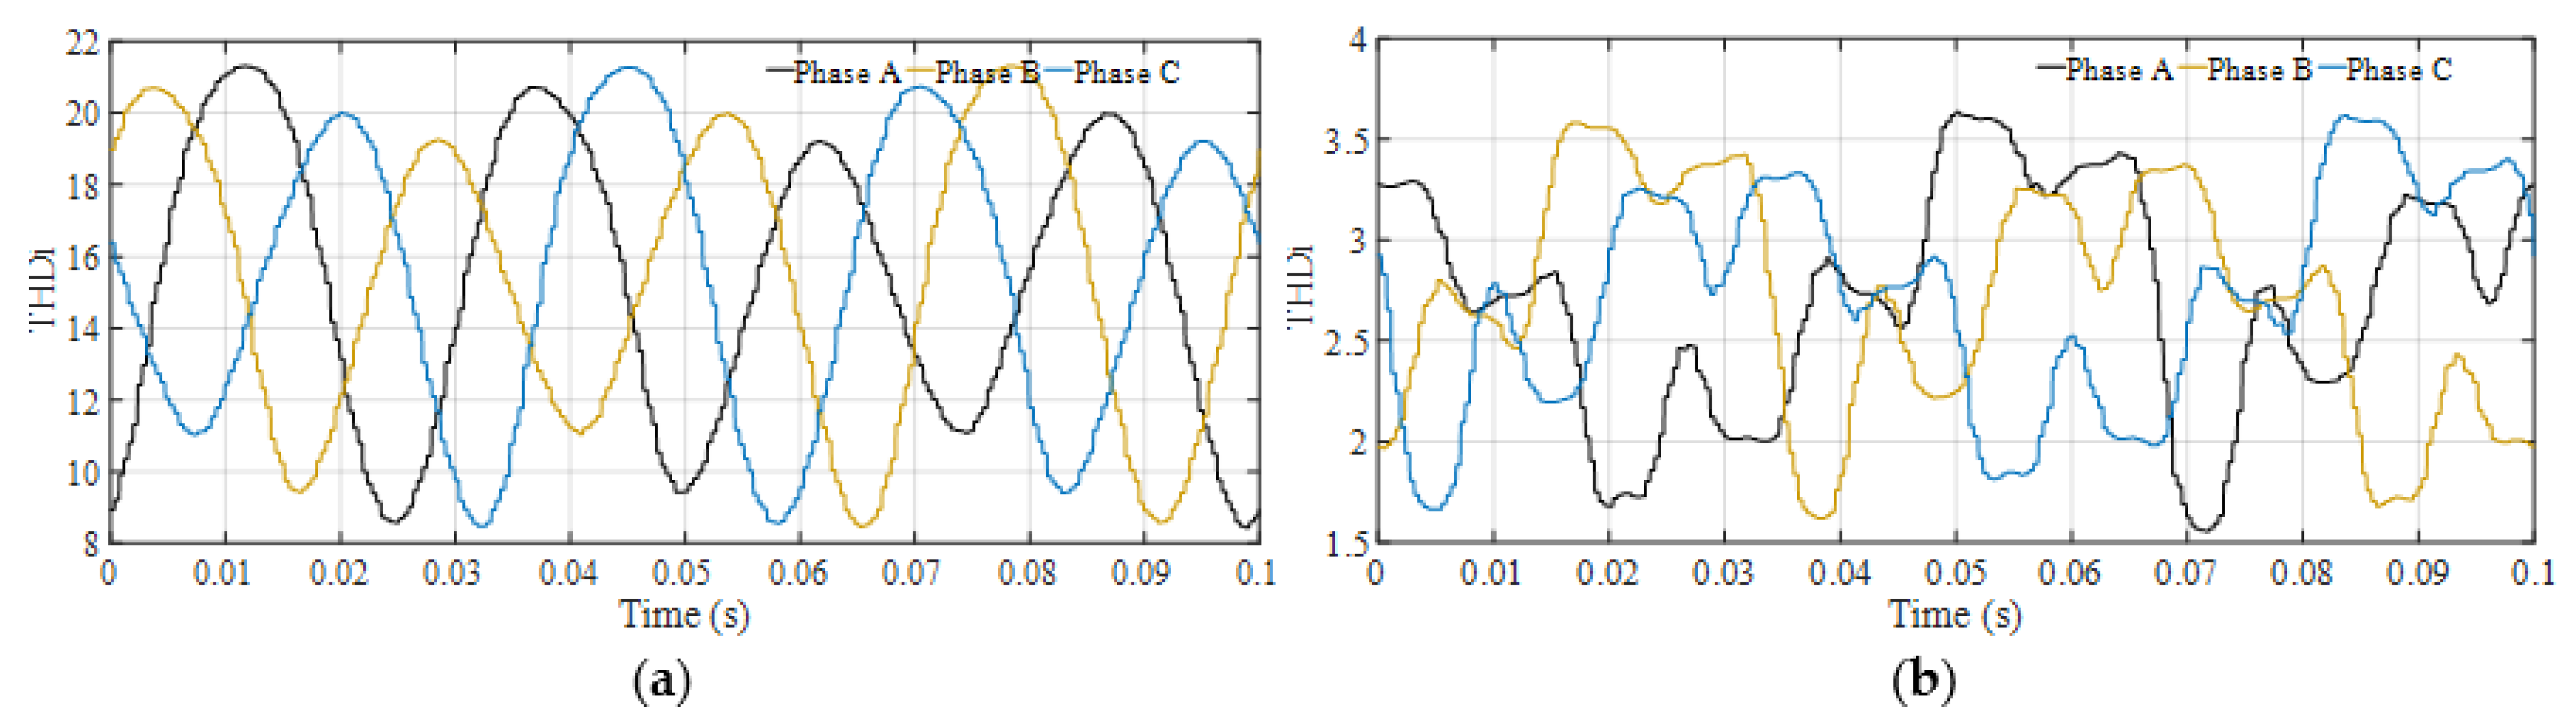
  • Harmonics filtering: Through eliminating the fundamental-frequency component in the currents measured at the branch of the harmonics source with discrete Fourier transform (DFT), the three-phase harmonics currents that are injected by the harmonics source into the system are estimated. Based on these values, the filtering current (I_filter) is calculated with consideration of a contribution ratio between the two EV chargers. Finally, all the three target values of currents, (I_P), (I_Q) and (I_filter), are summed to obtain the control input of each phase of the equivalent current sources of EV chargers.

5. Results

To assess the effectiveness of the proposed ICT platform for real-time control support of the power distribution grids based on the power quality criteria, some hardware/software-in-the-loop experiments via the MEISTER smart charging and storage platform (SCSP) were performed. As explained before, this platform provides the communication connections between the RTDS (where the grid is modeled), grid control center, smart grid integration platform (SGIP) and the EV batteries. It should be noted that, the impact of EVs on the grid was evaluated only based on the grid modelling in RTDS. However, the battery of the EV was charged and discharged in real-time based on the provided real-time RTDS measured values. The tests showed that the proposed MEISTER platform (described in Section 2) is able to satisfy real-time control of the EVs. The remaining part of this section is dedicated to EV battery flexibility services which can improve the power quality aspects in the mentioned distribution grid. In this respect, four main use case scenarios considering power quality aspects were taken into account as follows and the obtained results are available at [40]:
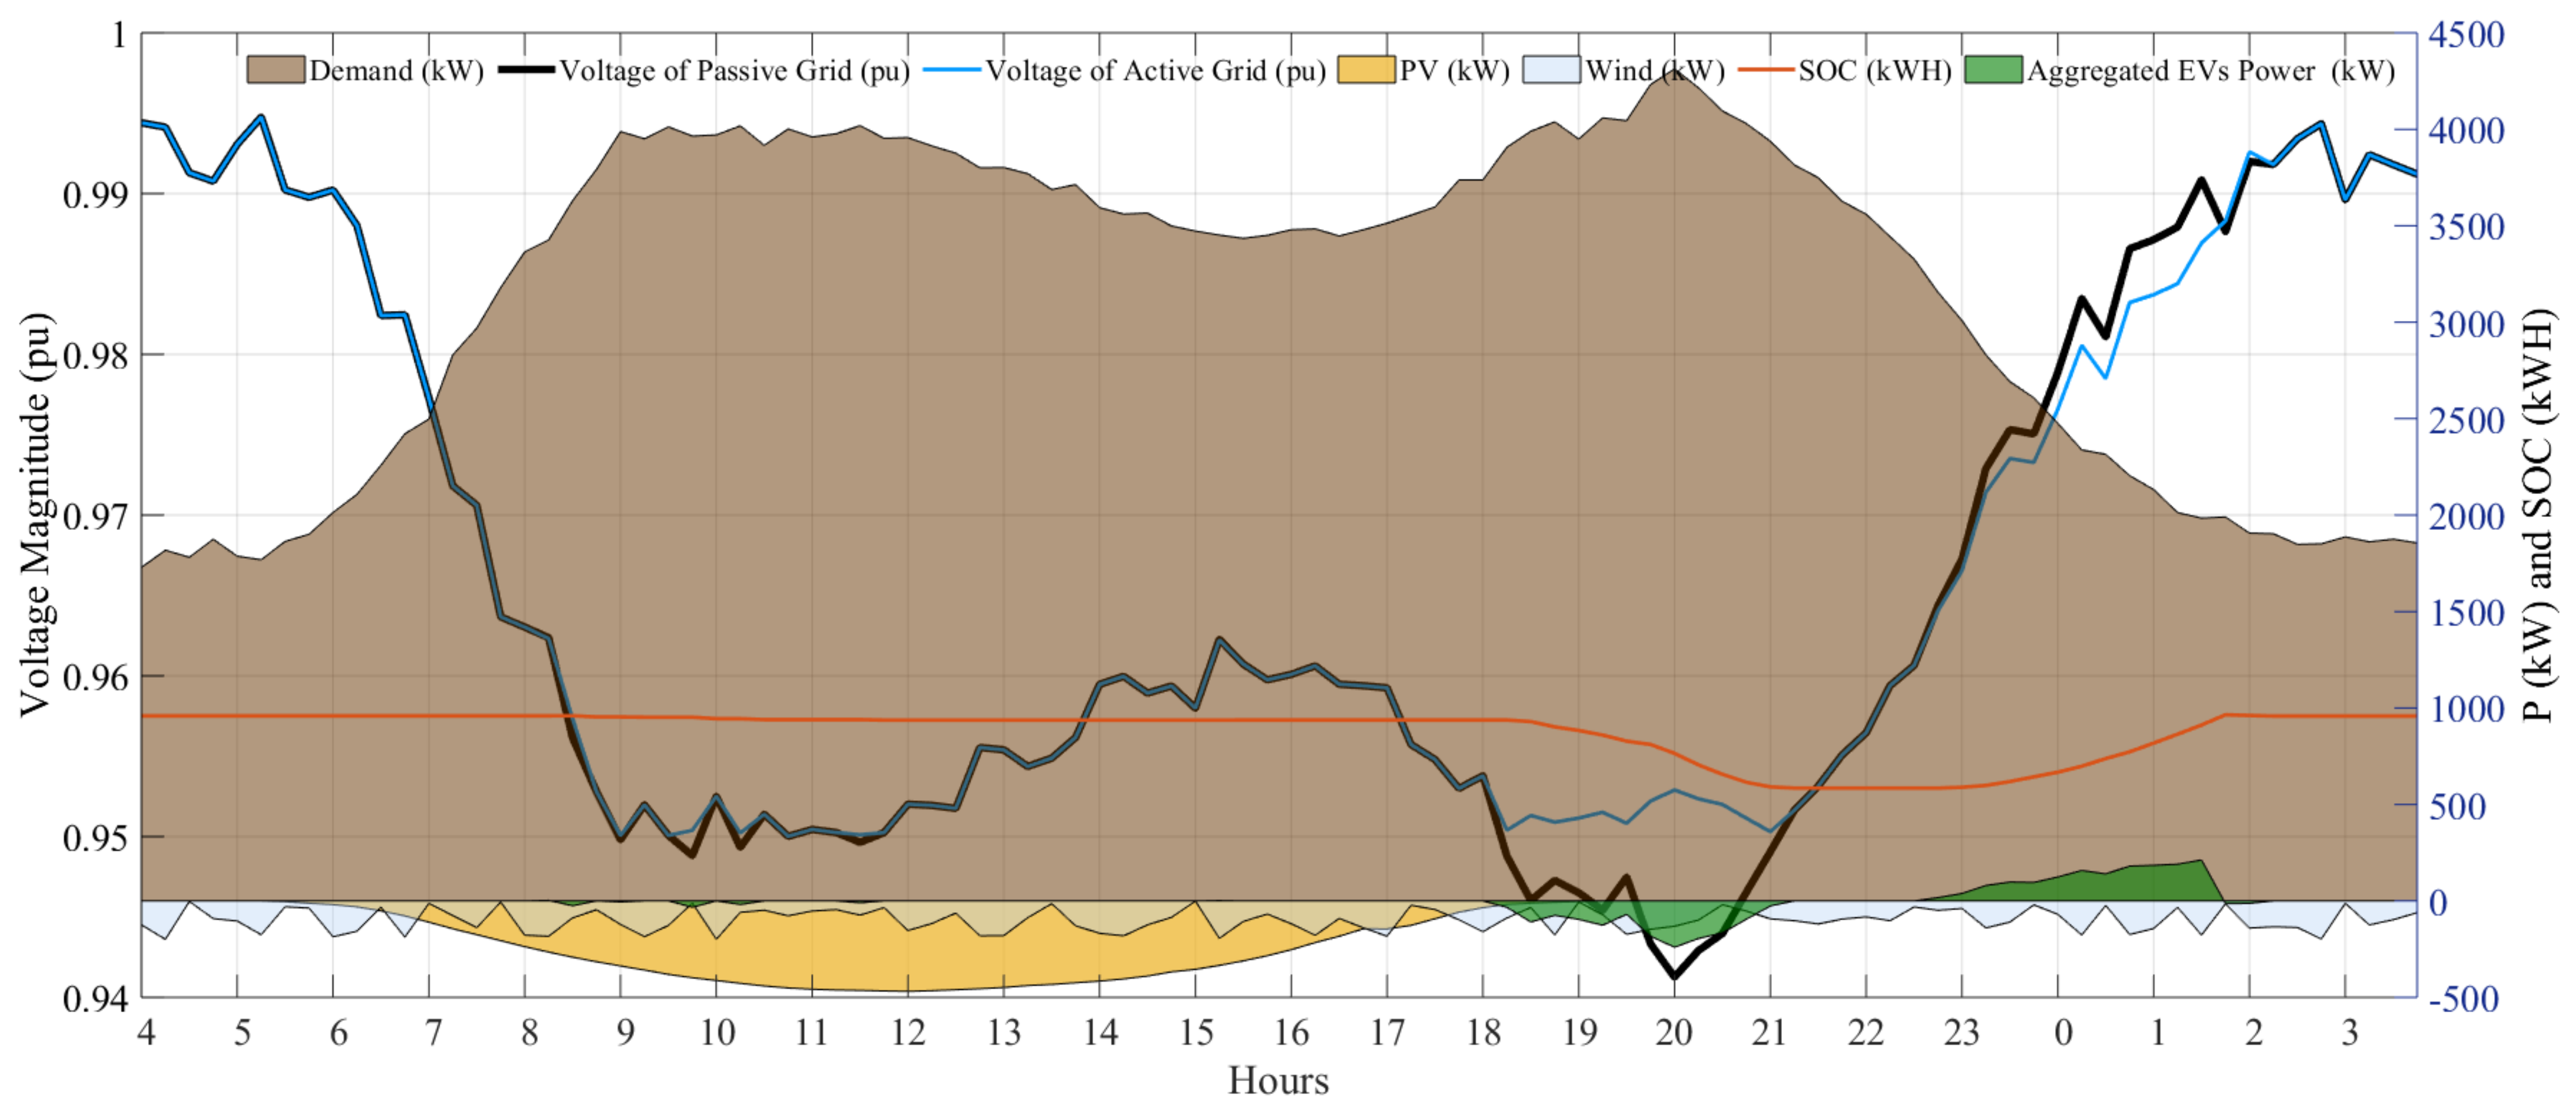
  • Use Case 1: High Load Reduction
In the active distribution grids, the DSO can use EVs as one of the possible flexible measures to address some grid issues like voltage drop and overloading condition. The load reduction is necessary to reduce wear of the electrical components like lines, transformers and power electronic devices in the distribution grids. In spite of the fact that EVs will be by far the largest consumers of energy in distribution grids, their charging and discharging process can be optimally controlled (via optimal power flow algorithms, voltage droop control methods and so on) so that they can even support the grid operators in high-load conditions. Considering the load profile of a typical summer day (shown in Figure 18), as an example, the highest load demand appears in the evening which leads to a high voltage drop. However, by optimally controlling the EVs, it is possible to inject power from EVs batteries into the grid to support the voltage and subsidies the loading of the secondary transformers.
This paper has not focused on the EV battery control approaches. However, since the main objective of this paper is operating the EVs battery in real-time via the MEISTER ICT platform, some snapshots of current and voltage signals of primary and secondary sides of the secondary substation are shown here (Figure 19 and Figure 20) based on the scenarios tabulated in the Table 3.
Table 3 shows the adjusted active power and the power factor of load, wind, PV and the EV systems for two scenarios. It should be noted that the aggregated power of 20 EVs is indicated in the table. Each Nissan EV (with battery capacity of 60 kWh) is connected to the grid via a 10 kW CHAdeMO charger. All the set points are the same in these two scenarios except the active power value of the aggregated EVs. Considering that the rating of the transformer is 640 kVA, a high loading condition was studied based on these scenarios. Figure 19 and Figure 20 show the measured voltage and the transformer loading in the primary and secondary sides of the transformer. As can be seen, transformer loading has been subsided in scenario 2 since some portion of load is locally supplied by the EV’s battery. In fact, this case study reveals the fact that the DSOs can locally exploit the EVs so that they can manage the system loading in the high-load conditions. Although the realtime snapshot of the transformer current and voltage in Figure 19 and Figure 20 are captured for a period of 1 s, scenario 2 could be considered as a flexible measure to be applied in high loading hours. Based on the load profile shown in Figure 18, as an example, the system operator can discharge the EVs between 18:00 and 21:00 to reduce the peak load. Afterwards, the EVs can be charged between 22:30 and 01:45 when the load is low. In addition to the system loading management, the injected active power supports the voltage. Additionally, this flexibility can be used to support the DSOs to deliver power based on the power quality standards like EN 50160. Based on this standard, the delivered voltage should be confined in the range of ±10% of the system nominal voltage. The impact of this kind of support can be seen in Figure 18 when the aggregate injected active power from EVs boosts the voltage from 0.94 to 0.95 pu.
In comparison with the transmission systems where the voltage support is mostly managed by the reactive power, the active power would be the main voltage support variable in distribution grids. This difference originates from the nature of the distribution grids where the power lines are more resistive R > X compared to the transmisstion grids where the transmission lines are more inductive X > R . In this respect, the Thévenin equivalent circuit at the point of common coupling (PCC) of the EV system is shown in Figure 21.
According to [41], the impact of the EV power injection on the system voltage is described in (1):
Δ V E V = R · P E V + X · Q E V V s
Furthermore, both active and reactive power injections can contribute to controlling the system voltage. However, the impact of active power would be more than the reactive power as the equivalent system resistance is bigger than the system equivalent reactance in distribution grids. In this respect, the voltage at the primary and the secondary sides of the transformer has increased (as shown in Figure 19 and Figure 20, respectively) due to the injected EVs’ active power in scenario 2.
  • Use Case 2: Local RES Consumption
Active distribution systems include different RESs. These distributed generation units may simultaneously inject power into the distribution systems. Consequently, there might be a huge amount of reversed power flow exceeding the demand. Thus, the surplus of produced energy is transported to the upper voltage level (e.g., from low voltage to medium-voltage grid side). This flow of power may cause malfunctioning of the protection system and, accordingly, deenergizing of a part of the grid. Encountering an unwanted reversed power, moreover, the system operator may resort to redispatch the planned energy which is costly. To tackle these issues, however, the system operator can use the EVs’ flexibility services. Detecting a high amount of reversed power flow in a portion of the network, the DSO can exploit a group of the available EVs to be operated in the charging mode. This in turn partially or totally removes the net reversed power flow. To see the ability of this flexible measure, some experiments were performed based on four tabulated scenarios in Table 4.
The first two scenarios are related to low loading conditions when it is more possible to have the reversed power flow to the upper voltage level. However, there are high loading conditions in the last two scenarios. It should be noted that the aggregated powers of 10 and 20 Nissan EVs (those are connected to the grid via a 10 kW CHAdeMO charger) are respectively indicated in Table 4 for scenario 2 (100 kW) and scenario 4 (200 kW).
By applying the defined setpoints in scenario 1 and scenario 2, the changes of the current and the voltage of the transformer at both primary and secondary sides are shown in Figure 22 and Figure 23. The injected power from both wind and solar systems is 350 kW in the first and the second scenarios. Although this amount can feed the 100-kW load demand in the both scenarios, the observed reversed power (assuming the lossless grid) at the transformer is decreased from 250 (350–100 kW (load)) to 150 kW (350–100 kW (load)–100 kW (EV)) in the second scenario by utilizing the EV system operating in charging mode.
In this way, a portion of the injection power is consumed locally leading to a decrease of the reversed current and, consequently, the decrease of voltage at transformer sides (as shown in Figure 22 and Figure 23). Thus, the system is operated in a safer way. In contrast to the explained low loading condition, this flexibility measure is not suitable in the high loading condition. As shown in Figure 24 and Figure 25, the transformer loading increases and the voltage decreases when the EV system operates in the charging mode. Considering the 600 kW loads in scenario 3 and scenario 4, all the power from RESs (350 kW) is locally consumed and there is no reversed power at the substation. Moreover, by charging the battery with 200 kW in scenario 4, more power is drawn from the transformer sides.
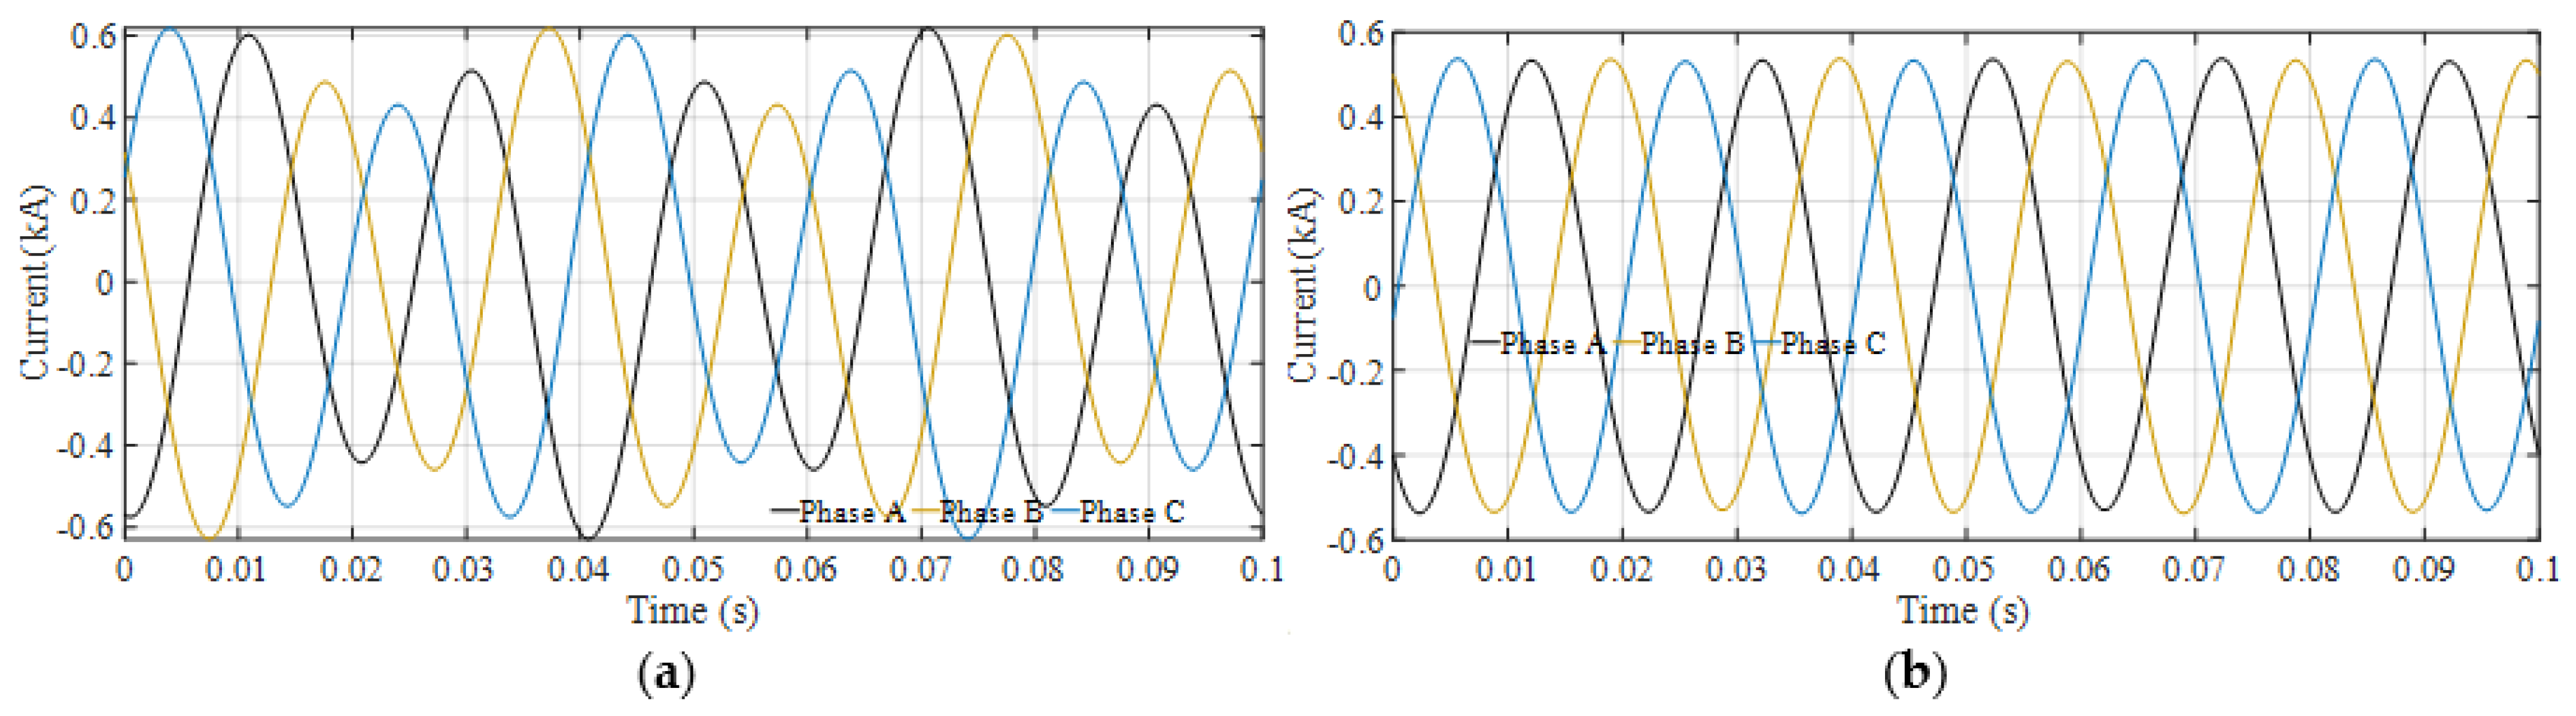
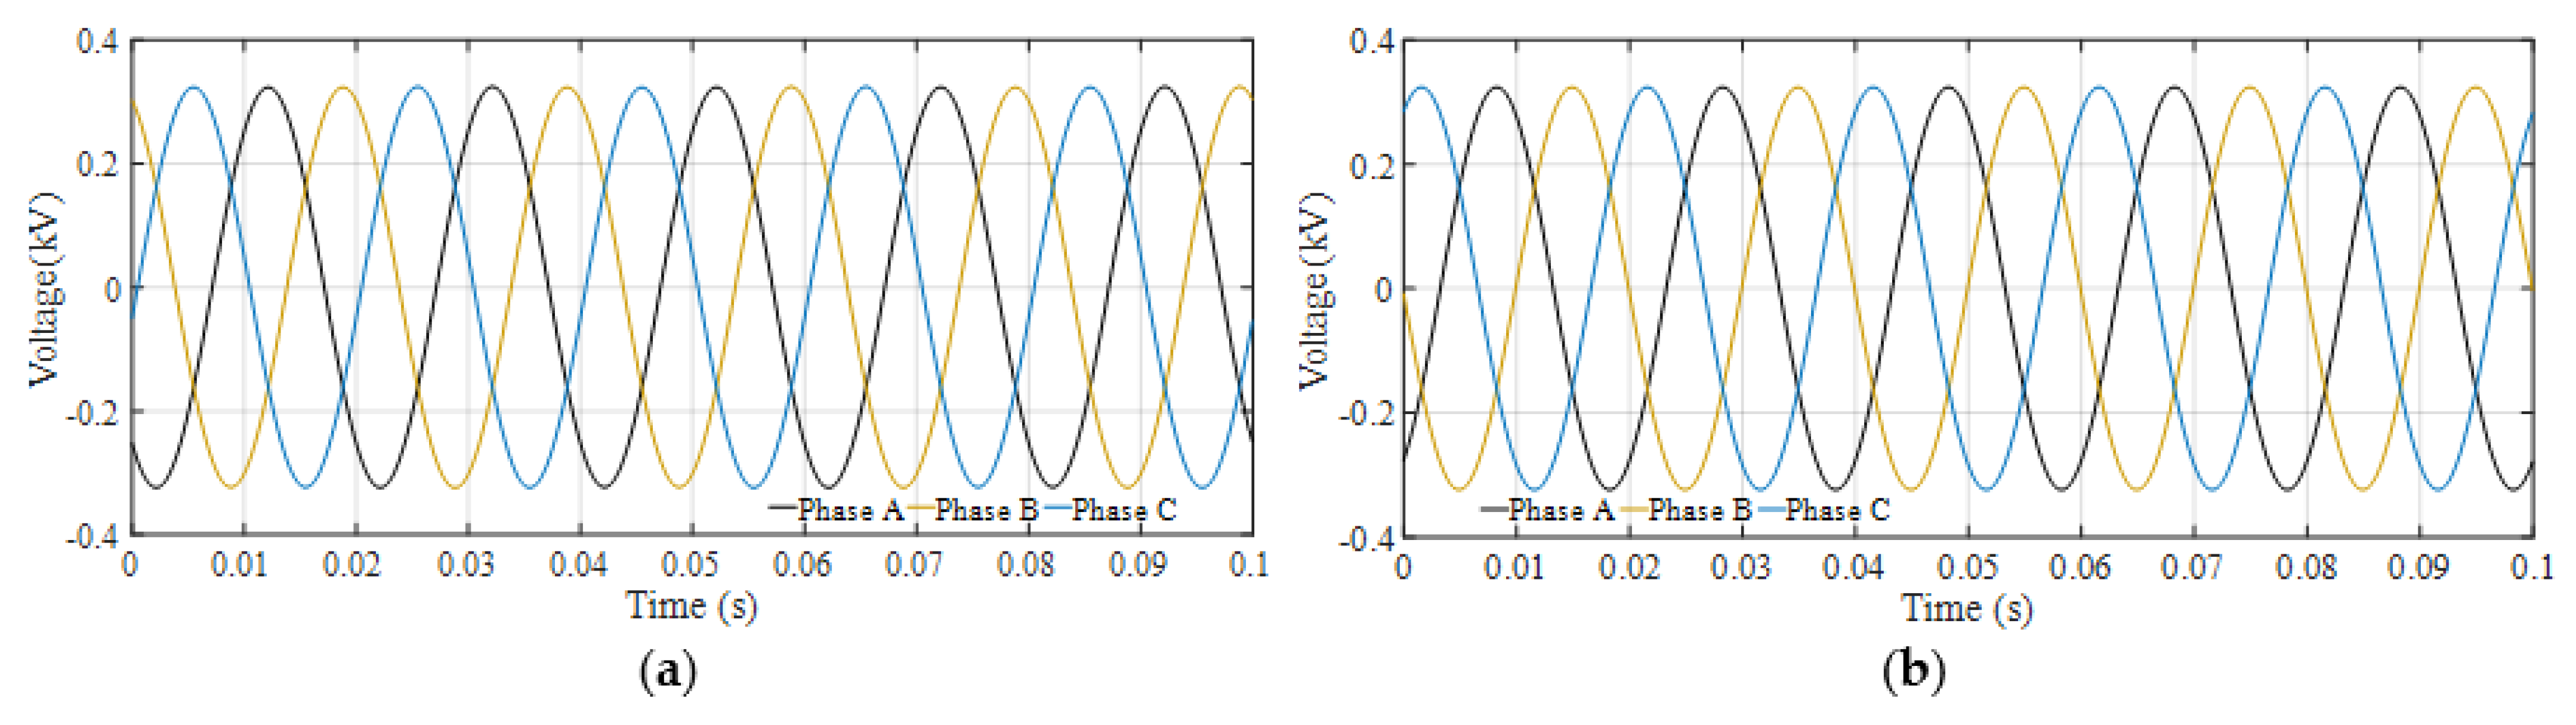
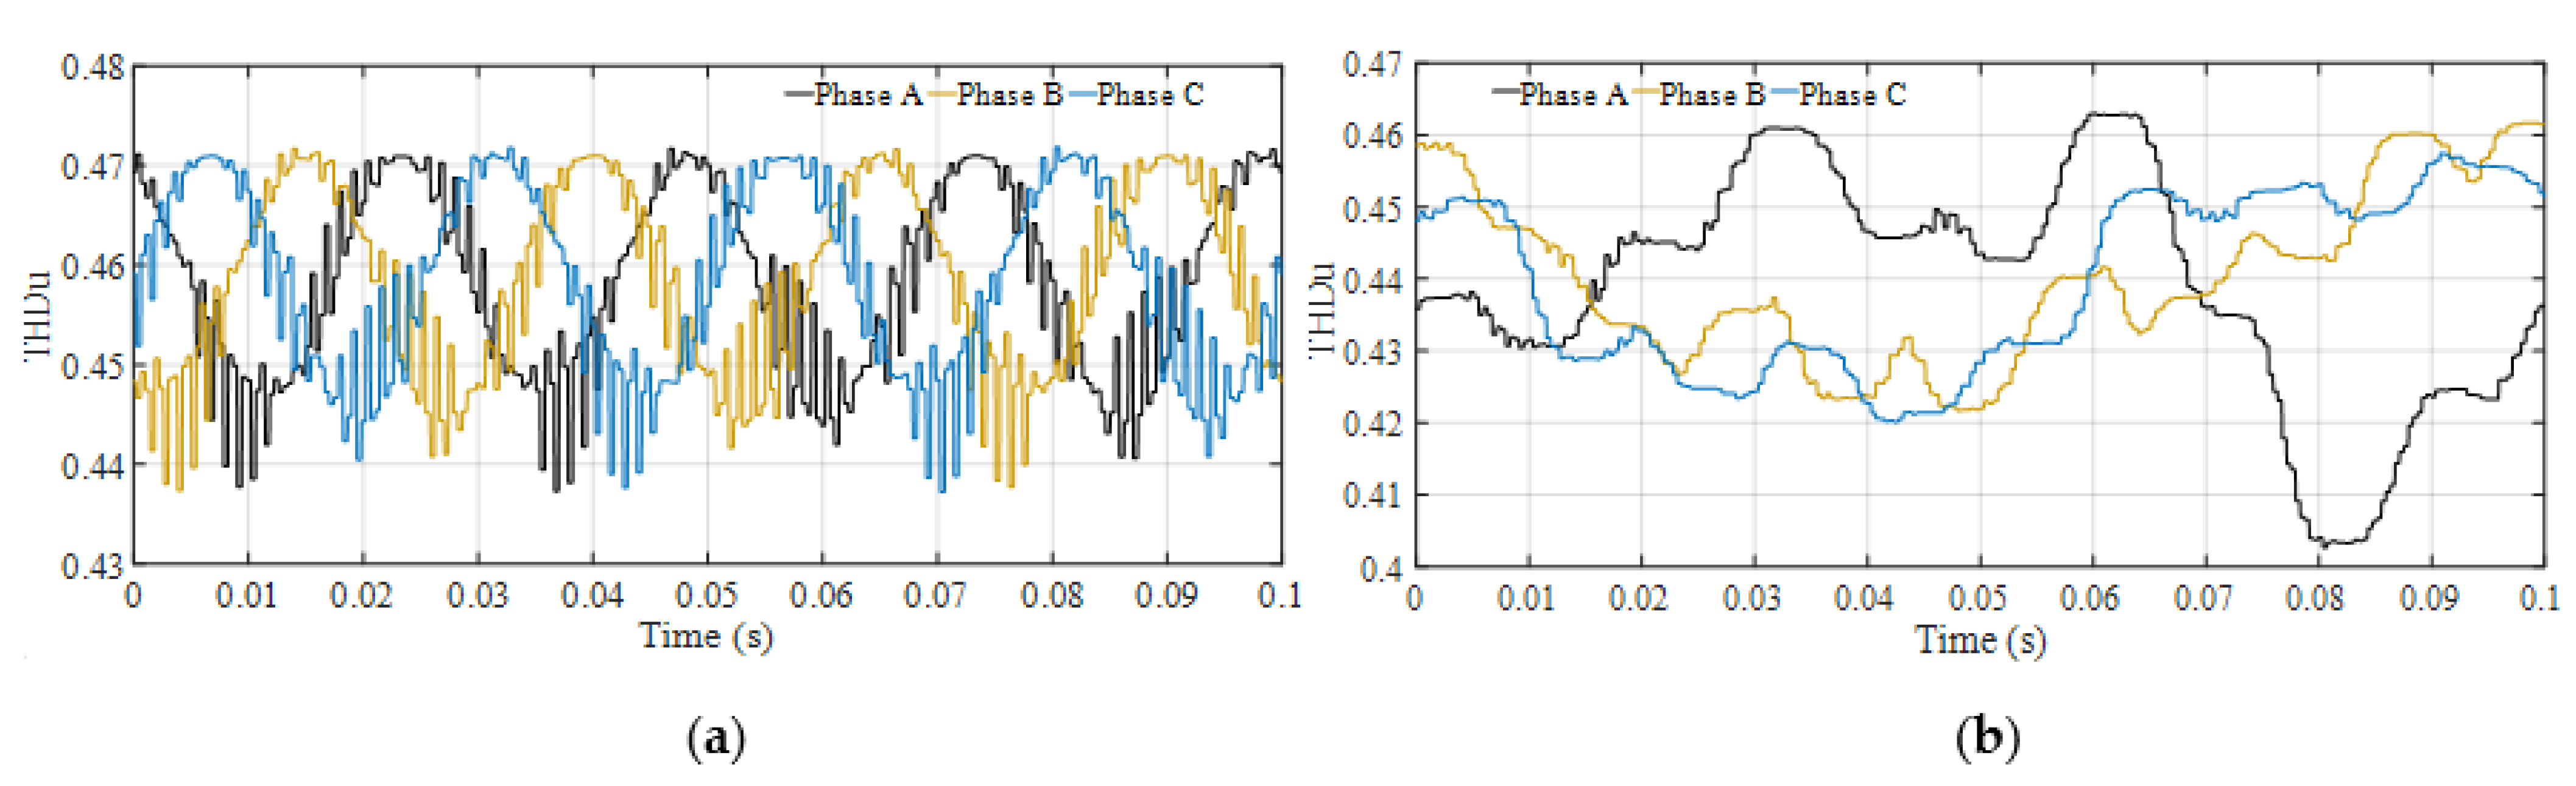
  • Use Case 3: Filtering of Harmonics
Widespread application of power electronic devices (RES grid interfaces) and the presence of non-linear loads (computers, televisions, variable speed drives, rectifiers, arc furnaces, fluorescent lamps, starters electronics, etc.), the use of ferromagnetic materials in electrical machines, switching operations in substations and in general the operation of switching equipment, causes the emergence of harmonics in the distribution grids. As harmonics deform the 50 Hz sinusoidal waves, their existence causes problems such as increasing active power loss, overloads in capacitors, measurement errors, malfunction protection, insulation damage, deterioration of dielectrics and decrease in the life of equipment [42,43]. Therefore, it is crucial to detect the system harmonics and remove it in the power grids. In this way, different approaches based on the Fourier transform algorithm have been introduced in research papers [44,45,46] to detect the harmonic orders. Observing the harmonics, the system operator should filter the harmonic frequencies out. For this purpose, both passive and active filters can be utilized. However, as another flexible measure, EVs can be operated to emulate the behavior of the active filters. In this sense, the inverter of the EV charger behaves as an active power filter, which could actively compensate the harmonics in the system through injecting current components of different frequencies. These injected high-frequency current components are determined through the frequency analysis of line current signals. The process of the harmonics filtering function is illustrated in Figure 26.
As shown in the flow chart, the measurement current I meas is first processed with a low-pass (LP) filter and a phase lock loop (PLL) to obtain the phase angle φ. With the obtained φ, a discrete Fourier transform (DFT) is performed on I meas for each phase, which generates the current components in wide frequency spectra from 0 Hz to the high-frequency domain. Through calculating the differential between the current component of fundamental frequency (50 Hz) I fund and I meas , the harmonic’s current components I harm in the measurement currents are obtained. To filter harmonic currents in the system with multiple EV chargers, a sharing factor is considered to determine the output of each EV charger. With this factor, the compensating current, I comp , can be determined. To see the effectiveness of this approach, the following case scenarios (in Table 5) are simulated with RTDS. The aggregated power of 10 Nissan EVs (which are connected to the grid via a 10 kW CHAdeMO charger) is indicated for both EV stations in Table 5.
In the first scenario, a low load is supplied while an artificial harmonic source perturbs the grid by a harmonic with a frequency of 20 Hz. Consequently, the current signals are not pure sinusoidal signals of the 50 Hz as shown in Figure 27a. To compensate for this harmonic, EV charger 1 and EV charger 2 are operated to charge and discharge the power of 100 kW, respectively. However, this charging/discharging process is controlled in the way that charger 2 injects an equal and opposite harmonic to eliminate the imposed grid harmonic. So, as can be seen in Figure 27b, the obtained current signals are purely 50 Hz sinusoidal signals.
Accordingly, the total harmonic distortion of the current (THDi) has decreased from nearly 22% in scenario 1 to the less than 4% in scenario 2 as shown in Figure 28a,b, respectively. To put it differently, this smart exploitation of the EVs could reduce the THDi to a value lower than 8% defined in EN 50160 standard.
It should be noted that the voltage signals are not deformed by this harmonic source as shown in Figure 29. The total harmonic distortion of the voltage (THDu) for these two scenarios is shown in Figure 30. As can be seen, the THDu values are lower than 8%, which is satisfactory as per EN 50160.
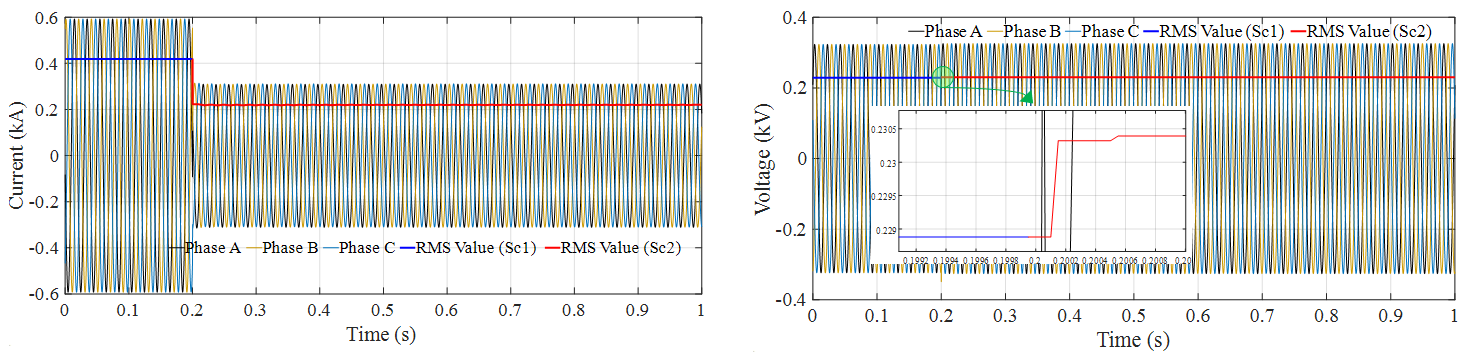
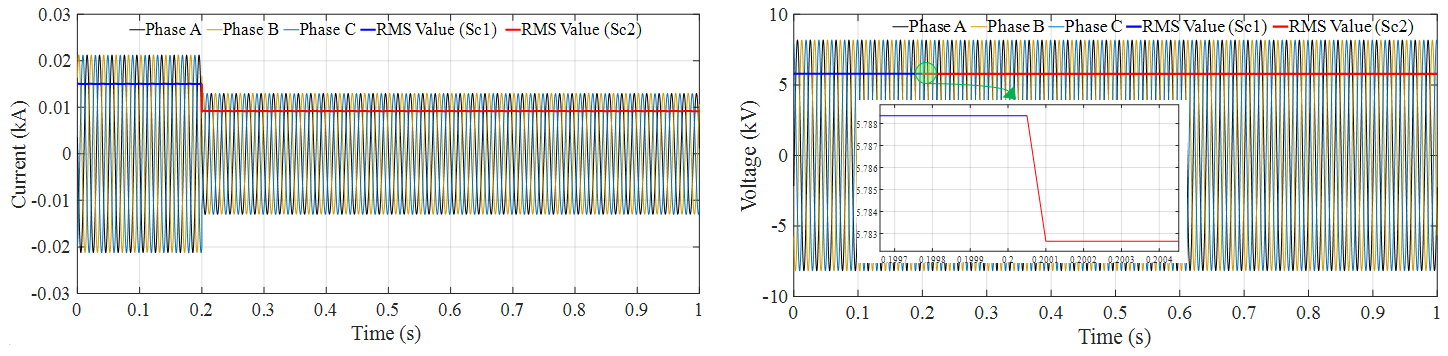
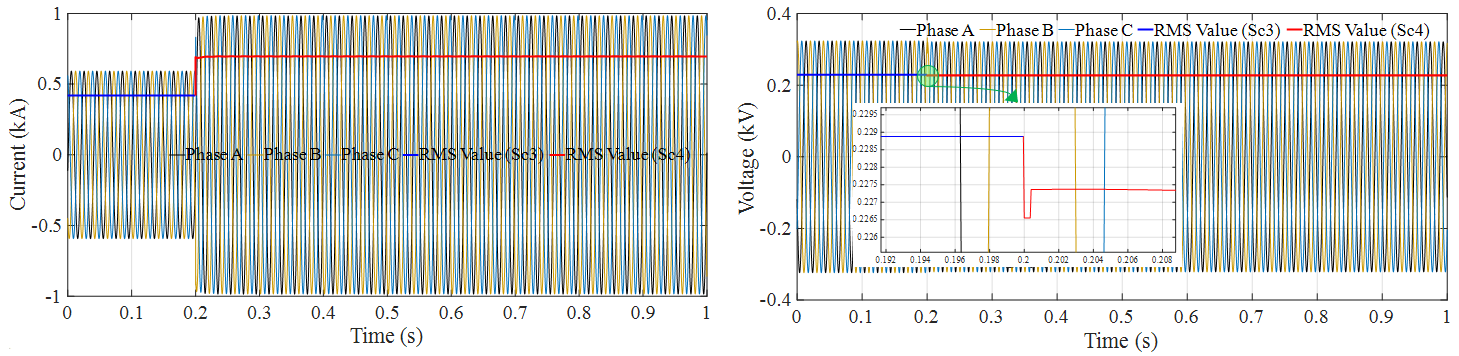
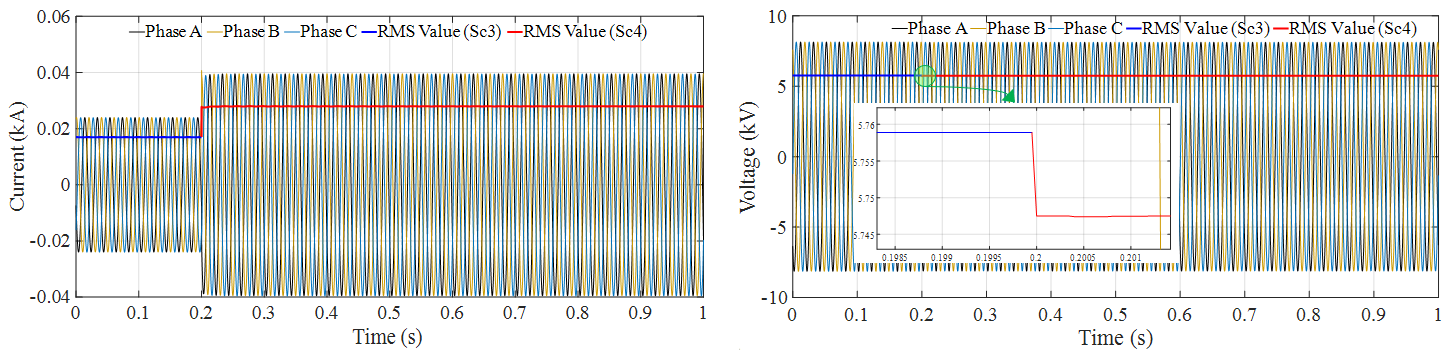
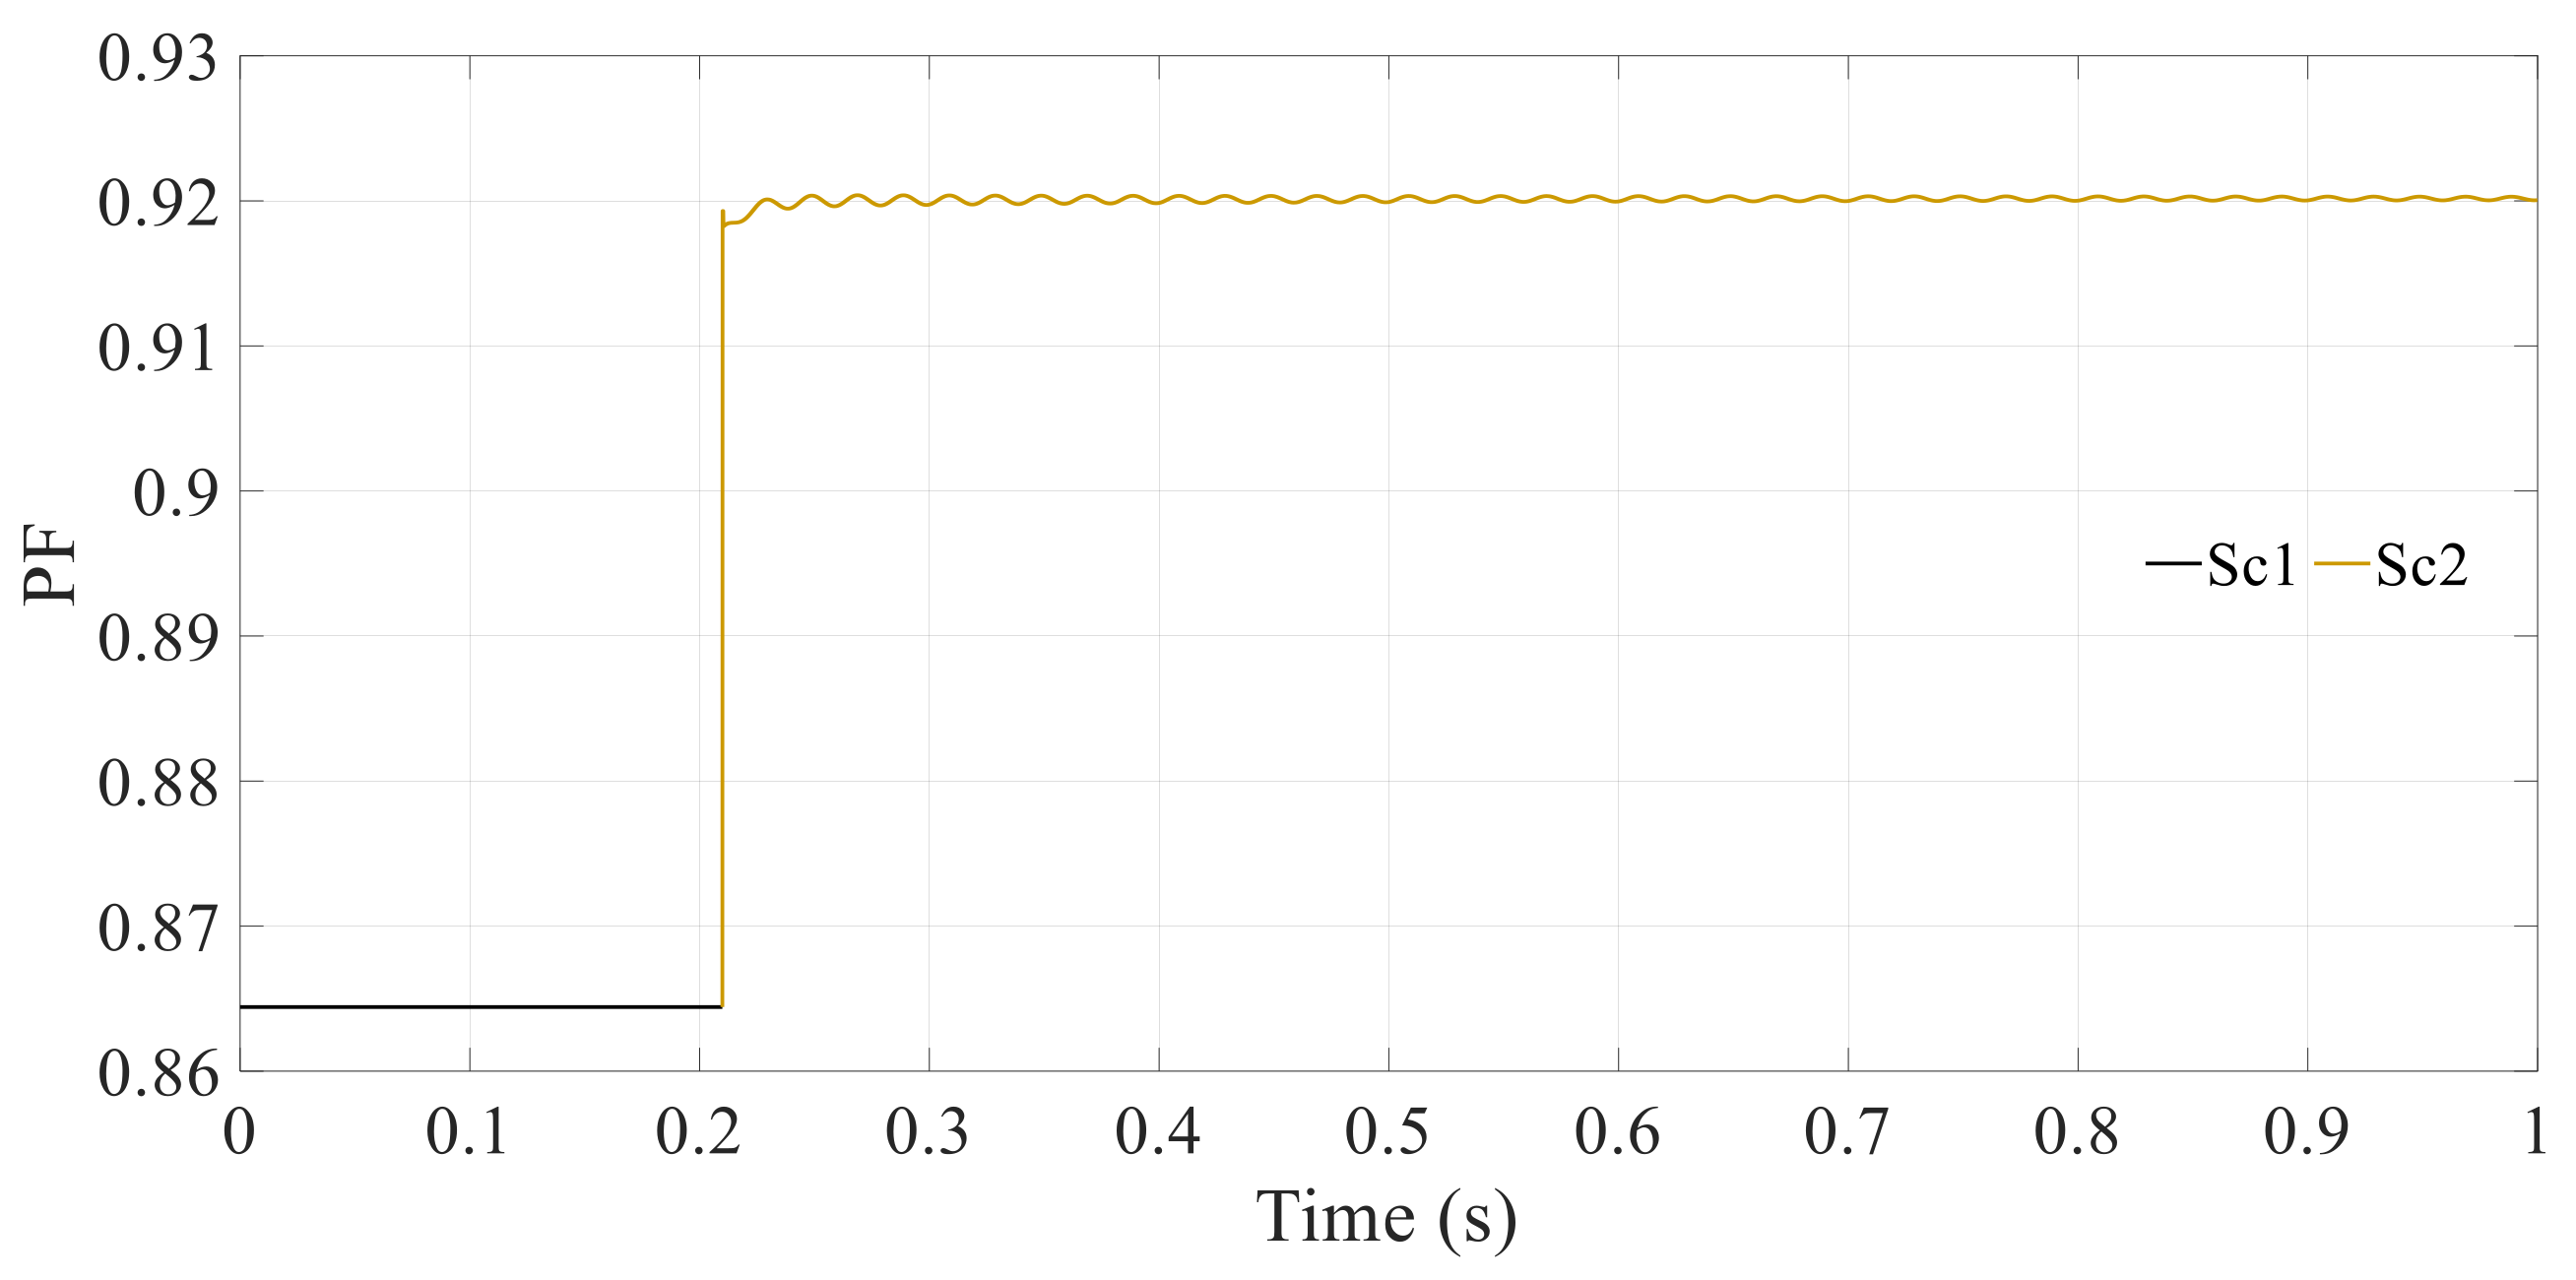
  • Use case 4: Reactive Power Injection
To regulate the reactive power based on grid-codes requirements, the EVs can be exploited to improve the power factor of the system. For example, according to the VDE 4105 code [47], it is required that the inverters are capable of feeding in with a displacement up to 0.95 leading or lagging and if the plant power exceeds 13.8 kVA, a displacement up to 0.90 must be supported. In this respect, the following case scenarios in Table 6 were tested in RTDS. Based on the simulation results shown in Figure 31, the system power factor was about 0.8 when the set points were adjusted based on scenario 1. However, by consuming the 200 kVA reactive power via the EV system, the power factor increased from 0.8 to 0.9 and satisfied the VDE 4105 code.

6. Conclusions

This paper explained a smart grid solution for exploiting the EVs as new active players in the active distribution grids. This solution includes both the power and the ICT networks which are the two main components to be considered in the operation of the smart grids. In this context, this solution aligns with CEN/CENELEC SGAM reference architecture. Additionally, in this respect, the component, the communication, the information and the function layers are taken into account in the scope of this work. The ICT platform was implemented based on different communication protocols: IEC 61850, IEC 60870-5-104, OCPP and CHAdeMO. This platform transmits the control and metering data in real-time over wide geographical areas among four different test sites. Although the data could be transmitted in less than a second via the implemented ICT, the time resolution of 15 min is the required operating time so that the SGIP can provide the EV resources with optimal operation set-points. In addition to the proposed ICT, this paper showed how the flexibility services of the EV resources can support the safe operation of the active distribution grids. In this respect, four use case scenarios were considered in which the EVs could improve the power quality of the grid in terms of the voltage magnitude and the total harmonic distortion in accordance with the EN 50160 standard. Moreover, it was seen that the EVs can be used to manage the loading capacity of the grid assets and control the system power factor as desired. Therefore, as a potential flexible measure, EVs can play a key role in the operation of the active distribution grids.

Author Contributions

All co-authors contributed equally from the following perspectives: conceptualization, methodology, software, validation and formal analysis, investigation, resources, data curation, writing—original draft preparation, writing—review and editing, visualization, supervision, project administration and funding acquisition. All authors have read and agreed to the published version of the manuscript.

Funding

This work is part of the MEISTER project that has received funding from the European Union’s Horizon 2020 research and innovation programme under grant agreement No 769052.

Institutional Review Board Statement

Not applicable.

Informed Consent Statement

Not applicable.

Data Availability Statement

Not applicable.

Conflicts of Interest

The authors declare no conflict of interest.

References

  1. Wang, Y.; Ding, W.; Huang, L.; Wei, Z.; Liu, H.; Stankovic, J.A. Toward Urban Electric Taxi Systems in Smart Cities: The Battery Swapping Challenge. IEEE Trans. Veh. Technol. 2018, 67, 1946–1960. [Google Scholar] [CrossRef]
  2. Saldaña, G.; San Martin, J.I.; Zamora, I.; Asensio, F.J.; Oñederra, O. Electric Vehicle into the Grid: Charging Methodologies Aimed at Providing Ancillary Services Considering Battery Degradation. Energies 2019, 12, 2443. [Google Scholar] [CrossRef] [Green Version]
  3. Cheng, L.; Chang, Y.; Huang, R. Mitigating Voltage Problem in Distribution System With Distributed Solar Generation Using Electric Vehicles. IEEE Trans. Sustain. Energy 2015, 6, 1475–1484. [Google Scholar] [CrossRef]
  4. Kushwaha, R.; Singh, B. Design and Development of Modified BL Luo Converter for PQ Improvement in EV Charger. IEEE Trans. Ind. Appl. 2020, 56, 1. [Google Scholar] [CrossRef]
  5. Ferdowsi, M.; Monti, A.; Ponci, F.; Fathi, G. Demand side management verification system for electric vehicles. In Proceedings of the 2014 IEEE International Workshop on Applied Measurements for Power Systems Proceedings (AMPS), Aachen, Germany, 24–26 September 2014; Institute of Electrical and Electronics Engineers (IEEE): New York, NY, USA, 2014; pp. 1–6. [Google Scholar]
  6. Markiewicz, H.; Klajn, A. Voltage Disturbances Standard EN 50160-Voltage Characteristics in Public Distribution Systems. Wroc. Univ. Technol. 2004, 21, 215–224. [Google Scholar]
  7. International Electrotechnical Commission. IEC61000; International Electrotechnical Commission (IEC): Geneva, Switzerland, 2005. [Google Scholar]
  8. Mehta, R.; Srinivasan, D.; Khambadkone, A.M.; Yang, J.; Trivedi, A. Smart Charging Strategies for Optimal Integration of Plug-In Electric Vehicles Within Existing Distribution System Infrastructure. IEEE Trans. Smart Grid 2018, 9, 299–312. [Google Scholar] [CrossRef]
  9. Jiang, N.; Xie, C. Computing and Analyzing Mixed Equilibrium Network Flows with Gasoline and Electric Vehicles. Comput. Civ. Infrastruct. Eng. 2014, 29, 626–641. [Google Scholar] [CrossRef]
  10. Ma, J.; Wang, H.; Tang, T. Stochastic Electric Vehicle Network with Elastic Demand and Environmental Costs. J. Adv. Transp. 2020, 2020, 1–11. [Google Scholar] [CrossRef]
  11. Hussain, S.; Lee, K.-B.; Ahmed, M.A.; Hayes, B.; Kim, Y.-C. Two-Stage Fuzzy Logic Inference Algorithm for Maximizing the Quality of Performance under the Operational Constraints of Power Grid in Electric Vehicle Parking Lots. Energies 2020, 13, 4634. [Google Scholar] [CrossRef]
  12. Chukwu, U.C.; Mahajan, S.M. Real-Time Management of Power Systems With V2G Facility for Smart-Grid Applications. IEEE Trans. Sustain. Energy 2013, 5, 558–566. [Google Scholar] [CrossRef]
  13. Knezovic, K.; Martinenas, S.; Andersen, P.B.; Zecchino, A.; Marinelli, M. Enhancing the Role of Electric Vehicles in the Power Grid: Field Validation of Multiple Ancillary Services. IEEE Trans. Transp. Electrif. 2016, 3, 201–209. [Google Scholar] [CrossRef] [Green Version]
  14. Lopes, J.A.P.; Soares, F.J.; Almeida, P.M.R. Integration of Electric Vehicles in the Electric Power System. Proc. IEEE 2011, 99, 168–183. [Google Scholar] [CrossRef] [Green Version]
  15. Aravinthan, V.; Jewell, W. Controlled Electric Vehicle Charging for Mitigating Impacts on Distribution Assets. IEEE Trans. Smart Grid 2015, 6, 999–1009. [Google Scholar] [CrossRef]
  16. Tan, J.; Wang, L. Integration of Plug-in Hybrid Electric Vehicles into Residential Distribution Grid Based on Two-Layer Intelligent Optimization. IEEE Trans. Smart Grid 2014, 5, 1774–1784. [Google Scholar] [CrossRef]
  17. Hussain, S.; Ahmed, M.A.; Lee, K.-B.; Kim, Y.-C. Fuzzy Logic Weight Based Charging Scheme for Optimal Distribution of Charging Power among Electric Vehicles in a Parking Lot. Energies 2020, 13, 3119. [Google Scholar] [CrossRef]
  18. Kavousi-Fard, A.; Rostami, M.A.; Niknam, T. Reliability-Oriented Reconfiguration of Vehicle-to-Grid Networks. IEEE Trans. Ind. Inform. 2015, 11, 682–691. [Google Scholar] [CrossRef]
  19. Moham, H.A.A. A Synthetic Case Study for Analysis of the Rising Interdependency Between the Power Grid and E-Mobility. IEEE Access 2019, 7, 58802–58809. [Google Scholar] [CrossRef]
  20. Kallitsis, M.G.; Michailidis, G.; Devetsikiotis, M. A decentralized algorithm for optimal resource allocation in smartgrids with communication network externalities. In Proceedings of the 2011 IEEE International Conference on Smart Grid Communications (SmartGridComm), Brussels, Belgium, 17–20 October 2011; Institute of Electrical and Electronics Engineers (IEEE): New York, NY, USA, 2011; pp. 434–439. [Google Scholar]
  21. Kulshrestha, P.; Swaminathan, K.; Chow, M.-Y.; Lukic, S. Evaluation of ZigBee communication platform for controlling the charging of PHEVs at a municipal parking deck. In Proceedings of the 2009 IEEE Vehicle Power and Propulsion Conference, Dearborn, MI, USA, 7–10 September 2009; Institute of Electrical and Electronics Engineers (IEEE): New York, NY, USA, 2009; pp. 1211–1214. [Google Scholar]
  22. MEISTER. 2018. Available online: https://meisterproject.eu/ (accessed on 11 June 2021).
  23. Bachmann, R.; Wilke, C.; Zyglakis, L.; Bintoudi, A.; Pavlopoulos, V.; Ioannidis, D.; Ting, W.; Behzad, J.; Antoni, F.; Nowack, C.; et al. D5.2 Smart Grid Services Implementation. 2020. Available online: https://ec.europa.eu/research/participants/documents/downloadPublic?documentIds=080166e5cd81dc64&appId=PPGMS (accessed on 11 June 2021).
  24. Wang, Z.; Yang, R.; Wang, L.; Tan, J. Reliability assessment of integrated residential distribution and PHEV systems using Monte Carlo simulation. In Proceedings of the 2013 IEEE Power & Energy Society General Meeting, Vancouver, BC, Canada, 21–25 July 2013; Institute of Electrical and Electronics Engineers (IEEE): New York, NY, USA, 2013; pp. 1–5. [Google Scholar]
  25. Farzin, H.; Moeini-Aghtaie, M.; Fotuhi-Firuzabad, M. Reliability Studies of Distribution Systems Integrated With Electric Vehicles Under Battery-Exchange Mode. IEEE Trans. Power Deliv. 2015, 31, 2473–2482. [Google Scholar] [CrossRef]
  26. Smart Grid Traffic Light Concept; BDEW, German Association of Energy and Water Industries: Berlin, Germany, 2015.
  27. Bintoudi, A.; Zyglakis, L.; Tsolakis, A.; Gkaidatzis, P.; Tryferidis, A.; Ioannidis, D.; Tzovaras, D. OptiMEMS: An Adaptive Lightweight Optimal Microgrid Energy Management System Based on the Novel Virtual Distributed Energy Resources in Real-Life Demonstration. Energies 2021, 14, 2752. [Google Scholar] [CrossRef]
  28. Smart Grid Coordination Group. SGAM User Manual—Applying, Testing & Refining the Smart Grid Architecture Model (SGAM); CEN–CENELEC–ETSI: Brussels, Belgium, 2014. [Google Scholar]
  29. IEC 61850-7-1. Basic Communication Structure—Principles and Models; International Electrotechnical Commission (IEC): Geneva, Switzerland, 2003. [Google Scholar]
  30. IEC 61850-8-1. Specific Communication Service Mapping (SCSM)—Mappings to MMS (ISO 9506-1 and ISO 9506-2) and to ISO/IEC 8802-3; International Electrotechnical Commission (IEC): Geneva, Switzerland, 2004. [Google Scholar]
  31. IEC 60870-5-104. Transmission Protocols—Network Access for IEC 60870-5-101 Using Standard Transport Profiles; International Electrotechnical Commission (IEC): Geneva, Switzerland, 2006. [Google Scholar]
  32. Leeuw, R.D.; Lamers, R.; McMahon, B.; Muhlenberg, L.; Rademakers, P.; Tcaciuc, S.; Zuuren und, F.; Buve, K.V. Open Charge Point Protocol 1.6. Open Charge Alliance. 2015. Available online: https://www.oasis-open.org/committees/download.php/58944/ocpp-1.6.pdf (accessed on 11 June 2021).
  33. Kansal, P.; Bose, A. Bandwidth and Latency Requirements for Smart Transmission Grid Applications. IEEE Trans. Smart Grid 2012, 3, 1344–1352. [Google Scholar] [CrossRef]
  34. Li, Y.; Cheng, X.; Cao, Y.; Wang, D.; Yang, L. Smart Choice for the Smart Grid: Narrowband Internet of Things (NB-IoT). IEEE Internet Things J. 2017, 5, 1505–1515. [Google Scholar] [CrossRef]
  35. RTDS Hardware Manual. Available online: https://www.rtds.com/ (accessed on 11 June 2021).
  36. Linux Mint. Available online: https://linuxmint.com/ (accessed on 11 June 2021).
  37. IEC60870 C Library. Available online: https://github.com/mz-automation/lib60870.git (accessed on 11 June 2021).
  38. IEC 61850 C Library. Available online: https://github.com/mz-automation/libiec61850.git (accessed on 11 June 2021).
  39. net-line FW-5-GATE. Available online: https://www.sae-it.com/de/produkte/fernwirktechnik/fw-5-gate.html (accessed on 11 June 2021).
  40. Results. Available online: https://www.acs.eonerc.rwth-aachen.de/go/id/osuwh?lidx=1#aaaaaaaaaaoszdf (accessed on 11 June 2021).
  41. Mahmud, M.A.; Hossain, M.J.; Pota, H.R. Analysis of Voltage Rise Effect on Distribution Network with Distributed Generation. IFAC Proc. Vol. 2011, 44, 14796–14801. [Google Scholar] [CrossRef] [Green Version]
  42. Arranz, S.R.; Romero-Cadaval, E.; Romera, E.G.; Montero, M.I.M. Study of Spread of Harmonics in an Electric Grid. In Doctoral Conference on Computing, Electrical and Industrial Systems; Springer: Berlin/Heidelberg, Germany, 2011; Volume 349, pp. 457–465. [Google Scholar]
  43. Liang, X.; Andalib-Bin-Karim, C. Harmonics and Mitigation Techniques Through Advanced Control in Grid-Connected Renewable Energy Sources: A Review. IEEE Trans. Ind. Appl. 2018, 54, 3100–3111. [Google Scholar] [CrossRef]
  44. Wilson, A.J.; Reising, D.R.; Hay, R.W.; Johnson, R.C.; Karrar, A.A.; Loveless, T.D. Automated Identification of Electrical Disturbance Waveforms Within an Operational Smart Power Grid. IEEE Trans. Smart Grid 2020, 11, 4380–4389. [Google Scholar] [CrossRef]
  45. Platas-Garza, M.A.; de la O Serna, J. A Polynomial Implementation of the Taylor–Fourier Transform for Harmonic Analysis. IEEE Trans. Instrum. Meas. 2014, 63, 2846–2854. [Google Scholar] [CrossRef]
  46. Hidalgo, R.; Fernandez, J.; Rivera, R.; Larrondo, H. A simple adjustable window algorithm to improve FFT measurements. IEEE Trans. Instrum. Meas. 2002, 51, 31–36. [Google Scholar] [CrossRef]
  47. VDE-AR-N 4105—Generators Connected to the Low-Voltage Distribution Network. 0100492, 2018-11. Available online: https://www.vde.com/en/fnn/topics/technical-connection-rules/power-generating-plants (accessed on 11 June 2021).
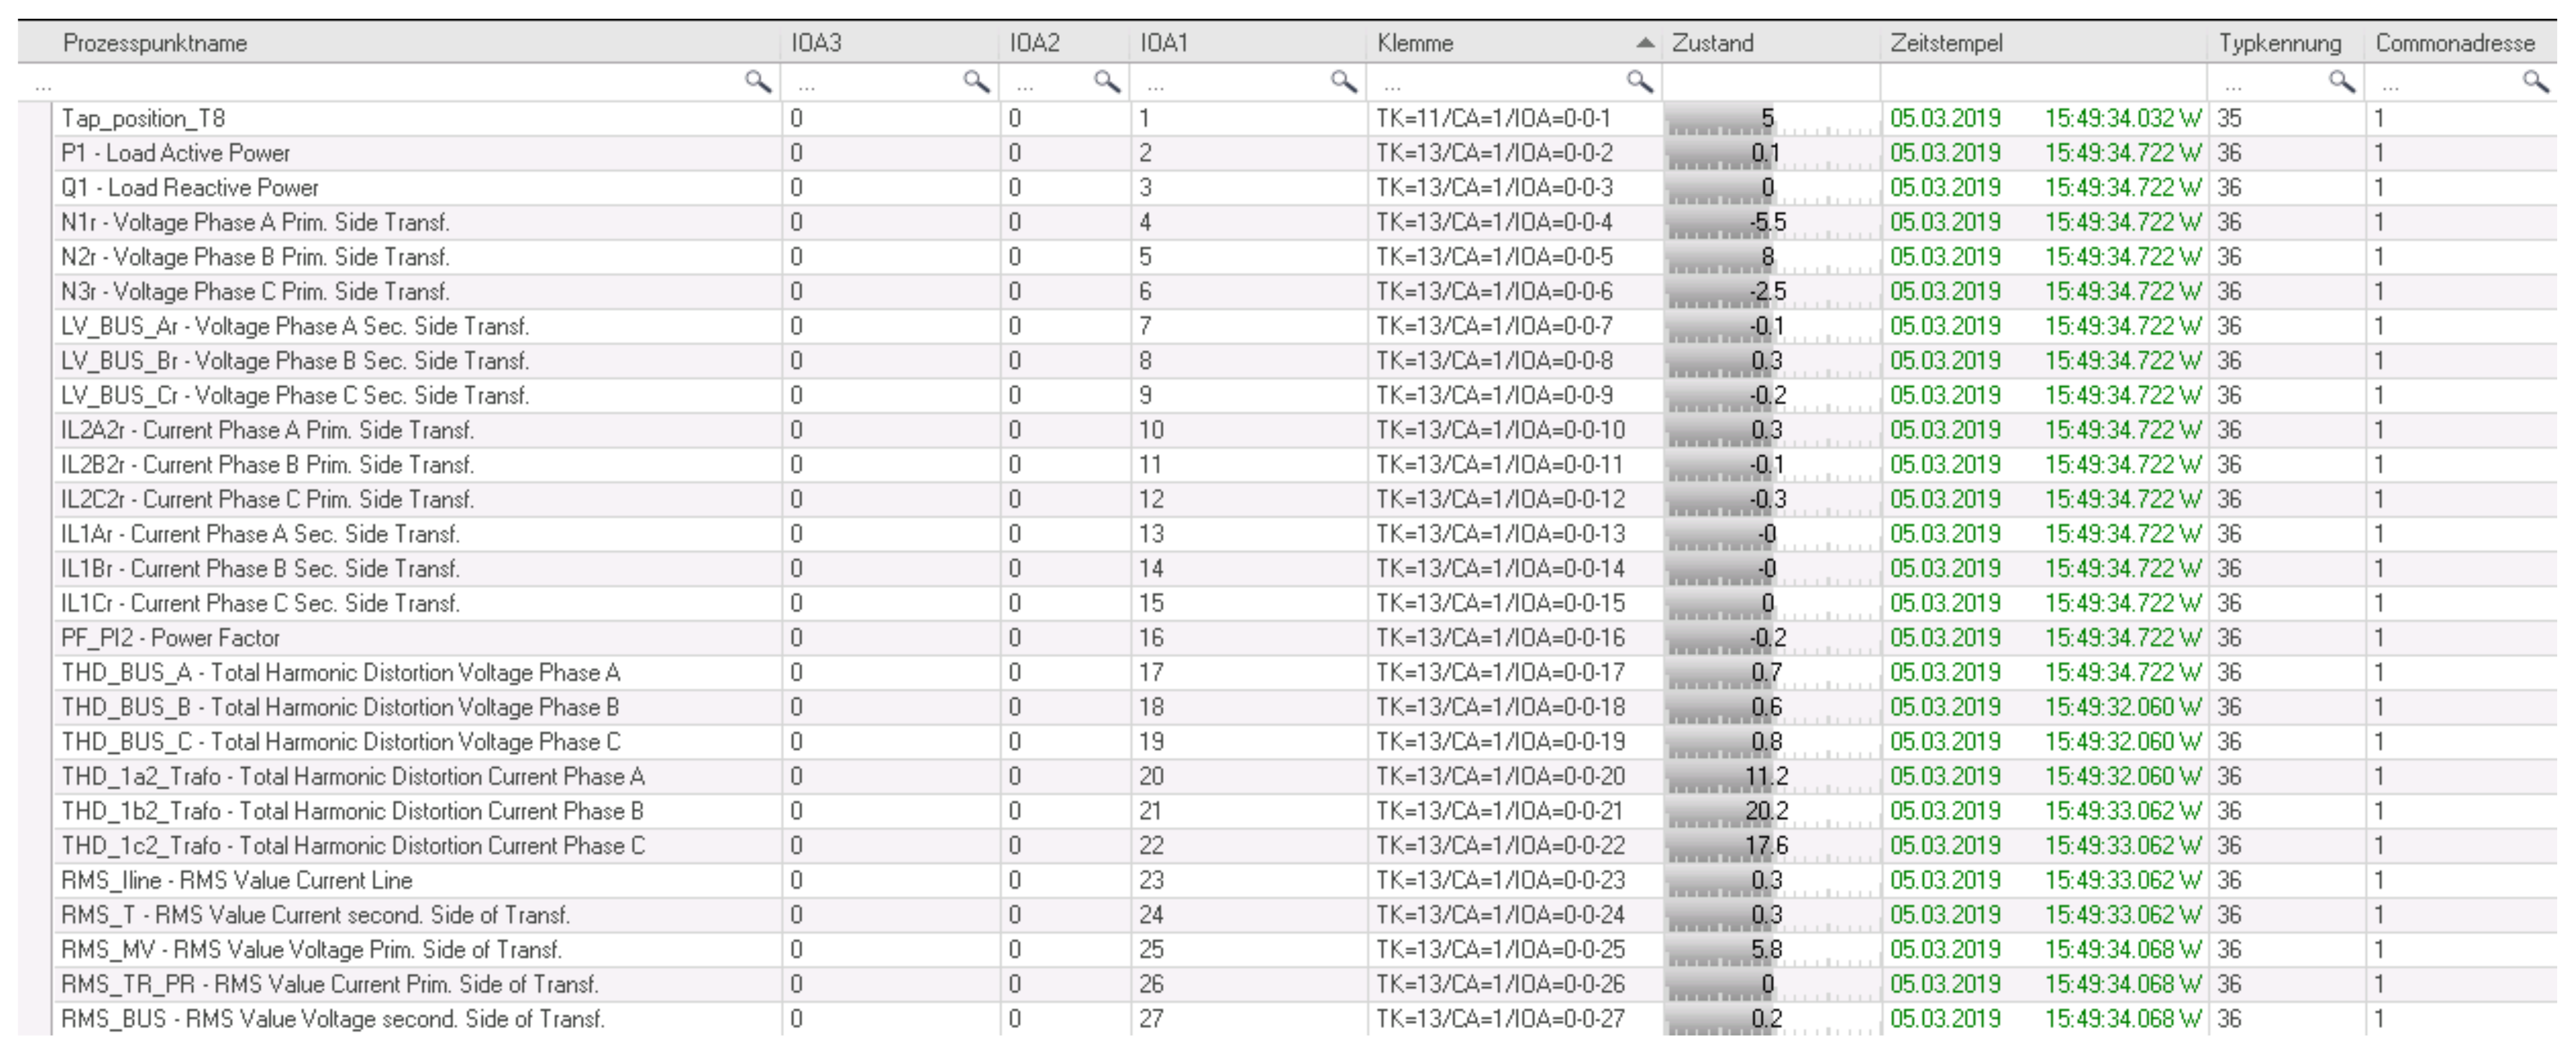
Figure 1. MEISTER information and communication technology (ICT) platform.
Energies 14 03533 g001
Figure 2. Centralized grid control approach.
Energies 14 03533 g002
Figure 3. MEISTER SGAM framework.
Energies 14 03533 g003
Figure 4. (a) Component, (b) communication, (c) information, (d) function and (e) business layers of the MEISTER SGAM framework.
Energies 14 03533 g004
Figure 5. Network connection setup.
Energies 14 03533 g005
Figure 6. GTNET draft component parameters (a) and the RSCAD SCD file (b).
Energies 14 03533 g006
Figure 7. Translator computer desktop.
Energies 14 03533 g007
Figure 8. The received measured data from the RTU.
Energies 14 03533 g008
Figure 9. Communication tree structure SetIT.
Energies 14 03533 g009
Figure 10. RTU.
Figure 10. RTU.
Energies 14 03533 g010
Figure 11. MEISTER SGIP.
Energies 14 03533 g011
Figure 12. UC high load reduction “MAXPRED”, EV chargers setpoints (optimization algorithm).
Energies 14 03533 g012
Figure 13. Communication between SGIP and AME charger through OCPP.
Energies 14 03533 g013
Figure 14. UC high load reduction “MAXPRED”, AME charger monitoring.
Energies 14 03533 g014
Figure 15. E.ON Essen test site.
Energies 14 03533 g015
Figure 16. RSCAD draft model for a grid segment of Waterkant Berlin.
Energies 14 03533 g016
Figure 17. RSCAD runtime environment.
Energies 14 03533 g017
Figure 18. Measured profiles: Load profile at the secondary substation, PV and wind profiles and the aggregated power of EVs.
Energies 14 03533 g018
Figure 19. Measured voltage and transformer loading at the secondary side.
Energies 14 03533 g019
Figure 20. Measured voltage and transformer loading at the primary side.
Energies 14 03533 g020
Figure 21. Thévenin equivalent circuit at the point of common coupling (PCC) of the EV system.
Energies 14 03533 g021
Figure 22. Voltage and current signals at the transformer secondary side for scenario 1 and scenario 2.
Energies 14 03533 g022
Figure 23. Voltage and current signals at the transformer primary side for scenario 1 and scenario 2.
Energies 14 03533 g023
Figure 24. Voltage and current signals at the transformer secondary side for scenario 3 and scenario 4.
Energies 14 03533 g024
Figure 25. Voltage and current signals at the transformer secondary side for scenario 3 and scenario 4.
Energies 14 03533 g025
Figure 26. Harmonics filtering function.
Energies 14 03533 g026
Figure 27. Three-phase current signals at the secondary side of the substation. (a) Deformed by harmonic and (b) operating EVs as active filter.
Energies 14 03533 g027
Figure 28. Total harmonic distortion of the current (THDi). (a) Deformed by harmonic and (b) operating EVs as active filter.
Energies 14 03533 g028
Figure 29. Three-phase voltage signals at the secondary side. (a) Affected by harmonic and (b) operating EVs as active filter.
Energies 14 03533 g029
Figure 30. Total harmonic distortion of the voltage (THDu). (a) Deformed by harmonic and (b) operating EVs as active filter.
Energies 14 03533 g030
Figure 31. Improving the PF with reactive power control of the EV battery.
Energies 14 03533 g031
Table 1. Transmitted electrical variables.
#Electrical Variable#Electrical Variable
1Transformer tap position8Three-phase voltage total harmonic distortion
2Load active and reactive power 9Three-phase current total harmonic distortion
3Three-phase voltage at the primary side of the transformer10RMS line current
4Three-phase voltage at the secondary side of the transformer11RMS transformer current at the primary side
5Three-phase current at the primary side of the transformer12RMS transformer current at the secondary side
6Three-phase current at the secondary side of the transformer13RMS transformer voltage at the primary side
7Power factor14RMS transformer voltage at the secondary side
Table 2. Some power quality indices defined in EN 50160.
#ParameterMeasurementOperating RangeDuration
1Grid frequency10 s mean value±1% (49.5–50.5 Hz)
−6%/+4% (47–52 Hz)
for 99.5% of the week
for 100% of the week
2Voltage magnitude10 min RMS valuesLV, MV: ±10%for 95% of the week
3Flickers10 min RMS values≤1for 95% of the week
4Voltage unbalance10 min mean of RMS values<2%for 95% of the week
5Total harmonic distortion10 min mean of RMS values of harmonics from 1st to the 40th order<8%for 100% of the time
Table 3. Test set points for the use case 1.
ScenarioLoad (kW)PFWind Turbine (kW)PFPV (kW)p-fEV Station (kW)PF
16000.97−2001.0−1501.001.0
26000.97−2001.0−1501.0−2001.0
Table 4. Test set points for the use case 2.
ScenarioLoad (kW)PFWind Turbine (kW)PFPV (kW)PFEV Station (kW)PF
11000.97−2001.0−1501.001.0
21000.97−2001.0−1501.0+1001.0
36000.97−2001.0−1501.001.0
46000.97−2001.0−1501.0+2001.0
Table 5. Test set points for the use case 3.
ScenarioLoad (kW)PFWind Turbine (kW)PFPV (kW)PFEV Station 1 (kW)PFEV Station 2 (kW)PFHarmonic Source (Hz)
11000.97−2001.001.001.001.020
21000.97−2001.001.0+1001.0−1001.020
Table 6. Test set points for the use case 4.
ScenarioLoad (kW)PFWind Turbine (kVA)PFPV (kW)PFBattery (kVA)PF
16000.97−51000100
26000.97−510001+2000
Publisher’s Note: MDPI stays neutral with regard to jurisdictional claims in published maps and institutional affiliations.

