Article

Advanced Machine Learning Functionalities in the Medium Voltage Distributed Monitoring System QuEEN: A Macro-Regional Voltage Dips Severity Analysis

Ricerca sul Sistema Energetico-RSE S.p.A., Via Rubattino 54, 20134 Milan, Italy
*
Author to whom correspondence should be addressed.
Energies 2021, 14(23), 7949; https://doi.org/10.3390/en14237949
Submission received: 25 October 2021 / Revised: 19 November 2021 / Accepted: 23 November 2021 / Published: 27 November 2021
(This article belongs to the Special Issue Monitoring and Distributed Control for Power Systems)

Abstract

:
This paper presents the integration of advanced machine learning techniques in the medium voltage distributed monitoring system QuEEN. This system is aimed to monitor voltage dips in the Italian distribution network mainly for survey and research purposes. For each recorded event it is able to automatically evaluate its residual voltage and duration from the corresponding voltage rms values and provide its “validity” (invalidating any false events caused by voltage transformers saturation) and its “origin”(upstream or downstream from the measurement point) by proper procedures and algorithms (current techniques). On the other hand, in the last years new solutions have been proposed by RSE to improve the assessment of the validity and origin of the event: the DELFI classifier (DEep Learning for False voltage dips Identification) and the FExWaveS + SVM classifier (Features Extraction from Waveform Segmentation + Support Vector Machine classifier). These advanced functionalities have been recently integrated in the monitoring system thanks to the automated software tool called QuEEN PyService. In this work, intensive use of these advanced techniques has been carried out for the first time on a significant number of monitored sites (150) starting from the data recorded from 2018 to 2021. Besides, the comparison between the results of the innovative technique (validity and origin of severe voltage dips) with respect to the current ones has been performed at the macro-regional level too. The new techniques are shown to have a not negligible impact on the severe voltage dips number and confirm a non-homogenous condition among the Italian macro-regional areas.

1. Introduction

Nowadays, the new paradigm of the smart grid requires innovative features and capabilities for power systems engineers. At present and in the next future, the distribution system is expected to be characterized by an increasing penetration of renewable energy power plants, power electronic devices, and plug-in electric vehicle charging stations. This trend will considerably boost the harmonic pollution level and transient phenomena effects in the medium voltage (MV) grid. Moreover, the customer requirements are becoming more demanding in terms of continuity and quality of the power supply.
In this context power quality (PQ) represents a key-task [1] in distribution grids. From a normative point of view, the reference standard for low voltage (LV) and MV systems is the EN50160 [2]; the standard divides PQ disturbances into two main groups: variations, namely harmonic distortions, unbalances, fluctuations, flicker severity and rapid voltage changes and events, such as interruptions, voltage swells and dips. Among the PQ events, voltage dips (VDs) require special attention as their impact is significant on a large variety of equipment and devices [3,4,5,6,7]. In fact, a temporary reduction of the supply voltage under 90% of its nominal value can produce loads disconnections, resulting in service outages for the users. These events are characterized in terms of residual voltage (RV) and dip duration (DD) as defined by the EN 50160. For these reasons, different works dealing with many aspects concerning voltage dips can be found in literature, regarding compensating solutions [8,9,10], impact on customers [11,12,13,14] and monitoring systems [15,16]. Moreover, in [17,18] adequate indices for quantifying their severity have been proposed.
Widespread monitoring systems are crucial tools for properly handling PQ phenomena, such as voltage dips [19,20]. Since 2006, in the Italian MV distribution grid, RSE developed a research monitoring system called QuEEN (Quality of Electric Energy) [21] with the support of the Italian regulatory authority and funding from the Research Fund for the Italian Electrical System. The monitoring system is distributed throughout the national territory, and it consists of nearly 400 measurement units (MUs) installed at the MV busbars in the primary substations (PS). The installed MUs comply with the class S instrument prescribed by IEC-61000-4-30 [22] so that they can perform PQ measurements for both survey and research purposes. Starting also from the achieved results from the QuEEN monitoring system, in 2012, the Italian Regulatory Authority for Energy, Networks, and Environment (ARERA—Autorità di Regolazione per Energia, Reti e Ambiente) has asked the distribution network operators to implement a voltage dips monitoring system at the national level [23,24] involving all the HV/MV stations and their MV busbars.
Focusing on VDs, their characterizations in terms of RV and DD are not typically sufficient for a detailed PQ analysis aimed at a regulatory purpose; actually, two other important features have to be considered: (i) validity and (ii) origin of voltage dips. Focusing on the first point, the Italian MV distribution system presents a significant number of grids that are still operated as isolated neutral systems (about 25% of the PS MV busbars). In this configuration single line-to-ground faults can produce zero-sequence components which can in turn cause saturation of voltage transformers (VT), leading to a reduction of the transduced voltage on VT LV side, during fault extinction: this is what it is called a “false” voltage dips. Considering the second point, the origin, it is straightforward that a VD recorded by a MU connected at a PS MV busbar may be due to a fault that occurred both in the upstream network (High Voltage or HV grid) or in the downstream network (MV grid). The Distribution System Operators (DSO) responsibility can be attributed only to the events that occurred on their own networks and not for those having an origin in the Transmission System Operator (TSO) grid.
The QuEEN monitoring system has been developed considering both these issues. To assess the validity of VDs, a criterion based on the detection of the 2nd harmonic component has been implemented. The algorithm has been developed by RSE in cooperation with the Politecnico di Torino [25]. Its global performance achieves an accuracy equal to 87% as it is not always able to give a Boolean answer: in fact, in some cases, named undefined, it is not able to identify the event type (true or false). As for the origin, a procedure called “global method” (GM) has been developed by RSE [26]. The algorithm first categorizes as HV voltage dips all the events associated with the start signals of the distance protections installed in the PSs. Moreover, it searches for VDs that occurred at the same time in nearly PSs, fed by a common HV network, identifying them as HV events even in the absence of any correlation with the available distance protections signals. It is important to point out that the GM requires a wide monitoring system (accuracy may change based on the number of active monitored measurement sites) along with some topological information from the TSO.
In recent years, the progress of Artificial Intelligence (AI) and signal processing techniques have led to several practical applications in power systems. Concerning PQ, several surveys can be found in the literature [27,28,29,30,31] which collect different original contributions aimed at the detection and classification of power quality events. In this framework, RSE has turned its attention to these promising approaches to improve the capability in the PQ data analysis, especially to enhance the QuEEN functionalities and overcome the limitations given by the methods currently adopted. In particular, RSE has recently developed new solutions, based on new AI techniques, for solving the issue of voltage events validity and origin assessment. A Deep Learning (DL) model based on VDs rms sequence “jpg images” has been proposed as a validity classifier: the DELFI application (DEep Learning for False voltage dips Identification). The classifier can solve undefined cases so that it provides a Boolean answer [32]. By considering instead the origin assessment, a standalone application based on Machine Learning (ML) called FExWaveS (Features Extraction from Waveform Segmentation) has been developed [33]. It basically performs a VDs waveforms segmentation to extract meaningful features which are then used as the input of a Support Vector Machine (SVM) classifier. Preliminary results for both applications have shown significant results.
Based on these promising results, a tool that integrates these advanced algorithms based on DL and ML in the QuEEN monitoring system has been proposed to test their performance in a real scenario and on a large amount of data. To achieve this goal, a software tool called QuEEN PyService has been developed in Python language [34,35]. This tool allows simultaneously adopting the “current” methods (second harmonic criterion for validity and global method for origin) and the new methodologies based on DL and ML respectively.
In this paper, a broad statistical analysis on voltage dips has been performed. Events collected by 150 MUs equally distributed in the Italy, in the period ranging from January 2018 to April 2021, have been considered. For each of these events, the outcomes of the current methods and those of the new methodologies have been compared for both the validity and origin assessments. Then, for the first time, a detailed severity analysis, based on some already used PQ counting indices, has been carried out on a macro-region level adopting both the current and the new algorithms, highlighting any difference between the achieved results.
The paper is organized as follows: Section 2 describes in detail the characteristics of the QuEEN monitoring system and the algorithms employed for the validity and origin assessments. Section 3 presents the new applications based on Deep Learning and Machine Learning and their implementation in the QuEEN system, thanks to the QuEEN PyService Application. Section 4 presents the results of the comparison between the current methods and the new techniques. In Section 5 a detailed voltage dips severity analysis has been carried out considering both the adopted approaches and also referring to four macro-areas. In Section 6 some conclusions are drawn.

2. The QuEEN Monitoring System
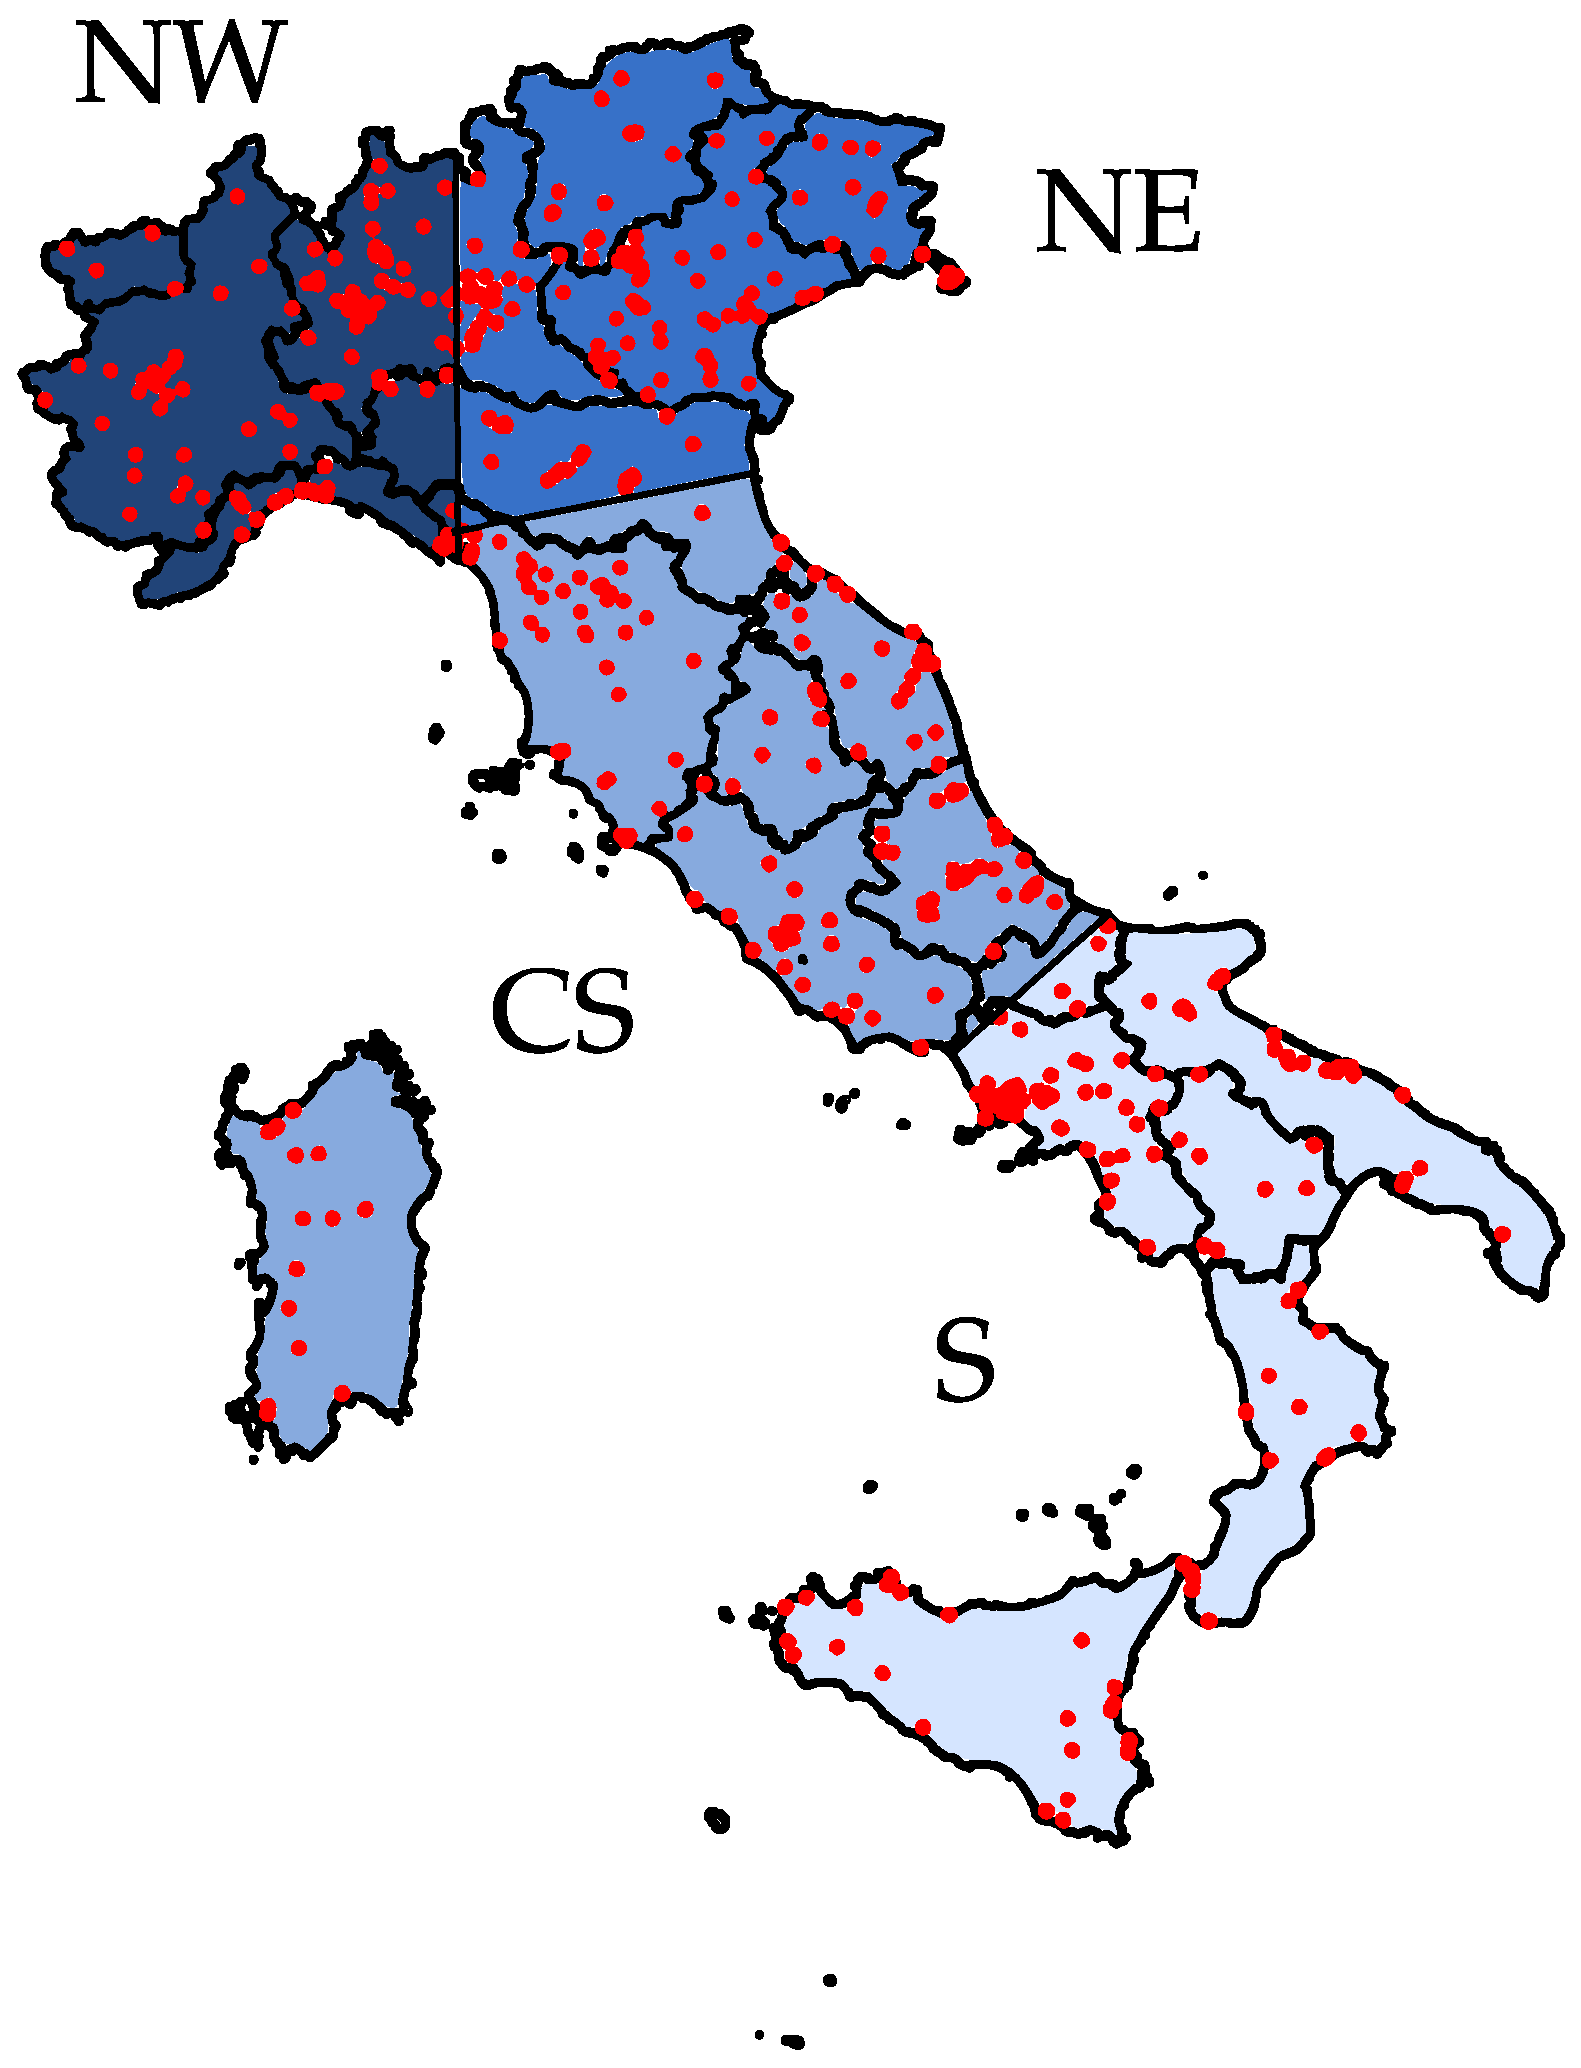
The QuEEN monitoring system represents an important distributed measurement system in the Italian MV distribution grid. The system was developed in 2006, and it consists of 400 Measurement Units installed in some primary substations and connected to the LV side of VT, whose primary windings are connected between the MV phases and the ground. These monitored MV busbars represent around 11% of the Italian distribution grid. To compare the network performances of different Italian zones, Italy has been divided into four macro-regional areas in order to have a comparable number of MUs in them, as reported in Figure 1:
  • North-West (NW)
  • North-East (NE)
  • Center-Sardinia (CS)
  • South (S).
Each installed MU performs PQ measurements as prescribed by the international standard IEC 61000-4-30 [22]. The recorded PQ disturbances are the following:
  • Voltage Variations
  • Voltage Unbalances
  • Voltage Harmonics
  • Flicker
  • Rapid Voltage Changes
  • Voltage Dips
  • Voltage Swells
  • Interruptions
Collected data are sent to the QuEEN database from which each DSO has the possibility to read all the information coming from the MUs installed in their own PSs. Moreover, PQ statistics computed on aggregated data are public and available on the QuEEN website [21].
Focusing on voltage dips, each MU computes the rms of the three line-to-line voltages for each cycle and it updates them every half-cycle. As prescribed by the specific standard [2], the event is recognized when at least one line-to-line voltage rms drops below the 90% percentage of the rated voltage and it ends when all the three line-to-line voltages rise above the 90% plus a hysteresis (typically 2% of the rated voltage). The residual voltage and the dip duration are then automatically computed. Furthermore, the MU acquires and saves the event waveforms and the rms sequences for each acquired channel.
As highlighted in the introduction, the QuEEN system is also able to perform voltage dips advanced analysis in terms of:
  • Validity
  • Origin
In the next subsections, the motivations and implemented solutions for these two issues are briefly described.

2.1. Validity Criterion Based on 2nd Harmonic

Italian distribution systems are characterized by two main topologies of neutral configuration: isolated neutral and compensated neutral. Especially in the first kind of system configuration, faults involving ground can lead to a sinusoidal zero-sequence voltage, whose amplitude depends on fault type, location and resistance. After the fault extinction, this component decays to zero with a behavior depending on the neutral connection. The employed measuring system in the PSs is characterized by the installation of phase-to-ground inductive VTs. The previously described phenomena can lead to a saturation of the transducer’s magnetic core resulting in a reduction of the induced electromotive force on the secondary winding. This produces a reduction of the measured line-to-line voltage that leads to a “false” (F) voltage dip. Secondary voltages during “false” voltage dips present asymmetrical waveforms characterized by “camel humps” and “Doge’s hats”. An example of “false” voltage dip waveforms and rms sequences acquired from a real MU, installed in one PS, has been reported in Figure 2 and Figure 3 respectively.
To properly identify those events and remove them from statistics, a criterion has been implemented in each MU. The algorithm, developed in cooperation with the Politecnico di Torino [25], is based on the detection of a second harmonic component in the measured voltages: the measurement is performed over 20 ms and refreshed every 10 ms. Then the following conditions are independently checked on all three phases:
  • the occurrence of a threshold overcoming for the 2nd harmonic level (fixed to a given percent of the rms value)
  • the succession of a minimum number of consecutive exceedances of the 2nd harmonic threshold.
The “check parameters” were chosen after a lab campaign: the second harmonic threshold was set to 10% of the rms values while the number of consecutive overcoming was chosen equal to three (equivalent to 30 ms).
On the other hand, the criterion can result in a not univocal evaluation of the event: in fact, when the criterion does not give coherent outcomes for the voltages involved in the event (False for one line-to-line voltage and True for another one), the classification fails so that a “not defined” (ND) label is attributed to the event. Examples of the “not defined” cases are VDs characterized by short durations or those due to grounded polyphase faults extinction, which usually appear as a sequence of True + False dip. After years of the campaign, the number of ND cases represents typically 12% of recorded voltage dips. This kind of event is not counted in the statistics.

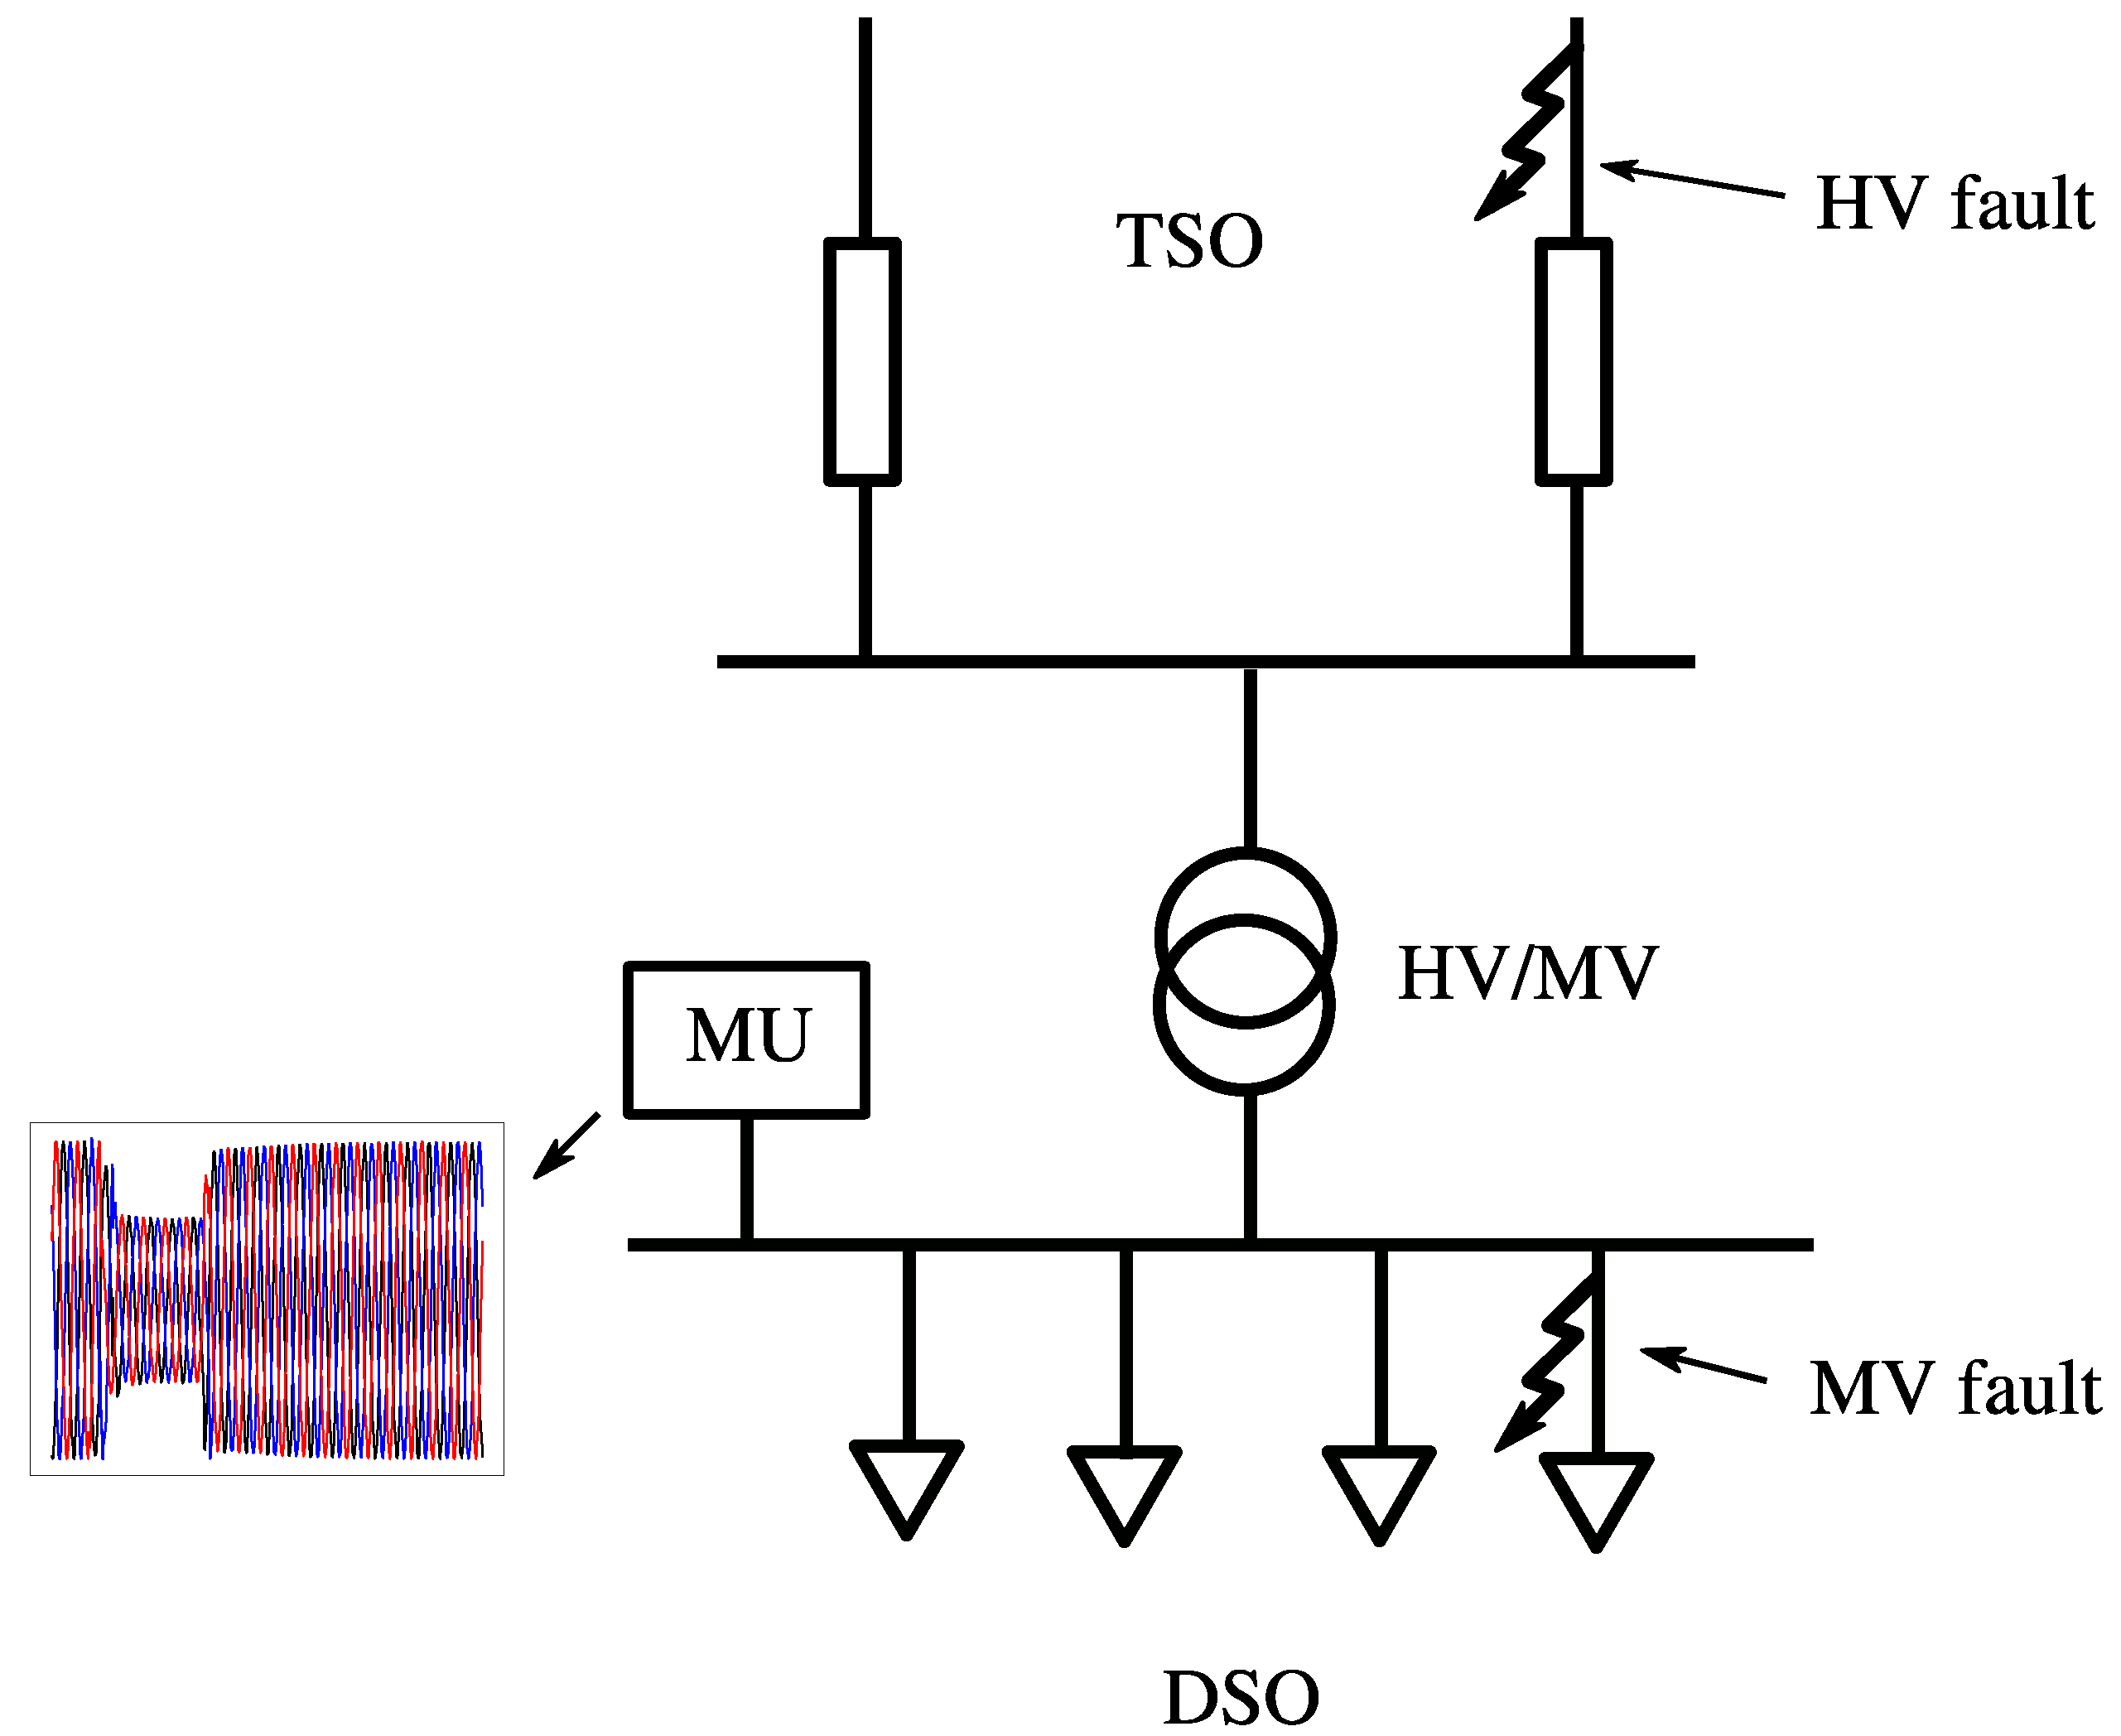
2.2. Origin Criterion Based on HV Protections and Events Correlation

At the same level of importance as identifying “validity”, the QuEEN monitoring system has to be able to assess voltage dips origin, so that the responsibility for the events that occur in their networks can be correctly attributed to the DSOs.
Let us consider the situation reported in Figure 4. When a MU installed in the PS MV busbar records a voltage dip, the cause of the latter can be attributed to the following two main categories:
  • A fault occurred in the transmission grid (HV fault), namely an upstream event; the associated voltage dip has to be attributed to the TSO responsibility;
  • A fault occurred in the distribution grid (MV fault), namely a downstream event; the associated voltage dip has to be attributed to the DSO responsibility.
For this reason, a method, called Global Method (GM), has been implemented for estimating the voltage dip possible origin. Starting from the data monitored by the QuEEN system, the procedure detects those VDs whose origin has to be attributed to a fault that occurred in the HV network; the algorithm steps can be summarized as follow:
  • Detection of True voltage dips associated with the start signal of the distance protection installed on the HV side of the PS (HV Distance Protection events); this functionality is achieved directly by the MU by means of a digital input channel;
  • Detection of others True voltage dips that meet the following two conditions:
    о
    VDs having “coincident” time of occurrence, within a certain tolerance range, with the events previously identified (HV Occurrence Events);
    о
    VDs having “coincident” time of occurrence between them, within a certain tolerance range, and being recorded by MUs belonging to PSs underlying a common HV grid (HV Correlated Events).
The last two categories of events are achieved by means of a software procedure that runs each month on the QuEEN database.
The Global Method was originally tested in the past with good results by comparing it with other methods [26], but it strictly depends on the number of active MUs and on the knowledge of the HV network topology.

3. Machine Learning and Deep Learning Techniques in the QuEEN Monitoring System

In this section, the innovative techniques for validity and origin assessments, respectively based on DL and ML, are briefly explained. Then their integration within the QuEEN monitoring system, by means of the QuEEN PyService application, is presented.

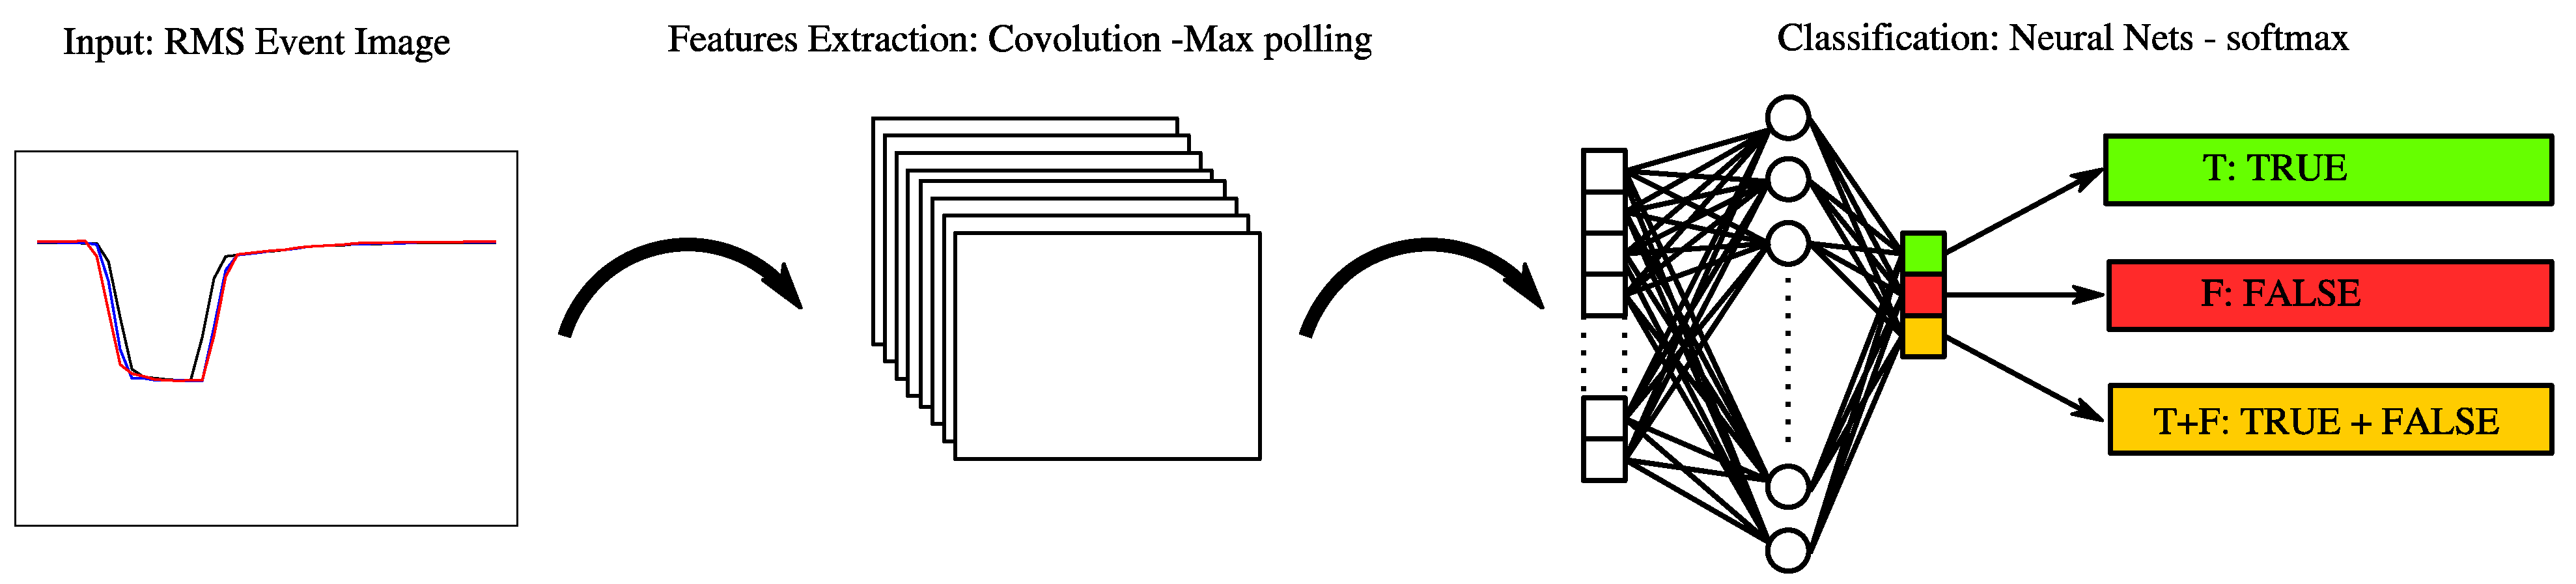
3.1. DELFI—Deep Learning for False Events Identification

The DELFI (Deep Learning for False Events Identification) classifier is a DL application developed by RSE for the recognition of false voltage dips recorded by QuEEN. The idea of employing DL models is suggested by the fact that “false” events show typical patterns both in the voltage dips rms sequences and in the voltage waveforms, as highlighted in Section 2.1. Furthermore, this technique allows us also to consider any sequences of True + False events thus being able to potentially solve the undefined situations providing anyway a Boolean answer.
In brief, the input of the classifier is a “jpg” image representing the rms sequences associated to the voltage dip while the output are three possible classification labels: True (T), False (F) and True + False (T+F). The adopted DELFI model has been presented along with its training methods in [32]: its architecture is reported in Figure 5.
The training phase has been performed on a selected set of events: input data consist of a set of “jpg” images associated with all the output labels (T, F, T + F). The model implemented and optimized is based on a Convolutional Neural Network (CNN) [36] with only one hidden layer; its main characteristics can be summarized as follows:
  • 80%-10%-10% input data partitioning into the Training Set, the Development Set and the Test Set respectively (input data equal to 1300 image events);
  • Bayesian optimization (BO) [37] was adopted to assess the model hyper-parameters;
  • Softmax algorithm was used as a classifier.
The obtained CNN parameters have been reported in Table 1. Results presented in [32], referring to 130 events (Test test), achieved an overall accuracy equal to nearly 95%. In [34] the first application on a real case scenario of this classifier shows interesting preliminary results: in fact the not defined cases by the QuEEN criterion have been mostly classified as true by the DELFI classifier.

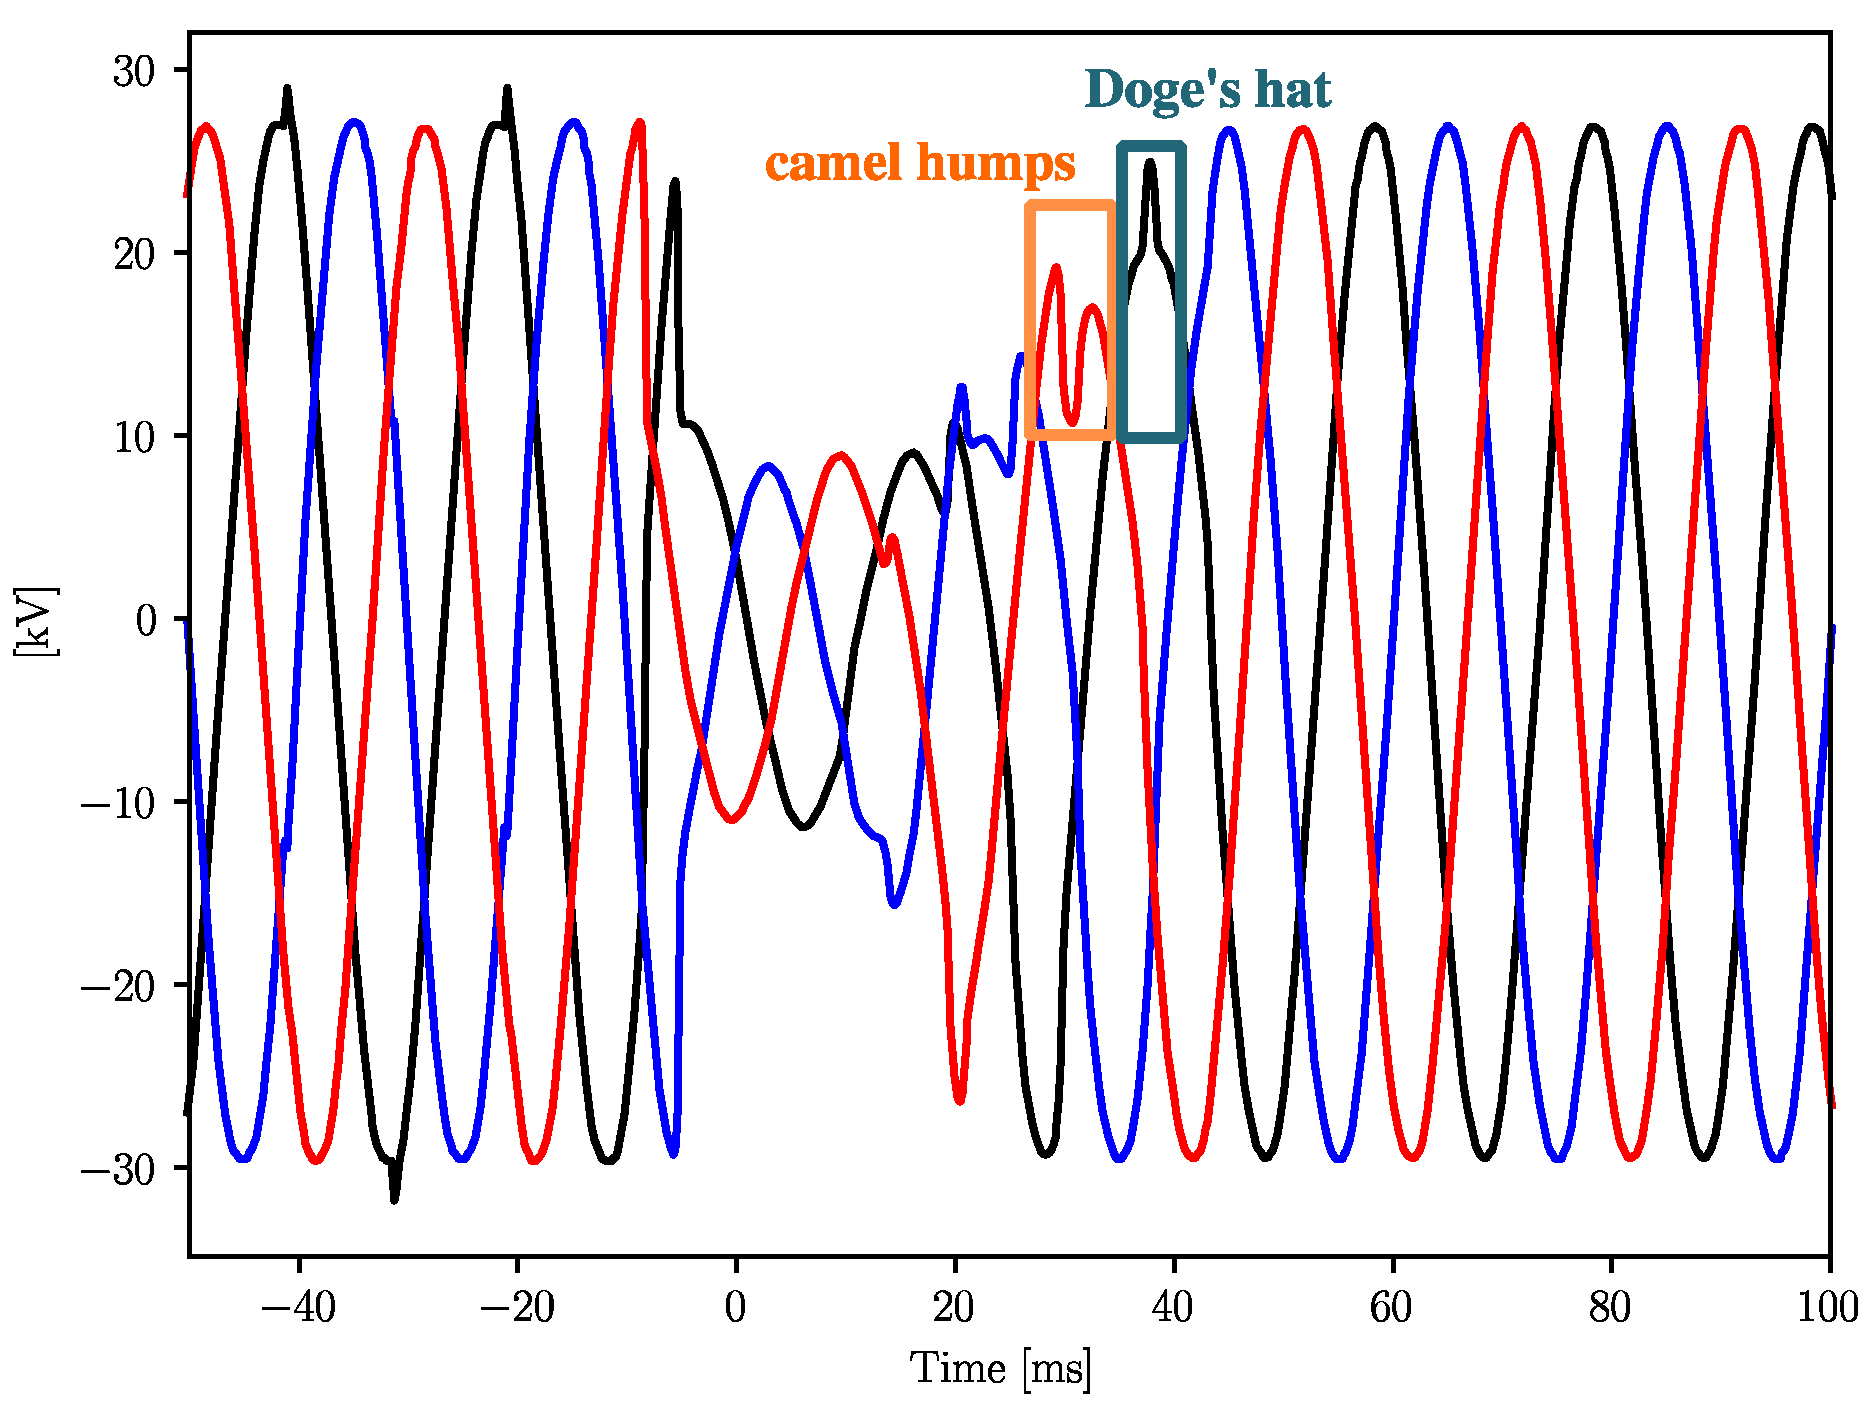
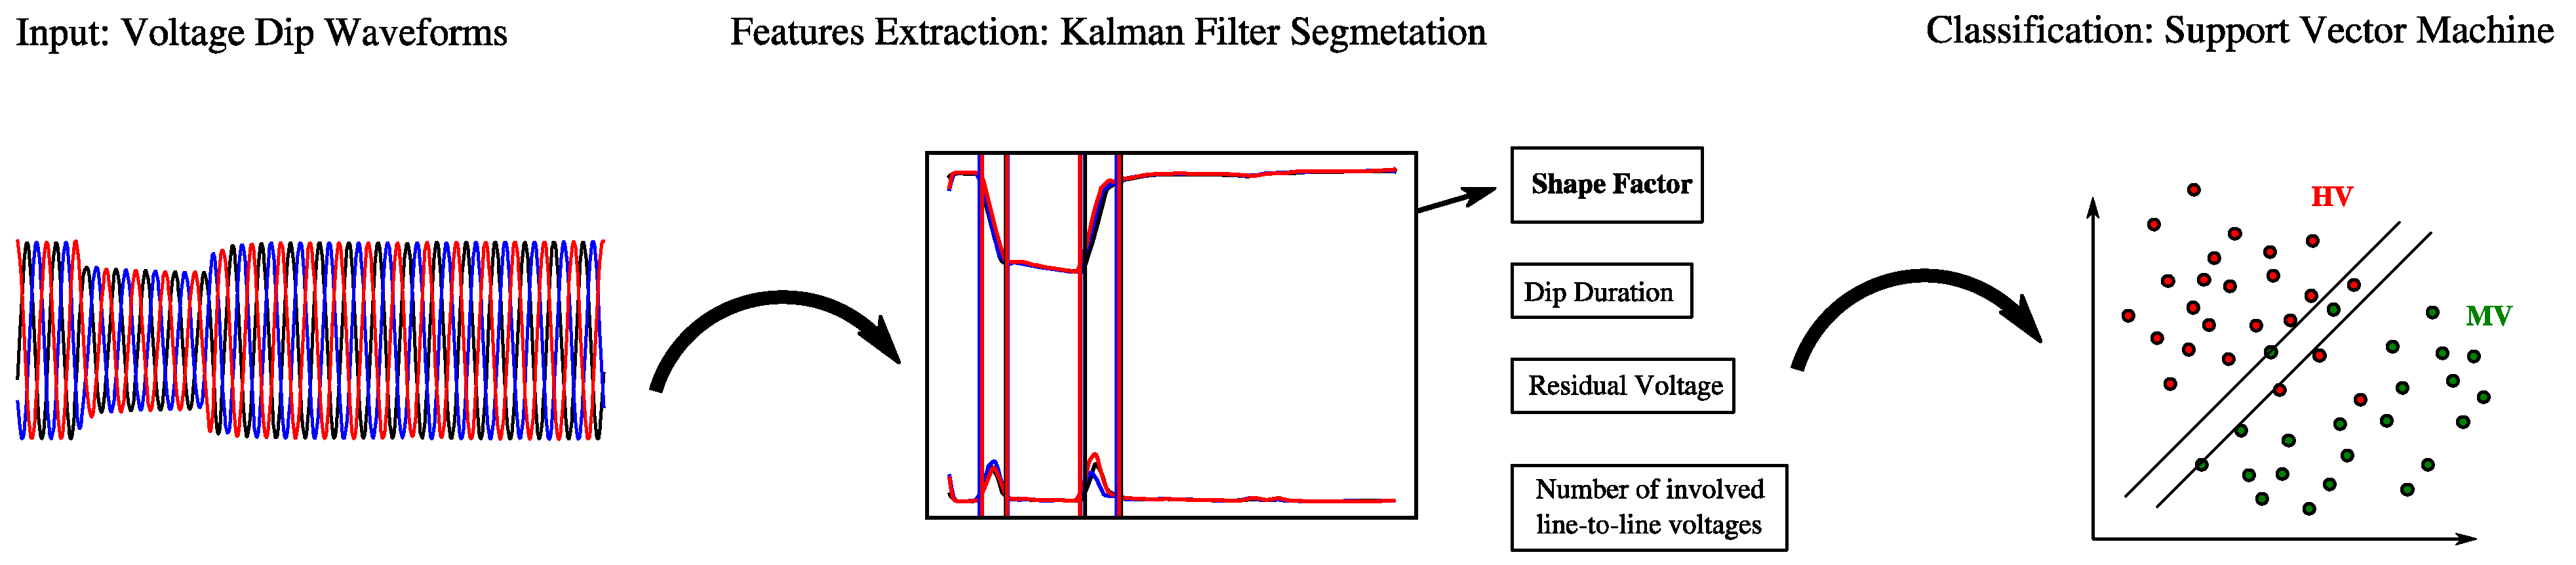
3.2. FExWaveS Application—Features Extraction from Waveform Segmentation

To overcome the drawbacks and limitations of the Global Method, as explained in Section 2.2, RSE proposed a Machine Learning application called FExWaveS (Features Extraction from Waveform Segmentation) to assess VDs origin [33]. This application basically performs the segmentation of the waveforms and assesses the events’ source location (upstream or downstream from the point of measurement) by means of a classifier.
As detailed in [35], the classifier has been recently trained on a real data set of nearly 2000 events thanks to a first integration of the algorithm in the QuEEN system. Results have shown a good consistency between FExWaveS and the Global Method. Indeed, GM performance depends on the knowledge of the HV topology and on the number of active MUs in the monitoring system while the FExWaveS application can work as a standalone algorithm and it requires only the acquisition of the event waveform. Its architecture is represented in Figure 6.
The application consists of two main blocks:
  • A segmentation algorithm aimed to estimate a “shape factor”;
  • Support Vector Machine classifier whose input features are the dip duration, its residual voltage, the number of line-to-line voltages involved and the shape factor. The output label of the classifier is the voltage dip origin (HV or MV).
The segmentation algorithm basically consists of a self-tuned Kalman Filter [38] applied to the voltage dip waveforms, the function of which is to estimate the fundamental and second harmonic component for each line–to–line voltage. Then, the transient segments are identified by looking at the second harmonic peaks [39], while the fundamental frequency component is employed to detect the voltage dips shape. Once the waveform has been segmented, a shape factor associated with each event is defined according to a “rules table” based on:
  • Number of transient segments;
  • Duration of the steady-state segments.
The following shape factors have been defined:
  • Rectangular;
  • Smooth Rectangular;
  • Not Rectangular;
  • Multistage Rectangular;
  • Multistage Smooth Rectangular.
Finally, a Support Vector Machine classifier has been applied since it is efficiently recommended for binary nonlinear classification problems. The algorithm is made of two phases: a kernel space mapping of the training set thanks to the kernel function (Gaussian Radial Basis Function Kernel). The second phase is the estimation of a separation hyperplane that minimizes the margin between the two classes (HV/MV events) [40].

3.3. QuEEN PyService Application

The QuEEN PyService is an automated tool developed by RSE in a Python environment that integrates the advanced functionalities in the QuEEN system. The system can interact with all PQ data stored in the QuEEN database, but it is mainly focused on the development of the DL classifier for the recognition of the validity and the ML algorithm for the original assessment of voltage dips. The architecture of the application is shown in Figure 7.
By querying the system in terms of MUs list and time period, the application directly establishes a connection to the server containing the stored data of the QuEEN database. The QuEEN PyService queries the database through SQL language. The developed tool is designed according to two main sections:
  • QuEEN Services: functionalities that directly manages a set of data stored in the QuEEN database regarding voltage dips, that means:
    о
    MU identification code;
    о
    start and stop event time stamps;
    о
    VD residual voltage;
    о
    VD duration;
    о
    QuEEN validity criterion output (2nd harmonic algorithm);
    о
    QuEEN origin criterion output (Global Method);
    о
    Occurrence of a distance protection start signal with the voltage dip;
    о
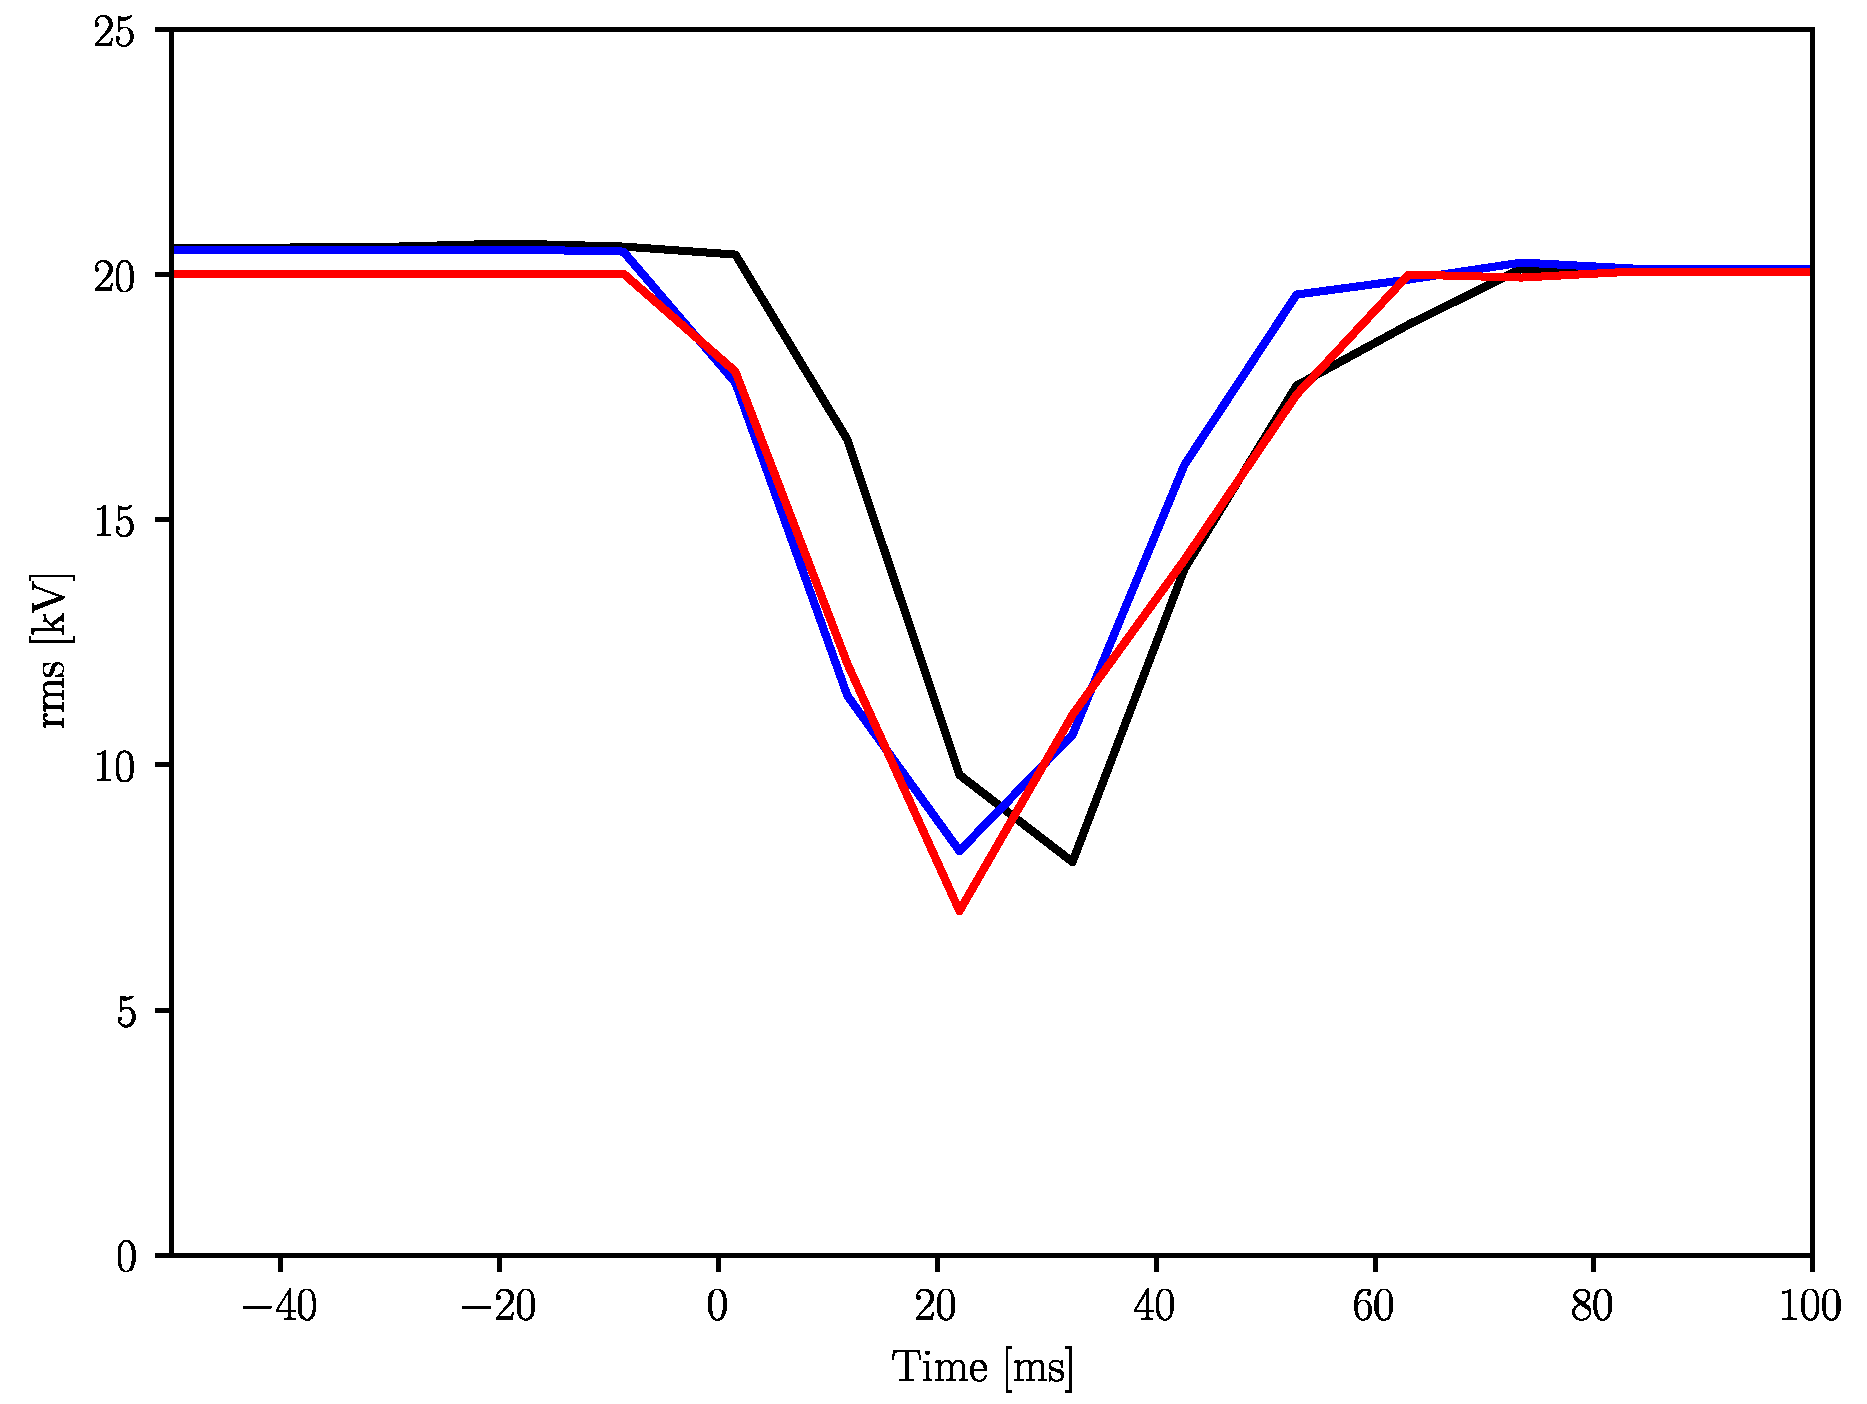
    Generation of an archive of images representing the rms values associated with each event.
  • Advanced Services: functionalities that integrate advanced applications namely DELFI and FExWaveS applications. The following operations are performed:
    о
    Application of the DELFI classifier for validity assessment: the system for each generated image performs the DL algorithm and stores the outcome, making it possible to compare the DELFI classifier outcomes with respect to those of the 2nd harmonic criterion.
    о
    Application of the FExWaveS classifier for origin assessment, applying the following procedure:
    If there is a concomitant occurrence of the distance protection start signal associated with the considered VD, the event is automatically classified as HV;
    If it is not, QuEEN PyService activates the FExWaveS application, applying the algorithm presented in Section 3.2. In both cases, the outcome is stored for comparison with that of the Global Method.
Thanks to QuEEN PyService functionalities it has been possible to adopt and test the advanced algorithms on a considerably huge database without changing the MUs involved. Moreover, future developments in the implemented models may be provided without changing the general architecture but just updating the model algorithms.

4. Validity and Origin Assessment: Comparison between Current and New Techniques

In this section, a comparison between the proposed methodologies is presented. Thanks to QuEEN PyService, voltage dips recorded by 150 MUs over the last four years, from January 2018 to April 2021, have been analyzed. The number of voltage dips analyzed is equal to 33,922. To have more extensive statistical samples, data have been aggregated between all years. For each collected event, voltage dip validity and origin assessments have been achieved by:
  • Current criteria:
    о
    Second harmonic criterion (validity).
    о
    Global Method (origin).
  • New criteria:
    о
    DELFI (validity).
    о
    FExWaveS (origin).
The new criteria have been implemented by adopting the models presented in [32] and [35], respectively for validity and origin assessment. For what concerns the DELFI, the Deep Learning classifier has been trained on a set of 1040 jpg images representing the corresponding voltage dips rms sequences and tested on 131 events. The achieved results in [32] show an overall accuracy of nearly 95%, while the accuracies reached for each label are 100%, 98% and 88% respectively for True, False and True + False labels. With regard to the FExWaveS application, the training phase has been performed on a data set of 3670 events. Overall accuracy computed on a test of 1574 events, presented in [35], has reached 91% and 87% respectively for HV and MV events.
It is important to highlight that the next sections will deal only with a comparison between current and new criteria. Results will be reported in terms of consistency and not accuracy. For each label, consistency has been defined as the percentage ratio between events that result in the same outcome for the current criterion and the new criterion with respect to the current classifier. This index cannot be considered a performance index of the classifier, as there is no certain outcome of the event. Finally, a comparison has been performed between the voltage dips duration frequency distributions obtained from the different criterion outcomes.

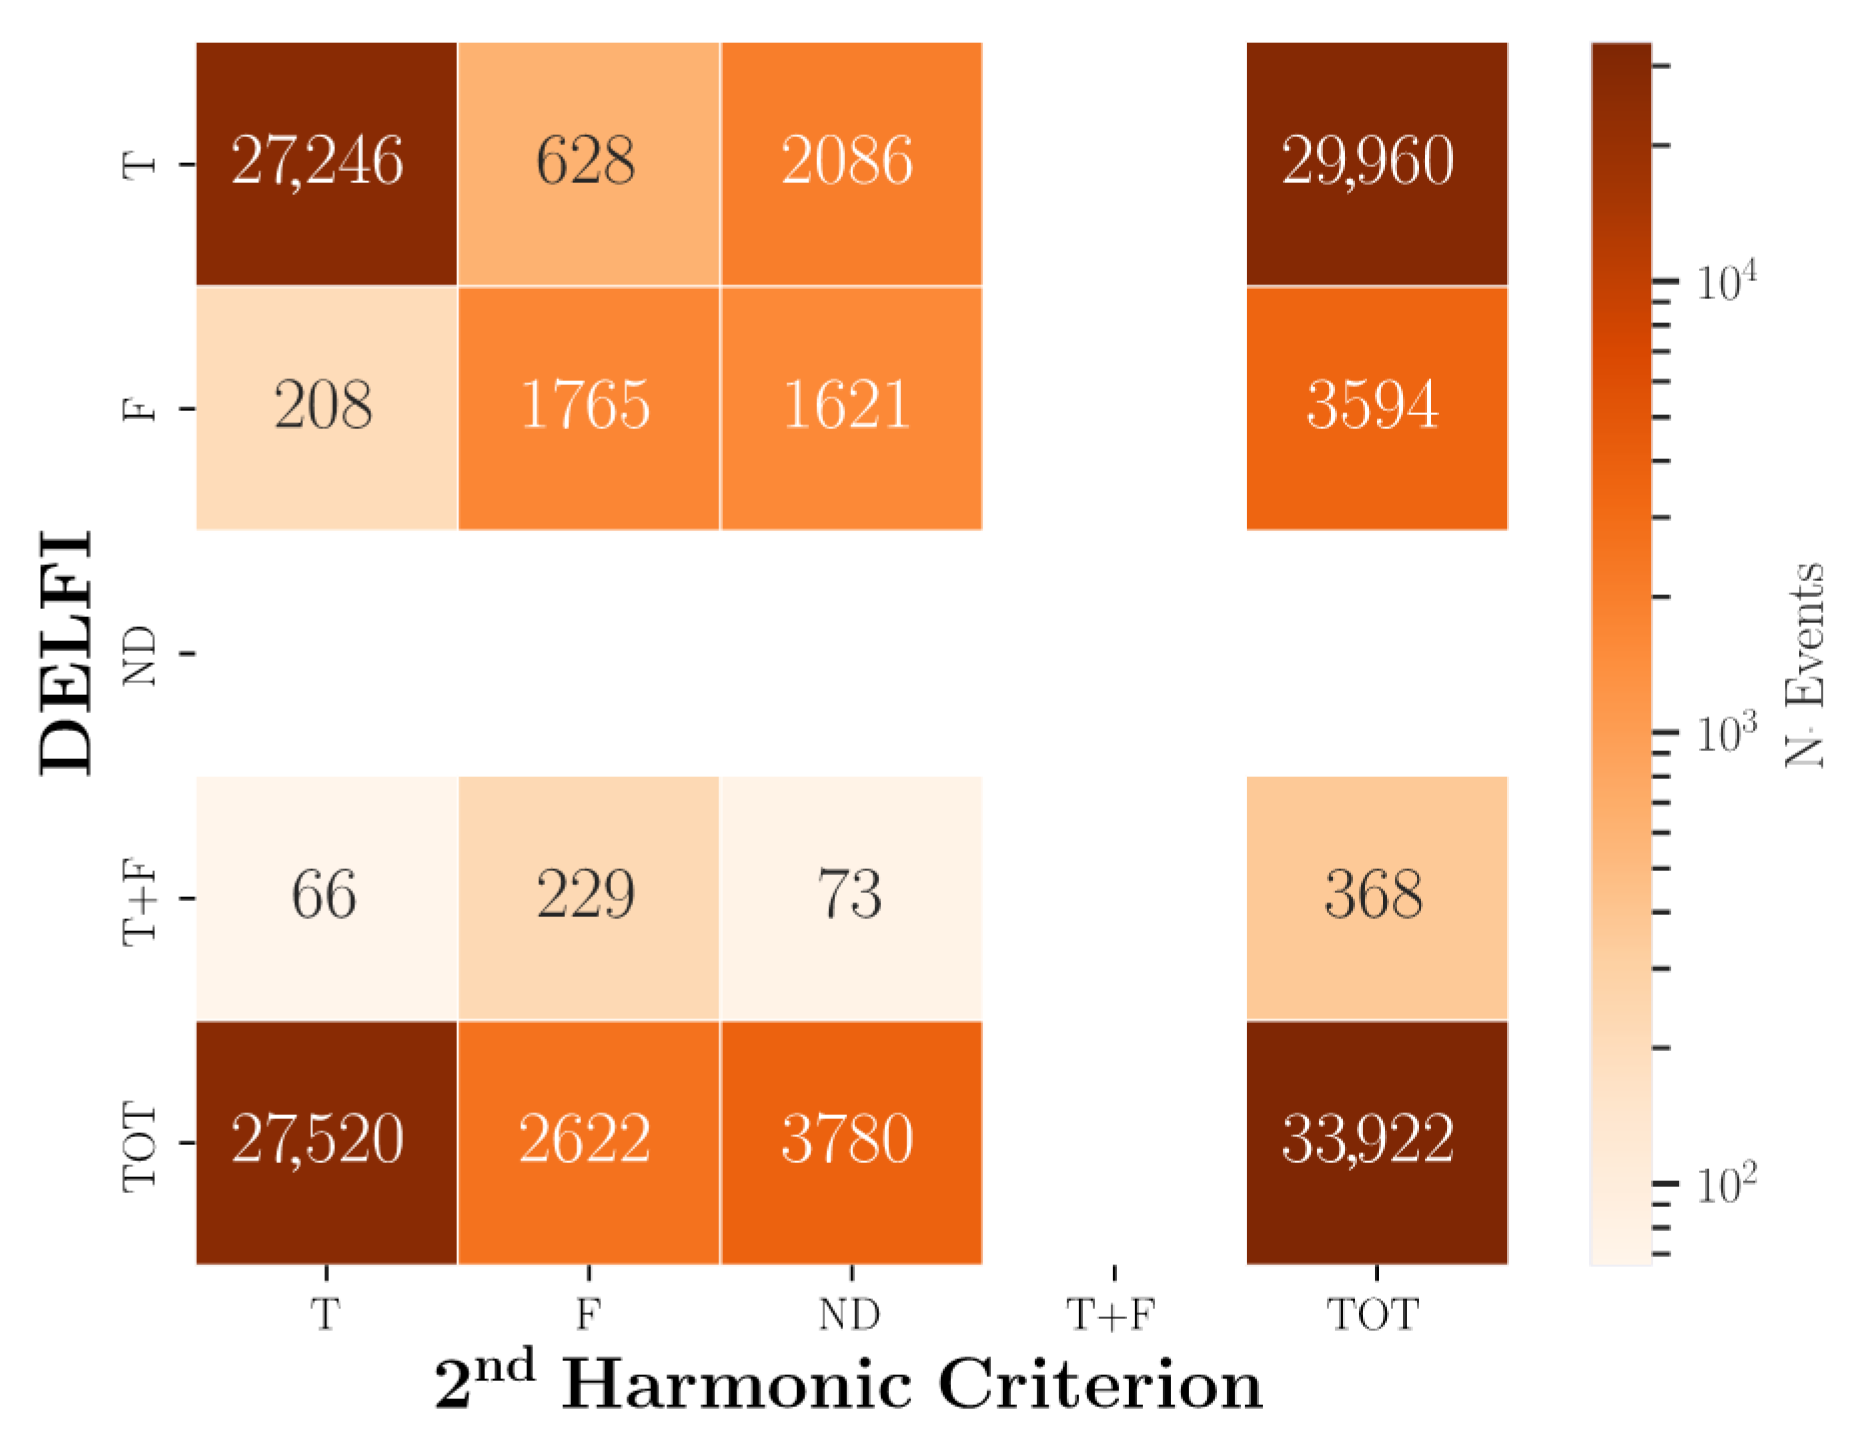
4.1. Validity Assessments Comparison

Let us consider the DELFI classifier outcomes with respect to the 2nd harmonic criterion ones. Results have been reported in Figure 8: the type of presentation chosen resembles the typical confusion matrix representation but, in this case, there is no reference method that establishes the correct outcome for each label. The results have been reported considering the following conventions:
  • The rows show the results of the DELFI criterion;
  • The columns refer to the outcomes of the 2nd harmonic criterion.
To better clarify the achieved results, some examples are given. Let us consider the cell identified by the combination (T, T), which means True row and True column, that is equal to 27,246: this value represents the number of events classified as True by both the criteria. Now let us consider the cell identified by the True and Not Defined labels (T, ND): 2086 represents the number of events classified as Not Defined (ND) by the 2nd harmonic Criterion and as True (T) by the DELFI criterion. By looking at the cell (T + F, F), 229 stands for the events classified as False (F) by the 2nd harmonic criterion but considered as True + False by the DELFI application. It can be noticed that the T+F columns and the ND row are always null; this is expected as the 2nd harmonic and DELFI criteria do not have the outcomes True + False (T + F) and Not Defined (ND) respectively.
To better understand the comparison between the two proposed approaches, the results shown in Figure 8 have been reported in Table 2 in terms of consistency with respect to the outcomes of the 2nd harmonic criterion.
Looking at the results shown in Table 2, the following consideration can be drawn: the 99% of the True events according to the 2nd harmonic classifier are classified as true also by DELFI so that it can be stated that, for the True Label, there is a high consistency between the methods. Only 1% of the considered events has no coherent outcomes. Conversely, by looking at the False outcomes achieved by the current criterion, a considerable difference is highlighted: in fact, the 24.0% of False events for the current criterion are classified as True by the DELFI, while only 67.2% have the same outputs. The Not Defined events, given by the 2nd harmonic criterion, are classified for the 55% as True by the DELFI classifier, while the remaining 45% are mostly classified as False (nearly 43%).
Finally, Table 3 shows the number of events for each label and for both the current and new criteria, expressed as a percentage of the total number of events.
Comparing the new criterion with respect to the current one, it can be stated that the number of True events is significantly increased, reaching almost 88.3% of the total number of monitored voltage dips. On the other hand, the number of False slightly increases, passing from 7.7% (reached by the 2nd harmonic criterion) up to almost 10.6%. The number of True + False events represents only 1.1%.

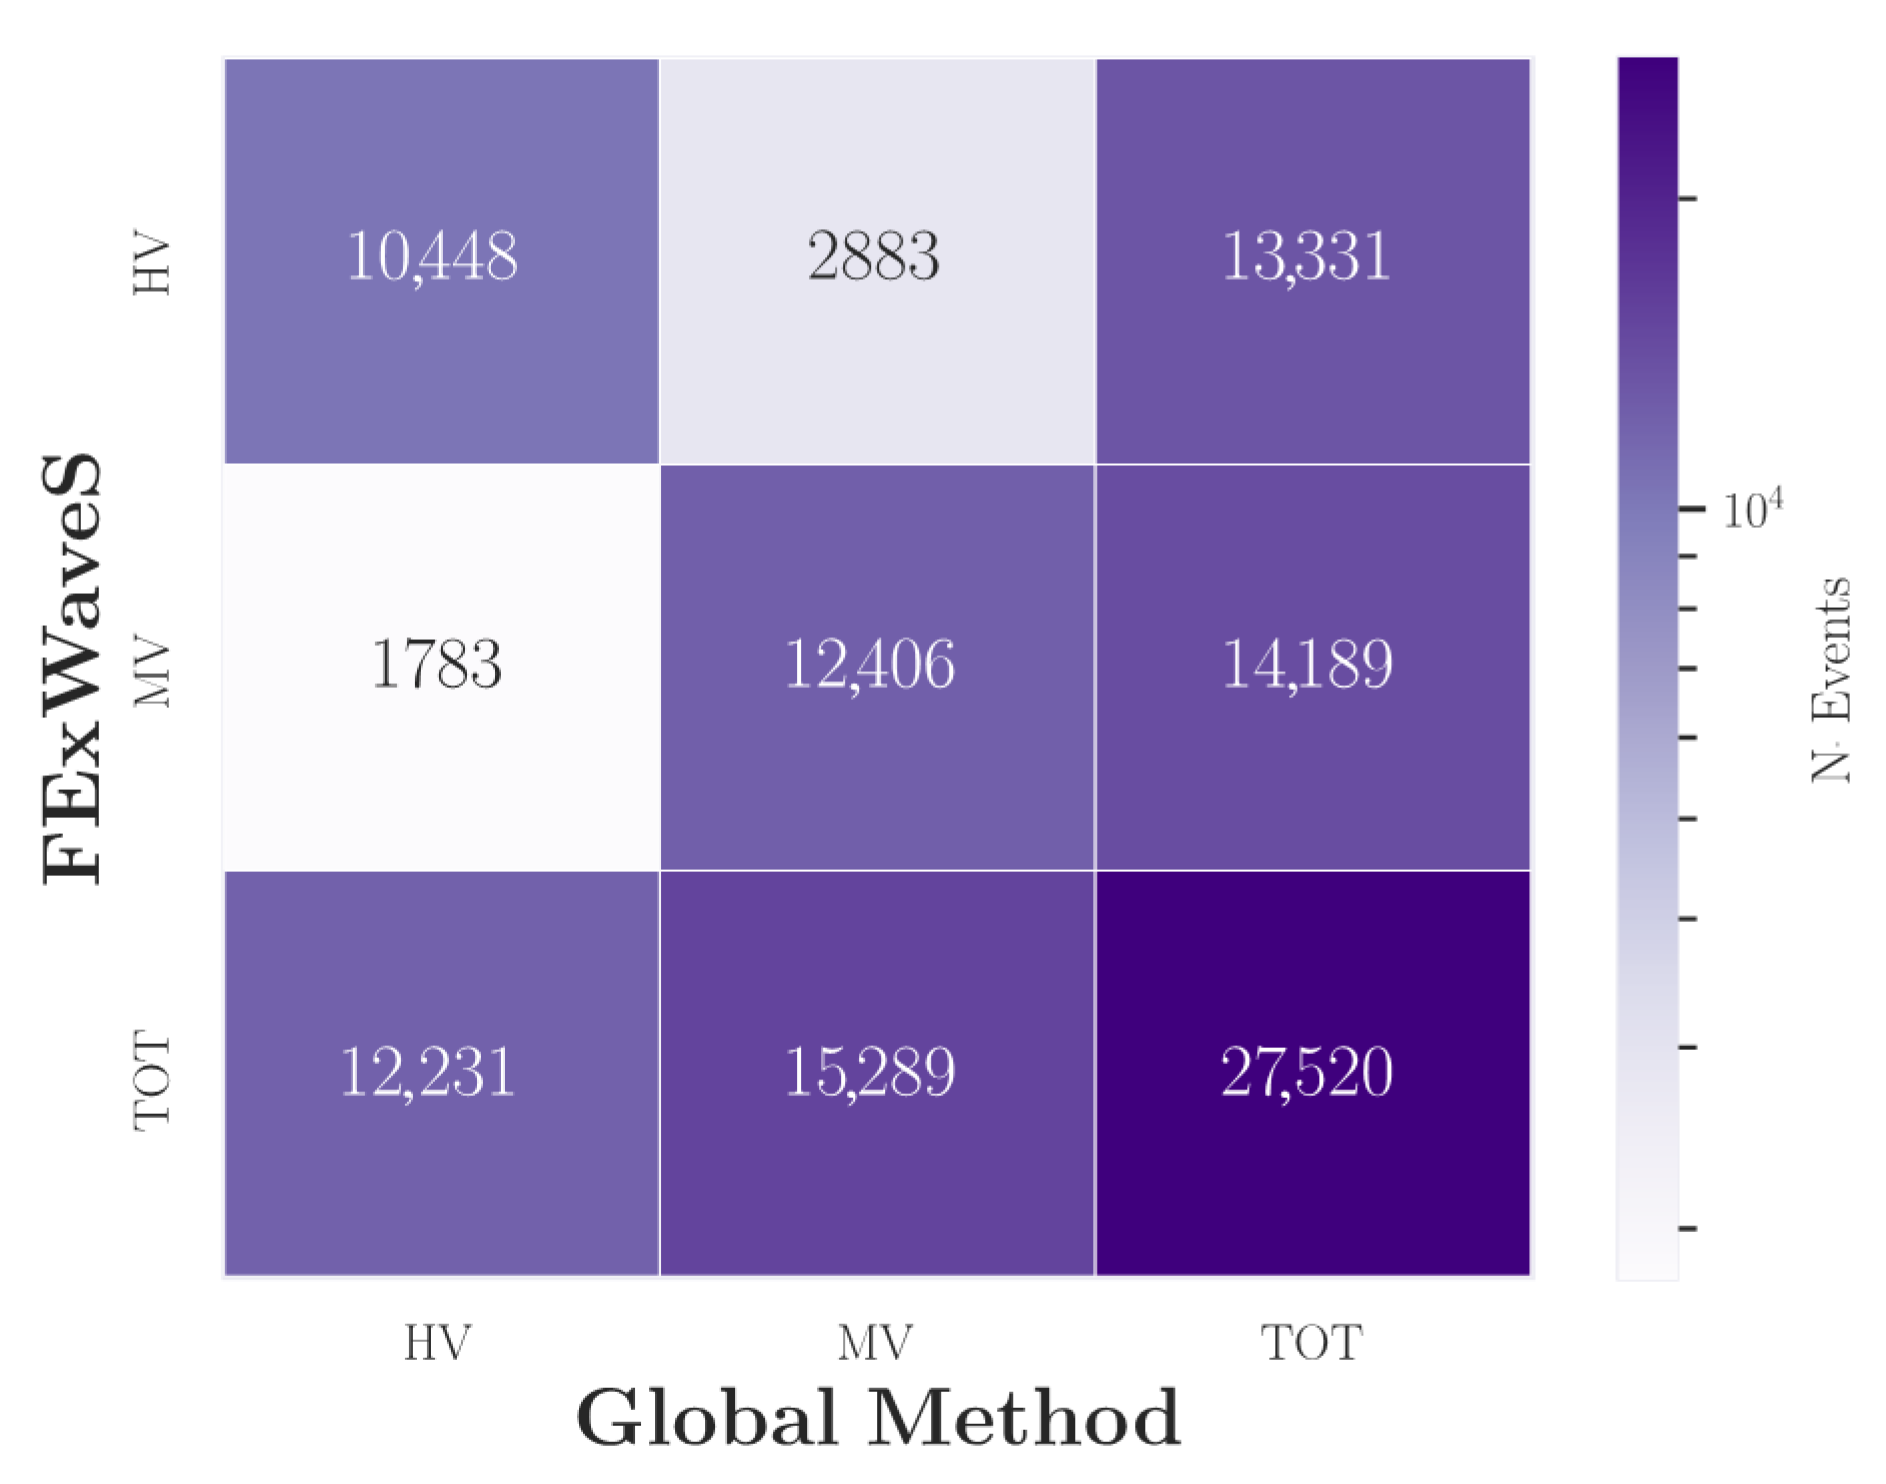
4.2. Origin Assessments Comparison

As performed for the validity, the outcomes for FExWaveS and Global Method have been carried out. The total number of voltage dips considered for the comparison is equal to 27,520, namely the total number of True events by adopting the 2nd harmonic criterion. In fact, as described in Section 2.2, the Global Method is applied only to these events. On the other hand, FExWaveS has been applied to all recorded events.
In Figure 9 the outcomes are reported according to the conventions already used for validity comparison so that the rows refer to the FExWaveS outcomes, while the columns to the Global Method ones.
In the cell identified by the pair (HV, HV), HV row and HV column the number of events classified as of HV origin is reported by both the criteria (10,448). As another example, by looking at cell (HV, MV), 2883 are the events classified as of MV origin by the Global Method but considered as of HV origin by the FExWaveS application. By looking at the overall result, it can be highlighted that FexWaveS classifies more events as HV than the Global Method (13,331 vs. 12,231 events).
Moreover, the degree of consistency between the two proposed methods (how FexWaveS agrees with the GM results) is shown in Table 4; for each origin label, the criteria consistency is expressed in percentages with respect to the Global Method outcomes.
Consistency results show that a higher degree of accordance is achieved for the HV label with respect to the MV one (85.4% vs. 81. 2%). The higher consistency for the HV label can be justified as FExWaveS outcomes show a prevalence for this label compared to the Global Method. To confirm this, the number of events for each label and for both the current and the new criterion, expressed as a percentage of the total number of events, has been reported in Table 5. The new criterion increases of 4% the HV voltage dips with respect to the current one, (48.5% vs. 44.5%) while, obviously, decreasing the MV ones (51.5% vs. 55.5%).

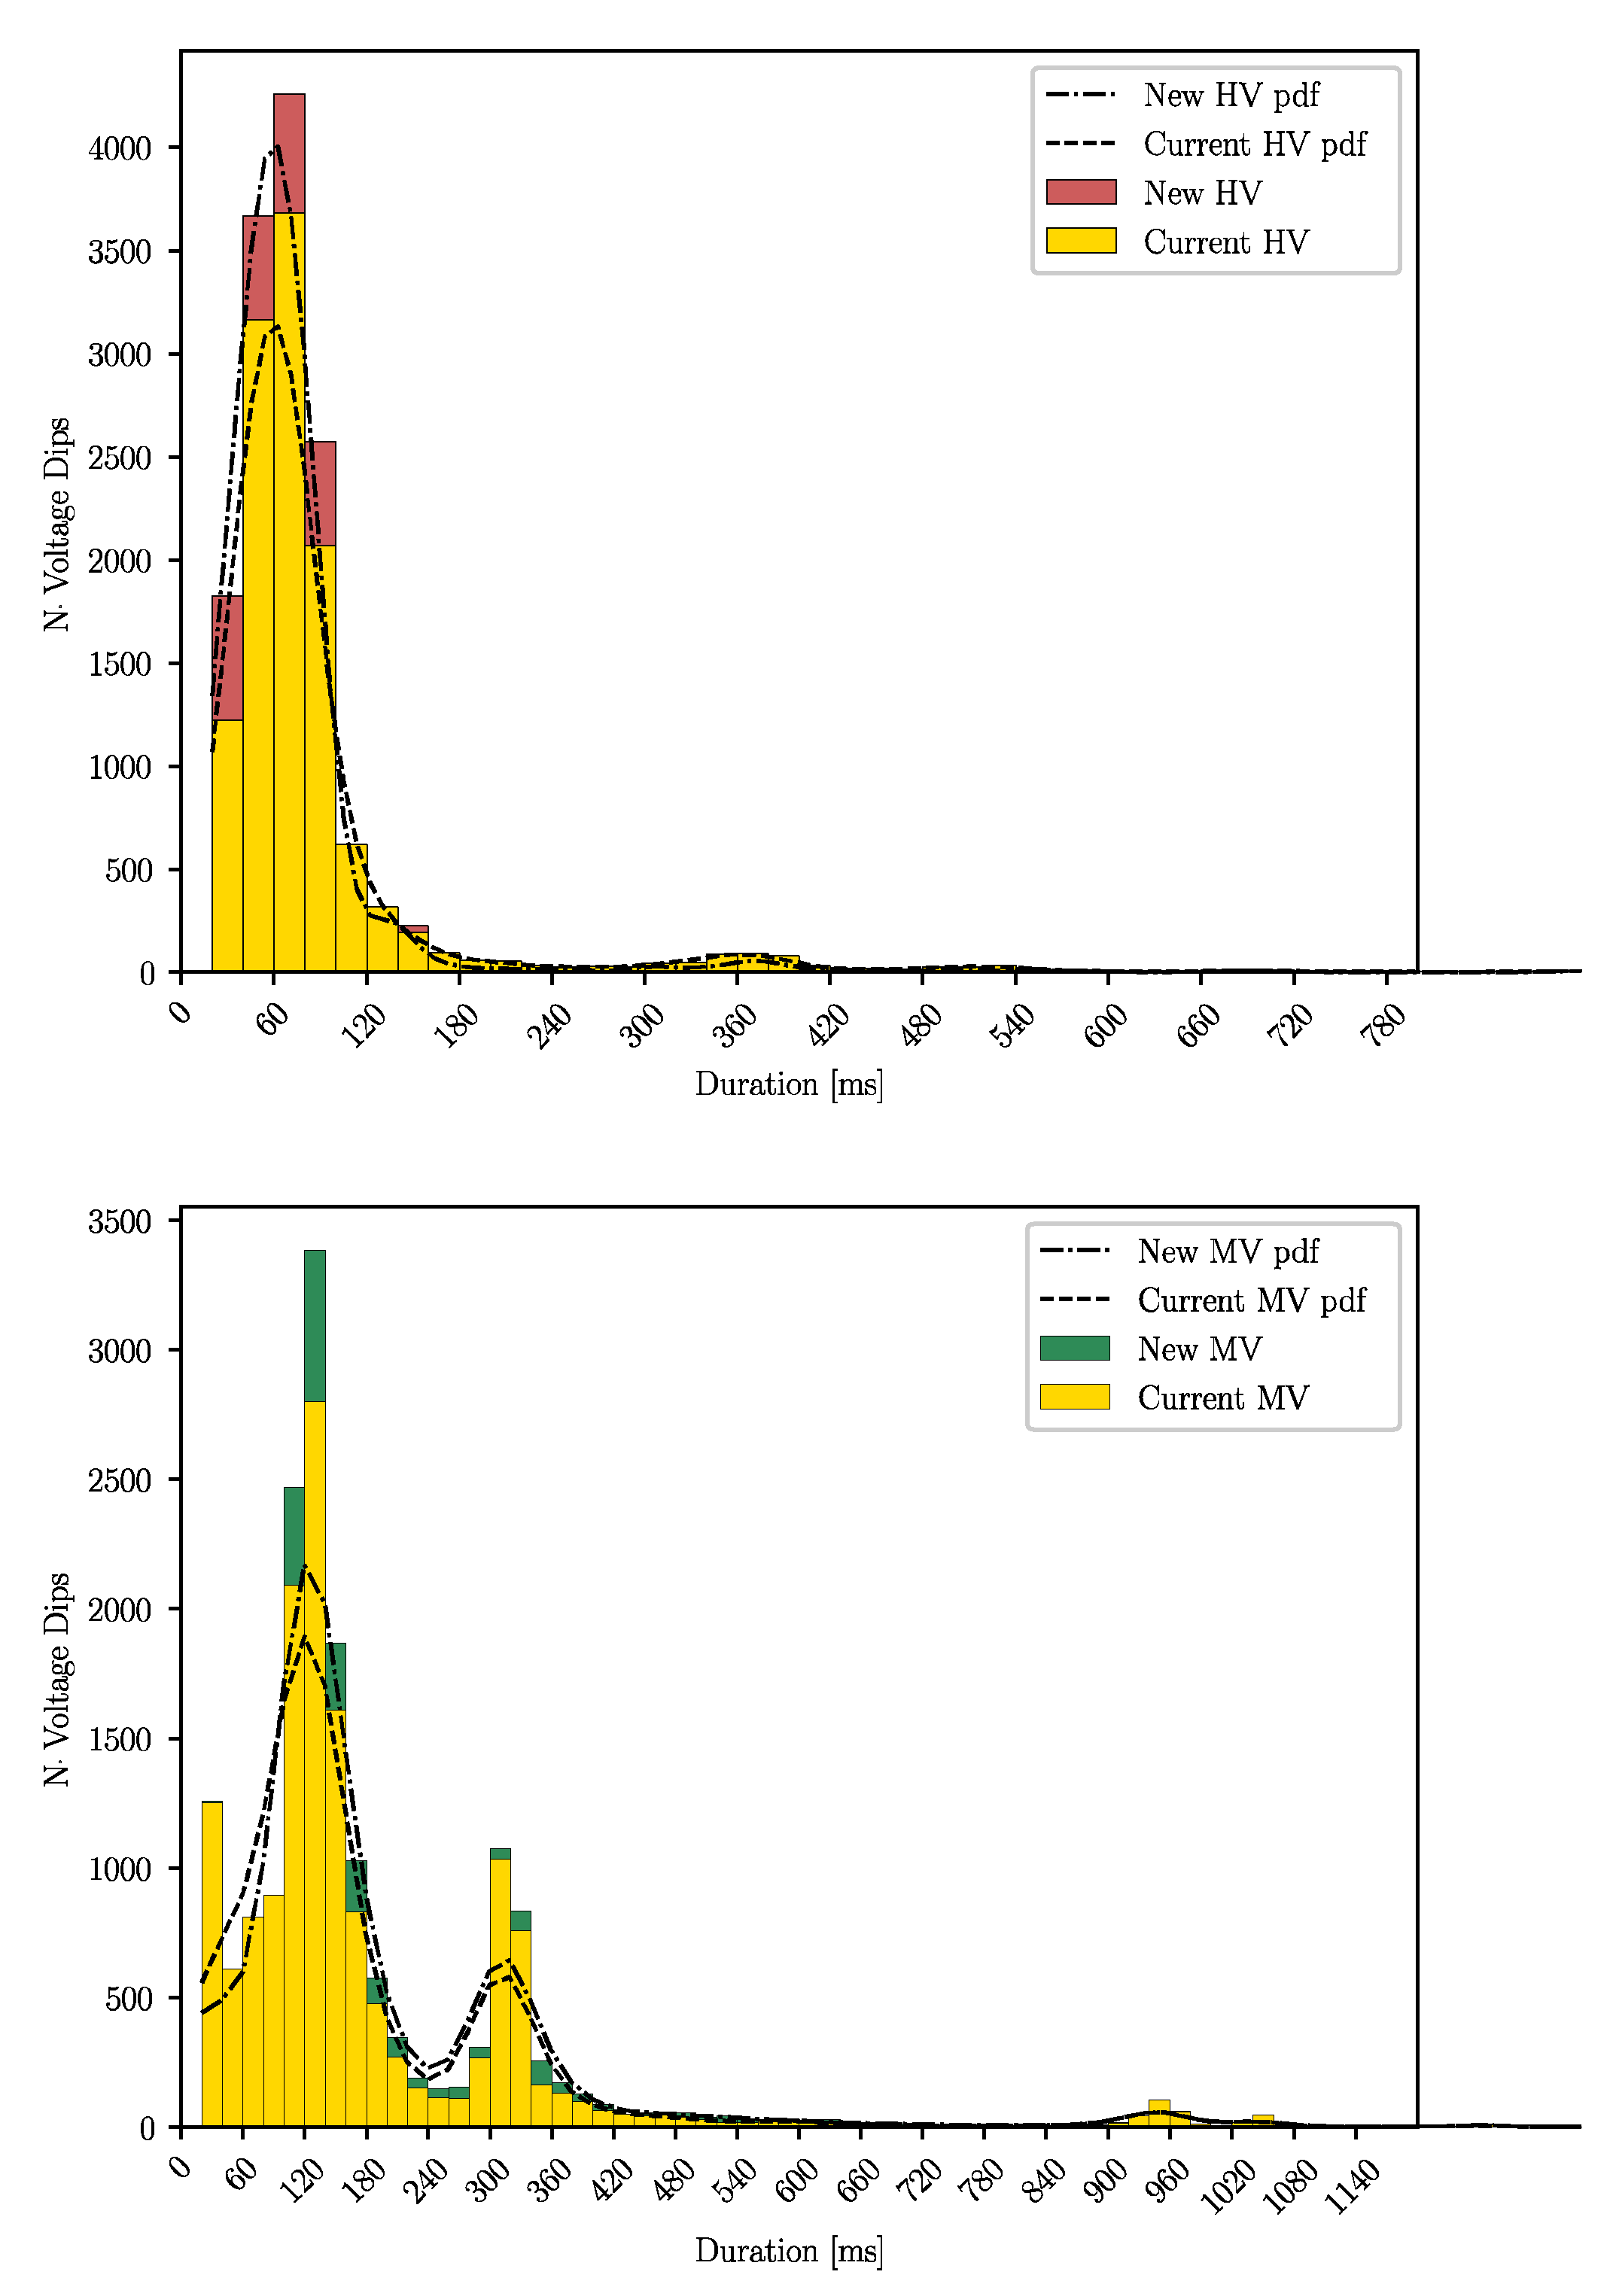
4.3. Voltage Dips Duration Frequency Histograms

The comparisons performed in the previous sections have shown that a good degree of consistency has been reached between the criteria. To confirm the goodness of the achieved results, another kind of analysis can be performed. Voltage dips durations are strictly correlated to the protection tripping time of the distribution and the transmission protection systems [16]. For this reason, the frequency histograms of voltage dip durations have been reported in Figure 10, for both the criteria and divided by the event’s origin (HV and MV). The histograms have been built considering only the True events categorized by the corresponding criterion (DELFI for new criterion and 2nd harmonic for current criterion). Then, the same approaches have been applied to assess voltage dip origin (FExWaveS and Global Method for new and current criterion respectively).
Let us consider the result concerning MV origin for both the criteria; it can be pointed out that both the graphs (green and light green for new and current criterion respectively) present two peaks: the first peak occurs at 120 ms while the second at 320 ms. These values can be correlated to a fault extinction, in the MV grid, following a protection trip. The first value can be attributed to the third overcurrent threshold (~1400 A) that is set to the inherent tripping time (~50 ms) plus the opening time of the circuit breakers (60–70 ms), while the second one corresponds to the second overcurrent threshold (~800 A) whose tripping time is typically set to 250 ms plus the opening time of the circuit breakers. Moreover, it can be noticed that the first peak is more pronounced for the new criterion than for the current one, while the histograms have the same behavior for the second peak.
Looking at HV origin histograms (red and light red for the new and the current criteria respectively) the peak occurs at 60 ms, which is the typical extinction time of the distance protection relays installed on the HV side of the PSs. Comparing results between new and current criteria, the peaks are more marked for the new approach.
In conclusion, both approaches show consistent results with respect to the protection system of the PSs.

5. Severity Analysis

QuEEN PyService application allows performing advanced PQ analysis on stored events in the QuEEN database. In particular, the objective of this section is to compare and highlight the application of the new criteria on the voltage dips characterization in terms of severity with respect to the current criteria. Moreover, the analysis has been carried out from a macro-regional point of view as defined in Section 2.
Voltage dips severity is determined by considering their duration and residual voltage as prescribed by EN 50,160 standard [2] in which is proposed as a classification table that is reported in Figure 11.
Starting from these characteristics, different indices and classification methods have been proposed in the literature [18,19]. One of the key features that PQ metrics have to assess is the evaluation of the voltage dip impact on the users (typically industrial users) together with the allocation of responsibility between them and the DSOs.
Among them, N2a and N3b are considered the most suitable metrics thanks to their simplicity and their straightforward definition. In fact, they respectively count, without any kind of weighting, the events that fall below the immunity zones for Class 2 [41] (dashed-yellow line in Figure 11) and for Class 3 equipment [42] (continuous-red line in Figure 11). Moreover, the N3b fits the requirements in terms of responsibility between the user and the DSO: it counts the number of voltage dips below the so-called “responsibility curve” between the two subjects and could be a possible “candidate” for MV network regulation purposes for their ease of interpretation. Once the PQ metrics are defined, the following analysis are performed by comparing the results achieved by the two proposed methodologies:
  • Current Criteria:
    о
    Evaluation of True Voltage Dips adopting the 2nd harmonic criterion;
    о
    Computation of N2a and N3b;
    о
    Identification of the contributions of HV and MV origin through the Global Method.
  • New Criteria:
    о
    Evaluation of True Voltage Dips adopting the DELFI criterion;
    о
    Computation of N2a and N3b;
    о
    Identification of the contributions of the HV and MV origin through the FExWaveS application.
Before computing the chosen metrics, another important aspect has to be considered: the installed MUs may be out of service (permanently or temporary) due to faults or maintenance that occurred during the selected time period. To have a significant statistical analysis for each considered macro-region area, it is important to define the Equivalent Measurement Point (EMP) per year. The EMP evaluates the number of measurement devices that have been in operation during the period under consideration in the already defined macro-regional areas; it is defined as:
EMP MRA = N M U NRA N actual   operation   weeks N M U MRA N theoretical   operation   weeks N M U MRA
Where N° MUMRA represents the number of measurements units belonging to the considered macro-regional area.
In the next sections, the analysis has been performed in terms of N2a and N3b indices with respect to the EMP (relative indices) and with respect to macro-regional areas so that macro-regional severity levels have been evaluated in terms of the number of severe voltage dips per equivalent measurement point (N°/EMP). Moreover, the indices have been divided in terms of overall events (user point of view), MV events (DSO responsibility) and HV events (TSO responsibility).

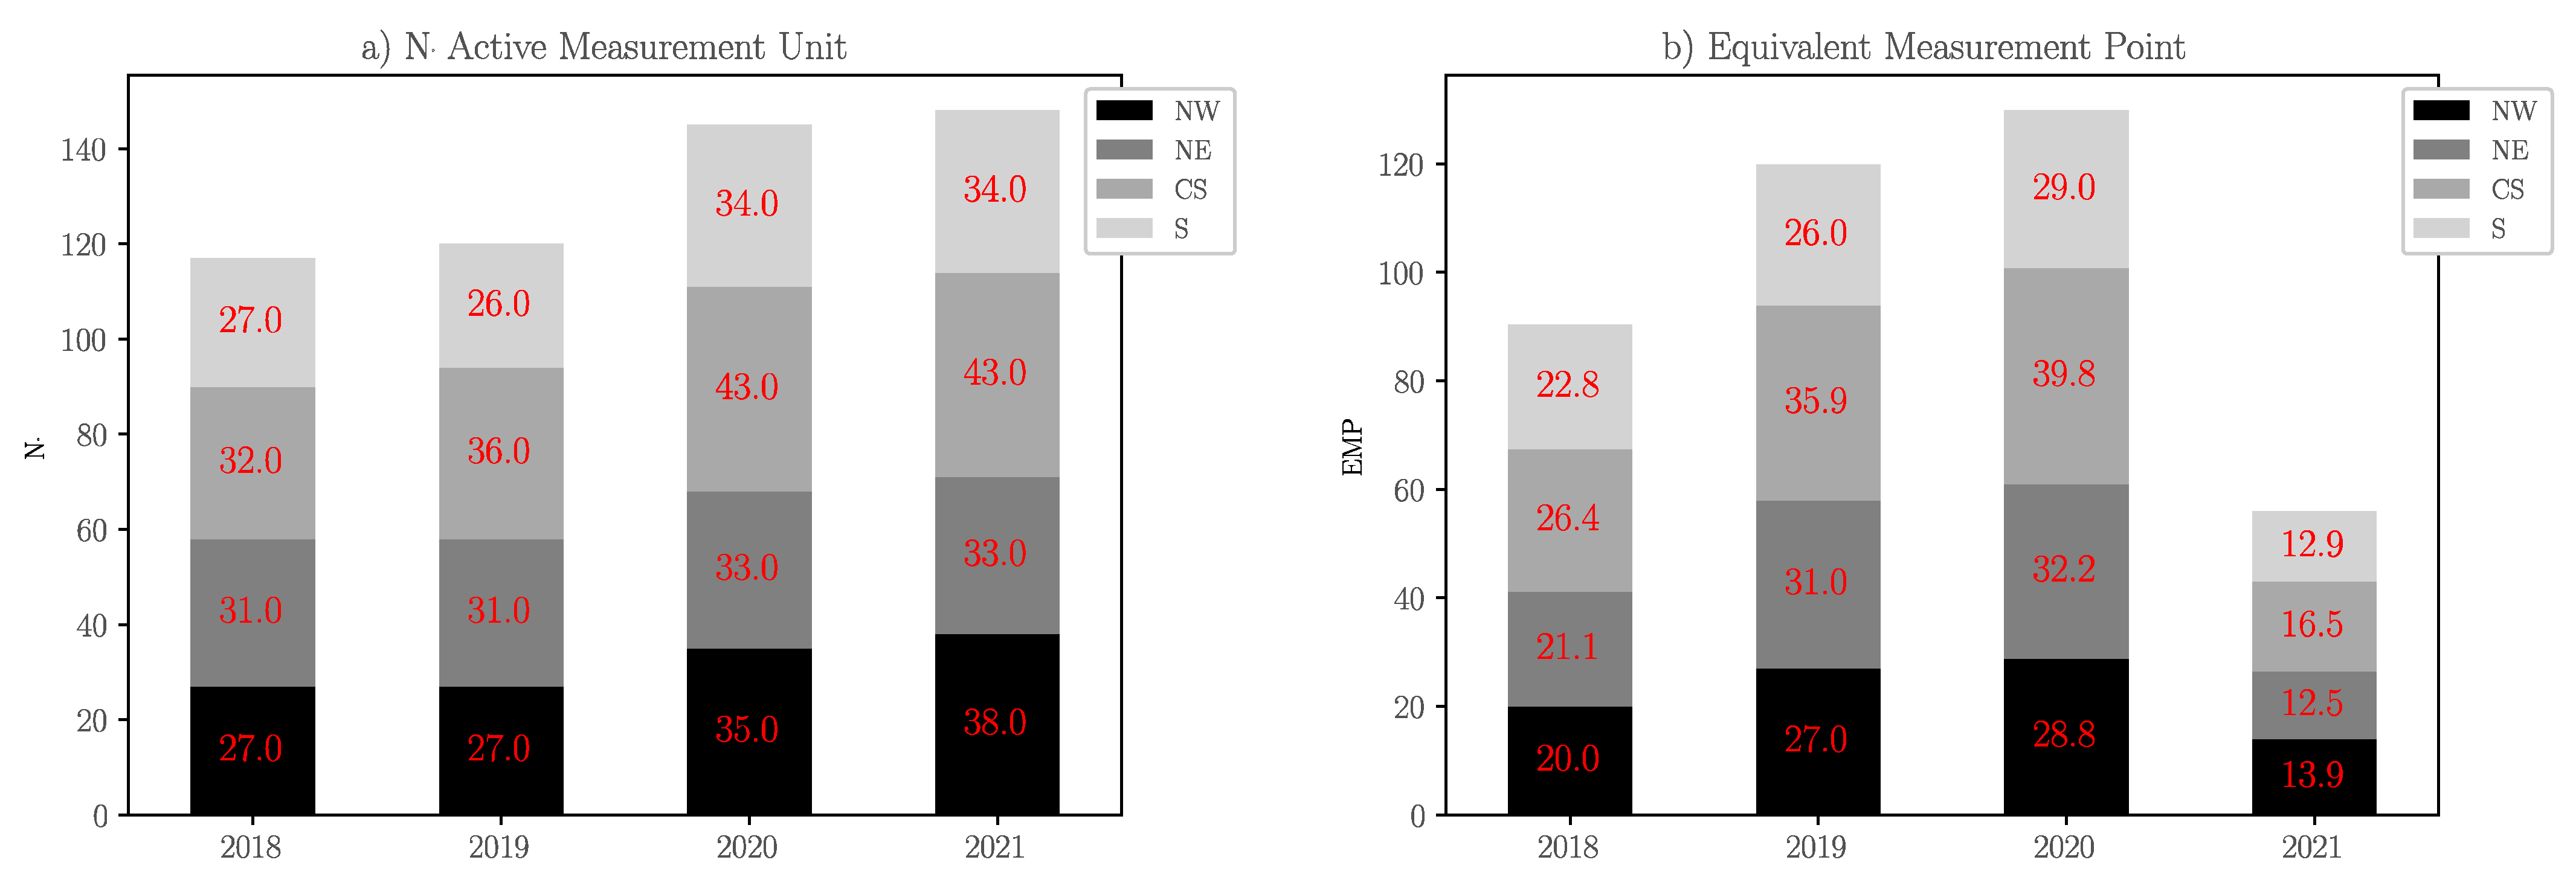
5.1. Macro-Regional Area Analysis

Each MU has been associated with one of the macro-regional areas presented in Section 2 and re-listed here for sake of clarity:
  • North-West (NW)
  • North-Est (NE)
  • Center-Sardinia (CS)
  • South (S)
The 150 MUs considered in this work have been chosen to have as much as possible a uniform statistical distribution in terms of geographic location and operating time. Thanks to the QuEEN PyService application, it is possible to monitor each MU in terms of operating weeks; in this regard Figure 12a,b respectively report the number of active MUs and the EMPMRA, computed through (1), for each macro-regional area and for each year.
Results show that the number of active instruments changes over years but the ratio among the different macro-regional areas remains nearly the same. The EMP has a positive trend for each macro-regional area from 2018 to 2020 according to the number of active MUs. The decrease of EMP in 2021 is since only data from January to April have been considered.
Before presenting severity analysis results, it should be remembered that N2a and N3b have been computed considering only the True events (respectively for each implemented criterion). For this reason, in Table 6 the number of True events for each year are shown for both the criteria:
The number of True events rises by an average of 9% when the new criteria have been adopted compared to the current ones. The number of True voltage dips divided for each macro-regional area and their percentage difference (third columns) is instead shown in Table 7.
From Table 7, it can be noticed that for each year and for both the criteria, the number of True voltage dips is maximum in the South area, followed by Central-Sardinia, North-East and North-West areas. The relative weights between the macro-regional areas do not change with respect to the criteria adopted. In fact, the number of VDs for the S area represents nearly 47% of the total number of events while the CS, NE and NW represent 27%, 13.5% and 12.5% respectively.
With regard to the comparison of the criteria, the increase of True events in all macro-regional areas, given by the new criteria, is in line with the results presented in Section 4.1, therefore, it can be stated that the Not Defined events, classified by the 2nd harmonic criterion, are mostly classified as True events by the DELFI criterion.

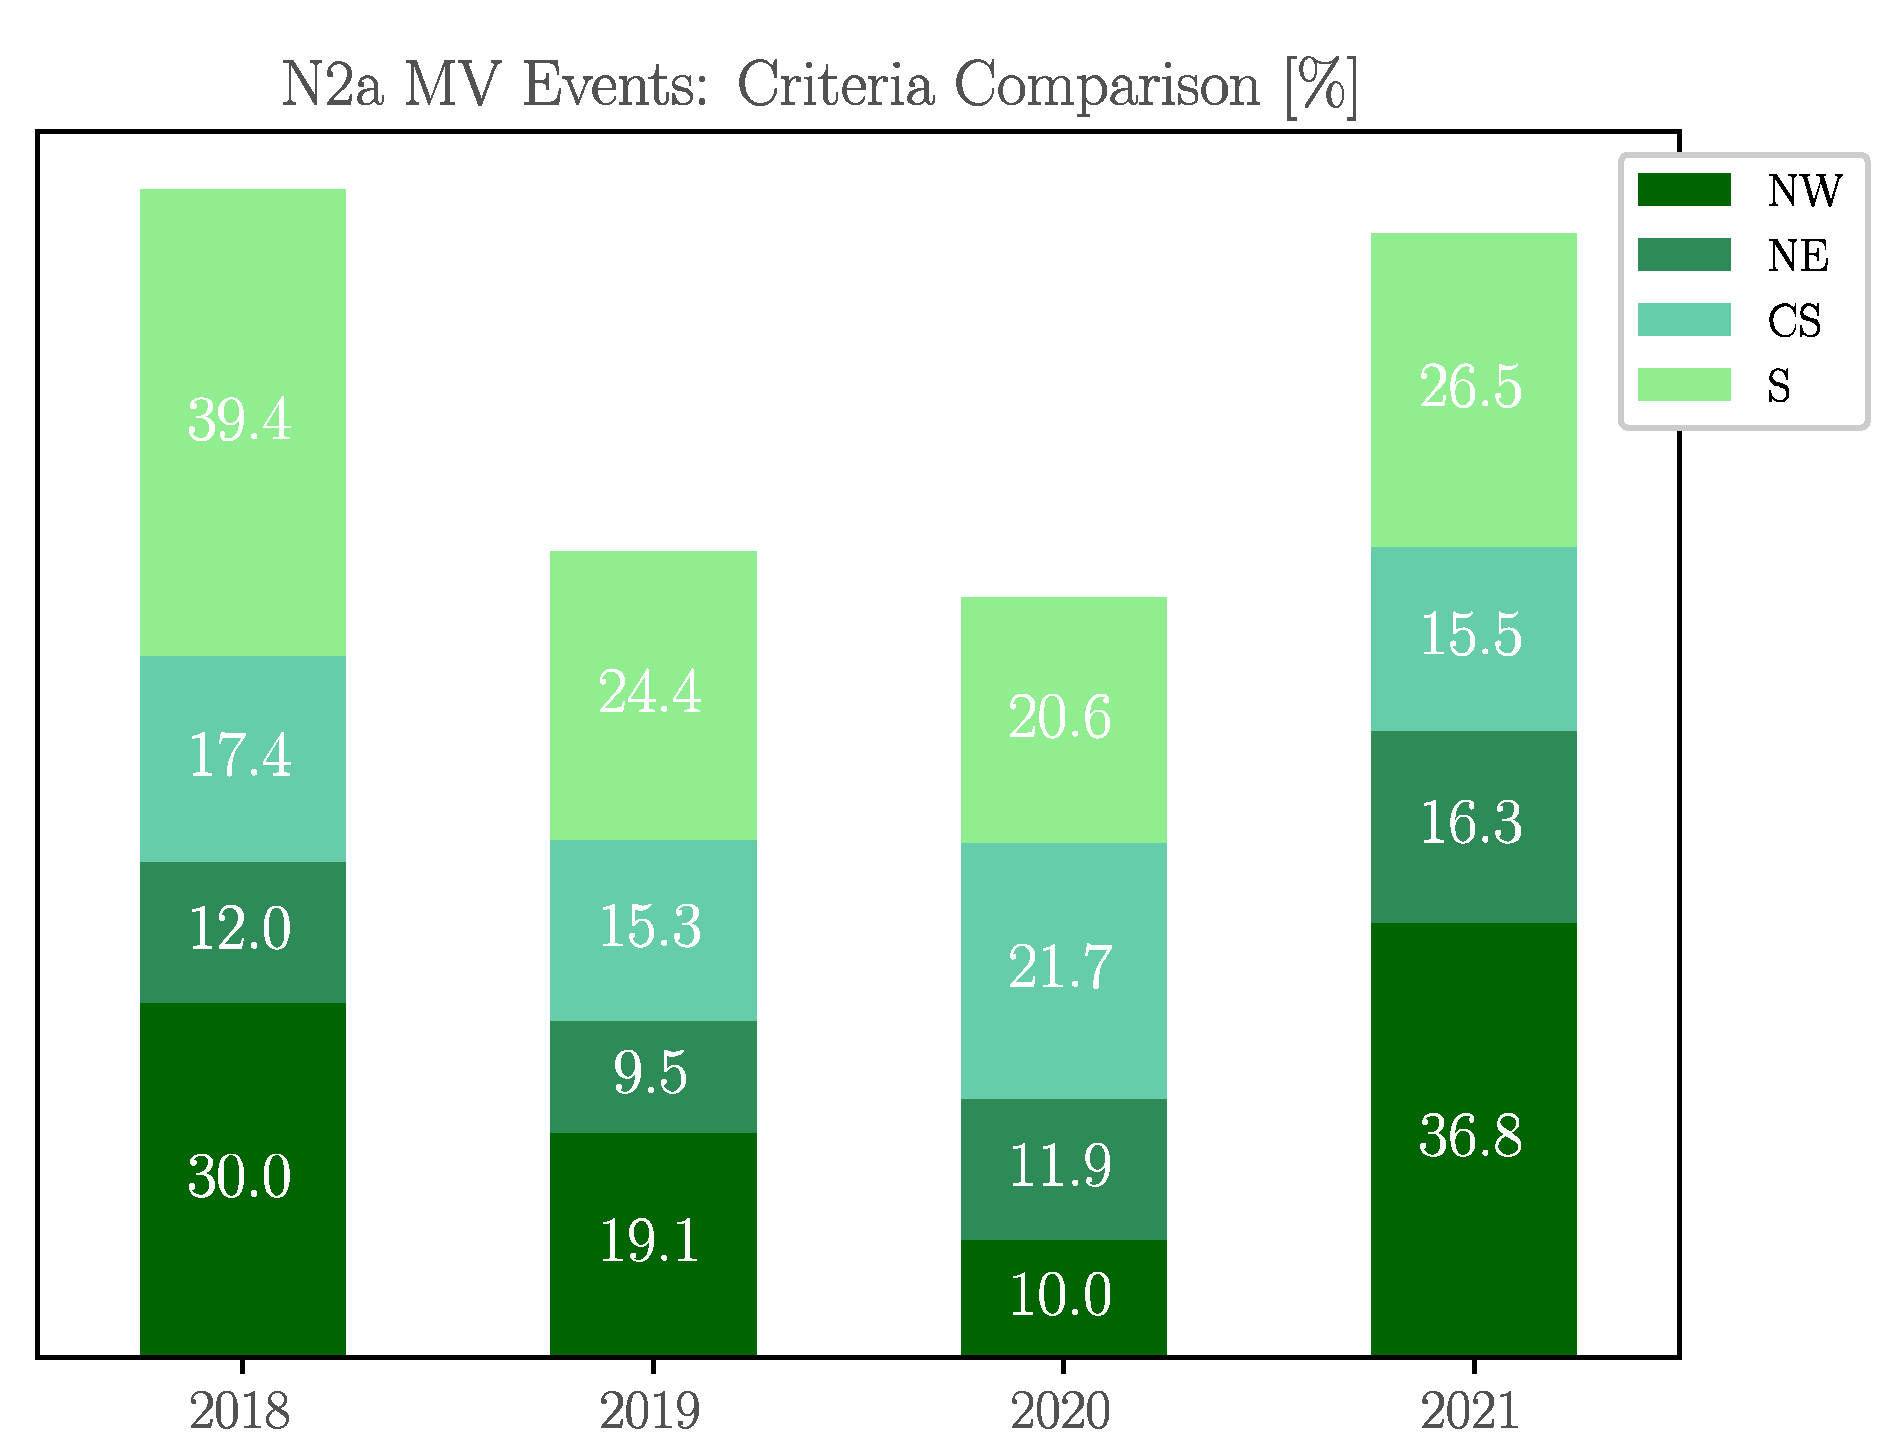
5.2. N2a Comparison: Current vs. New Criteria

With regard to the first PQ index N2a, the metric has been computed for each year aggregating data over the Mus, taking into account for both the criteria: (i) all the events (Table 8 for the user point of view); (ii) only MV events (Table 9 which refers to the DSO responsibility); (iii) the HV events (Table 10 referred to the TSO responsibility).
Looking at Table 8, the use of the new criterion increases the N2a on average by 18% compared to the current one. The increase in N2a is considerably higher than the enhancement of True events (9%): this means that the “recovered” True events are not negligible events, and they contribute significantly to N2a.
Now let us consider how the different criteria affect the N2a index with respect to the events’ estimated origin (Table 9 and Table 10 for respectively MV and HV events). The N2a index for HV events is considerably lower than that for MV events; furthermore, the difference between the current and the new criteria is very small for HV events as there is an average increase of 8% (average N2a is equal to 5.5 N°/EMP and 6 N°/EMP respectively for the current and the new criterion).
Conversely, looking at the MV results, when the new criterion is adopted, the N2a index shows an increase of 20% being N2a equal to 22.8 N°/EMP for the new criterion while it reaches only 18.8 N°/EMP for the current one.
Now let us consider the N2a evaluated in terms of N/EMP for each macro-regional area with respect to the overall, MV and HV events. The calculated indices are shown in Figure 13 where the current and new criteria results are represented in blue and violet colormaps. It is important to note that the sum of the N2a on the macro-regional areas is not the global N2a as the EMP does not satisfy the associative propriety as shown in (1).
From the achieved results, the following conclusions can be drawn:
  • Considering Figure 13a,b it can be noted that the calculated N2a indices reach the highest values for the South area, with a maximum recorded in 2019 (75.3 N°/EMP and 88.5 N°/EMP for the current and new criteria); these values are practically twice the overall N2a of Table 8 (35.8 N°/EMP and 41.7 N°/EMP respectively) so that it is the South area that has the greatest weight on the global severity of the events; in fact, in 2019, the second-highest value is recorded for the CS area where N2a is equal to 29.0 N°/EMP and 33.7 N°/EMP. Looking at the comparison between current and new criteria, N2a is being enhanced for all macro-regions.
  • In Figure 13c,d the trend shown for the overall results is confirmed: moreover, MV events give the greatest contribution to N2a; as an example, in 2019 the South area, reaches an N2a equal to 56.5 N°/EMP and 70.3 N°/EMP respectively for the current and the new criteria, that is, in this case, MV events contribute 75% and 79% respectively to the overall N2a for the new and current criteria respectively. As a general trend, the new criterion considerably boosts all the macro-regional areas indices for the considered time period.
  • Figure 13e,f confirms what is presented in Table 10 that is, HV events contribute less to N2a. As an example, the South area in 2019 achieved an N2a equal to 18.8 N°/EMP and 18.2 N°/EMP for the current and the new criteria. In this case, the adoption of the new criterion decreases the PQ index compared to the current one. This trend is not systematic for all the macro-regional areas.
Finally, to evaluate the impact of the new criteria the percentage difference between the indices obtained with the two methodologies exclusively for MV events has been evaluated as:
Δ N 2 a = N 2 a new criteria N 2 a current criteria N 2 a current criteria 100 %
The related aggregated results have been listed in Table 11, while the macro-regional area’s trends are shown in Figure 14.
The adoption of a new event validation criterion considerably enhances all PQ indices. In fact, the Not Defined cases for the current criterion, are mainly recovered as True by the new criterion and moreover, as far as the original assessment is concerned, they are mostly classified as MV events. From a macro-regional point of view, the South area shows the worst results as its N2a index is twice the overall index and more than double those of the other macro-regional areas. The greater increases in relative terms are recorded for the South and North-West areas.

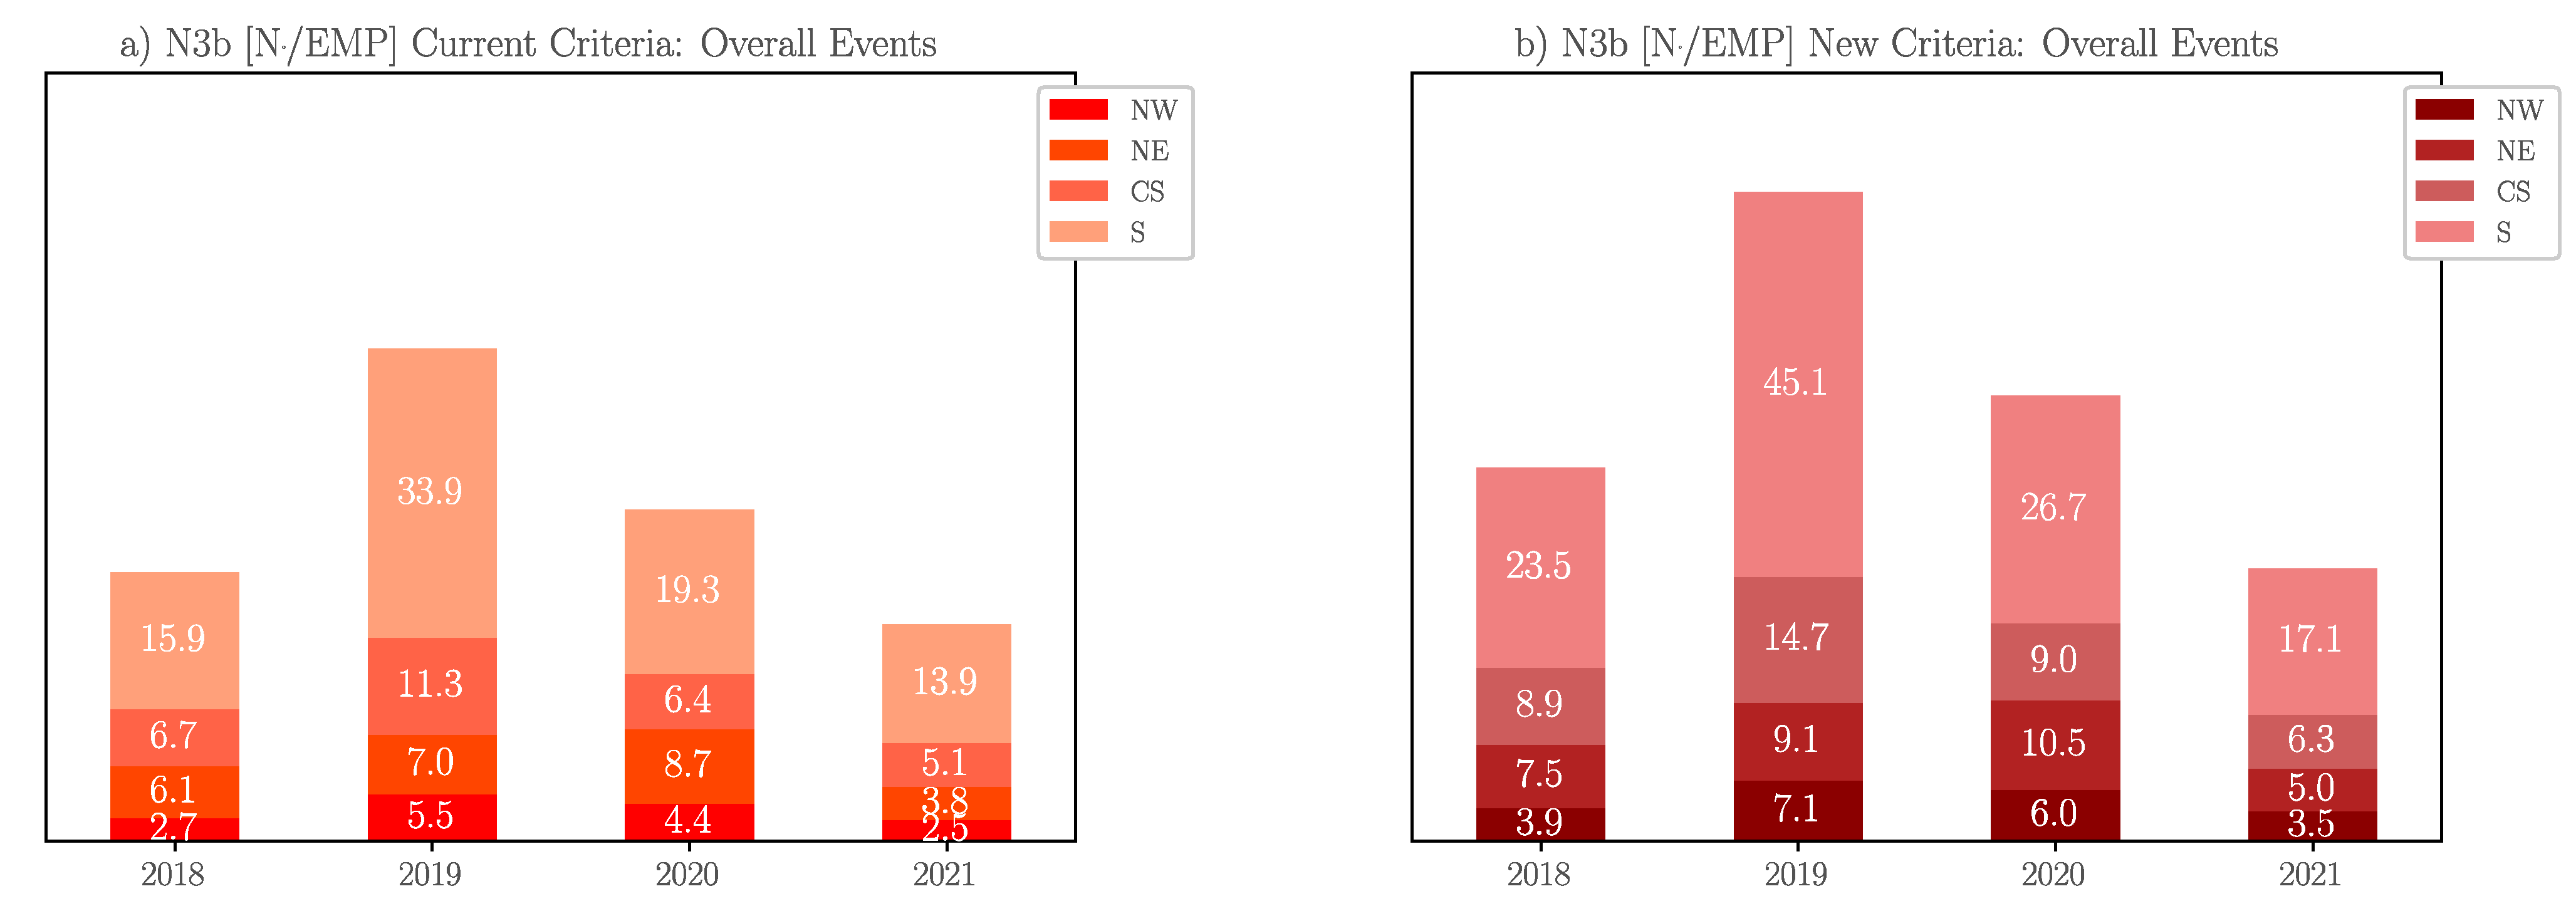
5.3. N3b Comparison: Current vs. New Criteria

Similarly to what has been done for the N2a index, N3b has been calculated for each year, aggregating data from all the MUs, taking into account for both the criteria all the events (user point of view, Table 12), MV events (DSO responsibility, Table 13) and finally HV events (TSO responsibility, Table 14).
The results are consistent with those obtained for N2a, but some aspects can be highlighted:
  • The use of the new criteria significantly increases N3b compared to N2a, showing an average growth of 33% with respect to the use of the current criteria
  • Comparing Table 13 and Table 14, which refer to MV and HV events respectively, the N3b is significantly higher for MV events, according to both the adopted criteria, than for HV events; referring in particular to MV events, the average N3bs, over the considered time, is equal to 12.0 N°/EMP and 8.5 N°/EMP according to respectively the new and the current criterion while they reach 1.2 N°/EMP and 1.6 N°/EMP for the HV events. Therefore, the adoption of the new criteria reduces the HV events impact on N3b compared to the current ones.
The evaluations of the N3b index in terms of N°/EMP for each macro-regional area and referring to the overall, MV and HV events are reported in Figure 14 (current and new criteria are respectively represented in red and magenta colormaps). As for the N2a, it is important to remind that the sum of the N3b over the macro-regional areas is not the global N3b. The following conclusions can be drawn:
  • Considering Figure 15a,b the N3b values reach their maximum in 2019 for the South area with an N3b equal to 33.9 N°/EMP for the new criteria and 45.1 N°/EMP for the current ones. The weight of the South area with respect to the overall indices (respectively 14.8 N°/EMP and 19.5 N°/EMP) is remarkably high (more than double). The other macro-regional areas present significantly lower N3bs: as an example, the Central-Sardinia area results in 11.3 N°/EMP and 14.7 N°/EMP respectively for the current and new criterion
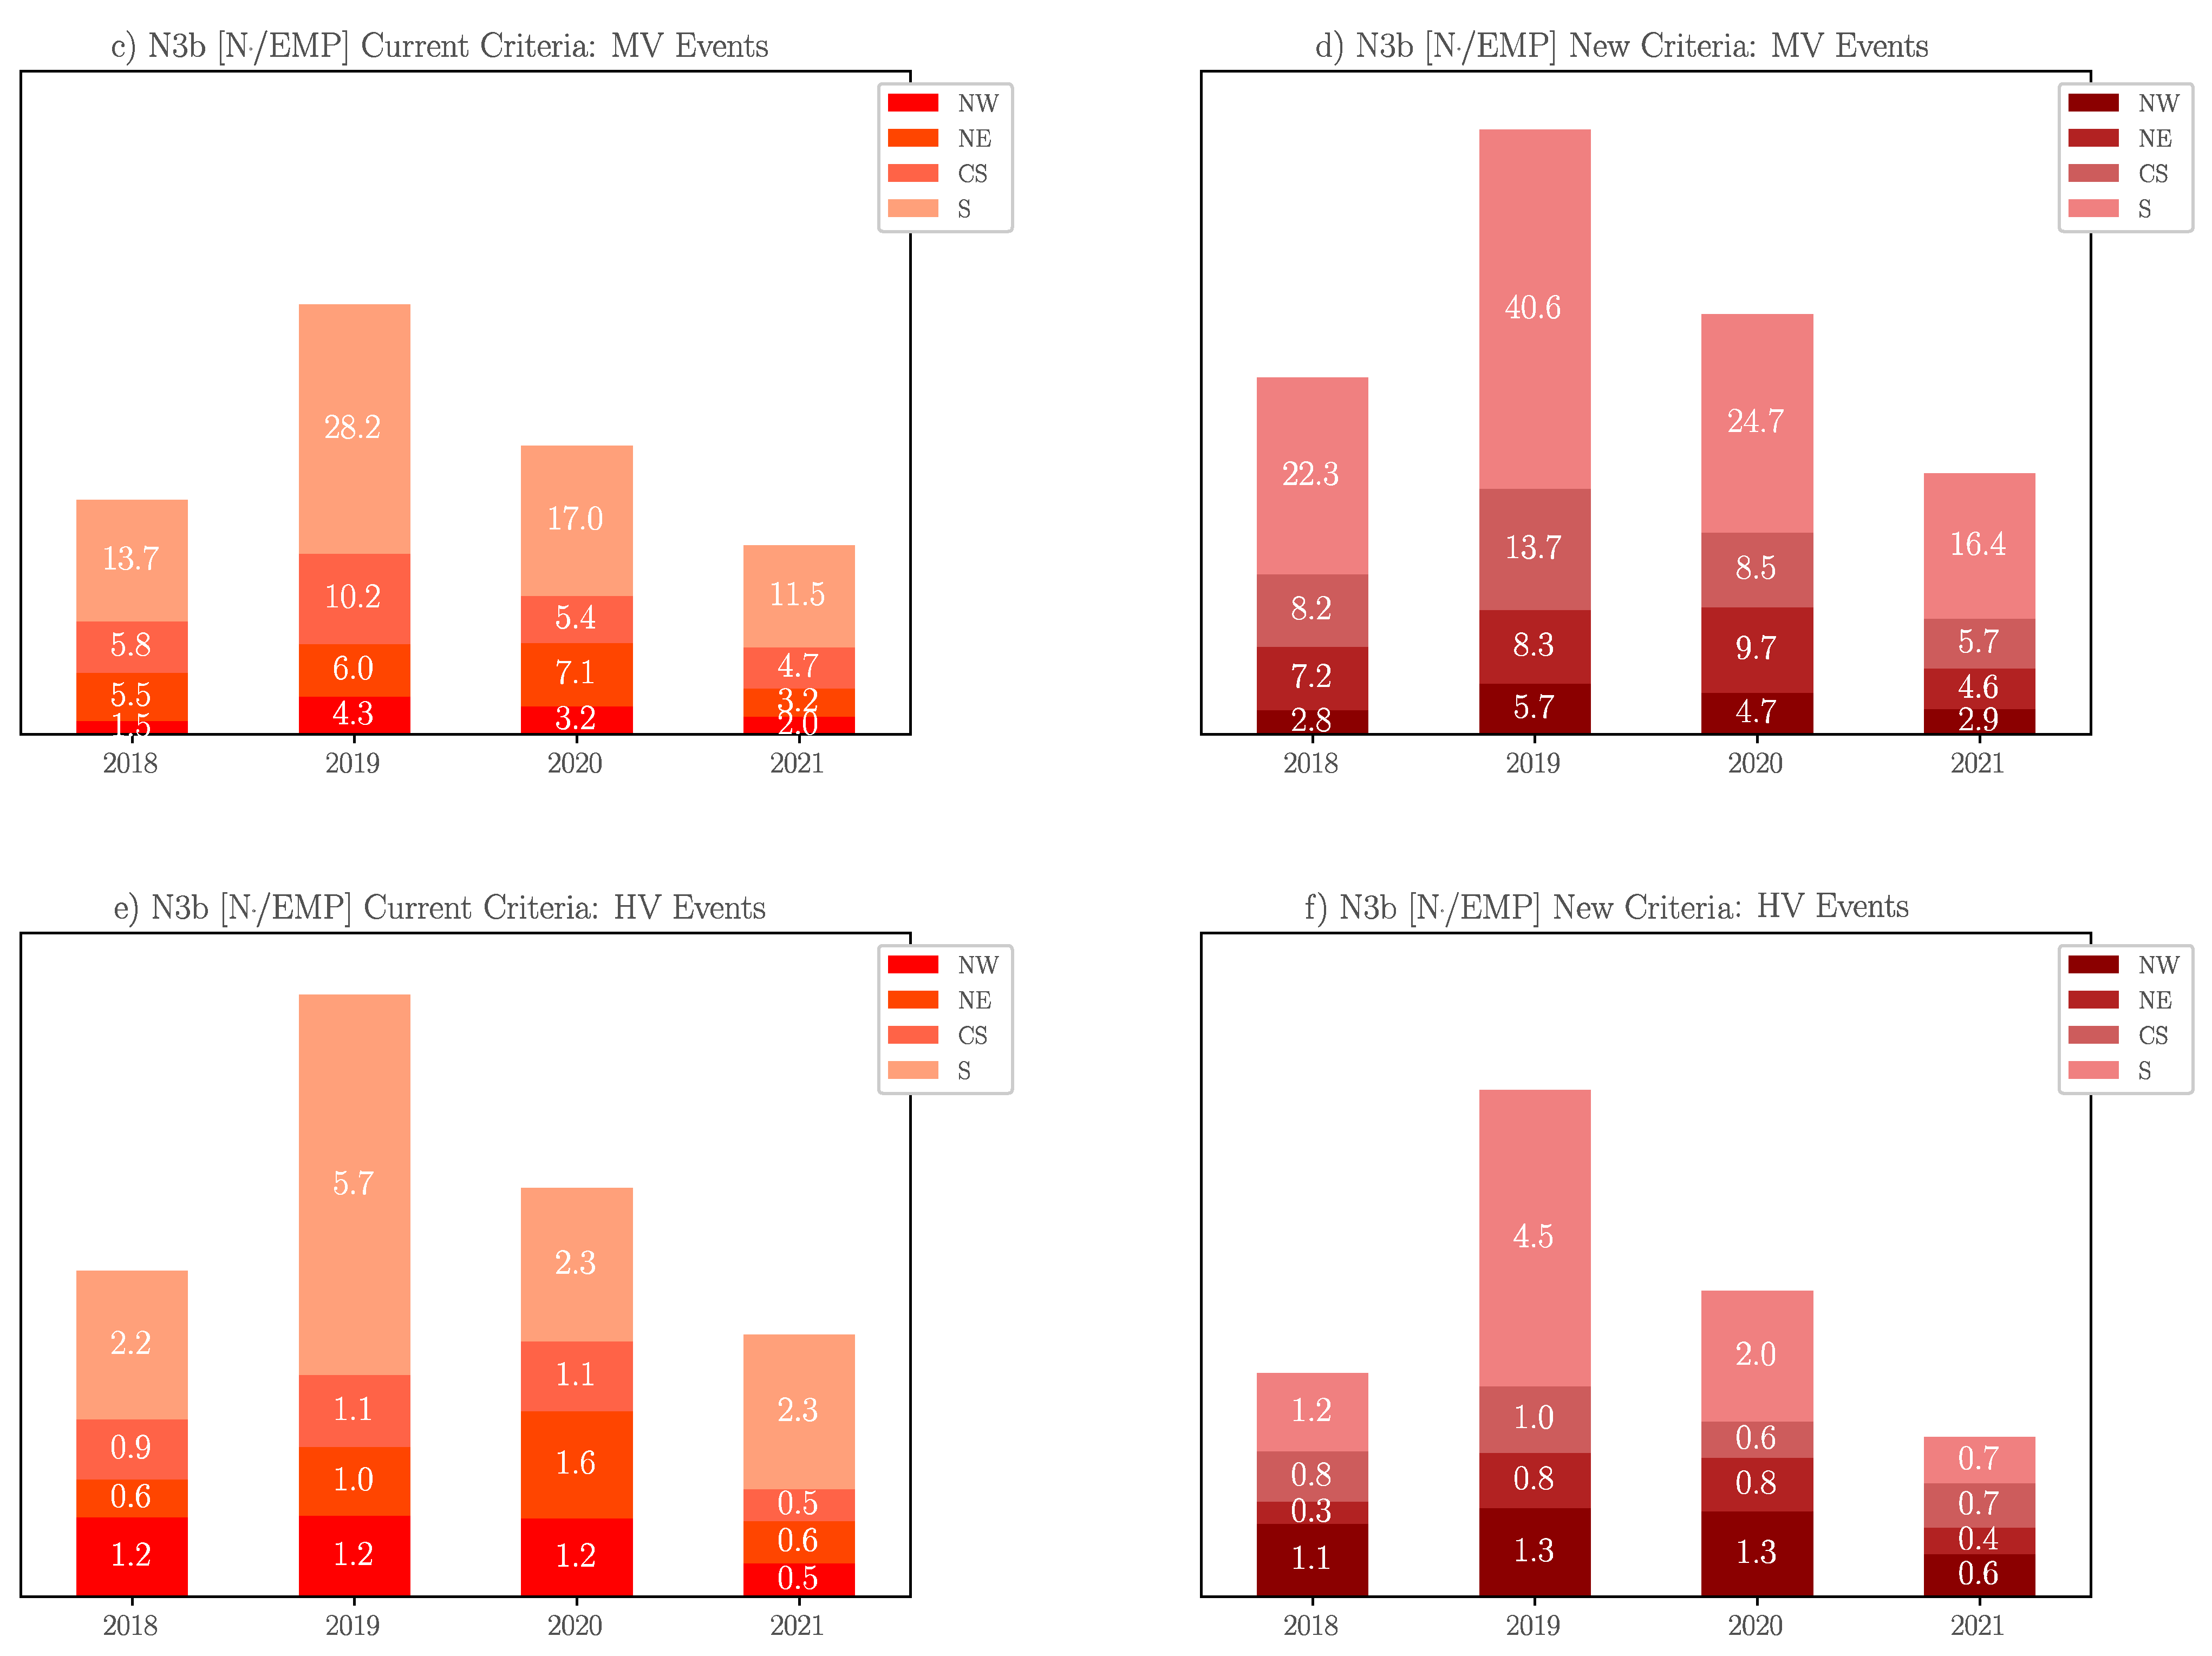
  • In Figure 15c,d the global trend for MV events is confirmed on a macro-regional areas level: MV events are the main contribution to the overall N3bs
  • Looking at Figure 15e,f the new criterion compared to the current one reduces the N3b index for HV events; an example, the South area in 2019 has achieved the values 5.7 N°/EMP and 4.5 N°/EMP respectively for the current and new criterion. This trend is systematic for all macro-regional areas: therefore, the new criteria classify a certain number of HV events for the current ones, in MV events
As described in the first part of Section 5, the N3b index counts the number of voltage dips below the so-called “responsibility curve” between the DSO and the user so that it suits the requirements as a possible “candidate” for MV network regulation purposes.
To evaluate the potential impact of the new criteria, the percentage difference of N3b between the two methodologies and taking into account only MV events have been computed:
Δ N 3 b = N 3 b new criteria N 3 b current criteria N 3 b current criteria 100 %
Aggregated and macro-regional areas results have been reported respectively in Table 15 and Figure 16.
The results show that the adoption of the new criteria boosts N3b for MV events. In the 4 year campaign the average N3b increases by 43%. This growth can be explained by two main reasons: firstly, the DELFI classifier recovers a considerable number of True events from the Not Defined events. These events are mainly classified as MV by the FExWaveS application. Moreover, severe events are largely classified as MV voltage dips by the new criteria compared to the current ones.
From a macro-regional area’s point of view, the South area shows the worst results as its N3b index is twice the overall index and more than double than those referred to the other macro-regional areas. The greater increase in relative terms is recorded for the South and North-West areas.

6. Conclusions

In this paper, the integration of advanced machine learning techniques in the QuEEN monitoring system is presented. The techniques, implemented through a specific tool called QuEEN PyService, are aimed to make advanced voltage dips analysis available in the QuEEN MV network monitoring system. This distributed monitoring system, developed by RSE in 2006 for survey and research purposes, characterize voltage dips in terms of their residual voltage and duration; moreover, it can provide the “validity” (true events, due to actual faults in the network, or false events, caused by voltage transformers saturation) and the “origin”(upstream or downstream from the measurement point) for each recorded voltage dip thanks to proper procedures and algorithms. A 2nd harmonic criterium is adopted for the voltage dips validity assessment, while the so-called “global method”, based on distance protections, correlation of events and HV network topology information, is used to estimate their origin. These solutions have reached good performance, although the field experience has brought out some limitations.
Therefore, in recent years, to overcome these limitations, new solutions have been studied and proposed by RSE: with regard to the validity, the DELFI classifier (DEep Learning for False voltage dips Identification), while in regard to the origin, the FExWaveS + SVM classifier (Features Extraction from Waveform Segmentation + Support Vector Machine classifier). In this paper, for the first time, those techniques have been broadly adopted to perform a severity analysis on a significant statistical sample: thanks to QuEEN PyService, the voltage dips recorded by 150 MUs, between 2018 and 2021, have been considered (nearly 33,000 events). The PQ analysis focused on the N2a and N3b indices have been performed by comparing the results of the current criteria (2nd harmonic and global method) with those of the new criteria (DELFI and FExWaveS). The analysis has been carried out also from a macro-regional area point of view. Results show that the Not Defined events, without any Boolean identification by the 2nd harmonic criterion, are mostly classified as True events by the DELFI classifier. Those events contribute a lot to both N2a and N3b (severe events) and they are mainly attributed to MV origin by the FExWaveS. Therefore, considering N3b as a possible significant index for regulatory purposes, the use of the new criteria increases the abovementioned index by 43%. The macro-regional area analysis shows that the South regions mainly contribute to the overall index, followed at a distance by Central-Sardinia, and the North-East and North-West areas.

Author Contributions

Conceptualization, M.Z., R.C. and L.T.; formal analysis, M.Z., R.C. and L.T.; methodology, M.Z., R.C., L.T. and M.V.; supervision, R.C. and L.T.; validation, M.Z. and M.V.; writing—original draft, M.Z.; R.C. and L.T.; writing—review and editing, M.Z. All authors have read and agreed to the published version of the manuscript.

Funding

This work has been partially financed by the Research Fund for the Italian Electrical System in compliance with the Decree of 16 April 2018.

Conflicts of Interest

The authors declare no conflict of interest.

References

  1. Bollen, M.H.J.; Das, R.; Djokic, S.; Ciufo, P.; Meyer, J.; Rönnberg, S.; Zavodam, F. Power Quality Concerns in Implementing Smart Distribution-Grid Applications. IEEE Trans. Smart Grid 2016, 8, 391–399. [Google Scholar] [CrossRef] [Green Version]
  2. European Committee for Electrotechnical Standardization. EN50160, Voltage Characteristics of Electricity Supplied by Public Electricity Networks; CENELEC: Brussels, Belgium, 2016. [Google Scholar]
  3. Meyer, J.; Blanco, A.; Rönnberg, S.; Bollen, M.; Smith, J. CIGRE C4/C6.29: Survey of utilities experiences on power quality issues related to solar power. CIRED—Open Access Proc. J. 2017, 1, 539–543. [Google Scholar] [CrossRef]
  4. Ray, K.; Mohanty, S.R.; Kishor, N. Classification of power quality disturbances due to environmental characteristics in distributed generation system. IEEE Trans. Sustain. Energy 2013, 4, 302–313. [Google Scholar] [CrossRef]
  5. Kattmann, C.; Rudion, K.; Tenbohlen, S. Detailed power quality measurement of electric vehicle charging infrastructure. CIRED—Open Access Proc. J. 2017, 2017, 581–584. [Google Scholar] [CrossRef] [Green Version]
  6. Mastny, P.; Moravek, J.; Vojtek, M.; Drapela, J. Hybrid Photovoltaic Systems with Accumulation—Support for Electric Vehicle Charging. Energies 2017, 10, 834. [Google Scholar] [CrossRef] [Green Version]
  7. Bollen, M.H.J. Understanding Power Quality Problems: Voltage Sags and Interruptions; IEEE Press: New York, NY, USA, 1999. [Google Scholar]
  8. Mottola, F.; Proto, D.; Varilone, P.; Verde, P. Planning of Distributed Energy Storage Systems in μGrids Accounting for Voltage Dips. Energies 2020, 13, 401. [Google Scholar] [CrossRef] [Green Version]
  9. Belloni, F.; Chiumeo, R.; Gandolfi, C.; Villa, A. Performance test of a PQ universal compensator through Control Hardware in the Loop simulation. In Proceedings of the 6th International Conference on Clean Electrical Power, ICCEP 2017, Santa Margherita Ligure, Italy, 27–29 June 2017. [Google Scholar] [CrossRef]
  10. Sadigh, A.K.; Smedley, K.M. Review of voltage compensation methods in dynamic voltage restorer (DVR). In Proceedings of the 2012 IEEE Power and Energy Society General Meeting, San Diego, CA, USA, 22–26 July 2012; pp. 1–8. [Google Scholar] [CrossRef]
  11. Milanovic, J.V.; Gupta, C.P. Probabilistic Assessment of Financial Losses due to Interruptions and Voltage Sags—Part I: The Methodology. IEEE Trans. Power Deliv. 2006, 21, 918–924. [Google Scholar] [CrossRef]
  12. Milanovic, J.V.; Gupta, C.P. Probabilistic Assessment of Financial Losses due to Interruptions and Voltage Sags—Part II: Practical Implementation. IEEE Trans. Power Deliv. 2006, 21, 925–932. [Google Scholar] [CrossRef]
  13. Ding, Z.; Zhu, Y.; Chen, C. Economic loss assessment of voltage sags. In Proceedings of the CICED 2010 Proceedings, Nanjing, China, 13–16 September 2010; pp. 1–5. [Google Scholar]
  14. Celli, G.; Pilo, F.; Pisano, G.; Soma, G.G. Including voltage dips mitigation in cost-benefit analysis of storages. In Proceedings of the 2018 18th International Conference on Harmonics and Quality of Power (ICHQP), Ljubljana, Slovenia, 13–16 May 2018; pp. 1–6. [Google Scholar] [CrossRef]
  15. De Santis, M.; Di Stasio, L.; Noce, C.; Verde, P.; Varilone, P. Initial Results of an Extensive, Long-Term Study of the Forecasting of Voltage Sags. Energies 2021, 14, 1264. [Google Scholar] [CrossRef]
  16. D’Orazio, L.; Corsi, N.; Riva, S. Analysis of voltage dips on Italian distribution network. In Proceedings of the 2021 AEIT International Annual Conference (AEIT), Venice, Italy, 4–8 October 2021; pp. 1–6. [Google Scholar]
  17. Gong, X.; Yu, Y.; Wang, B.; Ye, F.; Zhou, N. A severity assessment method for multiple voltage sag. In Proceedings of the 2017 IEEE 3rd Information Technology and Mechatronics Engineering Conference (ITOEC), Chongqing, China, 3–5 October 2017; pp. 135–140. [Google Scholar] [CrossRef]
  18. IEEE. IEEE Guide for Voltage Sag Indices. In IEEE Std. 1564–2014; IEEE: Piscataway, NJ, USA, 2014; pp. 1–59. [Google Scholar]
  19. Joint Working Group CIGRE/CIRED C4110. Voltage Dip Immunity of Equipment and Installations; Report 412; Cigré: Paris, France, 2010. [Google Scholar]
  20. CIGRE. CIGRE/CIRED JWG C4.112-Guidelines For Power Quality Monitoring—Measurement Locations, Processing And Presentation Of Data; CIGRE: Paris, France, 2014; Available online: https://www.researchgate.net/publication/280100959_GUIDELINES_FOR_POWER_QUALITY_MONITORING_-_MEASUREMENT_LOCATIONS_PROCESSING_AND_PRESENTATION_OF_DATA_CIGRECIRED_JWG_C4112 (accessed on 4 October 2021).
  21. Available online: http://queen.rse-web.it/ (accessed on 4 October 2021).
  22. IEC 61000-4-30. Electromagnetic Compatibility (EMC)—Part 4-30: Testing and Measurement Techniques—Power Quality Measurement Methods; IEC: Geneva, Switzerland, 2015. [Google Scholar]
  23. AEEGSI Resolution 29 December 2011, 198/2011. Available online: https://www.arera.it/allegati/docs/11/198-11arg.pdf (accessed on 6 October 2021).
  24. ARERA Resolution 23 December 2019, 566/2019/R/EEL. Available online: https://www.arera.it/it/docs/19/566-19.htm (accessed on 6 October 2021).
  25. Chiumeo, R.; de Nigris, M.; Gandolfi, C.; Garbero, L.; Tenti, L.; Carpaneto, E. Implementation of a New Method for an Improved Voltage Dips Evaluation by the Italian Power Quality Monitoring System in Presence of VT Saturation Effects. REPQJ 2010, 1, 519–523. [Google Scholar] [CrossRef]
  26. Chiumeo, R.; Garbero, L.; Malegori, F.; Tenti, L. Feasible methods to evaluate voltage dips origin. REPQJ 2015, 1, 357–361. [Google Scholar] [CrossRef]
  27. Mishra, M. Power quality disturbance detection and classification using signal processing and soft computing techniques: A comprehensive review. Int. Trans. Electr. Energy Syst. 2019, 29, e12008. [Google Scholar] [CrossRef] [Green Version]
  28. Mahela, O.P.; Shaik, A.G.; Gupta, N. A critical review of detection and classification of power quality events. Renew. Sustain. Energy Rev. 2015, 41, 495–505. [Google Scholar] [CrossRef]
  29. Elbouchikhi, E.; Zia, M.F.; Benouzid, M.; El Hani, S. Overview of Signal Processing and Machine Learning for Smart Grid Condition Monitoring. Electronics 2021, 10, 2725. [Google Scholar] [CrossRef]
  30. Chawda, G.S.; Shaik, A.G.; Shaik, M.; Padmanaban, S.; Holm-Nielsen, J.B.; Mahela, O.P.; Kaliannan, P. Comprehensive review on detection and classification of power quality disturbances in utility grid with renewable energy penetration. IEEE Access 2020, 8, 146807–146830. [Google Scholar] [CrossRef]
  31. Iruansi, U.; Tapamo, J.R.; Davidson, I.E. Classification of Power-line Insulator Condition using Local Binary Patterns with Support Vector Machines. IAENG Int. J. Comput. Sci. 2019, 46, 300–310. [Google Scholar]
  32. Tenti, L.; Chiumeo, R.; Zanoni, M.; Shadmehr, H. Deep Learning to Assess Voltage Dips Validity. In Proceedings of the 2020 AEIT International Annual Conference (AEIT), Catania, Italy, 23–25 September 2020; pp. 1–4. [Google Scholar] [CrossRef]
  33. Shadmehr, H.; Chiumeo, R.; Tenti, L. Self-tuning Kalman filter and machine learning algorithms for voltage dips upstream or downstream origin detection. Distribution. Renew. Energy Power Qual. J. 2016, 19, 235–240. [Google Scholar] [CrossRef]
  34. Zanoni, M.; Chiumeo, R.; Tenti, L.; Volta, M. Automated Tool Based on Deep Learning to Assess Voltage Dips Validity: Integration in the QuEEN MV network Monitoring System. Renew. Energy Power Qual. J. 2021, 14, 409–413. [Google Scholar] [CrossRef]
  35. Zanoni, M.; Chiumeo, R.; Tenti, L.; Volta, M. FExWaveS application for voltage dips origin assessment: Optimization of the tool in views of its integration into the QuEEN monitoring system. In Proceedings of the 2021 AEIT International Annual Conference (AEIT), Venice, Italy, 4–8 October 2021; pp. 1–6. [Google Scholar]
  36. Zeiler, M.D.; Fergus, R. Visualizing and Understanding Convolutional Networks; Course CSCI 662 Advanced; University of Southern California: Los Angeles, CA, USA, 2013. [Google Scholar]
  37. Mockus, J.; Tiesis, V.; Zilinskas, A. The application of Bayesian methods for seeking the extremum. Towards Glob. Optim. 1978, 2, 117–129. [Google Scholar]
  38. Macias, J.A.R.; Exposito, A.G. Self-Tuning of Kalman Filter for Harmonic Computation. IEEE Trans. Power Deliv. 2006, 21, 501–503. [Google Scholar] [CrossRef]
  39. Montgomery, D.C. Introduction to Statistical Quality Control; John Wiley & Sons, Inc.: Hoboken, NJ, USA, 2009. [Google Scholar]
  40. Flach, P. Machine Learning: The Art and Science of Algorithms that Make Sense of Data; Cambridge University Press: Cambridge, UK, 2012. [Google Scholar]
  41. CEI EN 61000-4-11. Compatibilità elettromagnetica (EMC)—Parte 4-11: Tecniche di Prova e di Misura—Prove d’immunità a Buchi di Tensione, Brevi Interruzioni e Variazioni di Tensione; CEI: Milan, Italy, 2006. [Google Scholar]
  42. CEI EN 61000-4-34. Compatibilità elettromagnetica (EMC)—Parte 4-34: Tecniche di Prova e di Misura—Prove d’immunità ai Buchi di Tensione e Alle Variazioni di Tensione per le Apparecchiature con Corrente di Ingresso Superiore a 16 A per Fase; CEI: Milan, Italy, 2007. [Google Scholar]
Figure 1. QuEEN monitoring system: MUs and macro-regional areas.
Energies 14 07949 g001
Figure 2. False event due to VTs saturation: voltage waveforms with the characteristic camel humps and Doge’s hat patterns.
Energies 14 07949 g002
Figure 3. False event due to VTs saturation: rms voltage values.
Energies 14 07949 g003
Figure 4. Voltage dip origin: upstream (top) and downstream (bottom) events.
Energies 14 07949 g004
Figure 5. DELFI architecture.
Energies 14 07949 g005
Figure 6. FExWaveS architecture.
Energies 14 07949 g006
Figure 7. QuEEN PyService architecture.
Energies 14 07949 g007
Figure 8. Validity assessment: 2nd harmonic and DELFI outcomes.
Energies 14 07949 g008
Figure 9. Origin assessment: Global Method and FExWaveS outcomes.
Energies 14 07949 g009
Figure 10. Voltage dips duration frequency histograms: current and new criteria for HV origin events (top) and MV ones (bottom).
Energies 14 07949 g010
Figure 11. CEI EN 50,160 Voltage Dips classification and thresholds for N2a (dashed-yellow line) and N3b (continuous-red line) severe events counting indices.
Energies 14 07949 g011
Figure 12. (a) number of active MU for each macro-regional area; (b) EMP for each macro-regional area.
Energies 14 07949 g012
Figure 13. (a) current criteria N2a: overall events; (b) new criteria N2a: overall events; (c) current criteria N2a: MV events; (d) new criteria N2a: MV events; (e) current criteria N2a: HV events; (f) new criteria N2a: HV events.
Energies 14 07949 g013
Figure 14. N2a percentual variation: a criteria comparison.
Energies 14 07949 g014
Figure 15. (a) current criteria N3b: overall events; (b) new criteria N3b: overall events; (c) current criteria N3b: MV events; (d) new criteria N3b: MV events; (e) current criteria N3b: HV events; (f) new criteria N3b: HV events.
Energies 14 07949 g015aEnergies 14 07949 g015b
Figure 16. N3b percentual variation: criteria comparison.
Energies 14 07949 g016
Table 1. DELFI Classifier—CNN Parameters.
ParameterValue
CNN N° Layers1
N° of Kernel Matrices63
Mini-Batch Size33
Learning Rate1.2 × 10−5
Max-Epoch20
Table 2. Validity assessment: criteria consistency expressed in percent values with respect to the 2nd harmonic criterion.
Validity Criteria
Consistency
2nd Harmonic Criterion
T [%]F [%]ND [%]T+F [%]
DELFIT [%]99.024.055.2-
F [%]0.867.342.9-
ND [%]----
T+F [%]0.28.71.9-
Table 3. Validity assessment: number of events for each label and criterion expressed as a percentage of the total number of events.
CriterionT [%]F [%]ND [%]T+F [%]
DELFI88.310.601.1
2nd Harmonic
Criterion
81.17.711.2
Table 4. Origin assessment: criteria consistency expressed in percentage with respect to the Global Method.
Origin Criteria
Consistency
Global Method
HV [%]MV [%]
FExWaveSHV [%]85.418.8
MV [%]14.681.2
Table 5. Origin assessment: number of events for each label and criterion expressed as a percentage of the total number of events.
MethodsHV [%]MV [%]
FExWaveS48.551.5
Global Method44.555.5
Table 6. Number of true events: criteria comparison.
N° True EventsCurrent CriteriaNew Criteria
201853595837
201911,28512,254
202082539017
202122882494
Table 7. Number of true events: criteria comparison at macro-regional area level.
N° True EventsMacro-Regional
Areas
Current
Criteria
New
Criteria
Percentage
Difference [%]
2018NW776838+8.0%
NE673733+8.9%
CS13841488+7.5%
S25262778+10.0%
2019NW10701136+6.2%
NE15421717+11.4%
CS28983158+9.0%
S57756243+8.1%
2020NW12061289+6.9%
NE14361574+9.6%
CS21182286+7.9%
S34933868+10.7%
2021NW262298+13.7%
NE232254+9.5%
CS711768+8.0%
S10831174+8.4%
Table 8. N2a comparison: overall events.
N2a [N°/EMP]
Overall Events
Current CriteriaNew Criteria
201821.325.7
201935.841.7
202025.329.9
202114.917.6
Table 9. N2a comparison: MV events.
N2a [N°/EMP]
MT Events
Current CriteriaNew Criteria
201816.520.8
201928.033.3
202020.123.6
202110.713.1
Table 10. N2a comparison: HV events.
N2a [N°/EMP]
AT Events
Current CriteriaNew Criteria
20184.84.9
20197.88.4
20205.26.3
20214.24.5
Table 11. N2a percentage variation due to the criterion adopted: MV events.
YearsΔN2a [%]
2018+26.4
2019+18.8
2020+17.7
2021+22.9
Table 12. N3b comparison: overall events.
N3b [N°/EMP]
Overall Events
Current CriteriaNew Criteria
20188.612.0
201914.819.5
202010.113.6
20216.78.4
Table 13. N3b comparison: MV events.
N3b [N°/EMP]
MT Events
Current CriteriaNew Criteria
20187.311.1
201912.617.6
20208.512.4
20215.77.8
Table 14. N3b comparison: HV events.
N3b [N°/EMP]
AT Events
Current CriteriaNew Criteria
20181.30.9
20192.31.9
20201.61.2
20211.00.7
Table 15. N3b criteria percentage variation: MV events.
YearsΔN3b [%]
2018+52.1
2019+40.3
2020+46.1
2021+37.1
Publisher’s Note: MDPI stays neutral with regard to jurisdictional claims in published maps and institutional affiliations.

