Article

Investigations into Balancing Peak-to-Average Power Ratio and Mean Power Extraction for a Two-Body Point-Absorber Wave Energy Converter

by
Hayrettin Bora Karayaka
1,*,
Yi-Hsiang Yu
2 and
Eduard Muljadi
3
1
School of Engineering + Technology, Western Carolina University, Cullowhee, NC 28723, USA
2
National Renewable Energy Laboratory, Golden, CO 80401, USA
3
Department of Electrical and Computer Engineering, Auburn University, Auburn, AL 36949, USA
*
Author to whom correspondence should be addressed.
Energies 2021, 14(12), 3489; https://doi.org/10.3390/en14123489
Submission received: 22 April 2021 / Revised: 5 June 2021 / Accepted: 7 June 2021 / Published: 11 June 2021

Abstract

:
The power harnessed by wave energy converters (WECs) in oceans is highly variable and, therefore, has a high peak-to-average power (PTAP) ratio. To minimize the cost of a WEC power take off (PTO) system, it is desirable to reduce the PTAP ratio while maximizing the mean power extracted by WECs. The important issue of how PTAP ratio reduction measures (such as adding an inertia element) can affect the mean power extracted in a reference model has not been thoroughly addressed in the literature. To investigate this correlation, this study focuses on the integration of the U.S. Department of Energy’s Reference Model 3, a two-body point absorber, with a slider-crank WEC for linear-to-rotational conversion. In the first phase of this study, a full-scale numerical model was developed that predicts how PTO system parameters, along with an advanced control algorithm, can potentially affect the proposed WEC’s PTAP ratio as well as the mean power extracted. In the second phase, an appropriate scaled-down model was developed, and extracted power results were successfully validated against the full-scale model. Finally, numerical and hardware-in-the-loop (HIL) simulations based on the scaled-down model were designed and conducted to optimize or make trade-offs between the operational performance and PTAP ratio. The initial results with numerical and HIL simulations reveal that gear ratio, crank radius, and generator parameters substantially impact the PTAP ratio and mean power extracted.

Graphical Abstract

1. Introduction

Recognizing a need for alternative energy sources has resulted in significant momentum toward investigating renewable energy resources, such as wind and solar. Total nonhydro renewable energy generation (wind, solar, geothermal, and biomass) in the United States increased by 7.0% in 2019, following an increase of 8.2% in 2018 and 13.8% in 2017 [1]. The fastest-growing renewable energy source in 2019 was solar power (for both utility-scale and small-scale power), with a 14.5% increase. During the same period, wind energy generation increased by 8.2%. Since 2013, generation from nonhydro renewables has almost doubled. In 2014, the total nonhydro renewable energy generation surpassed conventional hydroelectric generation for the first time in U.S. history. Moreover, the total utility-scale solar exceeded geothermal power generation in 2014 for the first time. In 2019, renewable energy generation (excluding hydropower) made up 11.4% of total energy generation. The three largest nonhydro contributors were wind (7.1%), solar (2.6%), and biomass (1.4%), followed by geothermal (0.4%). However, electrical energy production from fossil fuels still has the largest share of power generation. Natural gas is the primary contributor (38.1%), followed by coal (23.2%) [1]. The U.S. federal government aims to increase the share of renewables—beyond hydropower—in its respective electricity generation to the level of 20% by 2030 [2]. Most recently, the United States has announced a new goal to reach 100% carbon-pollution-free electricity by 2035 [3]. This does not necessarily mean that 100% of electricity will be from renewables, but it paves the way for more renewable generation in the United States. There is still substantial room to grow to reach these goals, considering that only 11.4% of need is met by renewable generation, and that the growth rate of renewable generation has declined in recent years [1].
A number of other countries have also set targets for electricity generation from renewables. For example, the European Parliament approved a target of 35% renewables by 2030 [4]. This target was also adopted by China [5]. Some countries have even more ambitious targets, such as net zero greenhouse gas emissions by 2050 in the United Kingdom [6] and 100% renewables by 2050 in Spain [7]. Canada is targeting 90% carbon-free generation by 2030 [8]. Currently, Canada has approximately 70% renewables in its electricity generation [9].
Marine hydrokinetic energy is an important renewable energy source with significant potential to help achieve the goals established in a White House report [10]. In the United States, marine energy has a potential of 2300 TWh/yr. This corresponds to 57% of U.S. electricity generation. Wave energy’s share is 1400 TWh/yr (60%), followed by ocean thermal energy (23.5%) [11]. Wave energy is the most accessible form of marine energy and contributes up to 80% of the marine energy mix [12]. Additionally, the power density of water is much larger than the power density of air. High power density can enable the construction of much smaller-scale devices to capture this vast amount of waterpower. In a study conducted by Cruz et al. (2008), it required three times the size of a standard underwater turbine to generate the same amount of energy from a wind turbine [13]. However, at present, ocean wave energy is the most expensive type of waterpower because of the complex structures of wave energy converters (WECs). In addition, calculating the potential energy that can be harvested is a complicated task because of a lack of available WEC models [14]. Moreover, ocean waves’ highly irregular nature causes important challenges in developing the design and control of WECs to capture a significant portion of this abundant energy. Therefore, it is critically important to develop and design new WEC models that can harvest larger amounts of wave power efficiently and in a cost-competitive manner compared to other sources of renewable generation, such as wind and solar.
According to Tedeschi et al. (2011), the peak-to-average power (PTAP) ratio can be more than 50 when applying well-known optimum control techniques to irregular waves [15]. The study highlighted the importance of power saturation methodologies for staying within the ratings of generator and power electronics equipment and for reducing this ratio. Even with these provisions, approximately 16 kW of average power was extracted with a 110-kW saturation rating for a generator driven by a rack-and-pinion linkage attached to a semisubmerged 10 m diameter buoy. Henriques et al. (2016) employed a latching control methodology with a high-speed valve to limit the PTAP ratio for an oscillating water-column-type WEC [16]. The novel methods of handling the PTAP ratio applied by these studies [15,16] were specific to the WEC power take off (PTO) systems in consideration. The impact of reduction in the PTAP ratio to the mean power was not thoroughly discussed by either of these papers. Yu et al. (2018) articulated the strong correlation between levelized cost of electricity for WECs and the PTAP ratio reduction [17]. WEC power smoothing and the PTAP ratio reduction techniques were also discussed in detail for a two-body point-absorber system WEC Simulator’s Reference Model 3 (WEC-Sim RM3) with a hydraulic PTO. However, Yu et al. (2018) primarily focused on hydraulic- and mechanical-smoothing methods in a numerical environment and used a simple model for the electrical generator. Karayaka et al. (2020) used hardware-in-the-loop (HIL) simulations to investigate the impact of PTO system parameters and control law on a rotational WEC’s PTAP ratio reduction [18]. The study by Karayaka et al. (2020) employed a fully experimental electric-drive system that is torque-actuated by the WEC-Sim RM3 model integrated with a slider-crank (SC) linkage for linear-to-rotary conversion. This research effort ran into some challenges because of the actuation method and only presented the relative (not to scale) PTAP ratio and mean power results. In addition, the focus in [18] was mainly on the PTAP ratio reduction.
The study presented in this paper uses a wave-to-wire (W2W) model to better understand the different ways to minimize the PTAP ratio while maximizing the mean power. Special emphasis was given to the slider-crank linkage and the generator stages. W2W models have attracted special attention in the recent literature due to their ability to capture the comprehensive system characteristics, from the wave resource to the grid. Accordingly, the control decisions at different stages of the energy conversion chain can be made to achieve different objectives. Penalba et al. (2016) provided a comprehensive review of different W2W models and focused on the control requirements of intermediate conversion stages [19]. According to the study, system constraints and losses are particularly important and have to be articulated in the controller design stage to ensure that more power can be converted. In addition to this review study, a few prominent designs of W2W models can also be found in the relevant literature [20,21,22,23]. The references [20,21,22,23] make use of nonideal PTOs with nonideal efficiencies. The constant-pressure hydraulic PTO topologies are employed in [20,23] to implicitly balance the peak-to-mean and mean power figures. Although the references [15,16] explicitly studied the balancing of peak-to-mean and mean power, they assumed ideal efficiencies in their energy conversion chain.
In light of these existing challenges and opportunities, this study uses a novel research methodology to investigate the correlation between the PTAP ratio and mean power extracted for a WEC model, designed by integrating the WEC-Sim RM3 and fixed-stroke slider-crank WEC-PTO models. The final design includes all realistic components, from ocean wave interactions to electricity production and utilization.
The research study develops both experimental and numerical models that can predict how PTO system parameters, along with an advanced control algorithm, can potentially affect the proposed WEC’s PTAP ratio as well as mean power extracted. Important conclusions are drawn based on the changes in system parameters.
The WEC-Simulator (WEC-Sim), which was originally developed by a collaboration of the National Renewable Energy Laboratory and Sandia National Laboratories [24], is becoming the industry standard for analysis and development and is used by WEC designers, manufacturers, researchers, and educators. The WEC-Sim can model devices that are comprised of rigid bodies, PTO systems, and mooring systems. The first version of the WEC-Sim was developed in 2014. The study detailed in this paper utilizes the WEC-Sim and expands its functionality by using it to model ocean wave and body (RM3) interactions as well as a slider-crank linkage system.
Maintaining continuous rotation at a relatively fixed/high speed and torque makes popular utility-scale wind turbines efficient and cost-competitive. Some of the important features that contribute to this efficient operation are a gearbox with a high conversion ratio, large turbine inertia, and advanced control techniques applied to power electronic converters [25]. Therefore, the hypothesis behind the research described in this paper is that a WEC-PTO that is capable of maintaining one-way rotation with finely tuned system parameters (such as gear ratio and crank radius) can achieve a reasonably low PTAP ratio while maintaining its mean power captured near its peak.
The research objectives for this project are:
  • Make use of an advanced control algorithm that achieves high-speed unidirectional rotation for the WEC model described, with speed fluctuations limited to ±40% (around its mean).
  • Tune PTO system parameters (such as gear ratio, crank radius, and connecting arm length) and collect and analyze the PTAP ratio data for various wave conditions.
  • Characterize and investigate the sources of mean power reductions for the PTO parameters and wave conditions.
It is not a trivial task to achieve one-way rotation at high efficiency for oscillating systems such as the WEC-PTOs. Liang et al. (2017) successfully developed and constructed a mechanical motion rectifier that is used in a WEC-PTO architecture [26]. However, the designed system did not include a real-time controller to maximize energy captured. As a result, the power output suffered substantially in sea trials. Other mechanical means of achieving unidirectional rotation include one-way clutch and latching techniques, which add to the overall cost and complexity of a WEC system [12].
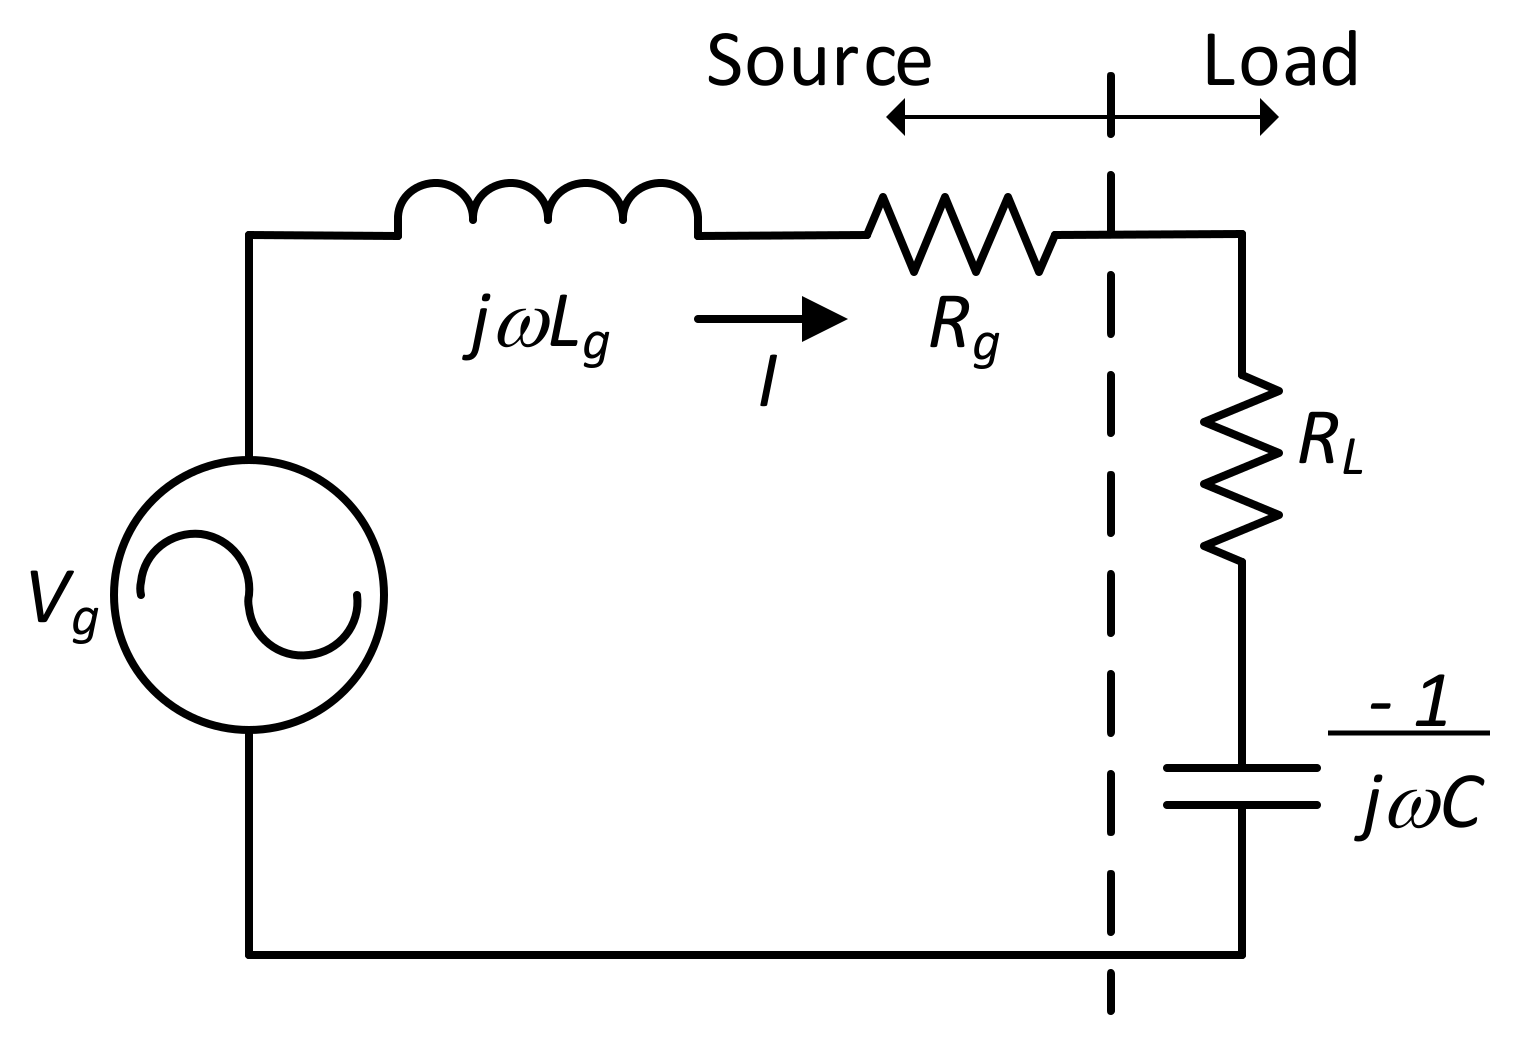
In this study, an angular displacement control algorithm was developed that maintains unidirectional rotation at relatively high speed and efficiency. The control method is nonparametric and immune to changes in wave motion (small, large, fast, or slow) to achieve continuous rotation. To implement this mechanism, the electric machine operates in the first quadrant (motor mode in forward direction) and the second quadrant (braking or generator mode in forward direction) for every half cycle of a wave [18]. This way, the WEC-PTO velocity stays in phase with the hydrodynamic excitation force. This approach is known as reactive control, as described in the terminology of linear potential flow theory. This electromechanical control method can be applied to any oscillating WEC-PTO system that is capable of maintaining unidirectional rotation. The reactive and complex conjugate control methods are illustrated in Figure 1; these methods maximize power transfer in an alternating current (AC) electrical circuit.
The source side in Figure 1 represents the wave excitation force (Vg) and the hydrodynamic impedance’s real and reactive components (Rg + jωLg). The load side represents the WEC-PTO system impedance’s real and reactive components (RL − 1/jωC). The current I (analogous to the velocity in a hydrodynamic system) can be expressed as
I = V g R g + R L + j ω L g 1 ω C ,
where ω represents the wave frequency. The power transfer from the source to the load can be maximized if the size of C can be adjusted to resonate with the size of L to achieve the resonance frequency of the circuit. In this case, the imaginary term from the denominator is eliminated. The resonance frequency is
ω = 1 L g C ,
or it can be written in a different form
C = 1 ω 2 L .
The real power transferred to the load is
P = V g 2 R g + R L 2 R L .
This is what is known as a reactive control method, and it is used when RL is not adjustable. For the complex conjugate control method, the absolute maximum power transfer to the load can be achieved if RL can be adjusted to match Rg. Then, the real power transferred is
P = V g 2 4 R L .

2. Materials and Methods

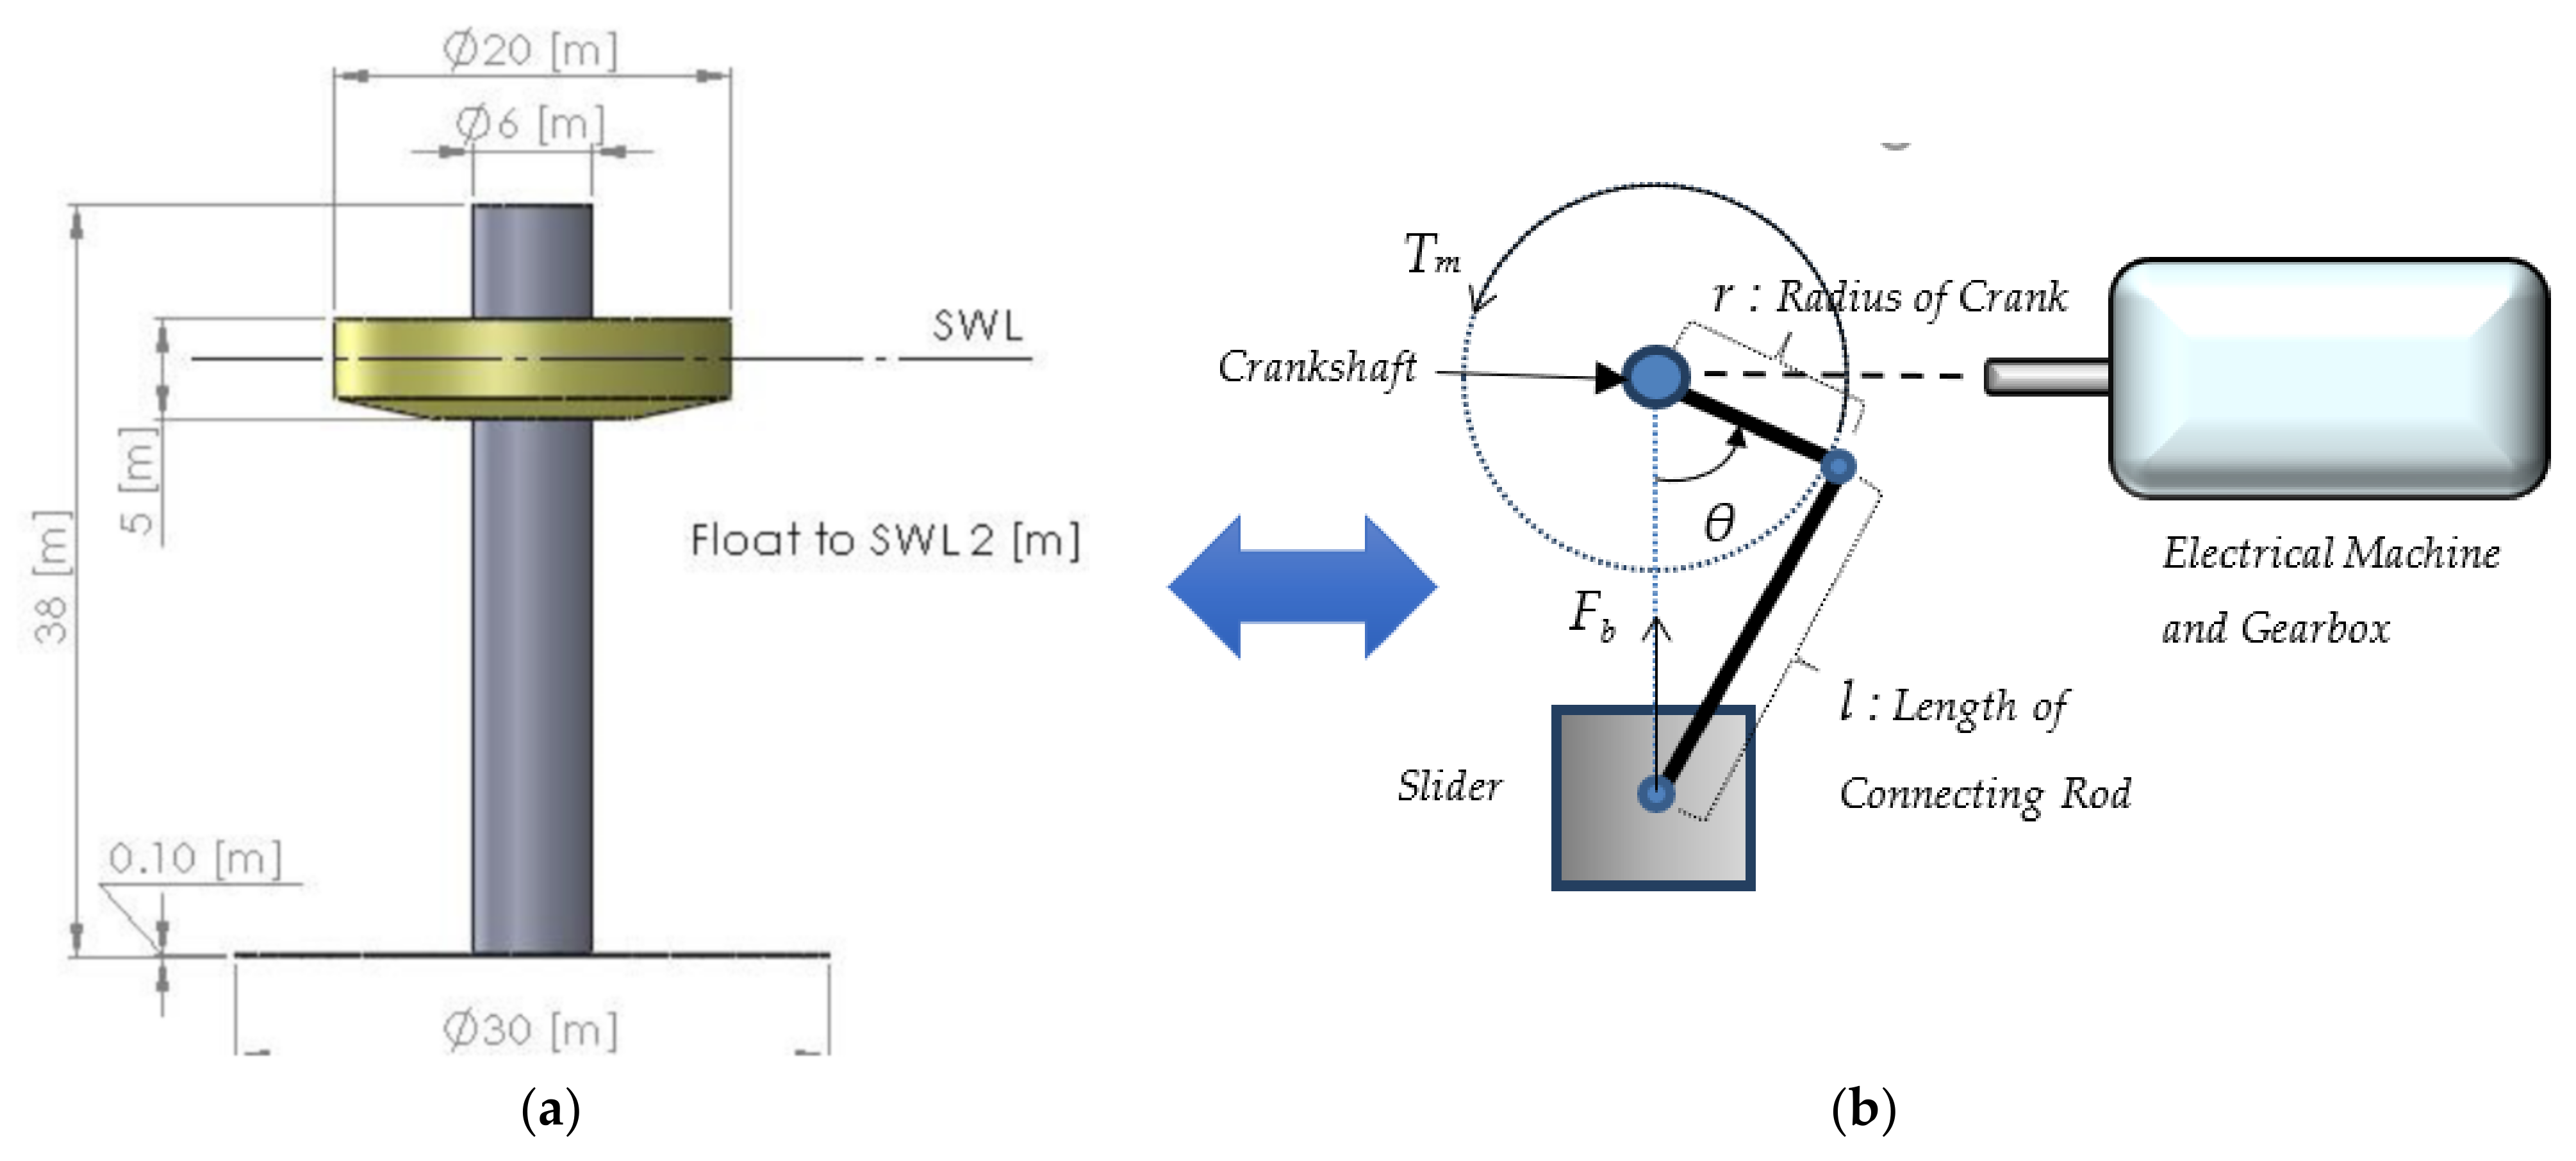
The WEC-Sim RM3 and SC linkage are integrated to fulfill the objectives of this research. The integration scheme, along with an electrical machine, is shown in Figure 2. This study allows us to evaluate the HIL implementation of WEC-Sim. WEC-Sim was developed in MATLAB/Simulink R2015b (MathWorks, Natick, MA, USA) and the multi-body dynamics were simulated using SimMechanics R2015b (MathWorks, Natick, MA, USA). The WEC-Sim RM3 model was used in this study, and the hydrodynamics model was set up based on [17]. To take full advantage of the solver, the SC linkage was also solved using Simscape Multibody. In this study, the state-space (SS) model was used because of the need for a small time-step size for the HIL; the simulation time of the convolution formulation is much longer than the simulation time for the SS model.
The electrical machine’s stator and gearbox casing are assumed to be fixed to the spar section. The crankshaft and the machine’s rotor and gears are also assumed to be attached to the spar section of the WEC-Sim RM3, but they will rotate freely within the spar section. The slider is assumed to be attached to the float section of the WEC-Sim RM3 and will translate freely within the spar section. The float’s upward motion with waves is in the same direction as the orientation of the slider-crank’s upstroke. The direction of rotation is assumed to be counterclockwise. Throughout the study, the spar section was assumed to be fixed to the ocean floor; therefore, the float section was restricted to move up and down in the heave direction only.

2.1. Methodology for Balancing the PTAP Ratio and Mean Power

The basic scientific principles behind balancing the PTAP ratio and mean power extracted can be explained through an armature-controlled (constant field) and motion-actuated direct current (DC) machine block diagram (Figure 3). These principles can also be applied to vector-controlled AC machines in which a flux-producing current component is kept constant, and a torque-producing current component is independently controlled to achieve similar control advantage as in DC machines.
In the control framework, the shaft speed developed by a WEC-PTO, ω, is treated as an input to the DC machine. Electromechanical-torque-produced Te is the machine’s output. The other symbols in Figure 3 are: Vb, back electromotive force; Va, armature voltage (control input to the DC machine); Kb, voltage constant; Km, torque constant; and Ra and La, armature resistance and inductance, respectively. The mechanical WEC-PTO stage represents the combined WEC-Sim RM3, SC, and gearbox models. The WEC-PTO stage needs to develop the prime mover torque Tm1 (the geared-down version of Tm) on the generator’s shaft and overcome electromechanical torque Te for positive power generation. The difference is the acceleration torque, given by
T m 1 T e = J d ω d t ,
where J is the combined inertia of the coupled rotational system, including the electrical machine and gearbox. For simplicity, friction torque is assumed to be small and will be ignored. The crankshaft torque Tm is developed by the WEC-Sim RM3 and SC mechanism. Torque formulation for an SC mechanism involves two components [27]:
  • Drive torque is
    T d = F b · k θ , l , r .
  • Vibration torque is
    T i = m c r + m s · c o s θ + λ · c o s 2 θ · r · ω 2 · k θ , l , r
    where Fb is the total hydrodynamic force acting on the slider, the transfer function k is
    k θ , l , r = r · s i n θ · 1 + λ · c o s θ 1 λ · sin θ 2 ,
θ , l , r are defined in Figure 2, λ is the ratio of the crank radius ( r ) to connecting rod length ( l ), and ms and mcr are the mass of the slider and connecting rod, respectively. Then, the total hydrodynamic torque function acting on the crankshaft can be given as
T m = T d + T i .
The vibration torque is significantly smaller than the drive torque and can be ignored for low-speed applications [28]. Therefore, Tm will be dictated by Td. The WEC-Sim RM3 calculates the final component in torque production, Fb, and it is
F b = F e F h ,
where Fe is the wave excitation force and Fh is the total hydrodynamic force acting on the two-body WEC-Sim RM3 geometry. As the spar section was fixed, Fe and Fh are both evaluated for the float section. It is important to note that the electrical machine’s torque and speed are the scaled forms of the crankshaft’s torque and speed (scaled by the gear ratio).
The electrical power produced at the machine terminals in the time domain can be given by
p e t = v a t i a t = ( v b t R a i a t L a d i a t d t ) i a t ,
where ia represents armature current and is related to Te by
i a t = T e t / K m .
As this study tries to achieve a relatively constant speed, it can be concluded from Equation (6) that
T e T m 1 .
Considering (13), the changes in ia(t) will also be slow because of ocean waves’ low-frequency nature; they range between 0.1 Hz and 0.2 Hz. Accordingly, the derivative term will be small and can be ignored in (12). By recognizing Kb = Km, the electrical power formulation will eventually result in
p e t = ω t T m 1 t 1 K m 2 R a T m 1 2 t .
From (15), several conclusions can be drawn:
  • The product term ωTm1 is the mechanical power pm(t) developed by the crankshaft; its mean value needs to be maximized for maximum electrical mean power and cumulative energy extraction. This power is maximized by the phase-lock control algorithm, which will be explained in the upcoming paragraphs.
  • The other product term that is subtracted from pm(t) represents the losses, which need to be minimized for high-conversion efficiency. There are three different ways of doing this:
    • The most prevalent method is to minimize the Tm1 waveform. This can be achieved by using higher gear ratio. This process is analogous to minimizing power transmission losses by using step-up transformers to increase line voltage and reduce line currents. The losses are inversely proportional to the gear ratio square, so the gear ratio needs to be maximized as long as the machine’s speed rating is not violated. In this paper, a few different gear ratios will be evaluated, and results will be discussed.
    • The next important method is to maximize Km, which is a machine construction-specific parameter. The losses are again inversely proportional to the square of Km. This parameter can be increased by selecting a larger machine geometry as well as a larger air gap flux density. As the project in this paper uses a fixed-size machine, this parameter was not modified.
    • Finally, armature resistance Ra can be reduced for smaller losses. Obviously, this process also requires different machine construction with a larger gauge wire in the armature coil. The benefit from Ra modification is not as great as from Tm1 and Km. This parameter also was not modified during this research.
  • Assuming the relatively small loss term in (15), the PTAP ratio can be reduced by limiting fluctuations in both ω and Tm1. One of the research objectives is to limit speed fluctuations to within ±40% through the phase-lock control algorithm. In addition, the Tm1 waveform is proposed to be modified by changing the crank radius and connecting rod length, as dictated by (14). Minimizing fluctuations in the Tm1 will theoretically reduce the PTAP ratio as well as losses. In addition, the loss term in (15) can be affected by both average and root-mean-square (RMS) values of Tm1. Therefore, reducing the RMS value of Tm1 by minimizing fluctuations will help with the PTAP ratio as well as the mean electrical power extracted.

2.2. Methodology for Maximum Power Point Tracking and Control

Complex conjugate control is the literature’s well-known method to achieve maximum power transfer from ocean waves to PTO devices. In this method, both the amplitude and phase of power capture device motion need to be adjusted to gain full advantage of this control technique [15]. Some of the classical WEC control algorithms, such as reactive control, linear damping, Coulomb damping, and latching control, are discussed in [20]. In addition, an overview of advanced control techniques for wave energy systems can be found in [29]. In a fixed-stroke slider-crank mechanism, the motion amplitude cannot be modified; therefore, the only available control option is the phase-lock control, which is suboptimal [27]. This is the methodology for the advanced control algorithm employed in this research—a reactive control algorithm utilizing a rule-based strategy. Keeping a hydrodynamic object’s velocity and wave excitation force in phase is the way to achieve this phase-lock condition. This method is detailed in [27], but a summary of the control algorithm is as follows. This is an angle-control algorithm with two inputs (the machine’s shaft angle and wave excitation force) and one output (the reference machine speed). The wave excitation force measurement is only needed for zero crossings. Once the algorithm detects upcoming two zero crossings, the half-period for a future half-cycle can be predicted. For example, it has been shown by Khan et al. (2019) that an autoregressive filter with an order of 15 can accurately predict zero crossings and half-periods effectively for commonly found waves [30]. The study conducted in [30] was a pure numerical simulation on a high-performance computing system. The reference machine angle for the next half-cycle is updated with the information of a predicted half-period. This process requires a linear extrapolation method, as in
θ * = θ p r e v + 180 · t T h ,
where θ* is the reference angle for the future half cycle, θ (prev) is the machine’s angle at the end of the previous half-cycle (an integer multiple of 180°), t is the time elapsed after the end of the previous half-cycle, and Th is the predicted future half-cycle of wave excitation force. The reference angle is kept within ±180° with a simple rollover algorithm. The difference between θ* and the measured machine shaft angle is used to update the reference machine speed in rpm by
n * = n c a l c · 1 + δ · θ * θ ,
where n* is the reference speed, n(calc) is the calculated reference speed based on Th, δ is the angle controller update constant, and θ is the measured shaft angle. This update process is repeated until the cost function C f is reduced below a certain threshold ε.
C f = θ * θ
When Cf is less than ε, n* stays the same as n(calc). Finally, a saturation function limits n* before getting applied to the speed proportional integral derivative (PID) controller. A block diagram of the fully numerical control system is shown in Figure 4. Both PID controllers were tuned using the K-Factor design approach [31]. The crossover frequency for the current PID controller needs to be at least five times larger than the speed PID controller for handling faster torque response. In addition, the speed PID controller requires a nonzero derivative term for effective handling of jitter in the output speed, while the current PID controller can have a zero-derivative term.
The control system shown in Figure 4 is only suitable for a pure numerical model because speed sensed is directly used to actuate the DC machine for power generation. In a physical hardware implementation, this is not possible, and this process requires another machine to emulate speed actuation function. This is explained in the experimental test setup section. The high-level control strategy, or the reactive control algorithm, is shown in Figure 4 by the dashed block “Phase Tracking and Correction Process.”
The angle-prediction algorithm is quite effective but processor intensive [30]. Therefore, in this study, zero crossings and half-periods for the wave excitation force series are assumed to be known to keep real-time processing overhead minimal. For regular waves, the angle-prediction process is straightforward, and there is no impact on the overall performance. For irregular waves, the angle-prediction process had an overall impact of approximately 4% reduction in output power [30]. Therefore, the impact on the real-time system is expected to be minimal.
The control algorithm in [27] had few simplifying assumptions: (1) the Joint North Sea Wave Project spectrum has a tight frequency-spreading parameter (γ) of 6, (2) speed reference saturation limits are within ±50%, and (3) speed reference command is only updated once every half-cycle. In the current study, these simplifying assumptions were eliminated, to a degree. A frequency-spreading parameter (γ) of 1 was used to better reflect the real waves. As a result, irregular waves’ frequency content is richer than is the case with γ of 6 as in [27]. This requires a more agile control system with a different set of controller parameters to keep up with faster dynamics in waves. Specifically, δ had to be fine-tuned, speed reference limits had to be re-evaluated, and speed reference command should be updated more frequently. Reducing the speed reference limits is desirable because they can help reduce the PTAP ratio, based on (15). However, the phase-lock control algorithm needs to keep up with irregular waves’ changing frequency patterns to maximize the power extracted. If the speed limits are too tight, then the controller can lose synchronism and extracted power levels can suffer. Therefore, a semi-arbitrary figure of +40% is initially proposed to evaluate the PTAP ratio and the mean power balance. Speed reference command is now continuously updated rather than updated once every half cycle (a step change) as in [27]. The end result was better excitation wave force phase tracking performance and higher output power.

2.3. Experimental Setup for HIL Simulations

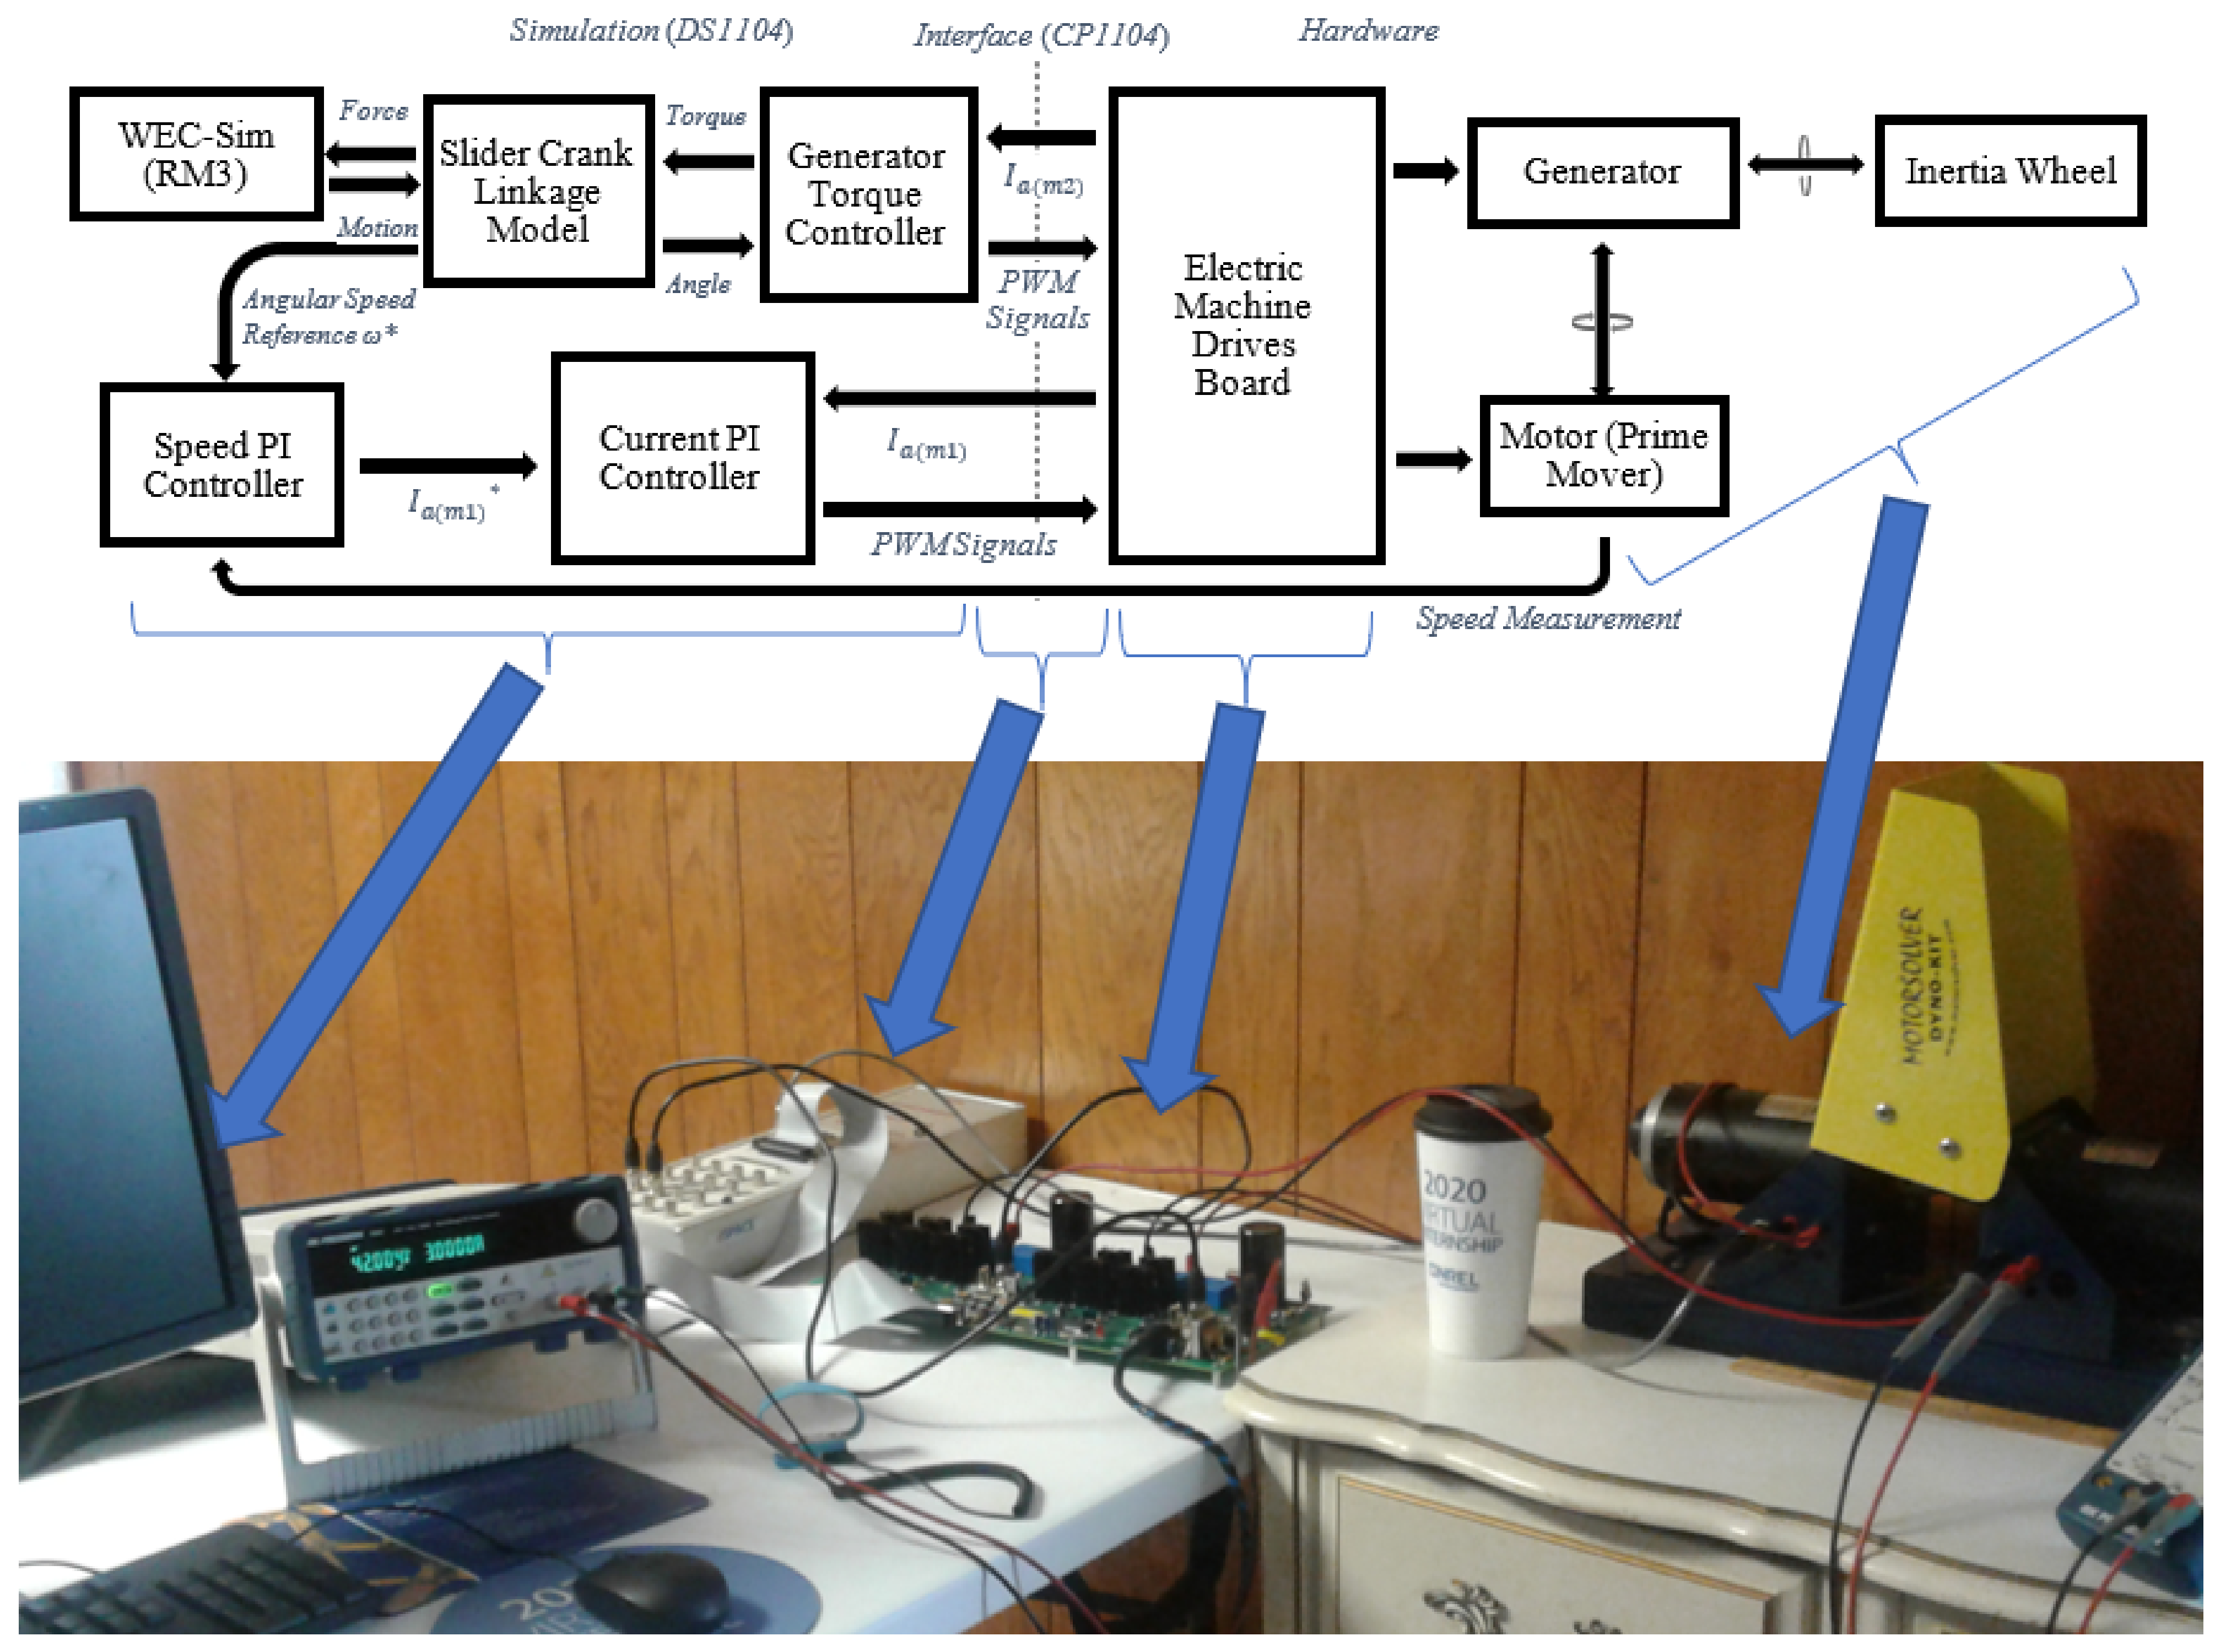
The project setup was designed by using the WEC-Sim RM3/SC integration and applying this model to a physical experiment. The connecting rod and crankshaft in the SC-linkage model was also built in Simscape Multibody and was directly connected to the WEC-Sim RM3 model. The WEC-Sim RM3/SC integration outputs the crank’s pitch motion information (angle and speed), which is the input into a Simulink system where an HIL simulation takes place. The WEC-Sim RM3/SC model is actuated by the torque that is processed through electromechanical system controllers. Figure 5 shows a detailed visualization of the HIL simulation and experimental setup. Table 1 has the list of equipment used. In Figure 5, ω* is the WEC-PTO speed reference for the motor controller, Ia(m1) is the measured armature current for the motor, and Ia(m2) is the measured armature current for the generator. The current sensors are attached to the electric machine drives board. The digital signal processor (DSP) control board (DS1104) takes current measurements through its CP1104 interface and sends the data to the dSPACE Control Desk 5.5 (dSPACE, Wixom, MI, USA) software, a graphical user interface application that displays the data and records the measurements. Speed measurement is taken separately through a speed encoder attached to the shaft.
The DS1104 board also takes this measurement from its CP1104 interface and sends it to the dSPACE Control Desk software. The entire simulation model (upper left half of Figure 5) runs from the DS1104 hardware board (attached to the computer in the far left side of the experimental setup).
In the WEC-Sim RM3 (a two-body system), the float was restricted to move in a heave direction only, while the spar/plate was fixed to the ocean floor. This way, the excitation force that actuates the PTO is the same as the excitation force for the float and can be preprocessed for the sake of simplicity.
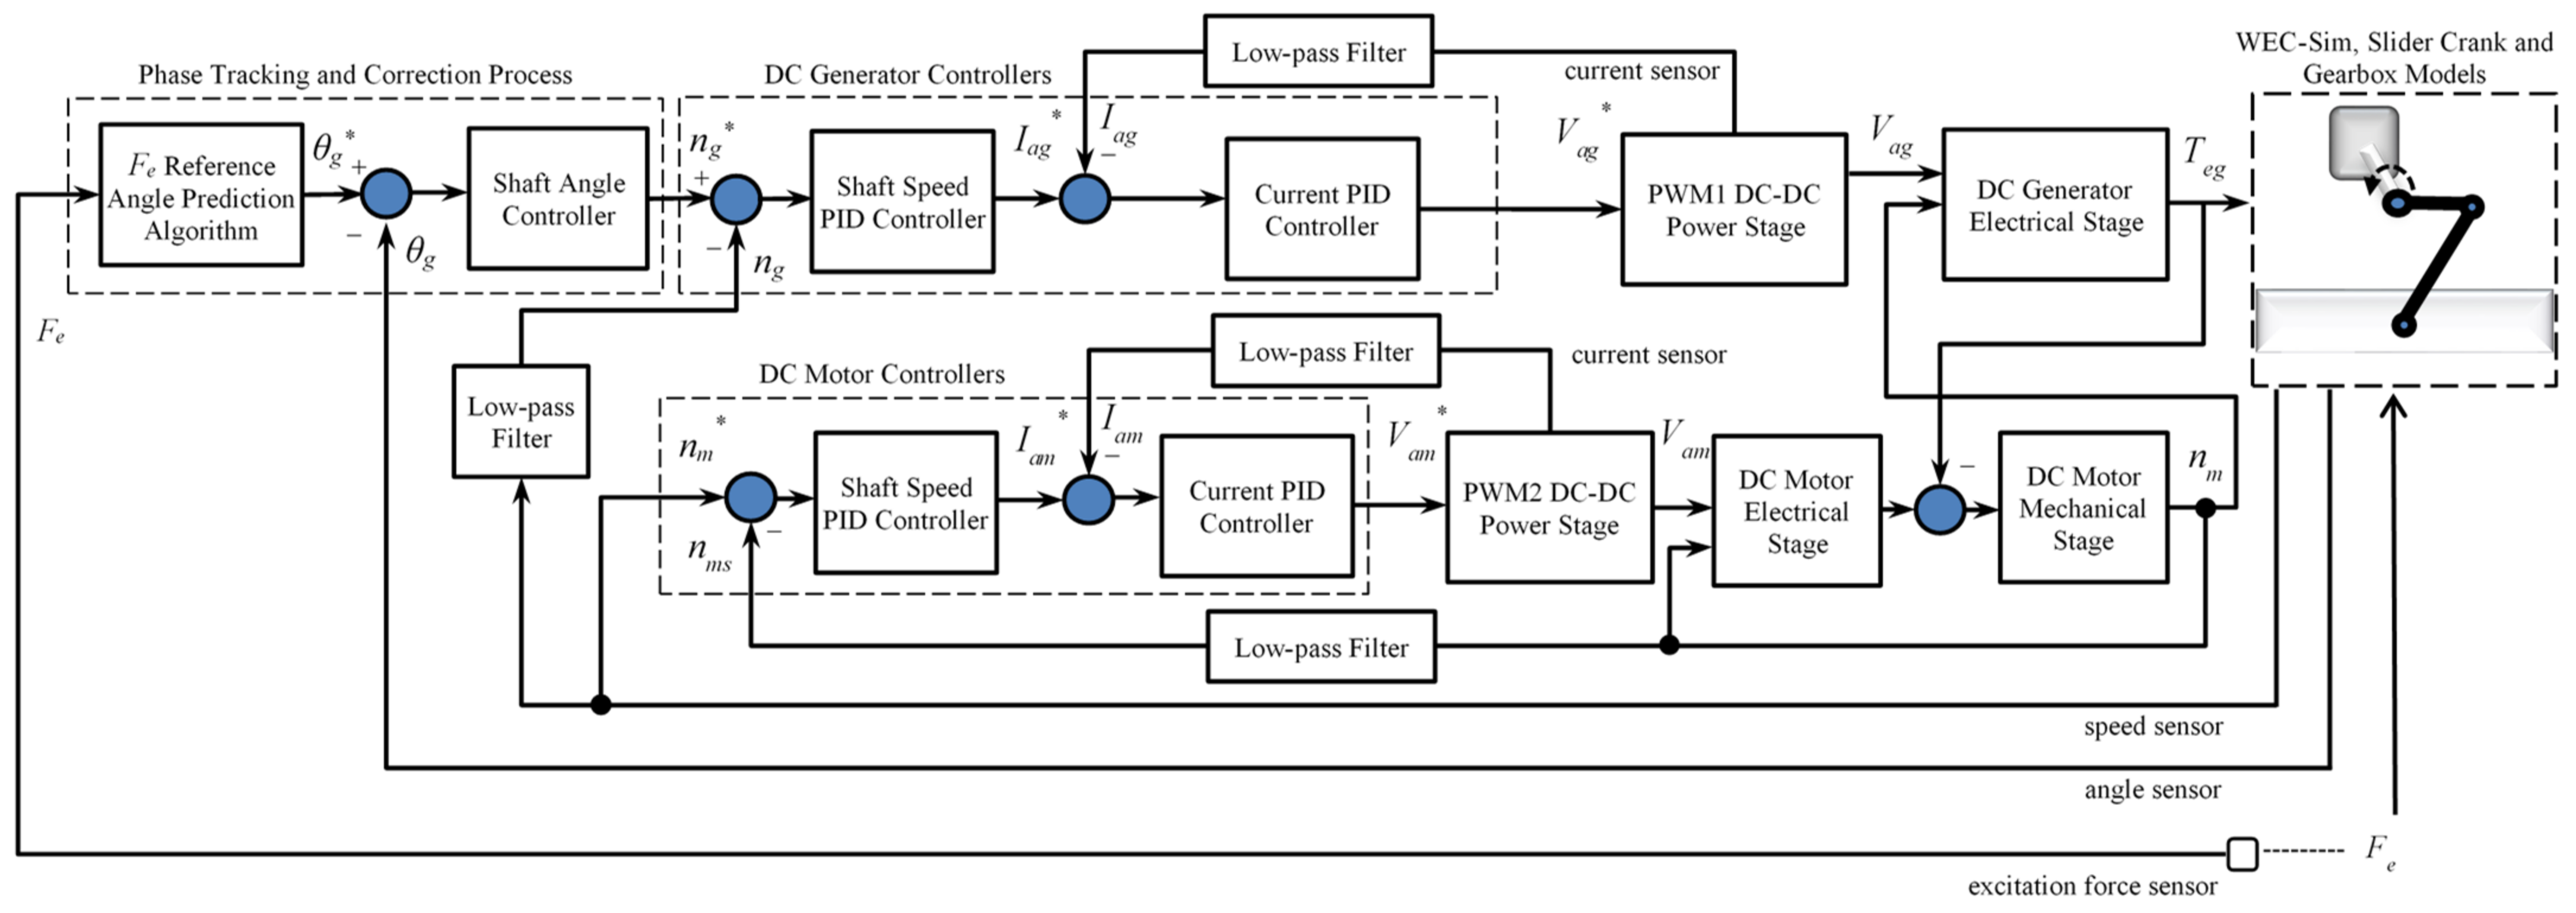
Figure 6 shows the control system block diagram designed for the HIL simulation. The electromechanical system symbols with the subscript “g” in Figure 6 represent the generator variables. The symbols with the subscript “m” represent the motor (or the prime mover) variables. The symbols with the subscript “a” represent the armature circuit variables. The symbols with the superscript “*” represent the controllers’ reference signals. In Figure 6, the symbols θ, n, I, V and T are used for angle, speed, current, voltage and torque variables, respectively. Fe is the wave excitation force. As explained in Section 2.1 for Figure 4, another machine is required to emulate the speed actuation function for the DC machine/generator in the experimental test setup. The inclusion of the DC motor (or the prime mover) and associated control blocks/signals is the difference between Figure 6 and Figure 4. The crankshaft’s angular speed becomes the speed reference (nm*) to the DC motor controller. The speed sensed (nms) from the encoder attached to the shaft of the coupled motor/generator pair is used by the motor controller to dictate this speed reference. The DC motor’s speed output (nm) is then used to actuate the DC generator’s electrical stage for power generation. The electromechanical torque (Teg) induced by the generator is the braking torque for the motor.
The dashed block in the upper right corner of Figure 6 combines the WEC Sim RM3, SC, and gearbox models. The dashed block, “Phase Tracking and Correction Process,” in the upper left corner performs the reactive-control algorithm that ensures the wave excitation force and the float velocity are in phase, as explained in Section 2.1. The pitch angle (θg) for the crankshaft is the input to the reactive-control algorithm. This angle needs to have a specific direction (counterclockwise means positive) and an offset (the angle θ when the float is at rest on an undisturbed water surface, as in Figure 2b) before being applied to the algorithm. The output is the speed reference signal (ng*), which is rate-limited before getting processed by the speed PID controller. The speed ramp rates need to be limited carefully to avoid the extreme transients in the machine’s armature current, which may lead to hardware faults in the electronic controller board. The DC generator speed PID’s proportional and integral constants and the speed feedback’s low pass filter cutoff frequencies are tuned using the K-factor approach [31]. The crossover frequency must be selected in accordance with the simulation sampling time. For example, regular wave processing is faster in the WEC-Sim RM3 and, consequently, the sampling rate can be faster. Therefore, a higher crossover frequency can be selected. The differential constant for the PID needs to be tuned manually to minimize jitter in the speed response. The output from the speed PID controller is the armature current reference (Iag*) to the generator, as shown in Figure 6. The DC generator’s current PID controller processes this reference current and generates a voltage reference (Vag*) to be applied to the pulse-width modulation (PWM) stage. All PWM blocks and the DC generator/motor blocks in Figure 6 represent physical hardware components.

3. Results

3.1. Numerical Model Simulations

Full-scale model simulations were first designed for a conceptual wound-field DC machine with the parameters listed in Table 2. The primary objective at this stage is to determine a suitable scaling factor to best utilize the experimental setup within its rated values. The PTO system parameters that will later be optimized were initially crude and could cause larger fluctuations in the power output. To ensure a proper scaling process with linearity, any kind of saturation phenomena with the machine variables needs to be avoided by selecting a relatively large machine size (6 MW). In addition, sea states selected should not be very energetic, as listed in Table 2. Small-scale model simulations used the identified parameters of a laboratory permanent magnet DC (PMDC) machine, also listed in Table 2. This machine model was specifically selected to provide a comparison against the physical system with HIL simulations. The secondary objective at this stage was to verify numerical simulation performance, both for full-scale and small-scale models, rather than optimizing the PTAP ratio or mean power extracted. Initially, full-scale geometry was scaled down by 25 times. However, extracted power levels were relatively small and were sometimes negative. Therefore, a scaling factor of 15 was later used throughout the research study.
The simulation models shown in Figure 4 were constructed in a Simulink environment, and the controllers were tuned for appropriate system dynamics. A gear ratio of 150, a crank radius of 2.5 m, and an arm length of 5 m were used with both models. The extracted mean mechanical power (pm(t)) levels for three different sea states are compared in Table 3. In the scaled-down model, the Froude scaling law was used to redefine various quantities, such as wave height and period; power; mass, and inertia, to have a fair comparison between two models [32]. In summary, for the scaling factor of 15 (Sf = 15), the forces are reduced by (Sf)3 = 3375, the wave height is reduced by Sf = 15, the wave period as well as simulation time are reduced by (Sf)1/2 = 3.873, the power is reduced by (Sf)7/2 = 13,071, the mass is reduced by (Sf)3 = 3375, and the inertia is reduced by (Sf)5 = 759,375.
In Table 3, the absolute error is calculated by
Absolute   Error = P F S P S D × S f 7 / 2 P F S × 100 ,
where P F S is the full-scale model power in watts and P S S is the scaled-down model power in watts.
As shown in Table 3, the absolute error values that compare full-scale and small-scale model power levels using (19) are negligibly small and accurately verify the numerical models’ simulation results. It is important to note that, for a fair comparison, the mean power values reported in Section 3 for the scaled-down model need to be multiplied by 15 3.5 13 , 071 to reflect them to the full-scale model [32].

3.2. HIL Simulations

As the numerical model simulations suggested, the WEC-Sim RM3 and SC geometry were scaled down by 15 times to work within the appropriate limits of the physical hardware. In addition, it has been observed that a crank radius of 2.5 m and an arm length of 5 m resulted in relatively large values of PTAP ratio. Therefore, initial starting points of 2 m for the crank radius and 7.5 m for arm length were selected during HIL simulations. The controller design components and blocks for this stage are detailed in Figure 5 and Figure 6. To properly dictate the pitch velocity referenced by the WEC-Sim RM3 and SC model, the prime mover/motor torque needed to overcome the generator’s regenerative/braking torque. This process required an increase of at least 1.5 A in current limits. Although larger differences were preferable and possible, it would have reduced the generator’s current limit further down from 7 A because of the hardware capabilities, and accordingly, harnessed WEC power levels would have been lower. The switching frequency for the power converters is optimized at 5 kHz to strike a balance between efficiency and fluctuations in input currents.
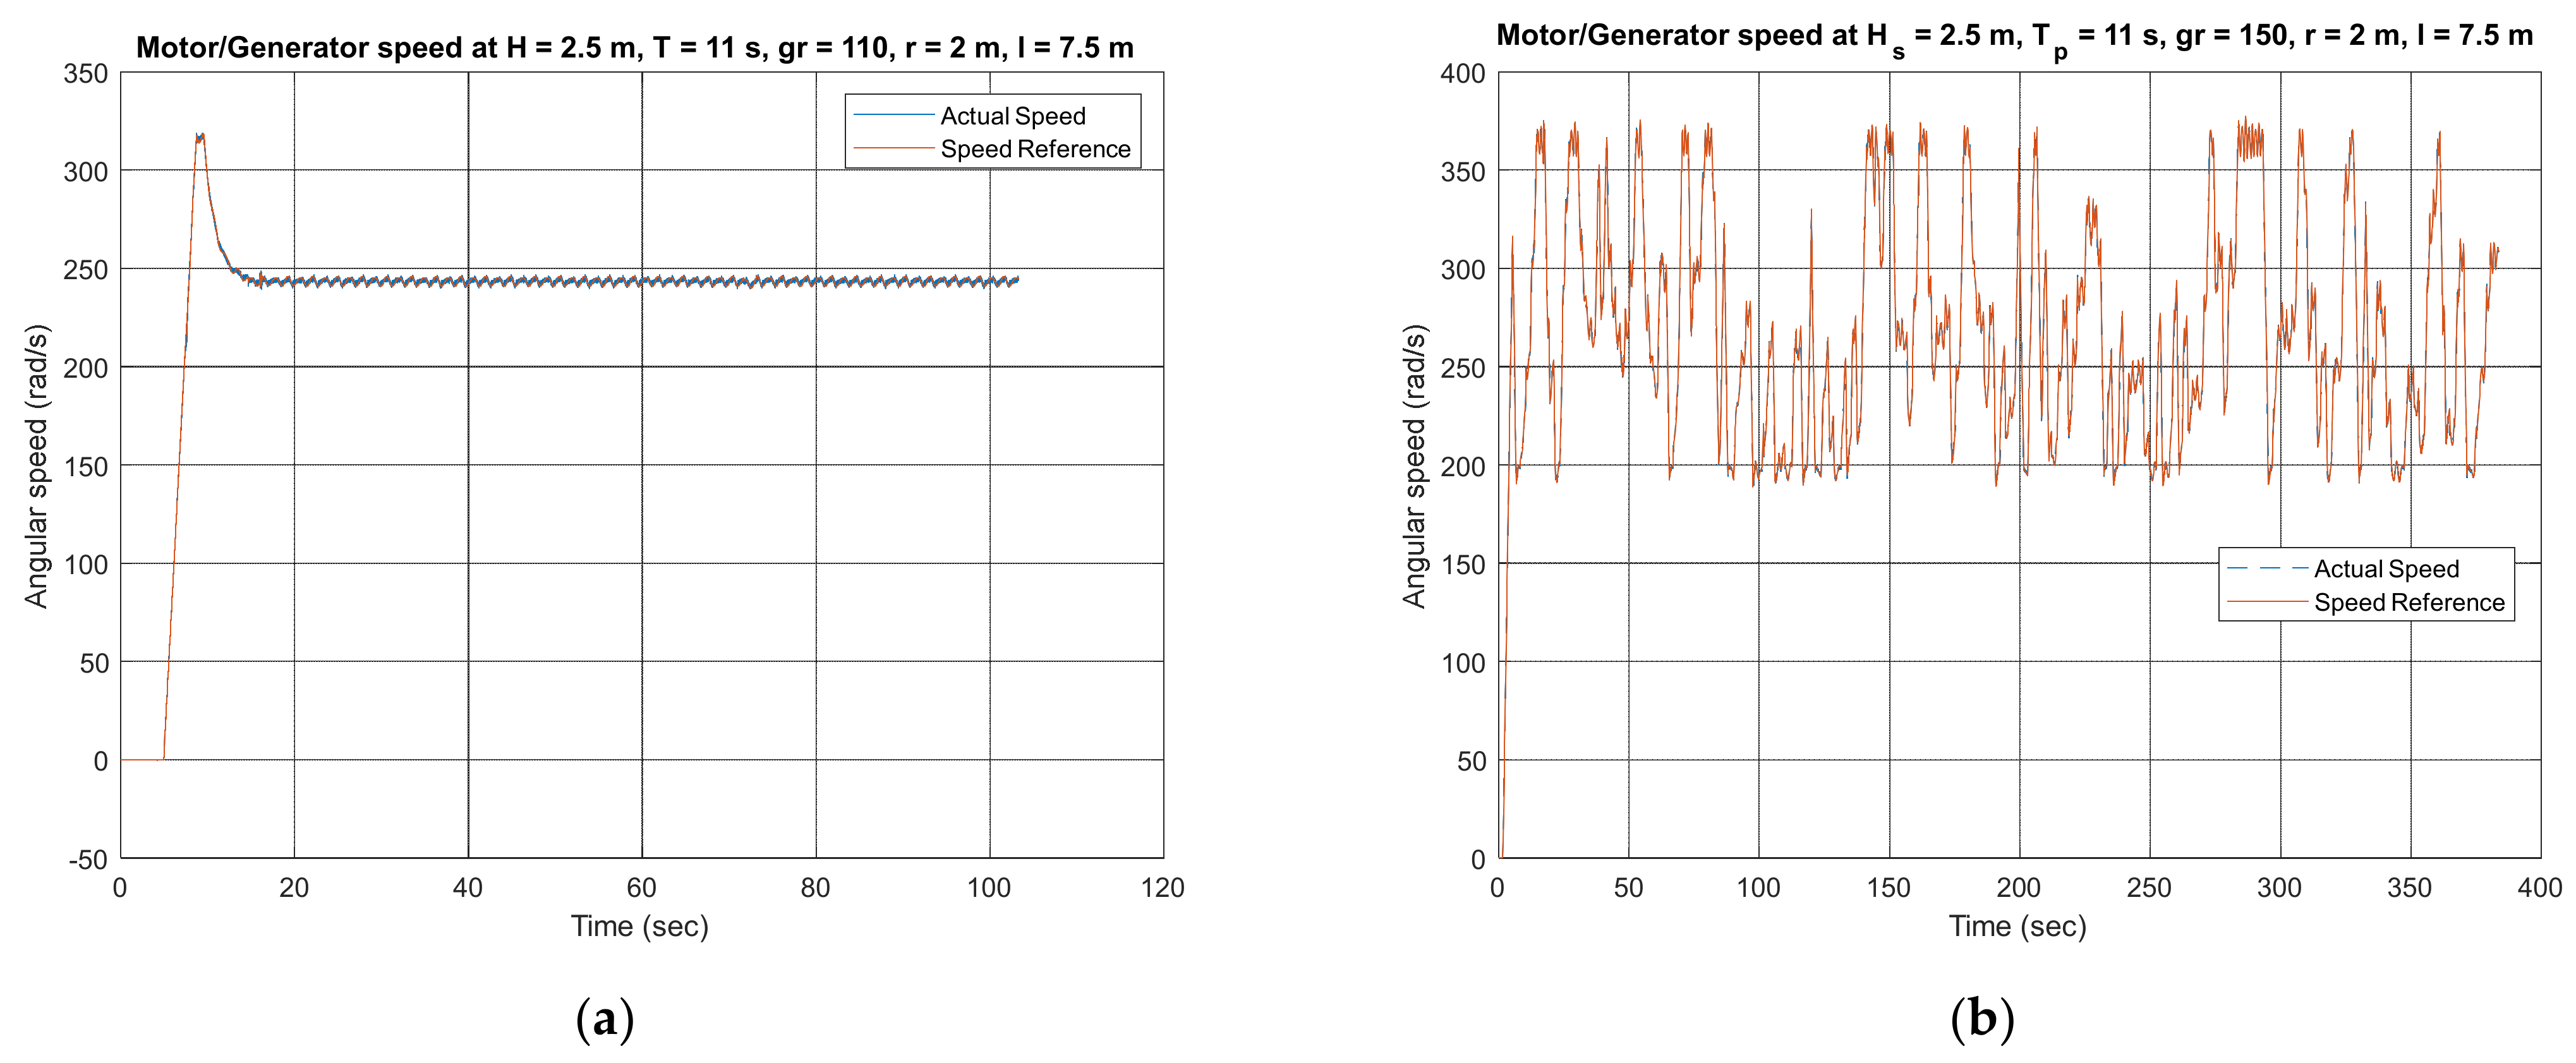
The WEC PTO design with HIL simulations was successfully completed and provided continuous rotation (Figure 7) for both regular and irregular waves. The full-scale model values for wave height, period, crank radius, and arm length are used in reporting the results below for ease of understanding. The speed dynamic for a regular wave sea state (wave height of 2.5 m, wave period of 11 s, gear ratio of 110, crank radius of 2 m, and arm length of 7.5 m) closely follows its reference value to phase lock with the wave excitation force. The irregular wave sea state (significant wave height of 2.5 m, peak period of 11 s, gear ratio of 150, crank radius of 2 m, and arm length of 7.5 m) covers a longer time scale just to be able to obtain an average representation of the entire wave spectrum. The speed stays relatively constant—within ±30% around its mean, which is primarily determined by the peak period.
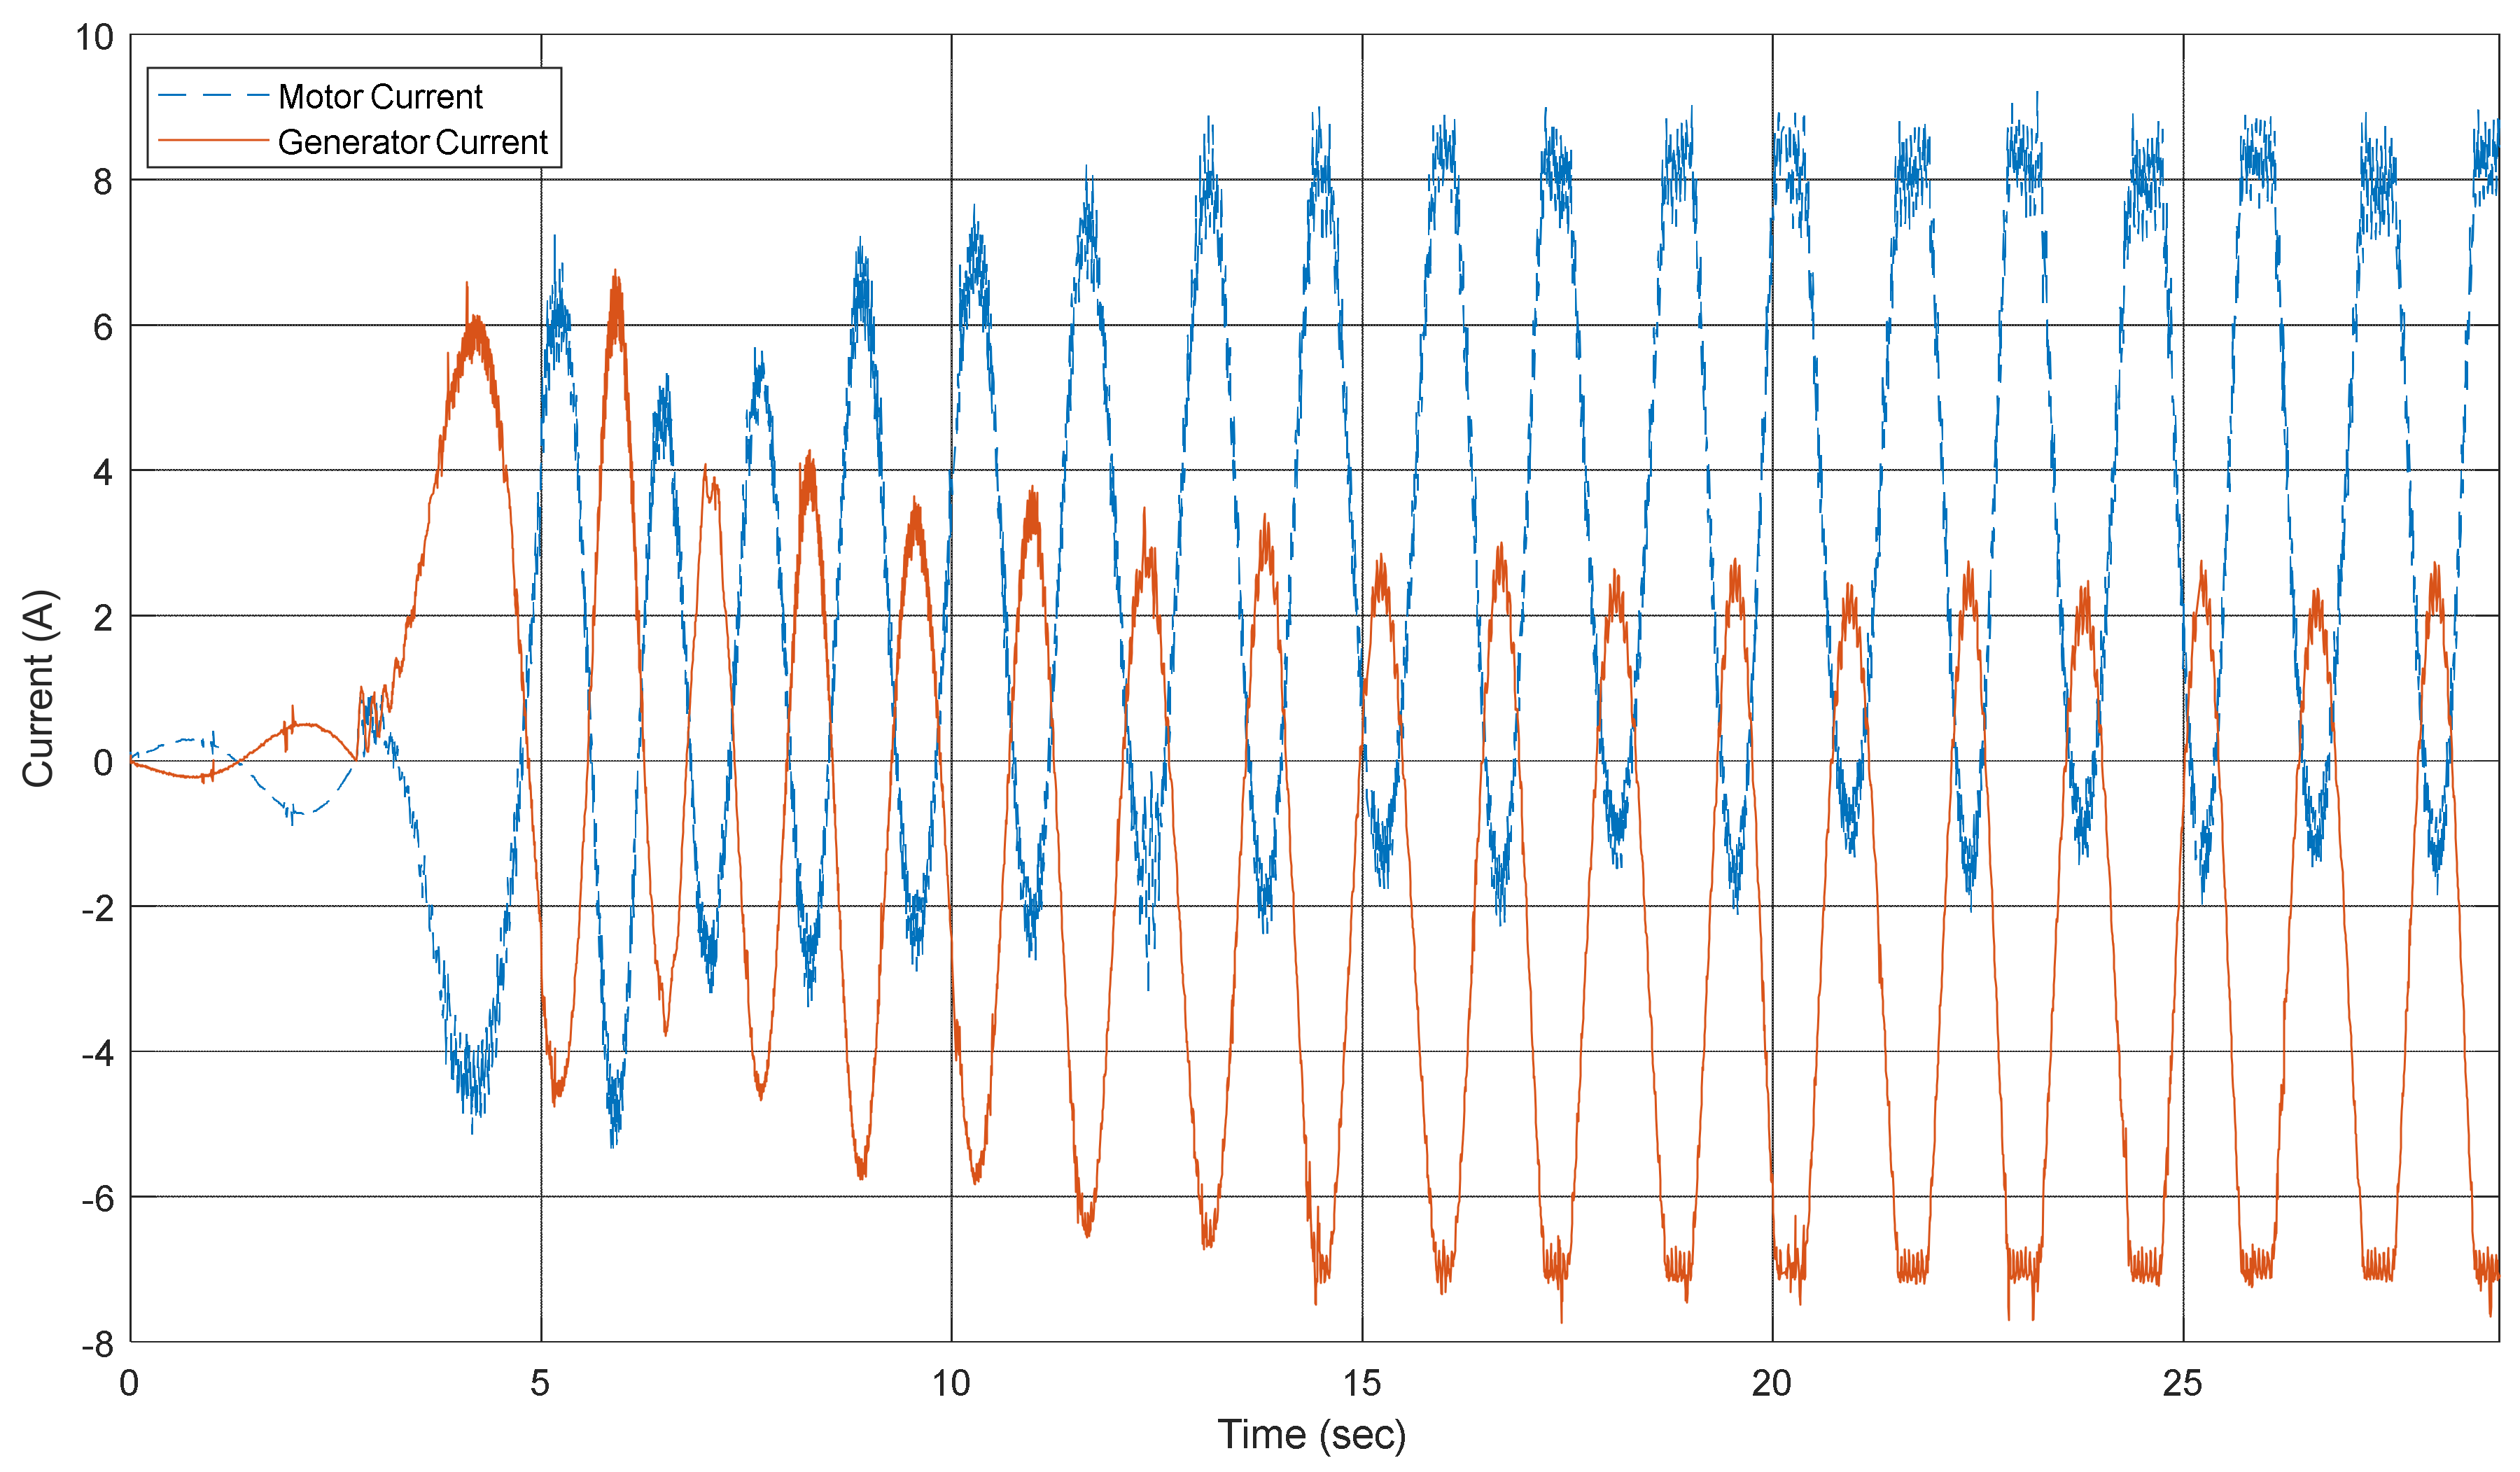
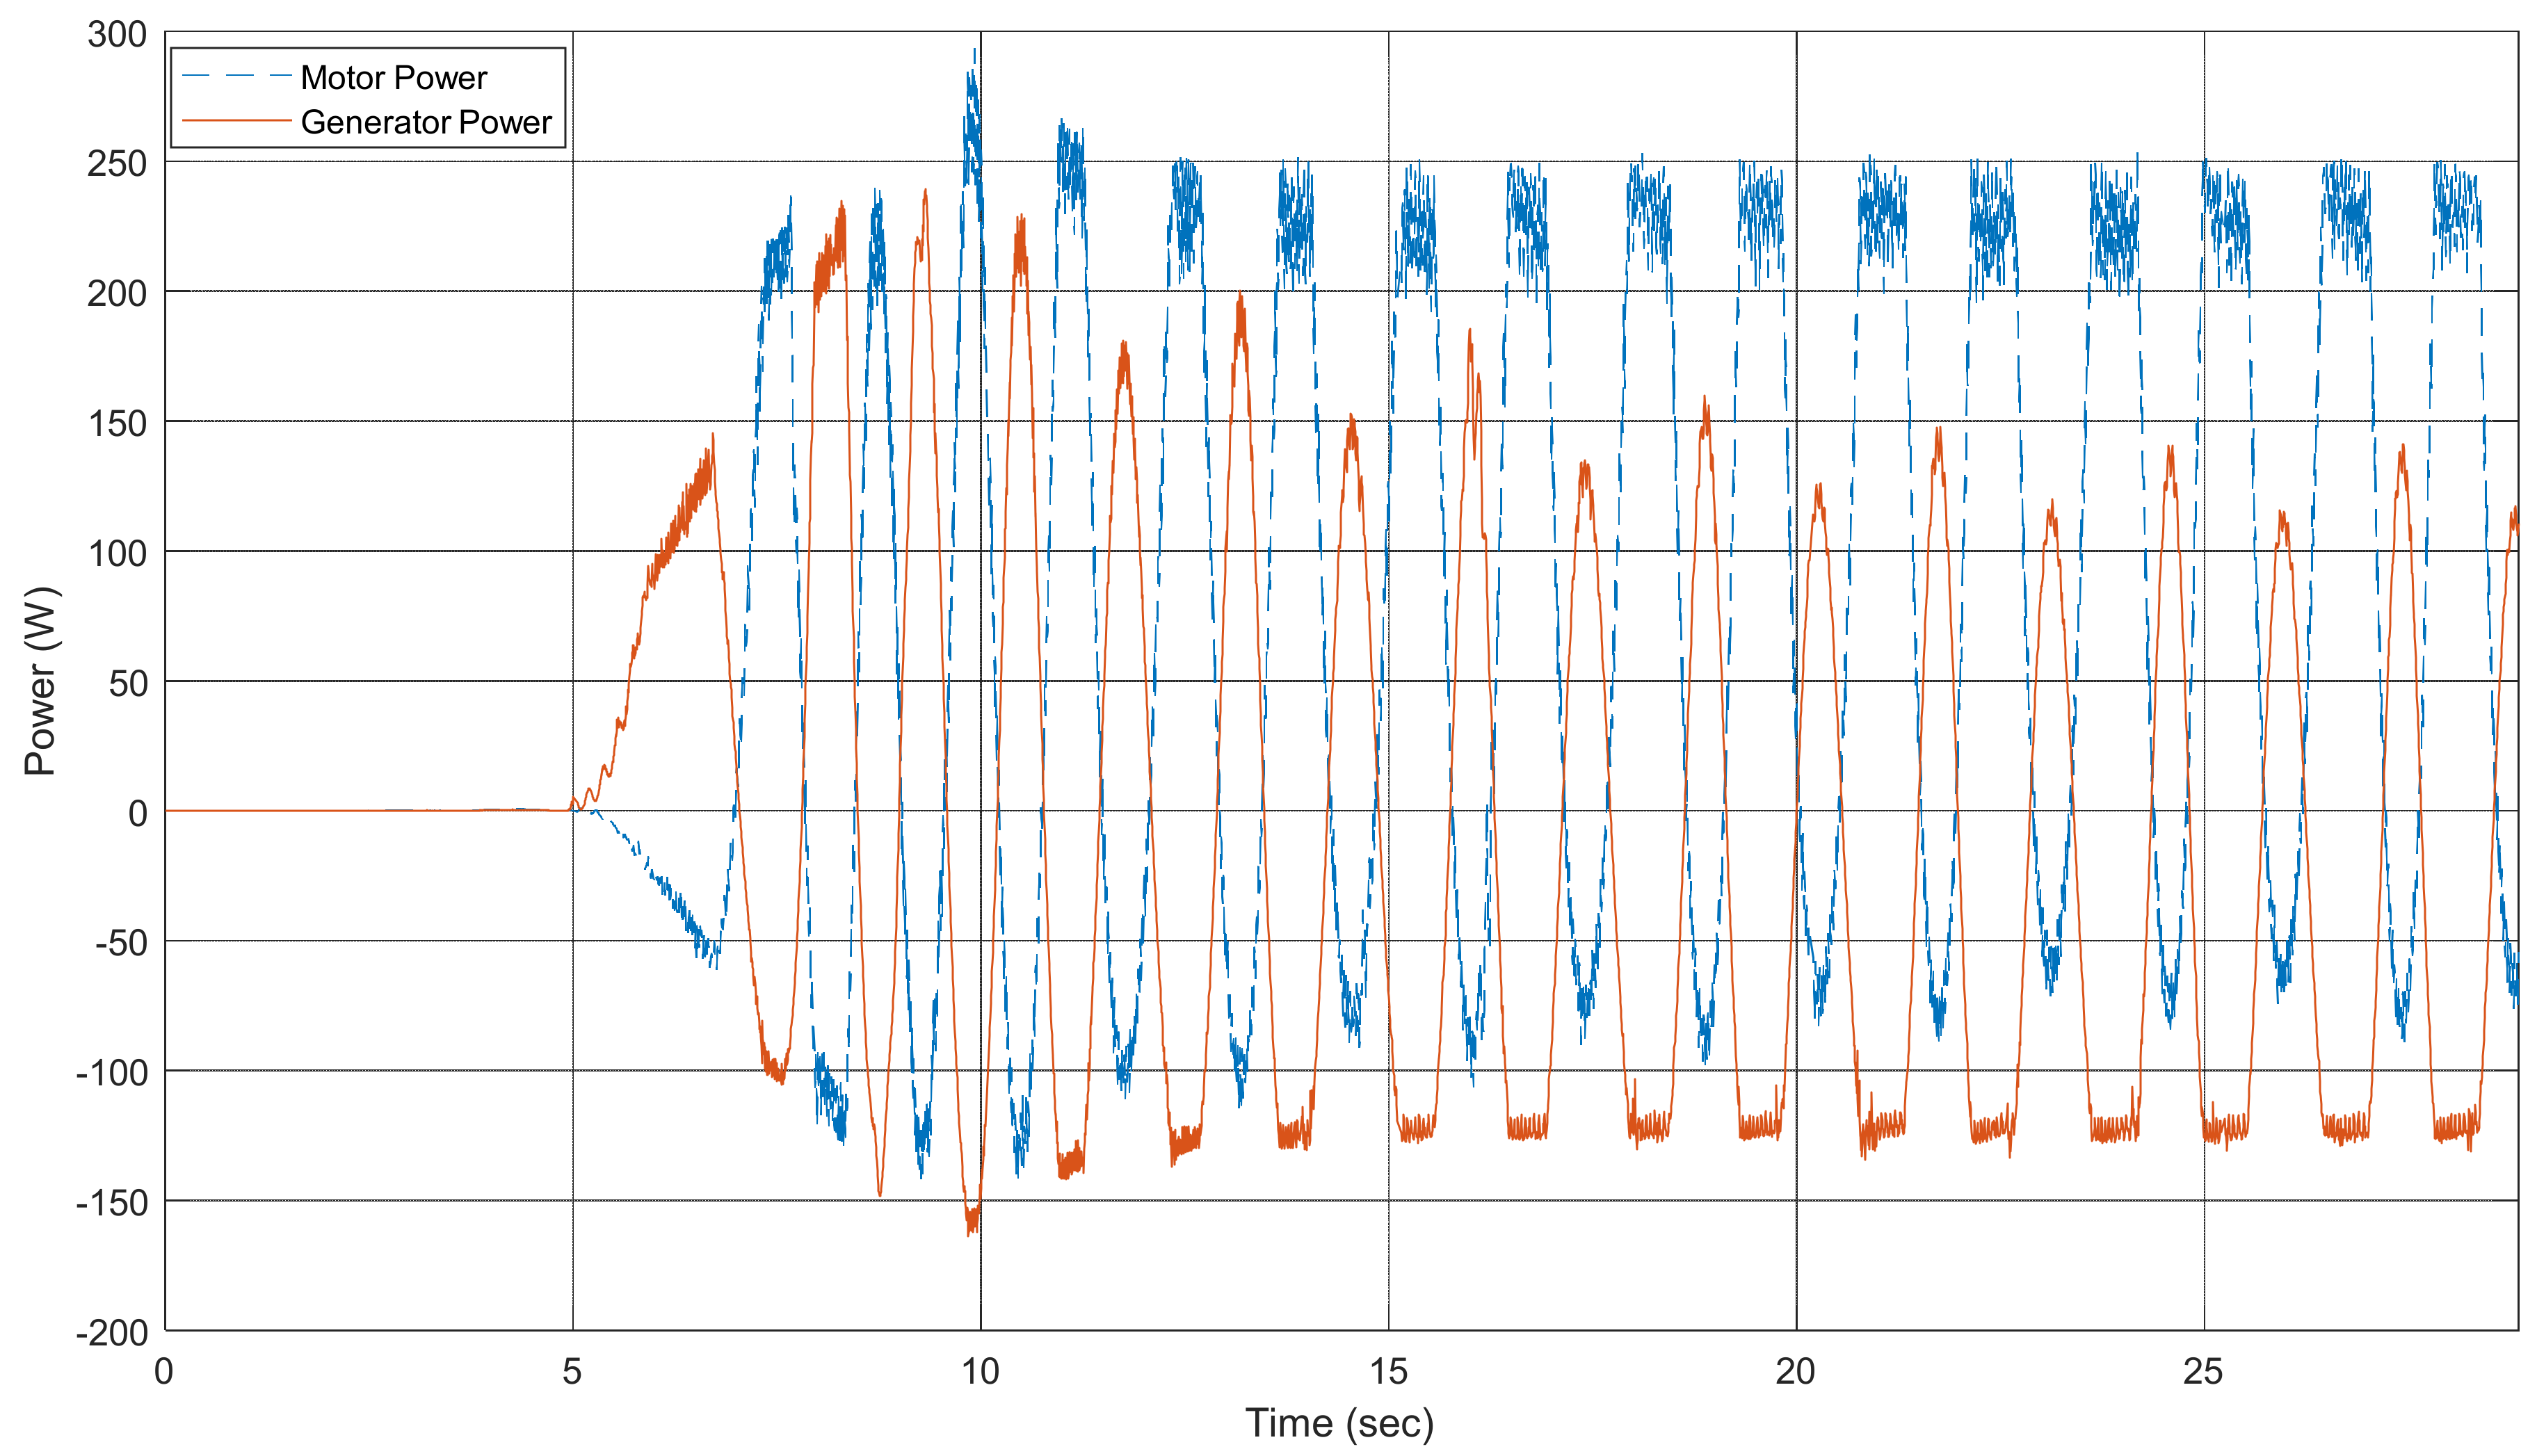
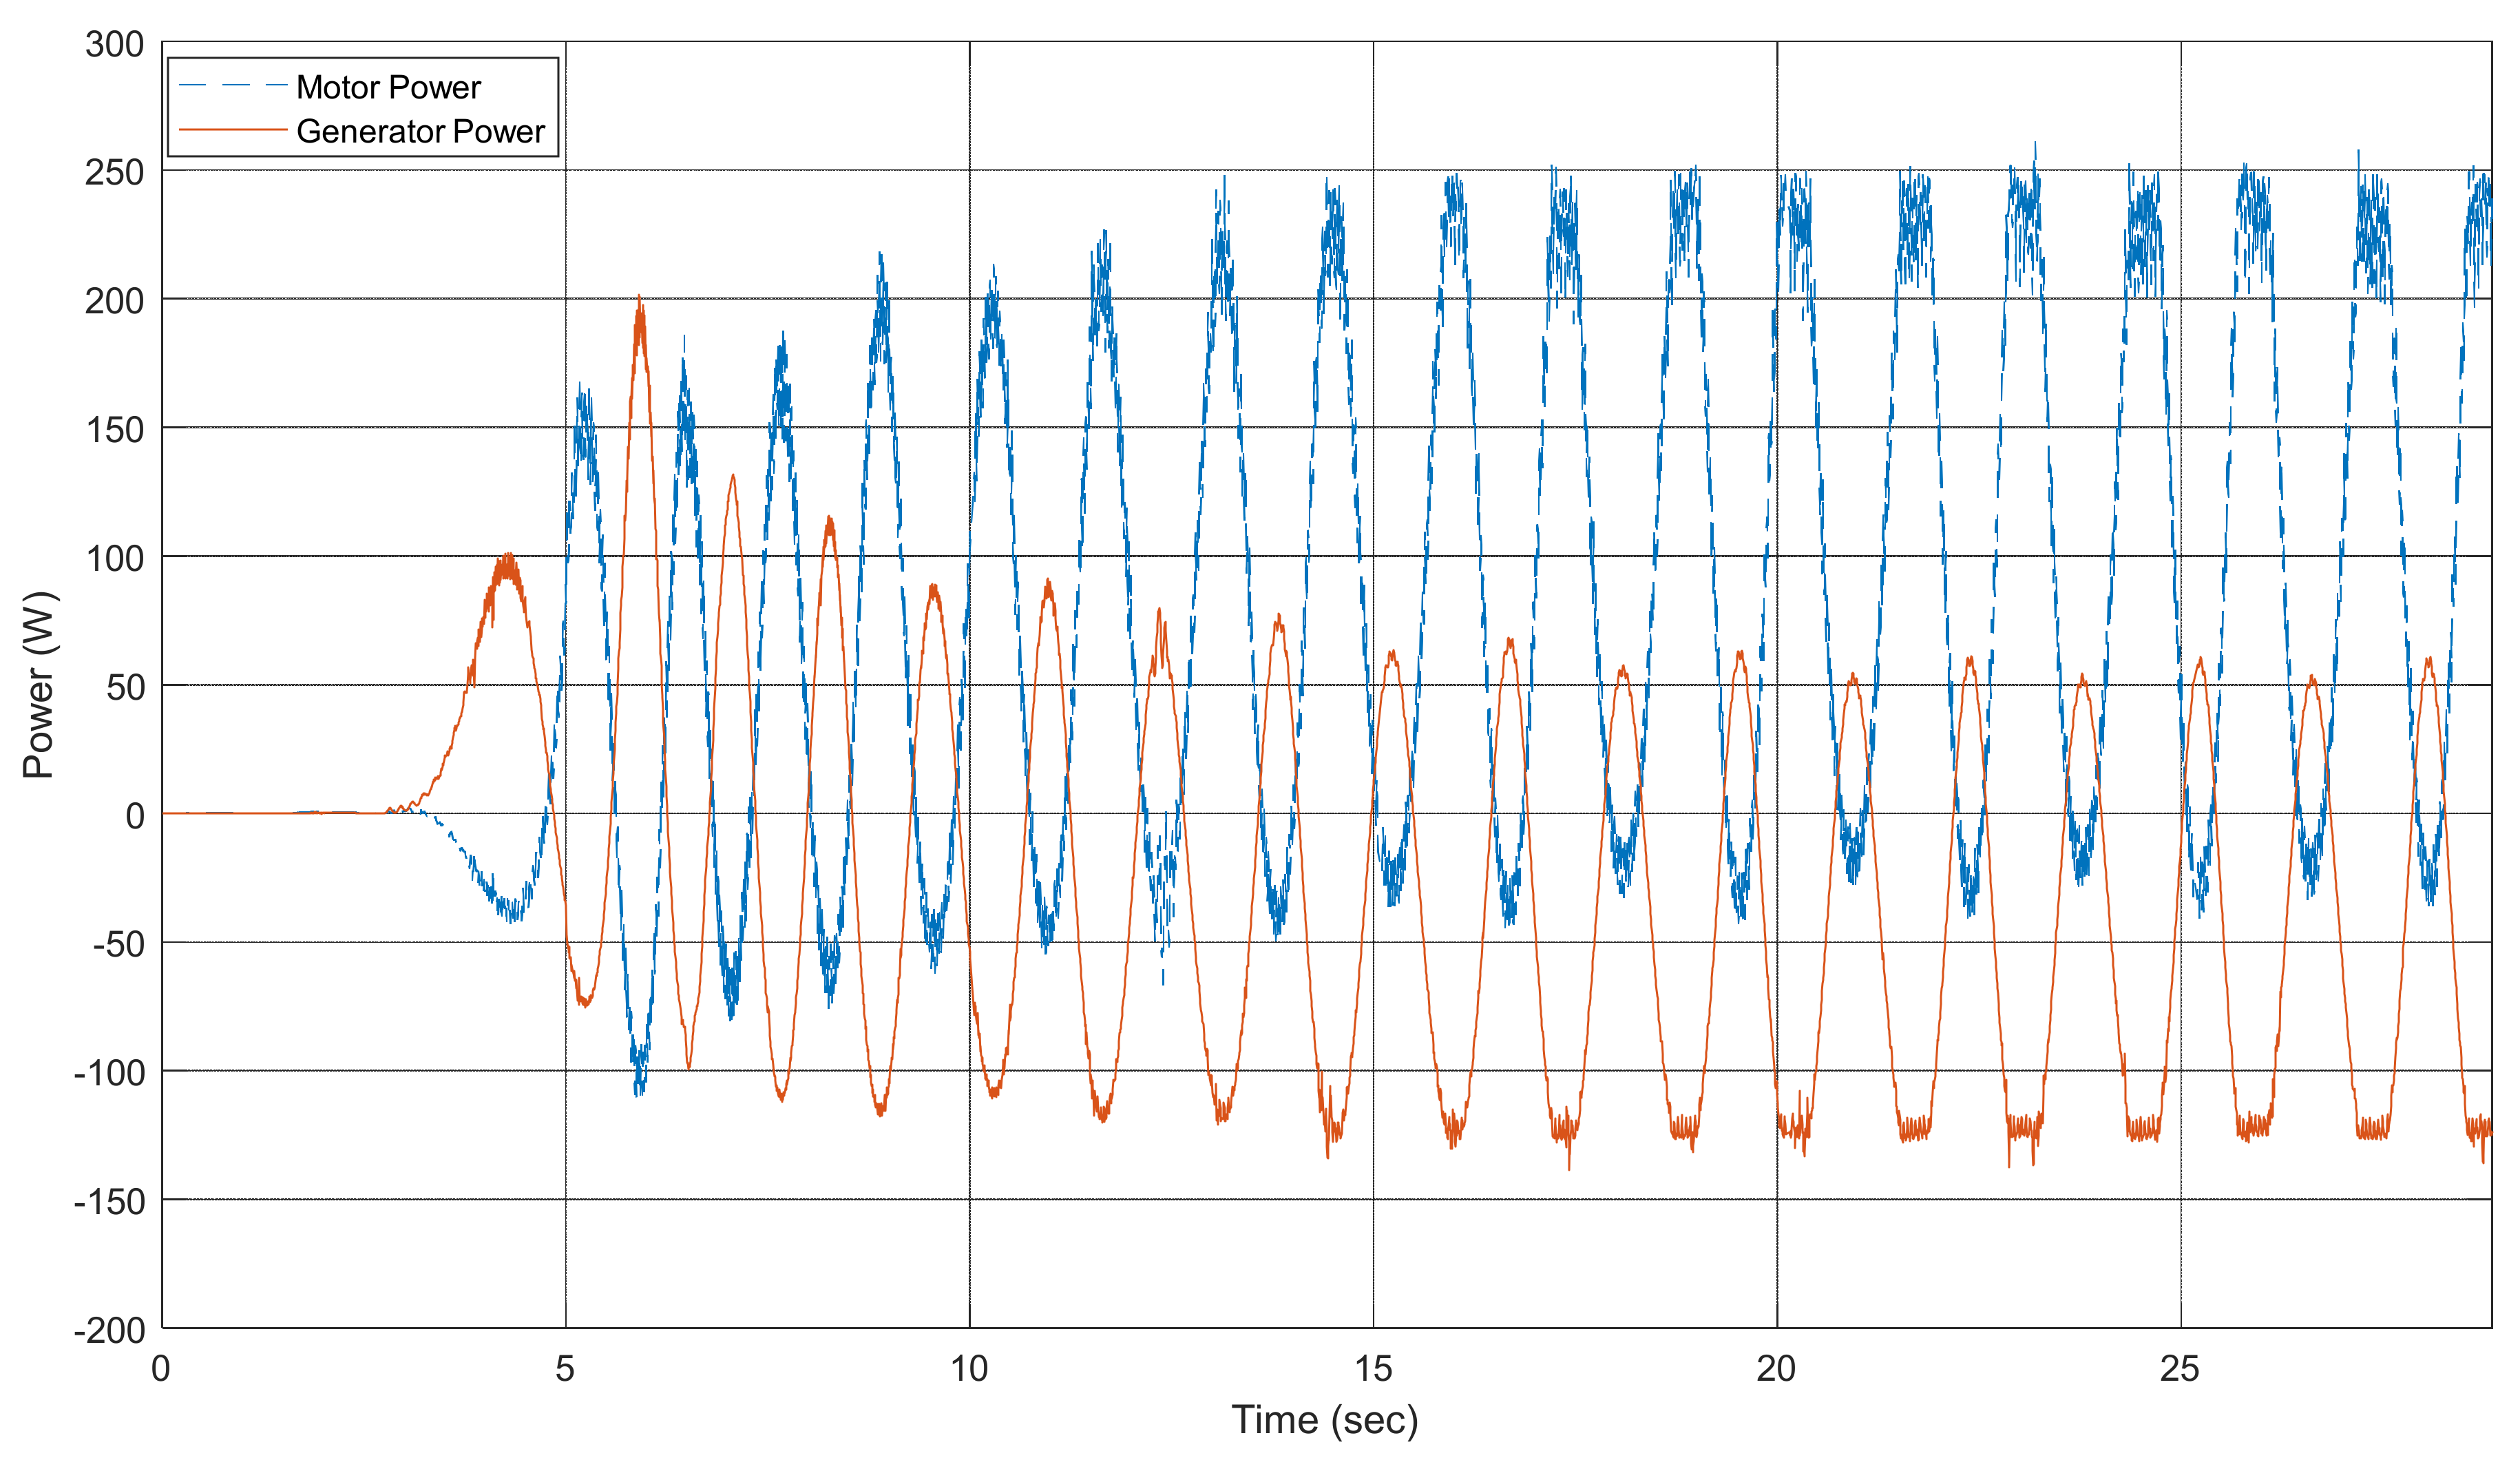
The armature currents drawn by the motor/generator pair (for the regular wave case in Figure 7a) are shown in Figure 8. Both the motor and generator hit their current limits of 8.5 A and −7 A, respectively, because of the relatively low value of the gear ratio. The jitter envelope in the current profiles is switching and measurement noise-related. Increased current fluctuations and lower speed due to a smaller gear ratio caused problems, which substantially contributed to lower mean power and increased the PTAP ratio throughout the tests. Figure 9 clearly highlights that bringing down the crank radius to 1.5 m effectively reduces the peak-to-peak current fluctuations and, therefore, improves both the mean power and PTAP ratio. However, reducing the crank radius is likely to cause diminishing returns at a certain point, which are detailed in upcoming paragraphs. The instantaneous power curves corresponding to the operational cases in Figure 8 and Figure 9 are shown in Figure 10 and Figure 11, respectively. Power drawn (the motor case) translates to positive power, and power produced (the generator case) translates to negative power.
Generated electrical power’s PTAP ratio and mean power results for regular (H = 2.5 m) wave sea states are summarized in Table 4 for a slider crank radius of r = 1.5 m, 2 m and an arm length of l = 7.5 m. Generated electrical power’s PTAP ratio and mean power results for irregular (Hs = 2.5 m) wave sea states are summarized in Table 5 for the same crank radii and arm length. In terms of the PTAP ratio and mean power extracted, a slider crank radius of 1.5 m is the overall best PTO parameter. A gear ratio of 150 was the overall best performer for both the PTAP ratio and mean power, although its PTAP ratio yield was slightly worse than 110 and 133 for regular waves when r = 1.5 m. Most power was extracted at the wave period of 11 s. The lowest PTAP ratio was achieved at T = 13 s for regular waves and Tp = 11 s for irregular waves. For the best values of gear ratio, crank radius, and arm length, the system was able to extract positive power at all wave types (regular or irregular), wave heights (1.5 m, 2 m, and 2.5 m) and wave periods (8 s, 11 s, and 13 s). A larger gear ratio consistently improved results as long as the electric drive system was not the limiting factor. A smaller gear ratio at larger wave heights and periods caused larger current fluctuations that had to be restricted. A larger gear ratio at smaller wave periods resulted in high-speed conditions, which had to be limited again. Any time a limiting function was in place, it had a negative impact on the PTAP ratio as well as the mean power extracted. This problem was the result of loss of resonance during an event requiring current or speed limiting. As explained earlier, current and therefore torque limiting due to large Tm causes acceleration in the generator, which loses synchronism with wave forces until the next control window dictated by the half-period. Speed limiting causes the generator to fall behind the excitation force dynamic, and again the system loses synchronism until a catch-up action occurs in the next control window.
The impact of wave height on generated electrical power’s PTAP ratio and mean power is summarized in Table 6 for regular wave (T = 11 s) sea states and for a slider crank radius of r = 1.5 m, 2 m, and an arm length of l = 7.5 m. The PTAP ratio and mean values of generated electrical power for irregular waves (Tp = 11 s) as a function of wave height are summarized in Table 7 for the same crank radii and arm length. The mean power extracted by regular waves was roughly twice as much as that of irregular waves. As in the case of fixed-wave height results, shown in Table 4 and Table 5, a gear ratio of 150 and a slider crank radius of 1.5 m were overall winners for both the minimized PTAP ratio and maximized mean electrical power in Table 6 and Table 7. As wave height increases, the PTAP ratio decreases and the mean electrical power increases. This can be explained using a biased sinusoidal waveform with a positive mean value that represents the power output. With the increased wave height, peak value increases, as does the mean value of this sinusoidal waveform. However, the waveform can never be always positive because of the control aspect, which requires an energy draw (or negative power) by the generator to achieve resonance condition. Theoretically, for a zero-mean value, the PTAP ratio is infinite. Additionally, for the maximum mean value (which cannot be larger than the sinusoidal wave amplitude), the minimum PTAP ratio would be two for the proposed control methodology. In the case of the irregular wave, with Hs = 1.5 m, r = 2 m, and a gear ratio of 110, the generator was unable to extract positive mean power for the duration of an HIL simulation and, therefore, the PTAP ratio was not calculated.
During irregular wave tests, the angle controller’s update constant δ had to be tuned for proper tracking performance to maximize mean power extracted and to minimize the PTAP ratio. Moreover, the angle controller’s output was a reference to the speed controller, and its ramp rate had to be limited to avoid severe current transients. Both of these processes were conducted concurrently to find the appropriate balance through extensive simulations. The results showed that δ values of up to 0.33 had a positive trend in terms of the mean power and PTAP ratio. After δ = 0.33, the mean power extracted started to stabilize and later reduce. Even with δ = 0.05, the controller produced satisfactory tracking performance in the case of regular waves. In the case of irregular waves, increased ramp limits always helped with a larger mean power and smaller PTAP ratio. However, the electronic controller board consistently produced over current faults beyond a ±800 rpm/sec ramp rate. This is understandable because larger speed ramps require faster torque and faster armature current transients, which cannot be handled by the current controller beyond a certain threshold due to hardware restrictions.

3.3. In-Depth Analysis with Numerical Simulations

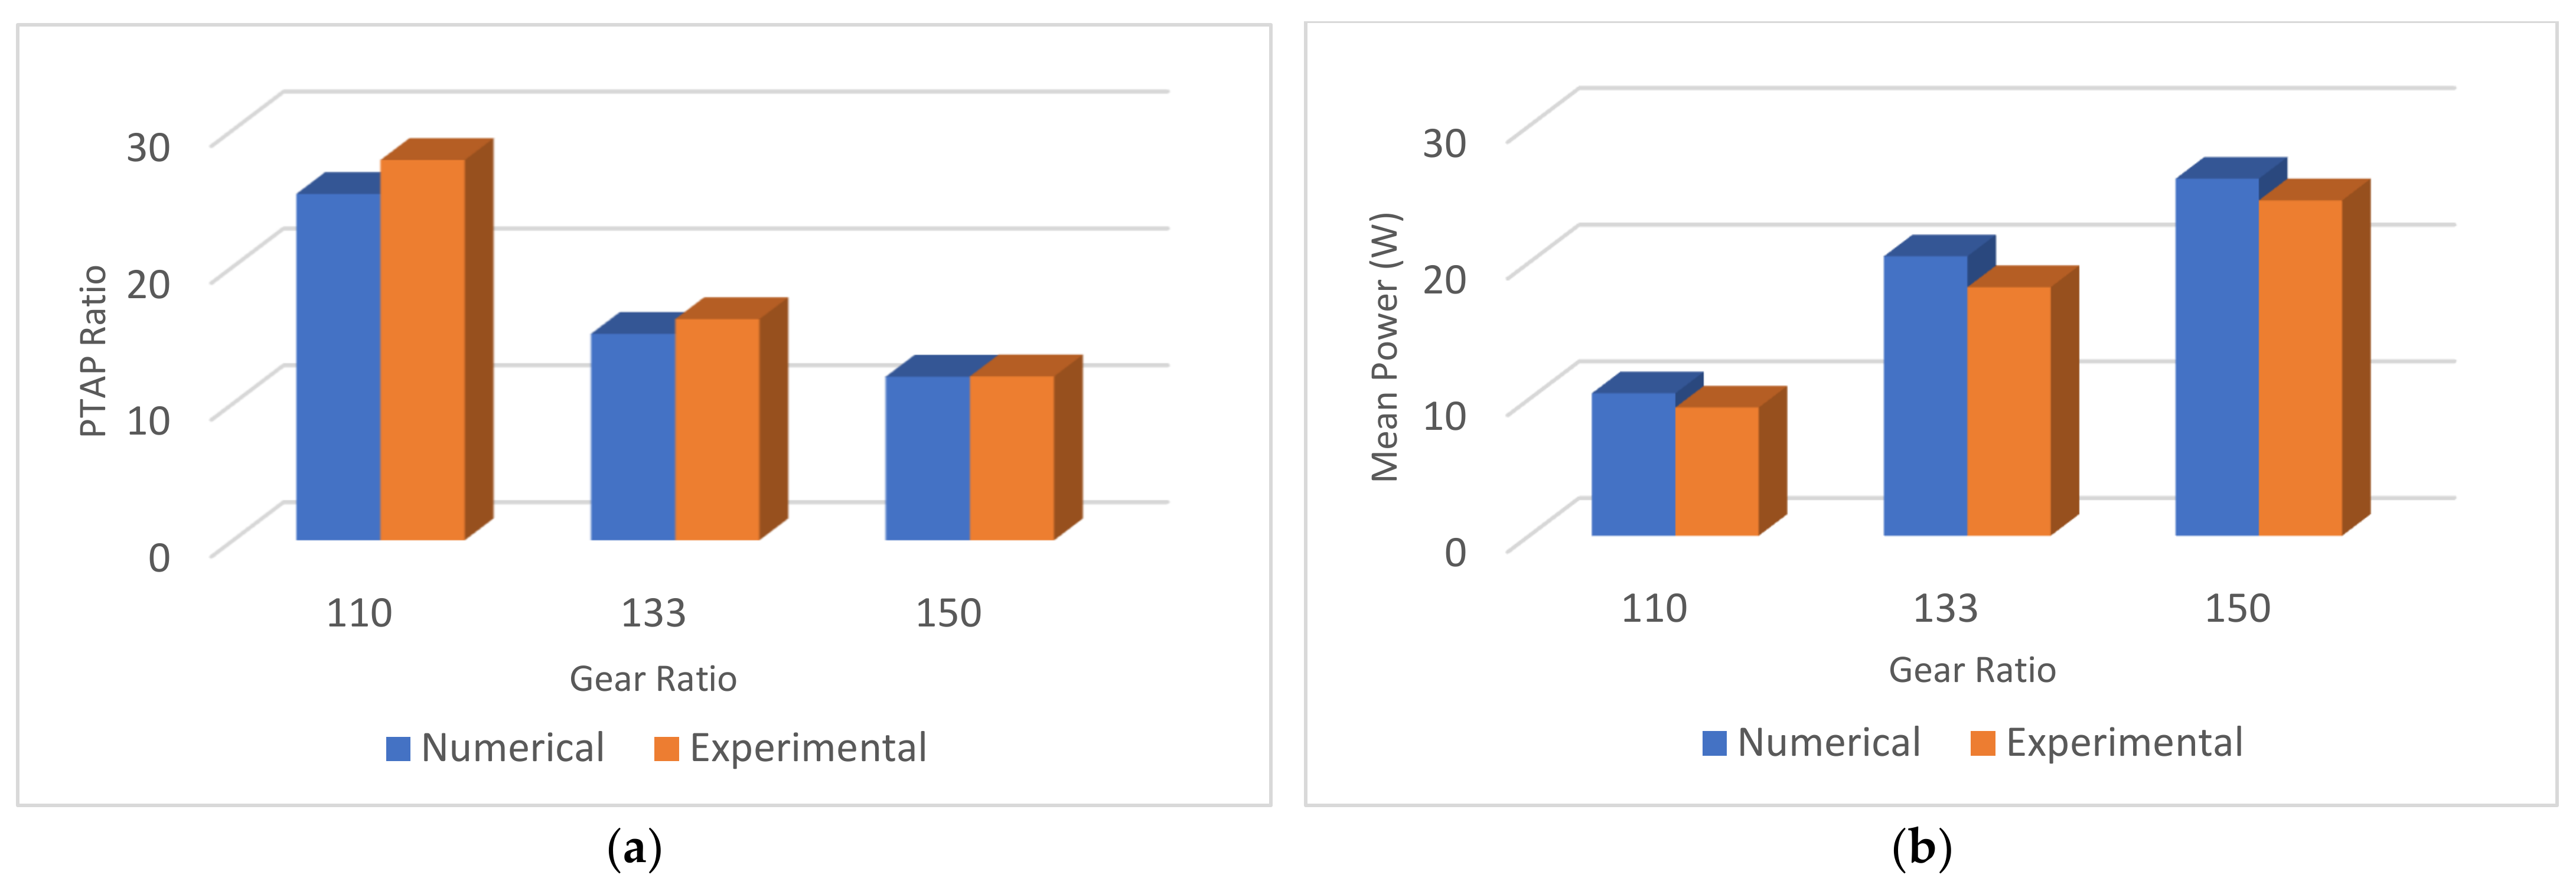
In addition to the full-scale numerical model given in Table 2, another numerical model for the scaled-down model was implemented. This new model was designed using the small-scale 250 W PMDC machine parameters provided in Table 2. A comparative analysis was conducted between fully numerical (for the scaled-down model) and HIL simulations to validate the previous section’s results. The geometrical setup used for HIL simulations were replicated in this scaled-down numerical model to provide a fair comparison of the results. All of the controller parameters tuned, and various limits enforced during the HIL simulations were applied to the numerical model to facilitate this analysis. A model for the generator and power electronics converter was used instead of their physical counterparts in the HIL system, as shown in Figure 5. During this study, the simulations were run with both regular waves having H = 2.5 m and irregular waves having Hs = 2.5 m. Throughout this study, the WEC-PTO parameters were kept at a crank radius of 2 m and an arm length of 7.5 m. Gear ratio and wave periods were modified in a similar way as the results presented in Table 4 and Table 5, respectively. A comparison with irregular wave simulations is illustrated in Figure 12, where Tp = 11 s. Numerical simulations yielded slightly larger (1–2 W) mean power and, accordingly, a slightly smaller PTAP ratio for all cases. It can be concluded that the results of the numerical model generally matched the results of the experimental simulations well. The results were particularly close at a gear ratio of 150 and a regular wave period of 8 s. This outcome indicates that faster shaft speed makes the numerical model match the experimental system more closely. This is primarily because of the fact that the back-electro motive force (emf) voltage induced in the machine’s armature circuit proportionally increases with the shaft speed. For a given output power, the armature current reduces as the back-emf voltage increases. Accordingly, i2R losses in the experimental setup decrease. Eventually, the reduction in losses can make the experimental setup look closer to the numerical model. Although minimized losses at the higher speeds/voltages with the experimental system for the generator and the converter can be the contributing factor as explained above, further analysis would be necessary to isolate this effect. Original scaled-down model parameters identified at standstill conditions for the generator, as listed in Table 2, can also be operating-point dependent.
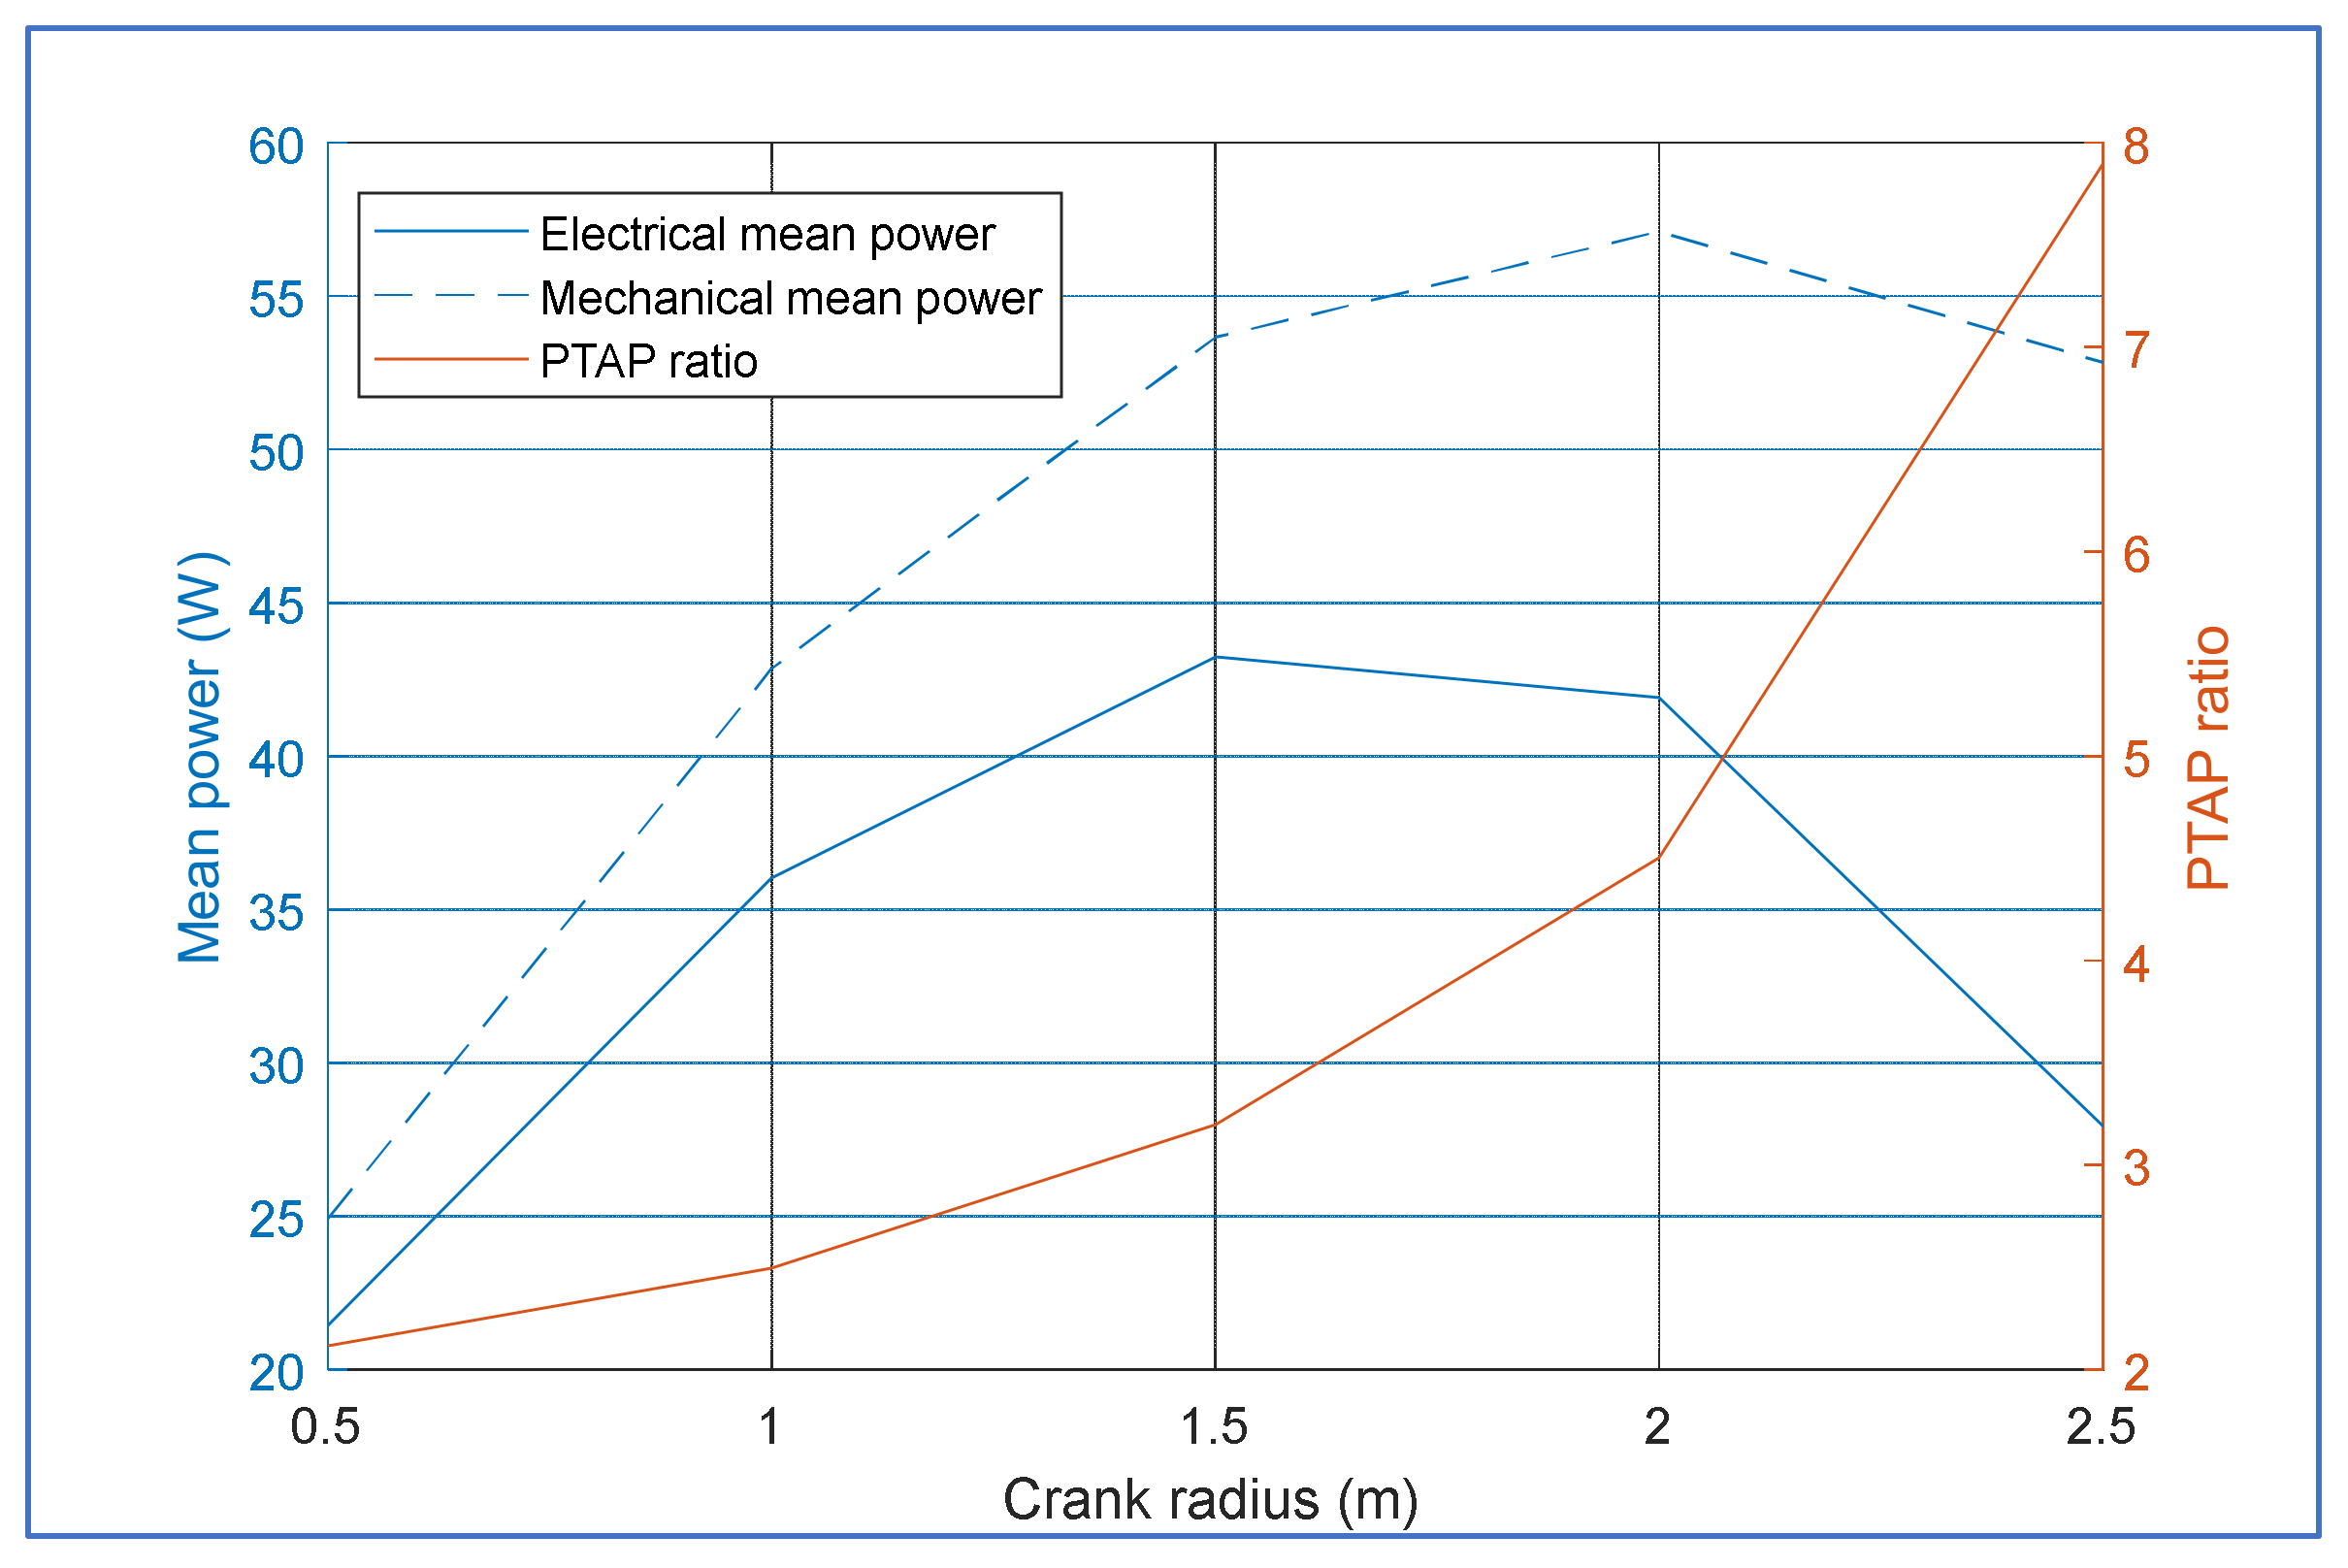
The numerical simulations were also conducted to analyze the impact of SC parameters on the PTAP ratio and mean power. The results shown in Section 3.1 and Section 3.2 demonstrate that a smaller crank radius and larger arm length yielded a larger mean power and smaller PTAP ratio. To investigate the general trend with these parameters, the arm length was kept constant at 7.5 m, while the crank radius was varied between 0.5 m and 2.5 m, with 0.5-m steps. The simulations were for regular waves at H = 2.5 m, T = 8 s, and a gear ratio of 150, where numerical simulations best matched the HIL simulations. The results were collected for the electrical mean power (measured at generator terminals), the mechanical mean power (measured at the WEC-Sim’s rotational PTO port), and the PTAP ratio for the electrical power, and were graphed in Figure 13. The PTAP ratio increases almost exponentially with crank radius, while the electrical mean power peaks at 1.5 m and the mechanical mean power peaks at 2 m. The difference between the electrical and mechanical mean powers follows a similar trend as the PTAP ratio. In other words, a smaller crank radius helps increase electrical machine efficiency. Ultimately, the electrical mean power deserves the most attention in a WEC system. In other numerical simulations at higher wave periods and/or lower gear ratios, the difference between the electrical and mechanical power increased, and efficiency accordingly became lower. This is primarily because of the slower speeds and larger torque amplitudes at higher wave periods and/or lower gear ratios.
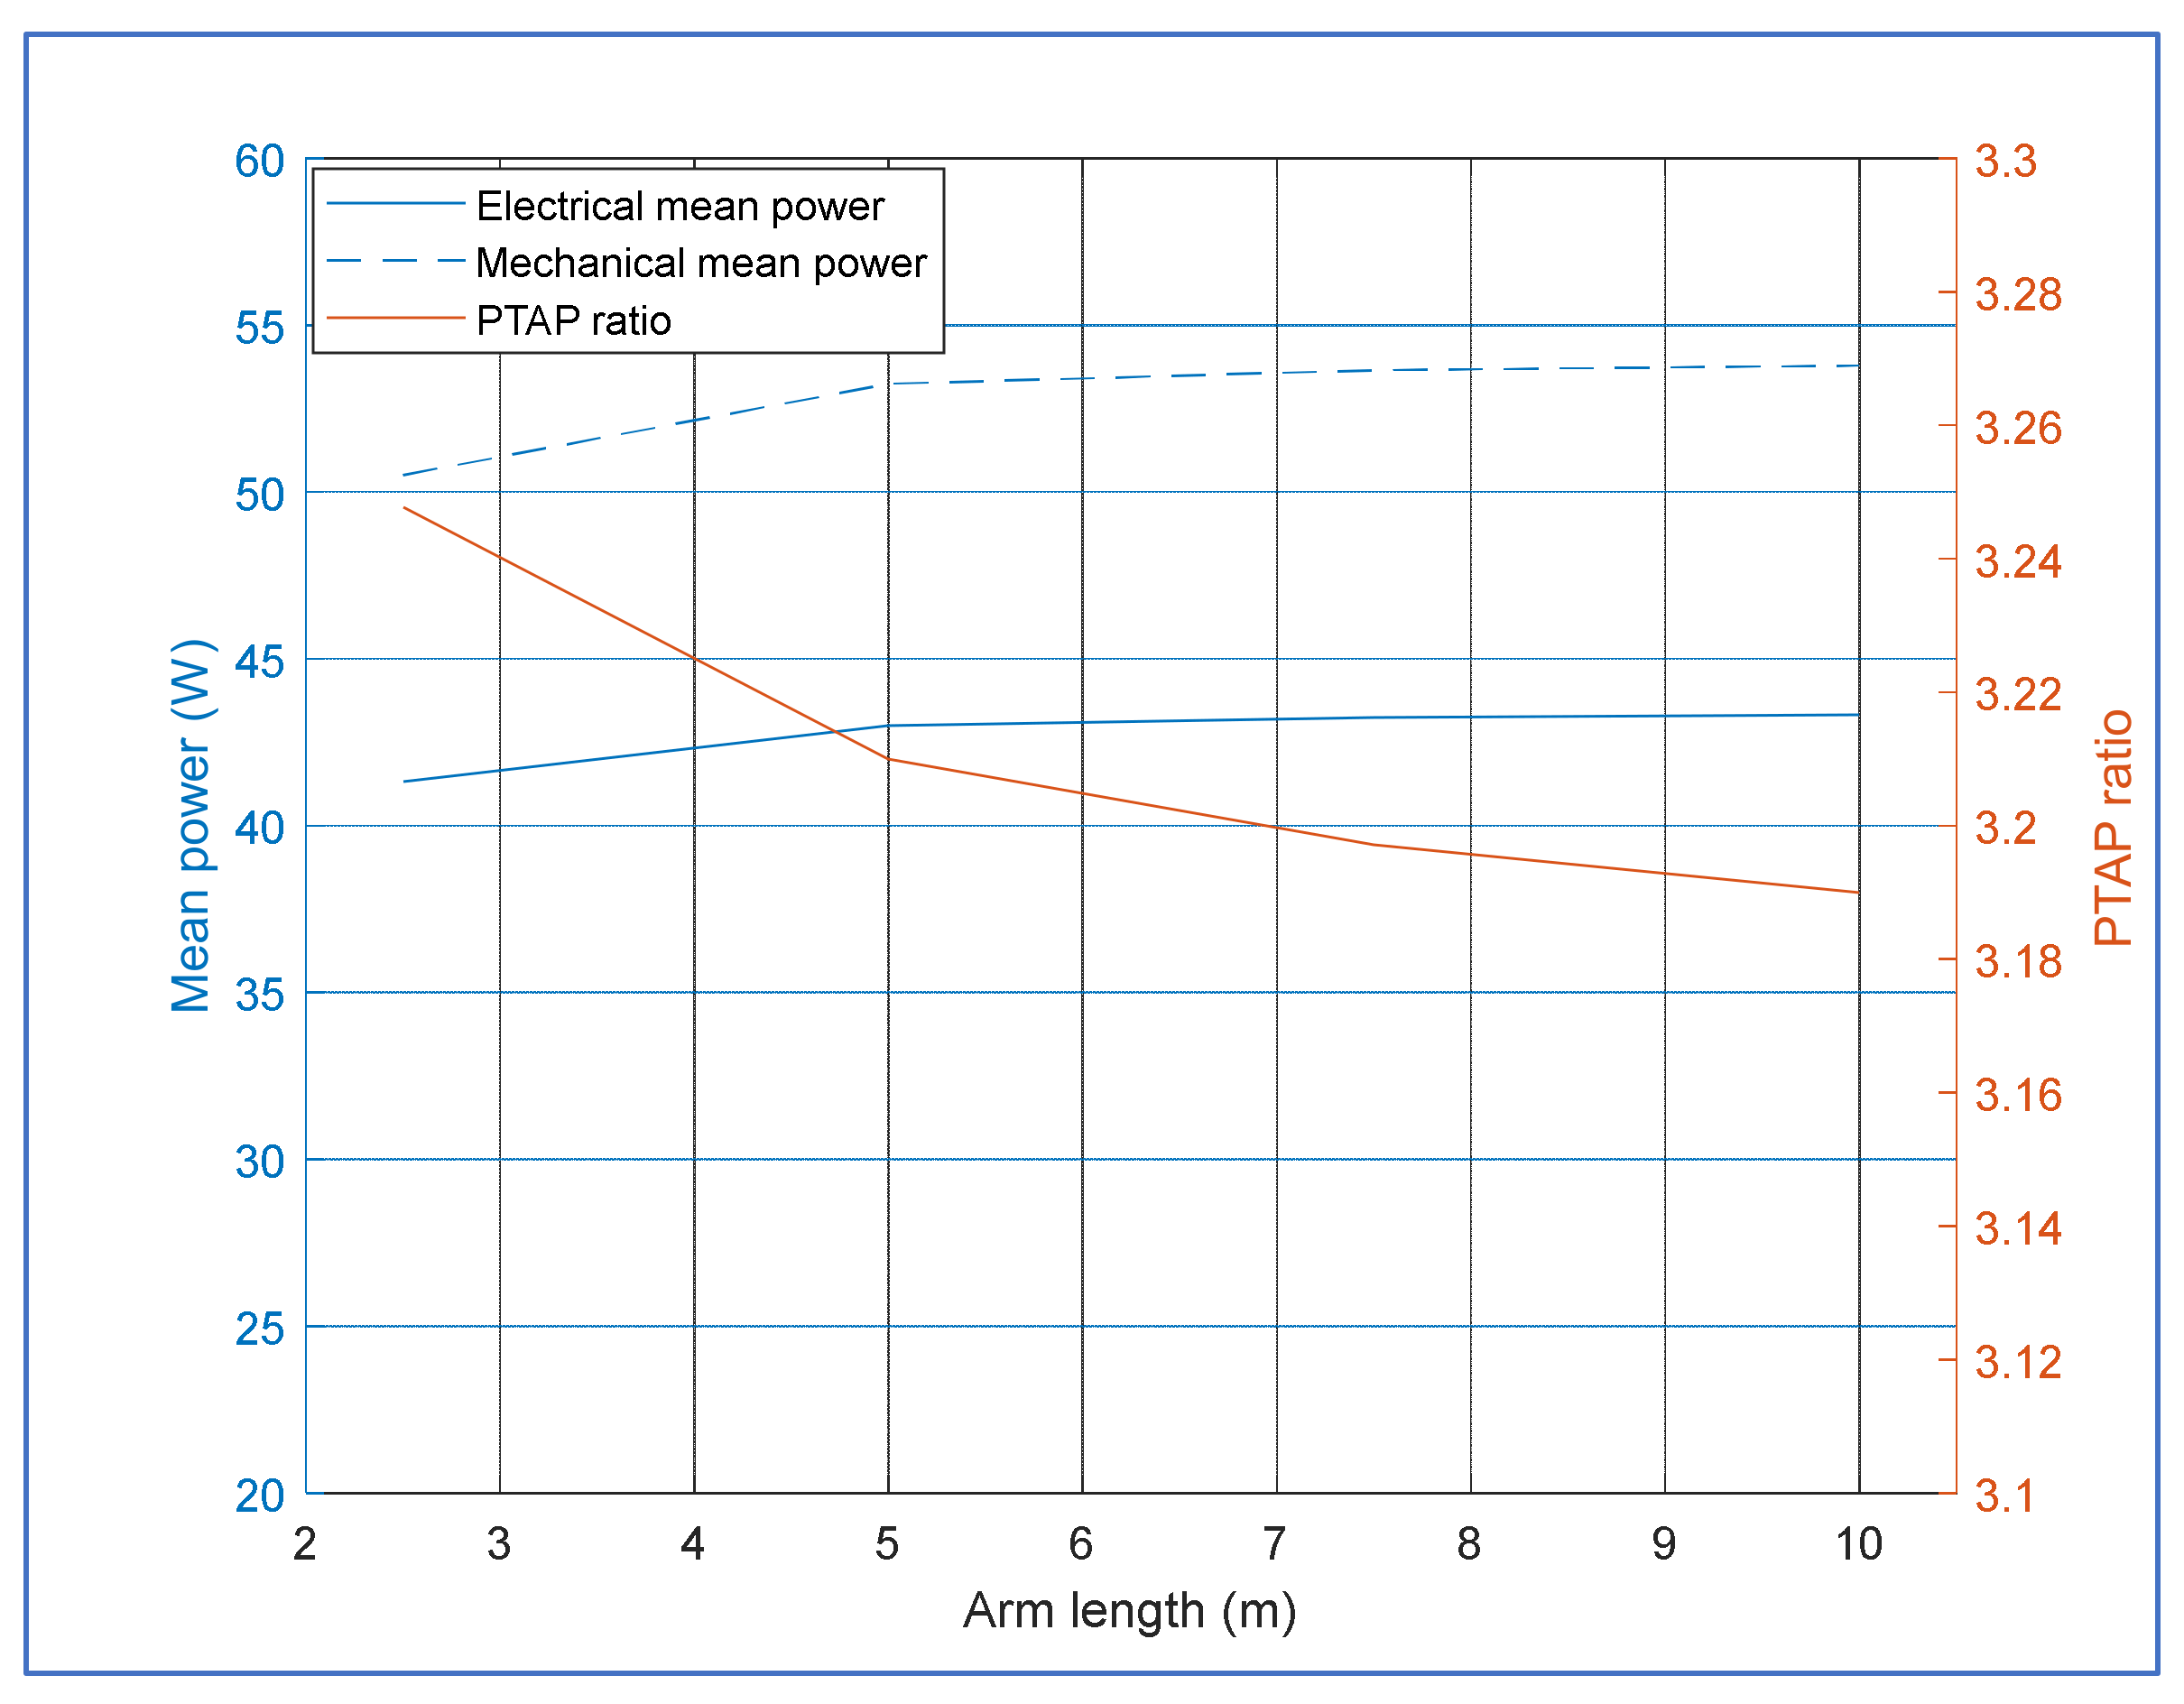
In the second step of SC parameter analysis, crank radius was fixed to 1.5 m and arm length was varied between 2.5 m and 10 m, with 2.5 m steps. The numerical simulation setup with specific variables measured was the same as in the variable crank radius case. The results are summarized in Figure 14. Increasing arm length does improve the mean power as well as the PTAP ratio, although its impact in comparison to crank radius is much less pronounced. For example, the PTAP ratio only reduces by about 2% when going from 2.5-m length to 10-m length. The impact on the mean electrical power is somewhat better, with a 5% increase. Beyond an arm length of 5 m, the improvement on mean power pretty much saturates. The difference between mean electrical and mechanical power stays approximately the same. A similar analysis was also conducted with a fixed crank radius of 2 m and arm lengths of 5 m, 7.5 m, and 10 m. The trends for all three variables of interest were similar (Figure 14). Neither the mean electrical power nor the PTAP ratio was better than the case with the crank radius of 1.5 m. Additional numerical simulations with the full-scale model were conducted, and it was verified that the optimal parameters are the same for the mechanical system. The optimal parameters were slightly different for the electrical generator because the parameters of the full-scale generator model as listed in Table 2 were arbitrarily chosen.
It is common practice in wind generation applications to step up the generator’s output voltage after being tied to the grid. The inverter responsible for this interconnection fixes voltage and frequency and allows the current to vary. With stepped-up voltages, current levels (both mean and RMS values) drop—and losses in transmission and distribution are minimized. This study took a similar approach in the mechanical environment in a WEC by setting relatively constant shaft speeds and higher gear ratios to minimize current and maximize induced voltage in an electrical machine.
Since this study presents a W2W model, it is desirable to show the evolution of energy at different stages of energy conversion. The stages considered are (1) the wave energy flux, (2) the absorbed energy flux by RM3, (3) the transferred mechanical energy to the shaft by the SC and the gearbox, and (4) the electrical generator. Stages 2 and 3 are combined for the sake of simplicity because this study focuses only on the SC geometry, the gearbox, and electrical generator parameters. Therefore, three different power levels and two different efficiencies are reported below. Table 8 shows the evolution for three different regular wave sea states. A gear ratio of 150, a slider crank radius of 1.5 m, and an arm length of 7.5 m were used during the testing. The sea states 1, 2, and 3 have a wave height of 2.5 m and periods of 8, 11, and 13 s, respectively. In addition, Table 9 presents the results for three different irregular wave sea states. A gear ratio of 150, a slider crank radius of 1.5 m, and an arm length of 7.5 m were again used during the testing. The sea states 1, 2, and 3 have a significant wave height of 2.5 m and peak periods of 8, 11, and 13 s, respectively.
In Table 8 and Table 9, Pin is the wave power, PMECH is the mechanical power at the SC’s shaft, ηPTO is the efficiency of the combined RM3 and SC stages, PGEN is the electrical power in the generator’s terminals, ηGEN is the generator’s efficiency, and ηW2W is the W2W efficiency.
The results obtained in this study can be compared to the previous results in the literature. Hansen et al. (2011) showed that overall W2W efficiency for an optimized point-absorber system is in the range of 52–68% under different sea states [33]. Similar W2W efficiency results were also reported in [21]. The values presented in Table 8 and Table 9 compare well with these findings. Hansen et al. (2013) also discussed that a PTAP ratio of 10 is normal and can be present while maintaining optimum efficiencies around 70% for different irregular wave sea states [20]. The PTAP ratios obtained for irregular waves at a crank radius of 1.5 m and a gear ratio of 150, shown in Table 5 and Table 7, compare well with that finding. The PTAP ratios for regular waves in Table 4 and Table 6 are well within the range of the results reported by Tedeschi et al. (2011) [15].

4. Discussion

This study used a pair of elementary PMDC machines, along with an electronics controller board and a DSP system, to facilitate the analysis. The results with regular and irregular waves showed that gear ratio, crank radius, and arm length can be configured in such a way as to minimize the PTAP ratio and maximize the electrical mean power extracted. Although crank radius and arm length are parameters specific to an SC-type linear-to-rotary WEC-PTO, maximizing electromotive force induced through a higher gear ratio can be applied to any rotational WEC system for minimizing losses. However, higher gear ratios can be problematic in a physical system implementation. Electromechanical system losses can also be minimized through wound-field DC machines or efficient AC-synchronous machines, where induced electromotive force can be directly controlled through an exciter winding placed in the stator (DC) or in the rotor (AC). This process can help assist with the demand on a gearbox, which can be the most vulnerable component in a renewable energy system. High-performance DSP systems that allow faster processing can be used to reduce sampling time in real-time processing and to achieve faster torque control for better wave excitation force tracking. This would help improve results with irregular waves, where the sampling rate was notably lower, and would help avoid potential complications that could lead to faults in a power electronics system.

5. Conclusions

The first research objective for this project was achieved, and an advanced control algorithm was developed for high-speed unidirectional rotation. Speed fluctuations limited to ±30% (around its mean) were found to be satisfactory through extensive simulations with irregular waves. The second objective was about tuning the PTO system parameters (i.e., gear ratio, crank radius, and inertia) and collecting and analyzing the PTAP ratio data, for various wave conditions. Data with different sea states, both regular and irregular, were successfully collected by testing the system with several different combinations of gear ratio, crank radius, and connecting-arm length. Although inertia testing was conducted for several numerical values in the WEC-PTO system, no appreciable outcomes were observed. In addition, the system lost stability below a certain inertia value. Finally, the sources of the mean power reductions, depending on the PTO parameters and wave conditions, were investigated and characterized. The study with both experimental and numerical simulations found that gear ratio and crank radius were the most dominant parameters in helping achieve the minimized PTAP ratio as well as larger electrical mean power. The best overall results for both the PTAP ratio and electrical mean power were achieved with a crank radius of 1.5 m and a gear ratio of 150. Conflicting outcomes between electrical mean power and mechanical mean power were observed at different values of crank radius because of high PTAP-ratio-related losses in the electrical machine. These losses were caused by increased current RMS and mean values in the armature circuit of the machine. Increasing arm length also helped improve results to an extent, but the trend was not as substantial as in the gear ratio and crank-radius cases. Geometrical WEC system restrictions can be a limiting factor at larger arm lengths.
One of the important takeaways from this research study is the fact that reducing the PTAP ratio in a WEC system can help (1) reduce the capital expenditure using better fitted components; (2) reduce maintenance costs, because components working more often at nominal values should deteriorate more slowly, and (3) increase efficiency, because component efficiencies tend to be higher at nominal speed and power values. These important outcomes can be achieved by accurately designing PTO systems and/or using an adequate control strategy.
A low-speed AC synchronous machine with excitation control would be a better candidate in future studies because of its high efficiency and electromotive force adjustment capability. Another important future step is to evaluate the impact of the hydrodynamic viscous drag coefficient in the WEC system. Finally, the spar/plate section of the two-body system should be given 3 degrees of freedom, and associated excitation force prediction performance should be thoroughly analyzed.
Author Contributions

Conceptualization, H.B.K. and Y.-H.Y.; Data curation, H.B.K.; Formal analysis, H.B.K.; Funding acquisition, H.B.K., Y.-H.Y. and E.M.; Investigation, H.B.K.; Methodology, H.B.K. and Y.-H.Y.; Project administration, Y.-H.Y.; Resources, H.B.K. and Y.-H.Y.; Software, H.B.K.; Supervision, Y.-H.Y.; Validation, H.B.K., Y.-H.Y. and E.M.; Writing—original draft, H.B.K.; Writing—review & editing, Y.-H.Y. and E.M. All authors have read and agreed to the published version of the manuscript.

Funding

This research was funded by U.S. Department of Energy (DOE) Office of Science, Office of Work-force Development for Teachers and Scientists (WTDS) and Energy Efficiency and Renewable Energy Water Power Technologies Office, grant number DE-AC36-08GO28308.

Institutional Review Board Statement

Not applicable.

Informed Consent Statement

Not applicable.

Data Availability Statement

Not applicable.

Acknowledgments

This work was authored in part by the National Renewable Energy Laboratory, operated by Alliance for Sustainable Energy, LLC, for the U.S. Department of Energy (DOE) under Contract No. DE-AC36-08GO28308. Funding provided by Office of Science, Office of Workforce Development for Teachers and Scientists (WTDS) under the Visiting Faculty Program and Energy Efficiency and Renewable Energy Water Power Technologies Office. The views expressed in the article do not necessarily represent the views of the DOE or the U.S. Government. The U.S. Government retains and the publisher, by accepting the article for publication, acknowledges that the U.S. Government retains a nonexclusive, paid-up, irrevocable, worldwide license to publish or reproduce the published form of this work, or allow others to do so, for U.S. Government purposes. This work was also supported in part by the School of Engineering + Technology, Western Carolina University, Cullowhee, NC, USA.

Conflicts of Interest

The authors declare no conflict of interest.

References

  1. U.S. Energy Information Administration. Electricity Data Browser. Available online: http://www.eia.gov/electricity/data/browser (accessed on 15 January 2021).
  2. The White House. FACT SHEET: President Obama Announces New Actions to Bring Renewable Energy and Energy Efficiency to Households across the Country. Available online: https://www.whitehouse.gov/the-press-office/2015/08/24/fact-sheet-president-obama-announces-new-actions-bring-renewable-energy (accessed on 15 January 2021).
  3. The White House. FACT SHEET: President Biden Sets 2030 Greenhouse Gas Pollution Reduction Target Aimed at Creating Good-Paying Union Jobs and Securing U.S. Leadership on Clean Energy Technologies. Available online: https://www.whitehouse.gov/briefing-room/statements-releases/2021/04/22/fact-sheet-president-biden-sets-2030-greenhouse-gas-pollution-reduction-target-aimed-at-creating-good-paying-union-jobs-and-securing-u-s-leadership-on-clean-energy-technologies/ (accessed on 5 May 2021).
  4. Windpower Monthly. European Parliament Approves 35% Renewables Target. Available online: https://www.windpowermonthly.com/article/1454751/european-parliament-approves-35-renewables-target (accessed on 10 June 2021).
  5. Renewable Energy World. China Sets New Renewables Target of 35 Percent by 2030. Available online: https://www.renewableenergyworld.com/baseload/china-sets-new-renewables-target-of-35-percent-by-2030/ (accessed on 10 June 2021).
  6. Gov.Uk. UK Becomes First Major Economy to Pass Net Zero Emissions Law. Available online: https://www.gov.uk/government/news/uk-becomes-first-major-economy-to-pass-net-zero-emissions-law (accessed on 10 June 2021).
  7. Independent. Spain Sets out Plan for 100% Renewable Electricity by 2050. Available online: https://www.independent.co.uk/climate-change/news/spain-switch-renewable-electicity-climate-change-wind-solar-energy-2050-a8632166.html (accessed on 10 June 2021).
  8. Government of Canada. Powering Our Future with Clean Electricity. Available online: https://www.canada.ca/en/services/environment/weather/climatechange/climate-action/powering-future-clean-energy.html (accessed on 10 June 2021).
  9. Government of Canada. Electricity Facts. Available online: https://www.nrcan.gc.ca/science-data/data-analysis/energy-data-analysis/energy-facts/electricity-facts/20068 (accessed on 10 June 2021).
  10. The White House. Accelerating the Transition to Clean Energy. Available online: https://obamawhitehouse.archives.gov/sites/default/files/image/president27sclimateactionplan.pdf (accessed on 4 June 2021).
  11. Kilcher, L.; Fogarty, M.; Lawson, M. Marine Energy in the United States: An Overview of Opportunities. NREL, NREL/TP-5700-78773, February. 2021. Available online: https://www.nrel.gov/docs/fy21osti/78773.pdf (accessed on 21 May 2021).
  12. Sang, Y.; Karayaka, H.B.; Yan, Y.; Yilmaz, N.; Souders, D. 1.18 Ocean (Marine) Energy. In Comprehensive Energy Systems; Dincer, I., Ed.; Elsevier: Amsterdam, The Netherlands, 2018; pp. 733–769. ISBN 9780128149256. [Google Scholar] [CrossRef]
  13. Cruz, J.; Gunnar, M.; Barstow, S.; Mollison, D. Green Energy and Technology, Ocean Wave Energy; Joao, C., Ed.; Springer Science+Business Media: Berlin/Heidelberg, Germany, 2008; p. 93. ISBN 978-3-540-74894-6. [Google Scholar]
  14. Neary, V.S.; Previsic, M.; Jepsen, R.A.; Lawson, M.J.; Yu, Y.; Copping, A.E.; Fontaine, A.A.; Hallett, K.C.; Murray, D.K. Methodology for Design and Economic Analysis of Marine Energy Conversion (MEC) Technologies; Sandia National Laboratories: Albuquerque, NM, USA, 2014; Rep. SAND-2014-9040. [Google Scholar]
  15. Tedeschi, E.; Carraro, M.; Molinas, M.; Mattavelli, P. Effect of control strategies and power take-off efficiency on the power capture from sea waves. IEEE Trans. Energy Convers. 2011, 26, 1088–1098. [Google Scholar] [CrossRef]
  16. Henriques, J.C.C.; Gato, L.M.C.; Lemos, J.M.; Gomes, R.P.F.; Falcao, A.F.O. Peak-Power Control of a Grid-Integrated Oscillating Water Column Wave Energy Converter. Energy 2016, 109, 378–390. [Google Scholar] [CrossRef] [Green Version]
  17. Yu, Y.H.; Tom, N.; Jenne, D. Numerical Analysis on Hydraulic Power Take-Off for Wave Energy Converter and Power Smoothing Methods; National Renewable Energy Laboratory: Golden, CO, USA, 2018; Preprint; NREL/CP-5000-71078. Available online: https://www.nrel.gov/docs/fy19osti/71078.pdf (accessed on 15 January 2021).
  18. Karayaka, H.B.; Yu, Y.H.; Tom, N.; Muljadi, E. Investigating the Impact of Power-Take-Off System Parameters and Control Law on a Rotational Wave Energy Converter’s Peak-to-Average Power Ratio Reduction; National Renewable Energy Laboratory: Golden, CO, USA, 2020; Preprint; NREL/CP-5000-76016. Available online: https://www.nrel.gov/docs/fy20osti/76016.pdf (accessed on 15 January 2021).
  19. Penalba, M.; Ringwood, J.V. A review of wave-to-wire models for wave energy converters. Energies 2016, 9, 506. [Google Scholar] [CrossRef] [Green Version]
  20. Hansen, R.H. Design and Control of the Power Take-Off System for a Wave Energy Converter with Multiple Absorbers. Aalborg University. 2013. Available online: https://vbn.aau.dk/en/publications/design-and-control-of-the-powertake-off-system-for-a-wave-energy (accessed on 21 May 2021).
  21. Sjolte, J.; Sandvik, C.M.; Tedeschi, E.; Molinas, M. Exploring the Potential for Increased Production from the Wave Energy Converter Lifesaver by Reactive Control. Energies 2013, 6, 3706–3733. [Google Scholar] [CrossRef] [Green Version]
  22. Kelly, J.F.; Wright WM, D.; Sheng, W.; O’Sullivan, K. Implementation and Verification of a Wave-to-Wire Model of an Oscillating Water Column With Impulse Turbine. IEEE Trans. Sustain. Energy 2016, 7, 546–553. [Google Scholar] [CrossRef]
  23. Penalba, M.; Ringwood, J.V. A high-fidelity wave-to-wire model for wave energy converters. Renew. Energy 2019, 134, 367–378. [Google Scholar] [CrossRef]
  24. WEC-Sim (Wave Energy Converter SIMulator). Available online: https://wec-sim.github.io/WEC-Sim/ (accessed on 15 January 2021).
  25. Ran, L.; Bumby, J.R.; Tavner, P.J. Use of Turbine Inertia for Power Smoothing of Wind Turbines with a DFIG. In Proceedings of the IEEE 11th International Conference on Harmonics and Quality of Power, Lake Placid, NY, USA, 12–15 September 2004. [Google Scholar]
  26. Liang, C.; Ai, J.; Zuo, L. Design, fabrication, simulation and testing of an ocean wave energy converter with mechanical motion rectifier. Ocean Eng. 2017, 136, 190–200. [Google Scholar] [CrossRef]
  27. Sang, Y.; Karayaka, H.; Yan, Y.; Zhang, J.; Bogucki, D.; Yu, Y.-H. A Rule-Based Phase Control Methodology for a Slider-Crank Wave Energy Converter Power Take-Off System. Int. J. Marine Energy 2017, 19, 124–144. [Google Scholar] [CrossRef]
  28. Wallace, D.; Karayaka, H.; Alqudah, Y. Optimum Parameter Search for a Slider-Crank Wave Energy Converter under Regular and Irregular Wave Conditions. In Proceedings of the IEEE Southeast Conference 2017, Concord, NC, USA, 30 March–2 April 2017. [Google Scholar]
  29. Faedo, N.; Olaya, S.; Ringwood, J.V. Optimal Control, MPC and MPC-Like Algorithms for Wave Energy Systems: An Overview. IFAC J. Syst. Control 2017, 1, 37–56. [Google Scholar] [CrossRef] [Green Version]
  30. Khan, M.; Karayaka, H.; Yan, Y.; Tay, P.; Yu, Y. Slider Crank WEC Performance Analysis with Adaptive Autoregressive Filtering. In Proceedings of the IEEE SoutheastCon 2019, Huntsville, AL, USA, 30 March–2 April 2019. [Google Scholar]
  31. Venable, H.D. The K-Factor: A New Mathematical Tool for Stability Analysis and Synthesis. In Proceedings of Powercon 10. Available online: http://www.venable.biz (accessed on 25 May 2021).
  32. Froude Similarity. Available online: https://www.sciencedirect.com/topics/engineering/froude-similarity (accessed on 27 May 2021).
  33. Hansen, R.H.; Andersen, T.O.; Pedersen, H.C. Model based design of efficient power take-off systems for wave energy converters. In Proceedings of the 12th Scandinavian International Conference on Fluid Power, Tampere, Finland, 18–20 May 2011. [Google Scholar]
Figure 1. An electrical analogue of a hydrodynamic system.
Energies 14 03489 g001
Figure 2. Integration of various components of the proposed rotational WEC-PTO. (a) WEC-Sim RM3, (b) slider-crank linkage model describing system variables (Tm, Fb, r, l, θ), radial flux electrical machine, and gearbox.
Energies 14 03489 g002
Figure 3. Armature-controlled DC generator block diagram, motion-actuated by a WEC-PTO.
Energies 14 03489 g003
Figure 4. Overall control system block diagram for the numerical model.
Energies 14 03489 g004
Figure 5. Block diagram of an HIL framework (top) and experimental setup (bottom).
Energies 14 03489 g005
Figure 6. Control system block diagram for the HIL simulation.
Energies 14 03489 g006
Figure 7. Continuous unidirectional rotation in experimental test with (a) regular waves and (b) irregular waves.
Energies 14 03489 g007
Figure 8. Motor and generator currents for the regular wave case presented in Figure 7a (i.e., crank radius is 2 m).
Energies 14 03489 g008
Figure 9. Motor and generator currents for the regular wave case presented in Figure 7a, except crank radius is 1.5 m.
Energies 14 03489 g009
Figure 10. Motor and generator powers for the regular wave case presented in Figure 7a (i.e., crank radius is 2 m).
Energies 14 03489 g010
Figure 11. Motor and generator powers for the regular wave case presented in Figure 7a, except crank radius is 1.5 m.
Energies 14 03489 g011
Figure 12. Comparisons between numerical and experimental simulation results for (a) the PTAP ratio and (b) mean power.
Energies 14 03489 g012
Figure 13. Variation of electrical and mechanical mean power, and PTAP ratio with arm length at l = 7.5 m.
Energies 14 03489 g013
Figure 14. Variation of electrical and mechanical mean power, and PTAP ratio with crank radius at r = 1.5 m.
Energies 14 03489 g014
Table 1. The equipment used in the experimental setup.
Equipment DescriptionManufacturerModel Number
DSP Board KitdSPACEACE1104/CP1104
Electric-Drives BoardVishay HiRel Systems75550
DC GeneratorMotorSolver Inc.DCGEN7090
DC MotorMotorSolver Inc.DCMOT8080
MultimeterBK Precision390A
DC Power SupplyBK Precision9202
Table 2. DC machine parameters for full- and small-scale models.
ParameterFull ScaleSmall Scale
Nominal Speed2000 rpm4000 rpm
Nominal Power6 MW250 W
Nominal Voltage2400 V42 V
Viscous Friction Coefficient0.32 N/(m/s)1.79 × 10−4 N/(m/s)
Armature Resistance0.076 Ω0.7 Ω
Armature Inductance0.00157 H0.0013 H
Torque Constant16.6 Nm/A0.091 Nm/A
Table 3. Numerical model comparison.
Sea State (Regular Wave)Full-Scale Model Power (kW)Scaled-Down Model Power (W)Absolute Error (%)
Height (m)Period (s)
2.58641.849.150.10
2.5111358103.90.01
2.5131445110.50.04
Table 4. PTAP ratio and mean power for a regular wave with a fixed-wave height (H = 2.5 m).
Gear RatioPTAP RatioMean Power (W)
T = 8 sT = 11 sT = 13 sT = 8 sT = 11 sT = 13 s
r = 1.5 mr = 2 mr = 1.5 mr = 2 mr = 1.5 mr = 2 mr = 1.5 mr = 2 mr = 1.5 mr = 2 mr = 1.5 mr = 2 m
1103.314.672.813.952.704.7047.1441.4950.2336.5443.4030.33
1333.264.642.913.372.743.2349.8946.7058.9850.5452.9643.55
1503.274.702.953.372.863.1644.4042.5061.5360.9657.7851.56
Table 5. PTAP ratio and mean power for an irregular wave with a fixed-significant wave height (Hs = 2.5 m).
Gear RatioPTAP RatioMean Power (W)
T = 8 sT = 11 sT = 13 sTp = 8 sTp = 11 sTp = 13 s
r = 1.5 mr = 2 mr = 1.5 mr = 2 mr = 1.5 mr = 2 mr = 1.5 mr = 2 mr = 1.5 mr = 2 mr = 1.5 mr = 2 m
11018.36108610.9327.7911.5944.8716.020.27123.349.3820.045.29
13316.2942.4910.3316.169.6818.1418.046.92027.9018.1926.8216.67
15014.7833.298.6911.989.7413.3017.318.83129.9524.5529.2621.84
Table 6. PTAP ratio and mean power for a regular wave with a fixed-wave period (T = 11 s).
Gear RatioPTAP RatioMean Power (W)
H = 1.5 mH = 2 mH = 2.5 mH = 1.5 mH = 2 mH = 2.5 m
r = 1.5 mr = 2 mr = 1.5 mr = 2 mr = 1.5 mr = 2 mr = 1.5 mr = 2 mr = 1.5 mr = 2 mr = 1.5 mr = 2 m
1104.8714.963.586.212.813.9528.7412.8241.2726.6350.2336.54
1334.547.533.714.392.913.3631.3623.8846.0739.4258.9850.54
1504.366.343.604.212.953.3732.8430.1247.6347.6261.5360.96
Table 7. PTAP ratio and mean power for an irregular wave with a fixed-peak period (Tp = 11 s).
Gear RatioPTAP RatioMean Power (W)
Hs = 1.5 mHs = 2 mHs = 2.5 mHs = 1.5 mHs = 2 mHs = 2.5 m
r = 1.5 mr = 2 mr = 1.5 mr = 2 mr = 1.5 mr = 2 mr = 1.5 mr = 2 mr = 1.5 mr = 2 mr = 1.5 mr = 2 m
11023.60NA 114.75143.110.9327.7910.08−6.1817.131.8123.359.38
13318.72220.412.5929.0310.3316.1612.501.3720.4610.1327.9018.19
15015.2650.2010.7319.218.6911.9813.796.0222.1115.3029.9524.55
1 Not applicable.
Table 8. Efficiencies at different stages of energy conversion chain for regular waves.
Sea StatePTO—System (RM3 and SC)Electrical GeneratorOverall
Pin (W)PMECH (W)ηPTOPMECH (W)PGEN (W)ηGENηW2W
174.753.70.7253.743.30.810.58
2102.770.50.6970.560.90.860.59
3121.470.40.5870.457.70.820.48
Table 9. Efficiencies at different stages of energy conversion chain for irregular waves.
Sea StatePTO—System (RM3 and SC)Electrical GeneratorOverall
Pin (W)PMECH (W)ηPTOPMECH (W)PGEN (W)ηGENηW2W
132.421.40.6621.418.50.860.57
244.537.90.8537.930.90.820.69
352.639.30.7539.330.20.770.57
Publisher’s Note: MDPI stays neutral with regard to jurisdictional claims in published maps and institutional affiliations.