
Alternative Exhaust Emission Factors from Vehicles in On-Road Driving Tests


Abstract
1. Introduction
2. Review of the Literature on the Subject
3. Materials and Methods
3.1. Passenger Cars
3.2. Heavy-Duty Vehicles
- in the case of N2 category vehicles, the trip comprised driving approximately 45% in urban areas, 25% in rural areas, and 30% on a motorway;
- in the case of N3 category vehicles, the trip comprised driving approximately 30% in urban areas, 25% in rural areas, and 45% on a motorway.
4. Results
4.1. Light-Duty Vehicles
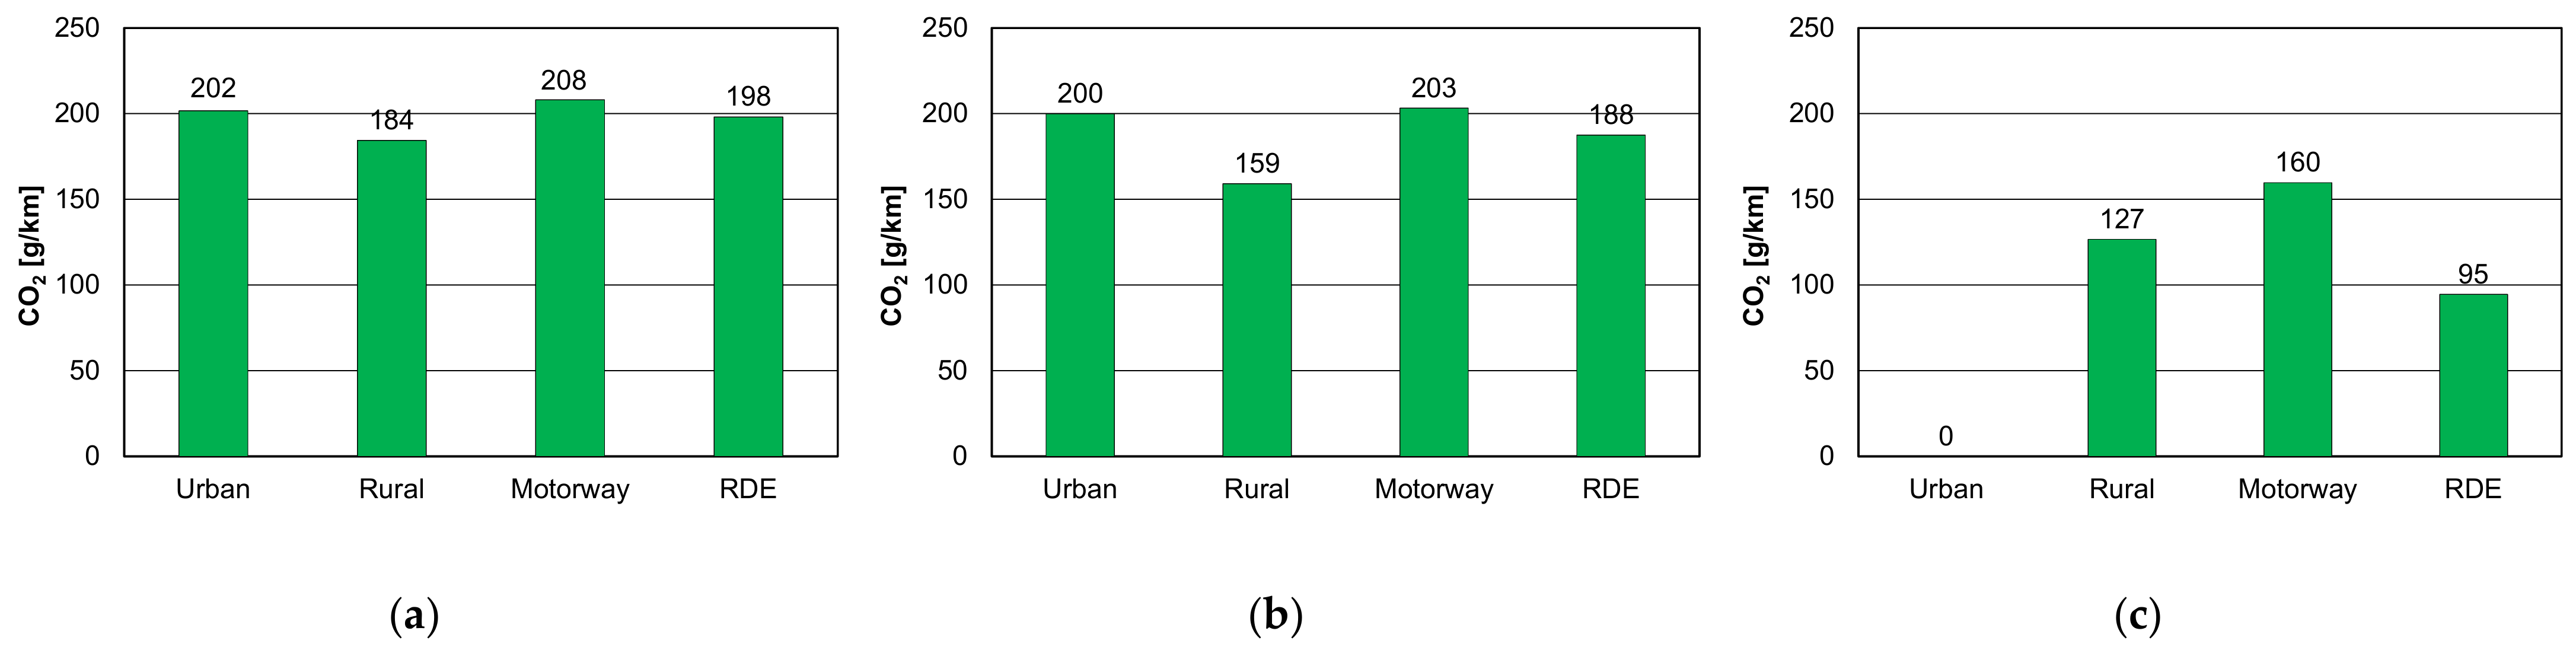
- Gasoline: 7.92 L/100 km (rural), 8.50 L/100 km (total RDE), 184 gCO2/km (rural), and 198 gCO2/km (total RDE),
- Diesel: 5.98 L/100 km (rural), 7.05 L/100 km (total RDE), 159 gCO2/km (rural), and 188 gCO2/km (total RDE),
- Hybrid plug-in: 4.76 L/100 km (rural), 3.55 L/100 km (total RDE), 127 gCO2/km (rural), and 95 gCO2/km (total RDE).
4.2. Tests of Heavy-Duty Vehicles
5. Discussion
- dimensionless quantity,
- impact of all the exhaust gases concerned on the assessment of the vehicle,
- in the absence of certain components, they may be omitted, and the nature of the indicator will not change,
- independence in application to different types of vehicles (PC, LDV, HDV, NRMM),
- comparability between different types of vehicles,
- proportionality in relation to the environmental performance of vehicles (lower indicator value—higher environmental performance of vehicles).
- For typical tractor: 32.6 L/100 km~227 g/kWh (long haul) and 34.3 L/100 km~236 g/kWh (regional delivery),
- For right truck: 31.1 L/100 km~225 g/kWh (long haul) and 34.6 L/100 km~238 g/kWh (regional delivery),
6. Conclusions
Author Contributions
Funding
Institutional Review Board Statement
Informed Consent Statement
Data Availability Statement
Conflicts of Interest
Abbreviations
| a | acceleration vehicle |
| AMOX | ammonia oxidation catalyst |
| b | road exhaust emission |
| CF | conformity factor |
| CNG | compressed natural gas |
| COC | certificate of conformity |
| DOC | Diesel oxidation catalyst |
| DPF | Diesel particle filter |
| E | exhaust emission rate |
| EF | emission factor |
| EU | European Union |
| GDI | gasoline direct injection |
| GPF | gasoline particle filter |
| HDV | heavy duty vehicle |
| JRC | Joint Research Centre |
| LDV | light duty vehicle |
| M | motorway |
| MAV | moving average windows |
| NRMM | non-road mobile machinery |
| OBFCM | on-board fuel consumption meter |
| PEMS | portable emission measurement system |
| PFI | port fuel injection |
| PHEV | plug-in hybrid electric vehicle |
| R | rural |
| RDE | real driving emissions |
| RPA | relative positive acceleration |
| SCR | selective catalytic reduction |
| t | time |
| u | share |
| U | urban |
| v | vehicle speed |
| WLTC | Worldwide-harmonized Light duty vehicles Test Cycle |
| WLTP | Worldwide-harmonized Light duty vehicles Test Procedure |
| ZLEV | zero- and low-emission vehicles |
Appendix A

| Trip Characteristics | Value | Valid |
|---|---|---|
| Urban distance [km] | 29.9 | >16 |
| Rural distance [km] | 28.0 | >16 |
| Motorway distance [km] | 29.9 | >16 |
| Total distance [km] | 87.9 | >48 |
| Urban distance share [%] | 34.1 | 29–44 |
| Rural distance share [%] | 31.9 | 33 ± 10 |
| Motorway distance share [%] | 34.0 | 33 ± 10 |
| Urban average speed [km/h] | 27.6 | 15–40 |
| Stop share (Urban phase) [%] | 19.8 | 6–30 |
| Motorway speed above 100 km/h [min] | 13.4 | >5 |
| Motorway max speed [km/h] | 127.2 | <160 |
| Motorway speed above 145 km/h [%] | 0.0 | <3 |
| Duration [min] | 104.7 | 90–120 |
| Cold start (t = 300 s) | ||
| Engine coolant temperature [°C] | 67.0 | <70 |
| Cold start max speed [km/h] | 41.9 | <60 |
| Cold start stop time [s] | 36 | <90 |
| Initial idling duration [s] | 6 | <15 |
| Excess/Absence of Trip Dynamics | ||
| Urban: counts number ai > 0.1 m/s2 | 1083 | >150 |
| Rural: counts number ai > 0.1 m/s2 | 339 | >150 |
| Motorway: counts number ai > 0.1 m/s2 | 254 | >150 |
| Urban: average speed [km/h] | 27.6 | – |
| Rural: average speed [km/h] | 71.5 | – |
| Motorway: average speed [km/h] | 110.9 | – |
| Urban: 95. centile V∙apos [m2/s3] | 12.9 | <18.198 |
| Rural: 95. centile V∙apos [m2/s3] | 13.8 | <24.166 |
| Motorway: 95. centile V∙apos [m2/s3] | 15.4 | <27.194 |
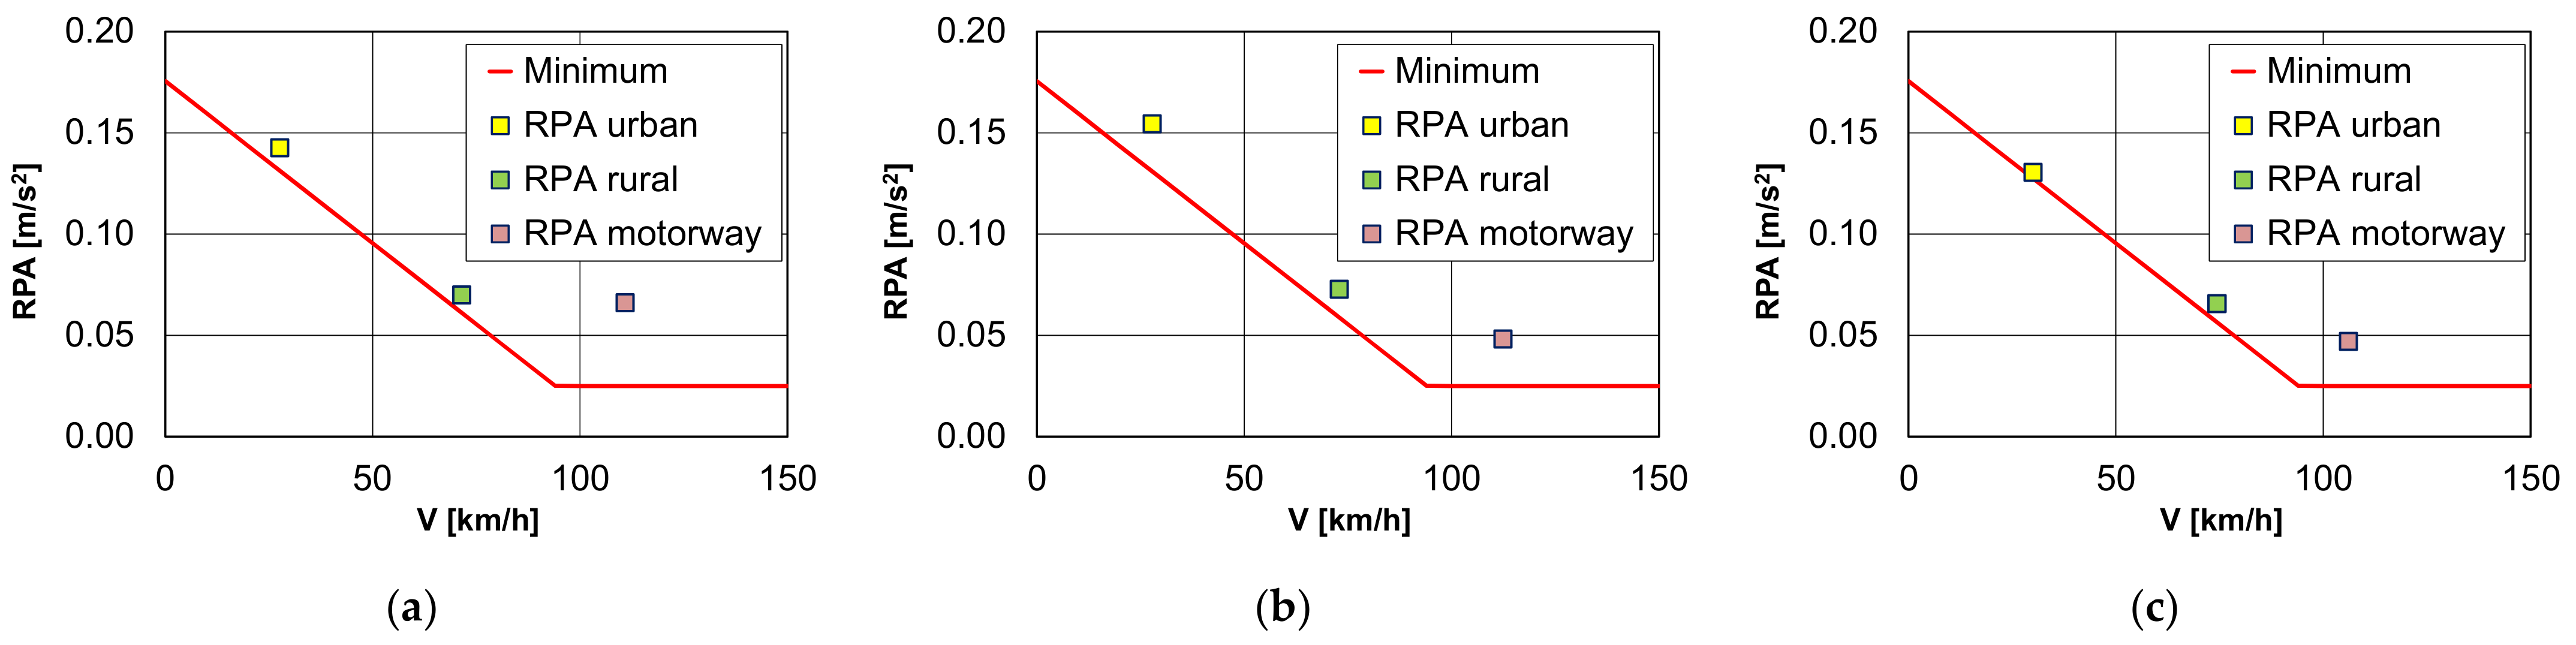
| Urban: RPA [m/s2] | 0.14 | >0.131 |
| Rural: RPA [m/s2] | 0.07 | >0.061 |
| Motorway: RPA [m/s2] | 0.07 | >0.025 |
| Moving Averaging Window Results | ||
| All windows | Number | Share [%] |
| Urban | 1834 | 40.2 |
| Rural | 1663 | 36.4 |
| Motorway | 1067 | 23.4 |
| Normal windows | Number | Share [%] |
| Urban | 1834 | 100.0 |
| Rural | 1213 | 72.9 |
| Motorway | 874 | 81.9 |
| Vehicle | Urban | RDE | ||||||||
|---|---|---|---|---|---|---|---|---|---|---|
| NOx [mg/km] | PN [1/km] | CO2 [g/km] | EFU | NOx [mg/km] | PN [1/km] | CO2 [g/km] | EFRDE | |||
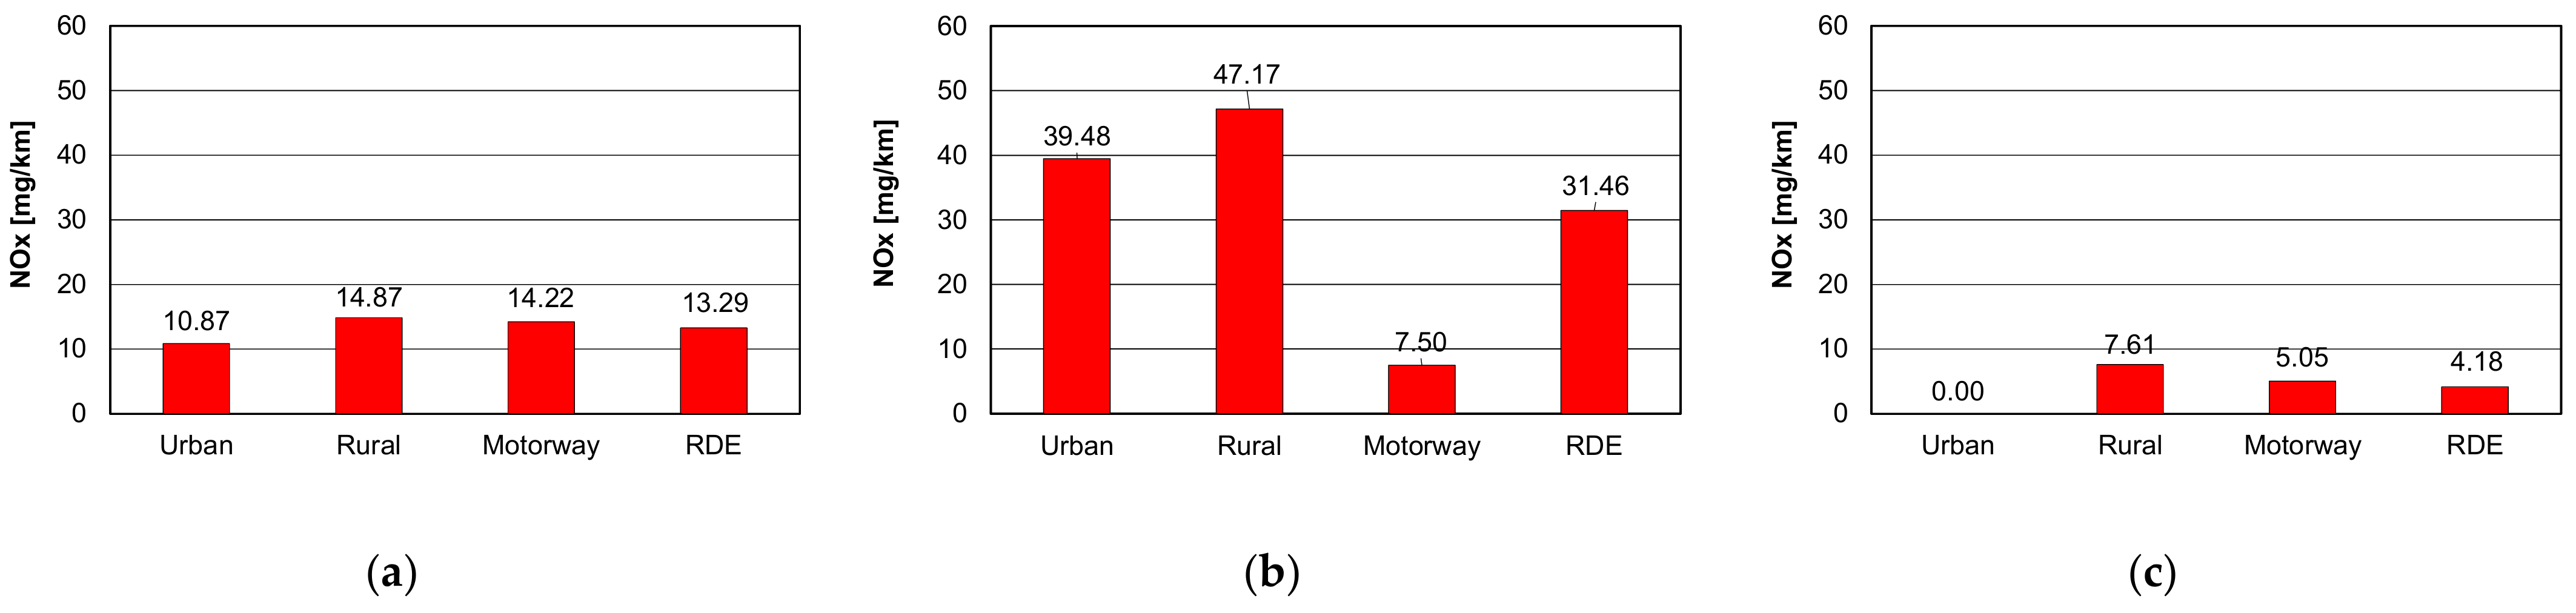
| Gasoline | b | 10.87 | 5.24 × 10⁹ | 202 | 1.73 | 13.29 | 7.01 × 10¹¹ | 198 | 1.76 | |
| blimit | 60 | 6 × 10¹¹ | 95 | 60 | 6 × 10¹¹ | 95 | ||||
| Diesel | b | 39.48 | 2.78 × 10¹¹ | 200 | 1.78 | 31.46 | 2.44 × 10¹¹ | 188 | 1.66 | |
| blimit | 80 | 6 × 10¹¹ | 95 | 80 | 6 × 10¹¹ | 95 | ||||
| PHEV | b | 0.00 | 0 | 0 | 0.00 | 4.18 | 2.88 × 10¹¹ | 95 | 0.83 | |
| blimit | 60 | 6 × 10¹¹ | 95 | 60 | 6 × 10¹¹ | 95 | ||||
| Vehicle | Urban | RDE | ||||||||
| NOx [mg/km] | PN [1/km] | CO2 [g/km] | EFU | NOx [mg/km] | PN [1/km] | CO2 [g/km] | EFRDE | |||
| Gasoline | b | 10.87 | 5.24 × 10⁹ | 202 | 0.30 | 13.29 | 7.01 × 10¹¹ | 198 | 0.83 | |
| blimit | 60 | 6 × 10¹¹ | 95 | 60 | 6 × 10¹¹ | 95 | ||||
| Diesel | b | 39.48 | 2.78 × 10¹¹ | 200 | 0.64 | 31.46 | 2.44 × 10¹¹ | 188 | 0.356 | |
| blimit | 80 | 6 × 10¹¹ | 95 | 80 | 6 × 10¹¹ | 95 | ||||
| PHEV | b | 0.00 | 0 | 0 | 0.00 | 4.18 | 2.88 × 10¹¹ | 95 | 0.35 | |
| blimit | 60 | 6 × 10¹¹ | 95 | 60 | 6 × 10¹¹ | 95 | ||||
| Category HDV Vehicle | Urban | RDE | |||||||
| NOx [g/kWh] | PN [1/kWh] | CO2 [g/kWh] | EFU | NOx [g/kWh] | PN [1/kWh] | CO2 [g/kWh] | EFRDE | ||
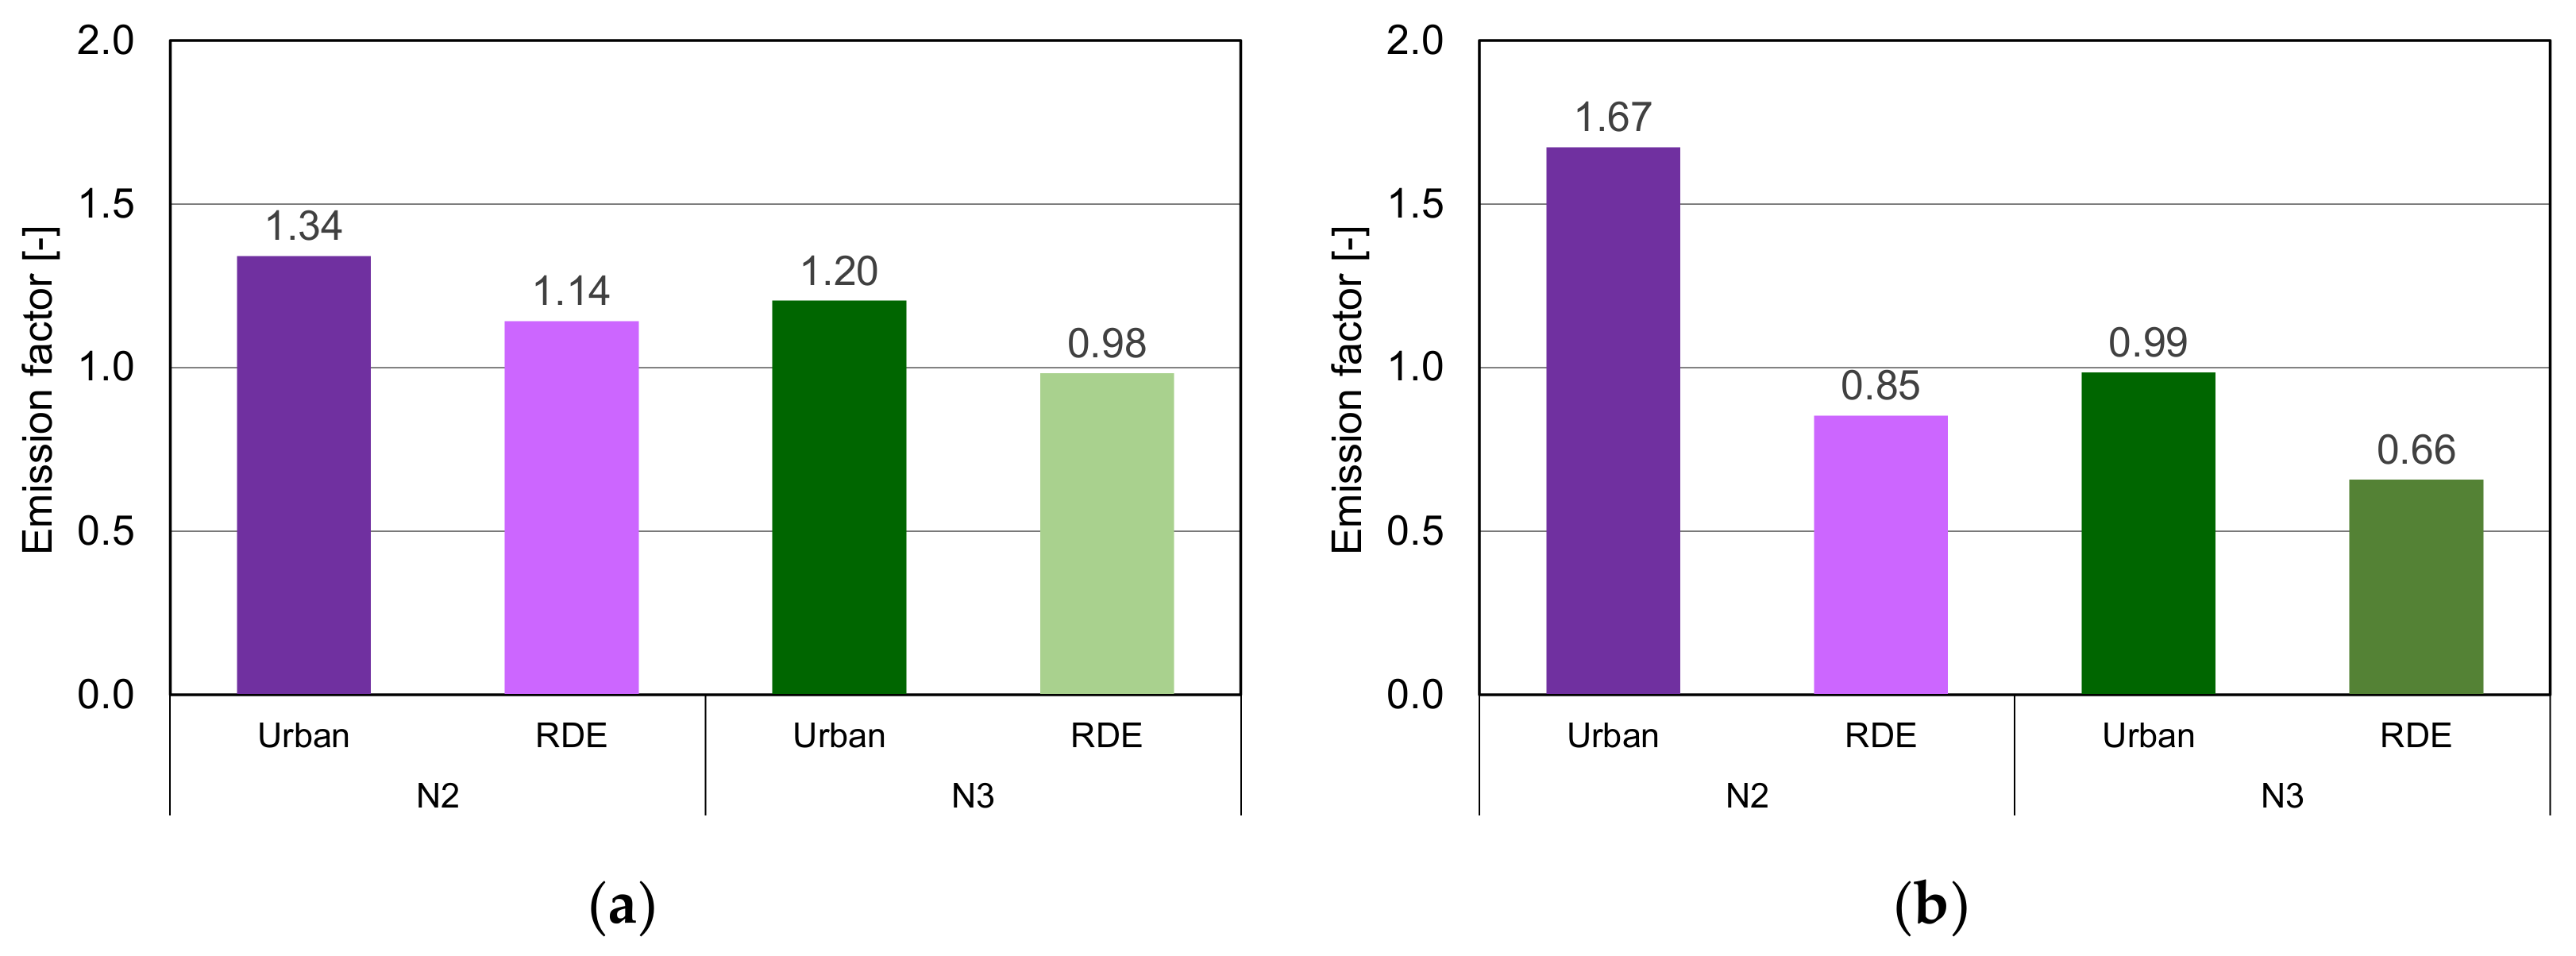
| N2 | b | 0.526 | 1.37 × 10¹² | 857 | 1.34 | 0.460 | 3.78 × 10¹¹ | 780 | 1.14 |
| blimit | 0.460 | 6 × 10¹¹ | 650 | 0.460 | 6 × 10¹¹ | 650 | |||
| N3 | b | 0.710 | 2.29 × 10¹¹ | 775 | 1.20 | 0.420 | 1.41 × 10¹¹ | 667 | 0.98 |
| blimit | 0.460 | 6 × 10¹¹ | 650 | 0.460 | 6 × 10¹¹ | 650 | |||
| Category HDV Vehicle | Urban | RDE | |||||||
|---|---|---|---|---|---|---|---|---|---|
| NOx [g/kWh] | PN [1/kWh] | CO2 [g/kWh] | EFU | NOx [g/kWh] | PN [1/kWh] | CO2 [g/kWh] | EFRDE | ||
| N2 | b | 0.526 | 1.37 × 10¹² | 857 | 1.67 | 0.460 | 3.78 × 10¹¹ | 780 | 0.85 |
| blimit | 0.460 | 6 × 10¹¹ | 650 | 0.460 | 6 × 10¹¹ | 650 | |||
| N3 | b | 0.710 | 2.29 × 10¹¹ | 775 | 0.99 | 0.420 | 1.41 × 10¹¹ | 667 | 0.66 |
| blimit | 0.460 | 6 × 10¹¹ | 650 | 0.460 | 6 × 10¹¹ | 650 | |||
References
- Road Transport: Reducing CO2 Emissions from Vehicles: CO2 Emission Performance Standards for Vehicles and Vans (2020 onwards). Available online: https://ec.europa.eu/clima/policies/transport/vehicles/regulation_en#tab-0-0 (accessed on 28 February 2021).
- The European Parliament and the Council of the European Union. Regulation (EU) 2019/631 of the European Parliament and of the Council of 17 April 2019 setting CO2 emission performance standards for new passenger vehicles and for new light commercial vehicles, and repealing Regulations (EC) No 443/2009 and (EU) No 510/2011. Off. J. Eur. Union 2019, 111, 13–534. [Google Scholar]
- The European Parliament and the Council of the European Union. Regulation (EU) 2018/842 of the European Parliament and of the Council of 30 May 2018 on binding annual greenhouse gas emission reductions by Member States from 2021 to 2030 contributing to climate action to meet commitments under the Paris Agreement and amending Regulation (EU) No 525/2013. Off. J. Eur. Union 2018, 156, 26–42. [Google Scholar]
- Clairotte, M.; Valverde, V.; Bonnel, P.; Gruering, C.; Pavlovic, J.; Manara, D.; Loos, R.; Giechaskiel, B.; Carriero, M.; Otura, M.; et al. Light-Duty Vehicles Emissions Testing; Joint Research Centre, Publications Office of the European Union: Luxemburg, 2019. [Google Scholar]
- Suarez-Bertoa, R.; Valverde, V.; Clairotte, M.; Pavlovic, J.; Giechaskiel, B.; Franco, V.; Kregar, Z.; Astorga, C. On-road emissions of passenger vehicles beyond the boundary conditions of the real-driving emissions test. Environ. Res. 2019, 176, 108572. [Google Scholar] [CrossRef]
- Papadopoulos, G.; Ntziachristos, L.; Tziourtziooumis, C.; Keramydas, C.; Lo, T.-S.; Ng, K.-L.; Wong, H.-L.; Wong, C.K.-L. Real-world gaseous and particulate emissions from Euro IV to VI medium duty diesel trucks. Sci. Total Environ. 2020, 731, 139137. [Google Scholar] [CrossRef]
- Mendoza-Villafuerte, P.; Suarez-Bertoa, R.; Giechaskiel, B.; Riccobono, F.; Bulgheroni, C.; Astorga, C.; Perujo, A. NOx, NH3, N2O and PN real driving emissions from a Euro VI heavy-duty vehicle. Impact of regulatory on-road test conditions on emissions. Sci. Total Environ. 2017, 609, 546–555. [Google Scholar] [CrossRef] [PubMed]
- Ko, S.; Park, J.; Kim, H.; Kang, G.; Lee, J.; Kim, J.; Lee, J. NOx emissions from Euro 5 and Euro 6 Heavy-Duty Diesel Vehicles under Real Driving Conditions. Energies 2020, 13, 218. [Google Scholar] [CrossRef]
- Grigoratos, T.; Fontaras, G.; Giechaskiel, B.; Zacharof, N. Real world emissions performance of heavy-duty Euro VI diesel vehicles. Atmos. Environ. 2019, 201, 348–359. [Google Scholar] [CrossRef]
- Tansini, A.; Zacharof, N.; Prado Rujas, I.; Fontaras, G. Analysis of VECTO data for Heavy-Duty Vehicles (HDV) CO2 emission targets. JRC Sci. Policy Rep. 2018. [Google Scholar] [CrossRef]
- Vermeulen, R.J.; Vonk, W.A.; van Gijlswijk, R.N.; Buskermolen, E.G. The Netherlands In Service Emissions Testing Programme for Heavy-Duty Vehicles 2015–2016—Annual Report. TNO 2016 R11270; Earth, Life & Social Sciences: Delft, The Netherlands, 2016. [Google Scholar]
- Leach, F.C.P.; Peckham, M.S.; Hammond, M.J. Identifying NOx Hotspots in Transient Urban Driving of Two Diesel Buses and a Diesel Car. Atmosphere 2020, 11, 355. [Google Scholar] [CrossRef]
- Commission Regulation (EU) 2016/427 of 10 March 2016 amending Regulation (EC) No 692/2008 as Regards Emissions from Light Passenger and Commercial Vehicles (Euro 6). Off. J. Eur. Union 2016, 82, 1–98. Available online: http://data.europa.eu/eli/reg/2016/427/oj (accessed on 28 February 2021).
- Commission Regulation (EU) 2016/646 of 20 April 2016 amending Regulation (EC) No 692/2008 as Regards Emissions from Light Passenger and Commercial Vehicles (Euro 6). Off. J. Eur. Union 2016, 109, 1–22. Available online: http://data.europa.eu/eli/reg/2016/646/oj (accessed on 28 February 2021).
- Commission Regulation (EU) 2017/1154 of 7 June 2017 Amending Regulation (EU) 2017/1151 Supplementing Regulation (EC) No 715/2007 of the European Parliament and of the Council on Type-Approval of Motor Vehicles with Respect to Emissions from Light Passenger and Commercial Vehicles (Euro 5 and Euro 6) and on Access to Vehicle Repair and Maintenance Information, Amending Directive 2007/46/EC of the European Parliament and of the Council, Commission Regulation (EC) No 692/2008 and Commission Regulation (EU) No 1230/2012 and Repealing Regulation (EC) No 692/2008 and Directive 2007/46/EC of the European Parliament and of the Council as Regards Real-Driving Emissions from Light Passenger and Commercial Vehicles (Euro 6). Off. J. Eur. Union 2017, 175, 708–732. Available online: http://data.europa.eu/eli/reg/2017/1154/oj (accessed on 28 February 2021).
- Commission Regulation (EU) 2018/1832 of 5 November 2018 Amending Directive 2007/46/EC of the European Parliament and of the Council, Commission Regulation (EC) No 692/2008 and Commission Regulation (EU) 2017/1151 for the Purpose of Improving the Emission Type Approval Tests and Procedures for Light Passenger and Commercial Vehicles, Including Those for In-Service Conformity and Real-Driving Emissions and Introducing Devices for Monitoring the Consumption of Fuel and Electric Energy. Off. J. Eur. Union 2018, 301, 1–314. Available online: http://data.europa.eu/eli/reg/2018/1832/oj (accessed on 28 February 2021).
- Pielecha, J.; Skobiej, K.; Kurtyka, K. Exhaust emissions and energy consumption analysis of conventional, hybrid, and electric vehicles in real driving cycles. Energies 2020, 13, 6423. [Google Scholar] [CrossRef]
- Gis, W.; Gis, M.; Pielecha, J. Comparative studies of exhaust emissions from three city buses in real traffic conditions, one with LNG, the other with CI engine and a hybrid bus. SAE Tech. Pap. 2020. [Google Scholar] [CrossRef]
- Pielecha, J.; Gis, M.; Skobiej, K.; Kurtyka, K. Measurements of particulate emissions from Euro 5/6 passenger vehicles in different drive settings. IOP Conf. Series: Earth Environ. Sci. 2021, 642, 12018. [Google Scholar] [CrossRef]
- Gis, M.; Pielecha, J.; Gis, W. Exhaust emissions of buses LNG and Diesel in RDE tests. Open Eng. 2021, 11, 356–364. [Google Scholar] [CrossRef]
- Pielecha, J.; Gis, M. The use of the mild hybrid system in vehicles with regard to exhaust emissions and their environmental impact. Arch. Transp. 2020, 55, 41–50. [Google Scholar] [CrossRef]
- Gis, W.; Gis, M.; Pielecha, J. Evaluation of Exhaust Emissions in Real Driving Emissions Tests in Different Test Route Configurations. In Advances in Intelligent Systems and Computing; Springer Science and Business Media LLC: Berlin/Heidelberg, Germany, 2019; pp. 143–153. [Google Scholar]
- Skobiej, K.; Pielecha, J. Plug-in hybrid ecological category in real driving emissions. Energies 2021, 14, 2340. [Google Scholar] [CrossRef]
- Mohamued, E.A.; Ahmed, M.; Pypłacz, P.; Liczmanska-Kopcewicz, K.; Khan, M.A. Global Oil Price and Innovation for Sustainability: The Impact of R&D Spending, Oil Price and Oil Price Volatility on GHG Emissions. Energies 2021, 14, 1757. [Google Scholar] [CrossRef]
- Massar, M.; Reza, I.; Rahman, S.M.; Abdullah, S.M.H.; Jamal, A.; Al-Ismail, F.S. Impacts of Autonomous Vehicles on Greenhouse Gas Emissions—Positive or Negative? Int. J. Environ. Res. Public Health 2021, 18, 5567. [Google Scholar] [CrossRef] [PubMed]
- Tucki, K.; Mruk, R.; Orynycz, O.; Botwińska, K.; Gola, A.; Bączyk, A. Toxicity of Exhaust Fumes (CO, NOx) of the Compression-Ignition (Diesel) Engine with the Use of Simulation. Sustainability 2019, 11, 2188. [Google Scholar] [CrossRef]
- Nerhagen, L.; Janhäll, S. Exhaust Emissions and Environmental Classification of Cars. What Indicators Are Relevant According to External Cost Calculations? VTI 2015, Notat 3A-2015; The Swedish National Road and Transport Research Institute: Linköping, Sweden, 2015. [Google Scholar]
- McClellan, R.O.; Hesterberg, T.W.; Wall, J.C. Evaluation of carcinogenic hazard of diesel engine exhaust needsto consider revolutionary changes in diesel technology. Regul. Toxicol. Pharmacol. 2012, 63, 225–258. [Google Scholar] [CrossRef]
- Zhang, X.; Wang, Q.; Qin, W.; Guo, L. Sustainable Policy Evaluation of Vehicle Exhaust Control—Empirical Data from China’s Air Pollution Control. Sustainability 2020, 12, 125. [Google Scholar] [CrossRef]
- Rexeis, M.; Röck, M.; Hausberger, S. Comparison of Fuel Consumption and Emissions for Representative Heavy-Duty Vehicles in Europe. 2018. Available online: https://www.theicct.org/publications/HDV-EU-fuel-consumption-and-emissions-comparison (accessed on 1 April 2021).
- Ragon, P.-L.; Rodríguez, F. The EU Heavy-Duty CO2 Standards: Impact of the COVID-19 Crisis and Market Dynamics on Baseline Emissions. 2020, ICCT WORKING PAPER 2020-30. Available online: https://theicct.org/sites/default/files/publications/eu-hdv-emissions-baseline-20201210.pdf (accessed on 1 April 2021).


| Technical Parameters | Vehicle A (Gasoline) | Vehicle B (Diesel) | Vehicle C (Hybrid) |
|---|---|---|---|
| Engine | Gasoline, Turbo, R4, 16 V | Gasoline, Turbo, R4, 16 V | Gasoline, Turbo, R4, 16 V |
| Fuel system | direct injection | direct injection | direct injection |
| Engine displacement | 1591 cm3 | 1598 cm3 | 1999 cm3 |
| Max. power | 132 kW at 5500 rpm | 100 kW at 4000 rpm | 113 kW at 6000 rpm +50 kW (electric motor) |
| Transmission | automatic, six gears | automatic, six gears | automatic, six gears |
| Aftertreatment system | TWC + GPF | DOC + DPF + SCR | TWC + GPF |
| Curb weight | 1540 kg | 1635 kg | 1815 kg |
| Maximum weight | 2050 kg | 2150 kg | 2270 kg |
| Euro standard | Euro 6d-Temp | Euro 6d-Temp | Euro 6d-Temp |
| Mileage | 25,000 km | 15,000 km | 18,000 km |
| Battery | - | 13.6 kWh | 13.6 kWh; SOC = 100% |
| Technical Parameters | Category N2 | Category N3 |
|---|---|---|
| Engine | Diesel, R4 | Diesel, R6 |
| Fuel system | direct injection/common rail | direct injection/common rail |
| Engine displacement | 1968 cm3 | 12,419 cm3 |
| Max. power | 177 kW at 3600 rpm | 375 kW at 1800 rpm |
| Transmission | automatic, six gears | automatic, six gears |
| After-treatment system | DOC + DPF + SCR | DOC + DPF + SCR |
| Curb weight | 2915 kg | 7778 kg |
| Load | 5000 kg | 40,000 kg |
| Euro standard | Euro VI | Euro VI |
| Mileage | 83,000 km | 65,000 km |
| Phase | V [km/h] | Time [s] | Share [%] | Value [%] | CO [g/kWh] | NOx [g/kWh] | PN [1/kWh] | CO2 [g/kWh] |
|---|---|---|---|---|---|---|---|---|
| Urban | 0–50 | 3566 | 45 ± 5 | 45% | 0.787 | 0.526 | 1.37 × 10¹² | 857 |
| Rural | 50–75 | 1816 | 25 ± 5 | 23% | 0.623 | 1.269 | 6.61 × 10¹⁰ | 772 |
| Motorway | 75–90 | 2539 | 30 ± 5 | 32% | 0.677 | 0.010 | 5.91 × 10⁹ | 743 |
| Total | 7921 | 100 | 100% | 0.693 | 0.460 | 3.78 × 10¹¹ | 780 |
| Phase | V [km/h] | Time [s] | Share [%] | Value [%] | CO [g/kWh] | NOx [g/kWh] | PN [g/kWh] | CO2 [g/kWh] |
|---|---|---|---|---|---|---|---|---|
| Urban | 0–50 | 2014 | 30 ± 5 | 35% | 0.790 | 0.710 | 2.29 × 10¹¹ | 775 |
| Rural | 50–75 | 1343 | 25 ± 5 | 24% | 0.648 | 0.304 | 3.40 × 10¹¹ | 684 |
| Motorway | 75–90 | 2326 | 45 ± 5 | 41% | 0.693 | 0.230 | 8.60 × 10¹¹ | 661 |
| Total | 5683 | 100 | 100% | 0.708 | 0.420 | 5.41 × 10¹¹ | 667 |
Publisher’s Note: MDPI stays neutral with regard to jurisdictional claims in published maps and institutional affiliations. |
© 2021 by the authors. Licensee MDPI, Basel, Switzerland. This article is an open access article distributed under the terms and conditions of the Creative Commons Attribution (CC BY) license (https://creativecommons.org/licenses/by/4.0/).
Share and Cite
Gis, W.; Gis, M.; Pielecha, J.; Skobiej, K. Alternative Exhaust Emission Factors from Vehicles in On-Road Driving Tests. Energies 2021, 14, 3487. https://doi.org/10.3390/en14123487
Gis W, Gis M, Pielecha J, Skobiej K. Alternative Exhaust Emission Factors from Vehicles in On-Road Driving Tests. Energies. 2021; 14(12):3487. https://doi.org/10.3390/en14123487
Chicago/Turabian StyleGis, Wojciech, Maciej Gis, Jacek Pielecha, and Kinga Skobiej. 2021. "Alternative Exhaust Emission Factors from Vehicles in On-Road Driving Tests" Energies 14, no. 12: 3487. https://doi.org/10.3390/en14123487
APA StyleGis, W., Gis, M., Pielecha, J., & Skobiej, K. (2021). Alternative Exhaust Emission Factors from Vehicles in On-Road Driving Tests. Energies, 14(12), 3487. https://doi.org/10.3390/en14123487