1. Introduction
Information from the European Commission states that HVAC systems are responsible for 50% of the energy consumed in buildings. Directive (EU) 2018/844 which amended Directive 2010/31/EU, sets a target of 80–95% reduction of greenhouse gas emissions in buildings by the year 2050 compared to 1990. In this context, the concept of nearly zero energy consumption (nZEB) involves the use of energy efficiency to reduce energy demand to a minimum as well as the use of renewable energies.
The use of natural ventilation strategies contributes to the reduction of cooling energy demand during periods when outdoor conditions are able to provide indoor comfort. However, in the summer months, this situation is difficult to achieve on days when the outside temperature is high and additional cooling sources are required.
Solar radiation can be used to produce passive ventilation and cooling in buildings through elements that utilise and transform the energy produced by the sun in order to take advantage of it for cooling strategies. According to Monghasemi and Vadiee [
1], solar chimneys can be integrated into solutions for space heating and cooling. The air contained in the chimney is heated when a surface with high energy collection is exposed to solar radiation that transfers it into the chimney cavity. The temperature difference of the air in the chimney and the room causes an extraction operation due to the buoyancy effect. In [
2], optimum air flow rates were obtained for a 45°angle of inclination of the surface that received the radiation.
Evaporative cooling, combined with natural ventilation, has the potential to reduce outdoor air temperatures in hot climates with moderate humidity by harnessing the latent heat of water in an adiabatic process. Evaporative cooling systems can be used for temperature control of both outdoor and indoor spaces. Givoni, B. developed an evaporative cooling system to cool the outdoor areas of the Expo ’92 in Seville. This system consisted of a duct that caught outside air at the top and sprayed water controlled by a pump. The passive downdraught evaporative cooling (PDEC) system cools the air at the top of the building to produce an airflow down to the lower spaces [
3]. Cuce et al. [
4] presented other designs that could be combined with wind towers such as using an evaporative cooling pad at the intake of outdoor air. The temperature reduction provided by PDEC systems, according to the research reviewed in [
5], can be as much as 8 °C for outdoor ambient temperatures above 35 °C.
There are different materials that can be appropriate for the manufacture of the pad used as a direct evaporative system: porous metal pads, cellulose pads, porous ceramic pads and plastic polymer pads. Rong et al. [
6] studied the performance of a cellulose pad under different modes of control and operation. The highest temperature drop was obtained when the inlet air velocity increased to its highest value. When the water supply to the pad was increased, the pressure drop increased as well. Other authors [
7] developed a numerical model for an aluminium, multilayer pad (Oxyvap cooler). In [
8], the optimisation of a cellulose pad, based on the multi-objective method to improve thermodynamic and life cycle performance, was presented. They obtained optimal pad thicknesses for most cases between 0.23 and 0.24 m and a contact area of 540 m
2/m
3. Experimental results of a new pad design with beehive construction, made of corrugated cellulose were presented in [
9], wherein 84% efficiency was obtained. New natural materials were presented and compared in [
10]. The highest water consumption was obtained for pads made of eucalyptus fibres. In this study, higher evaporation rates were obtained for all materials when the air velocity was higher. The different parameters affecting the design of an evaporative pad were evaluated in different climates in Morocco [
11]. In all cases, the cooling capacity (mass flow rate of cooled air) was found to increase for higher thicknesses and increasing frontal air velocity. However, the performance (saturation effectiveness) was lower for lower thicknesses and increasing air velocity. Water consumption ranged between 3.3 kg/h and 10.6 kg/h. Similar conclusions were obtained in [
12] for different climatic zones of Iran. The performance of the evaporative pad could be increased by pre-drying the intake air with desiccants or membranes [
13]. A new arrangement for an evaporative pad consisting of a multi-layer section was proposed in [
14].
The application potential of evaporative cooling systems has a strong dependence on the local climate. Aparicio-Ruiz et al. [
15] studied the potential of applying a PDEC system in different climates in the USA by establishing a set of maps derived from evaluating two proposed indexes based on US meteorological databases. Other authors [
16,
17] proposed an index for the calculation of climatic cooling potential and energy savings through evaluation using climatic data from different zones of the Iberian Peninsula.
Kang et al. [
18] obtained a mathematical correlation for spray PDEC systems that accurately predicted the temperature, humidity and velocity of the air flowing out of the systems. These authors developed in [
19] a CFD model that enabled predicting the airflow characteristics in PDEC systems and the relationship with system performance under different humidity conditions. They concluded that PDEC systems had a strong dependence on the local climate.
The aim of the study is to simulate a solar chimney-driven PDEC system in different proposed climate zones in order to evaluate performance and applicability, defined as the quality of the evaporative system for application in a specific climate. An empirical model of a novel, direct-evaporative cooling pad made of plastic mesh was used as the cooling solution for the intake air to the PDEC system. This panel was characterised by its low manufacturing cost; being configurable in many sizes, flexible and adaptable; and furthermore, the resulting air pressure drop was low. Both the empirical model of the evaporative pad as well as the ventilation and thermal model of the house were experimentally validated and implemented together in a building energy model. The model integrated the building envelope flow model, which incorporated the passive ventilation solutions (PDEC and solar chimneys) with the multi-zone thermal model. The performance of the proposed system was therefore evaluated in a specific reference building, through an energy model, in different climatic zones. The study of the performance and comfort values obtained by each system under different climatic conditions and configurations allowed us to define a suitable selection for each climate zone in terms of technology type and configuration. This is a novelty for the integration of this solution in future projects and the fulfilment of the objectives established by the EU.
2. Materials and Methods
The building energy simulation that incorporated the passive cooling system described below was based on the integration of two experimentally validated models. The combined ventilation and thermal model of the house integrated the calculation of flow rates through the building envelope and the prediction of indoor temperatures in each zone. This model was experimentally validated using on-site collected data that included the measurement of air velocities through openings, indoor comfort conditions and outdoor weather conditions. This validation was complemented with a laboratory test for the calibration of the couplings where the air velocity probes (hot-wire probes) were placed, which allowed the relationship between the measured air velocity and the air flow through the couplings to be obtained. The mathematical model of the evaporative system included the mathematical equations that predicted the air temperature at the outlet of the system and the pressure drop. To obtain the experimental data, a wind tunnel was used and equipped with a water supply, collection and recirculation system with an adjustable flow rate. The thermal- and fluid-dynamic behaviour of the C&V RF-200 model evaporative pad provided by Control and Ventilation S.L. was characterised for different thicknesses, airflows and incoming water flow rates, and a non-linear regression analysis was conducted for the constant terms calculation.
This ventilation model has certain limitations. The wind speed and indoor temperatures were considered constant for every time step (1 h) of the simulation. Temperatures were considered to be uniform across the zones and with vertical variation in the solar chimneys. Flow field on the building envelope was considered using a correlation for the pressure coefficients around the building (function of the geometric parameters of the building and the wind direction angle).
2.1. Building and Evaporative Cooling System Description
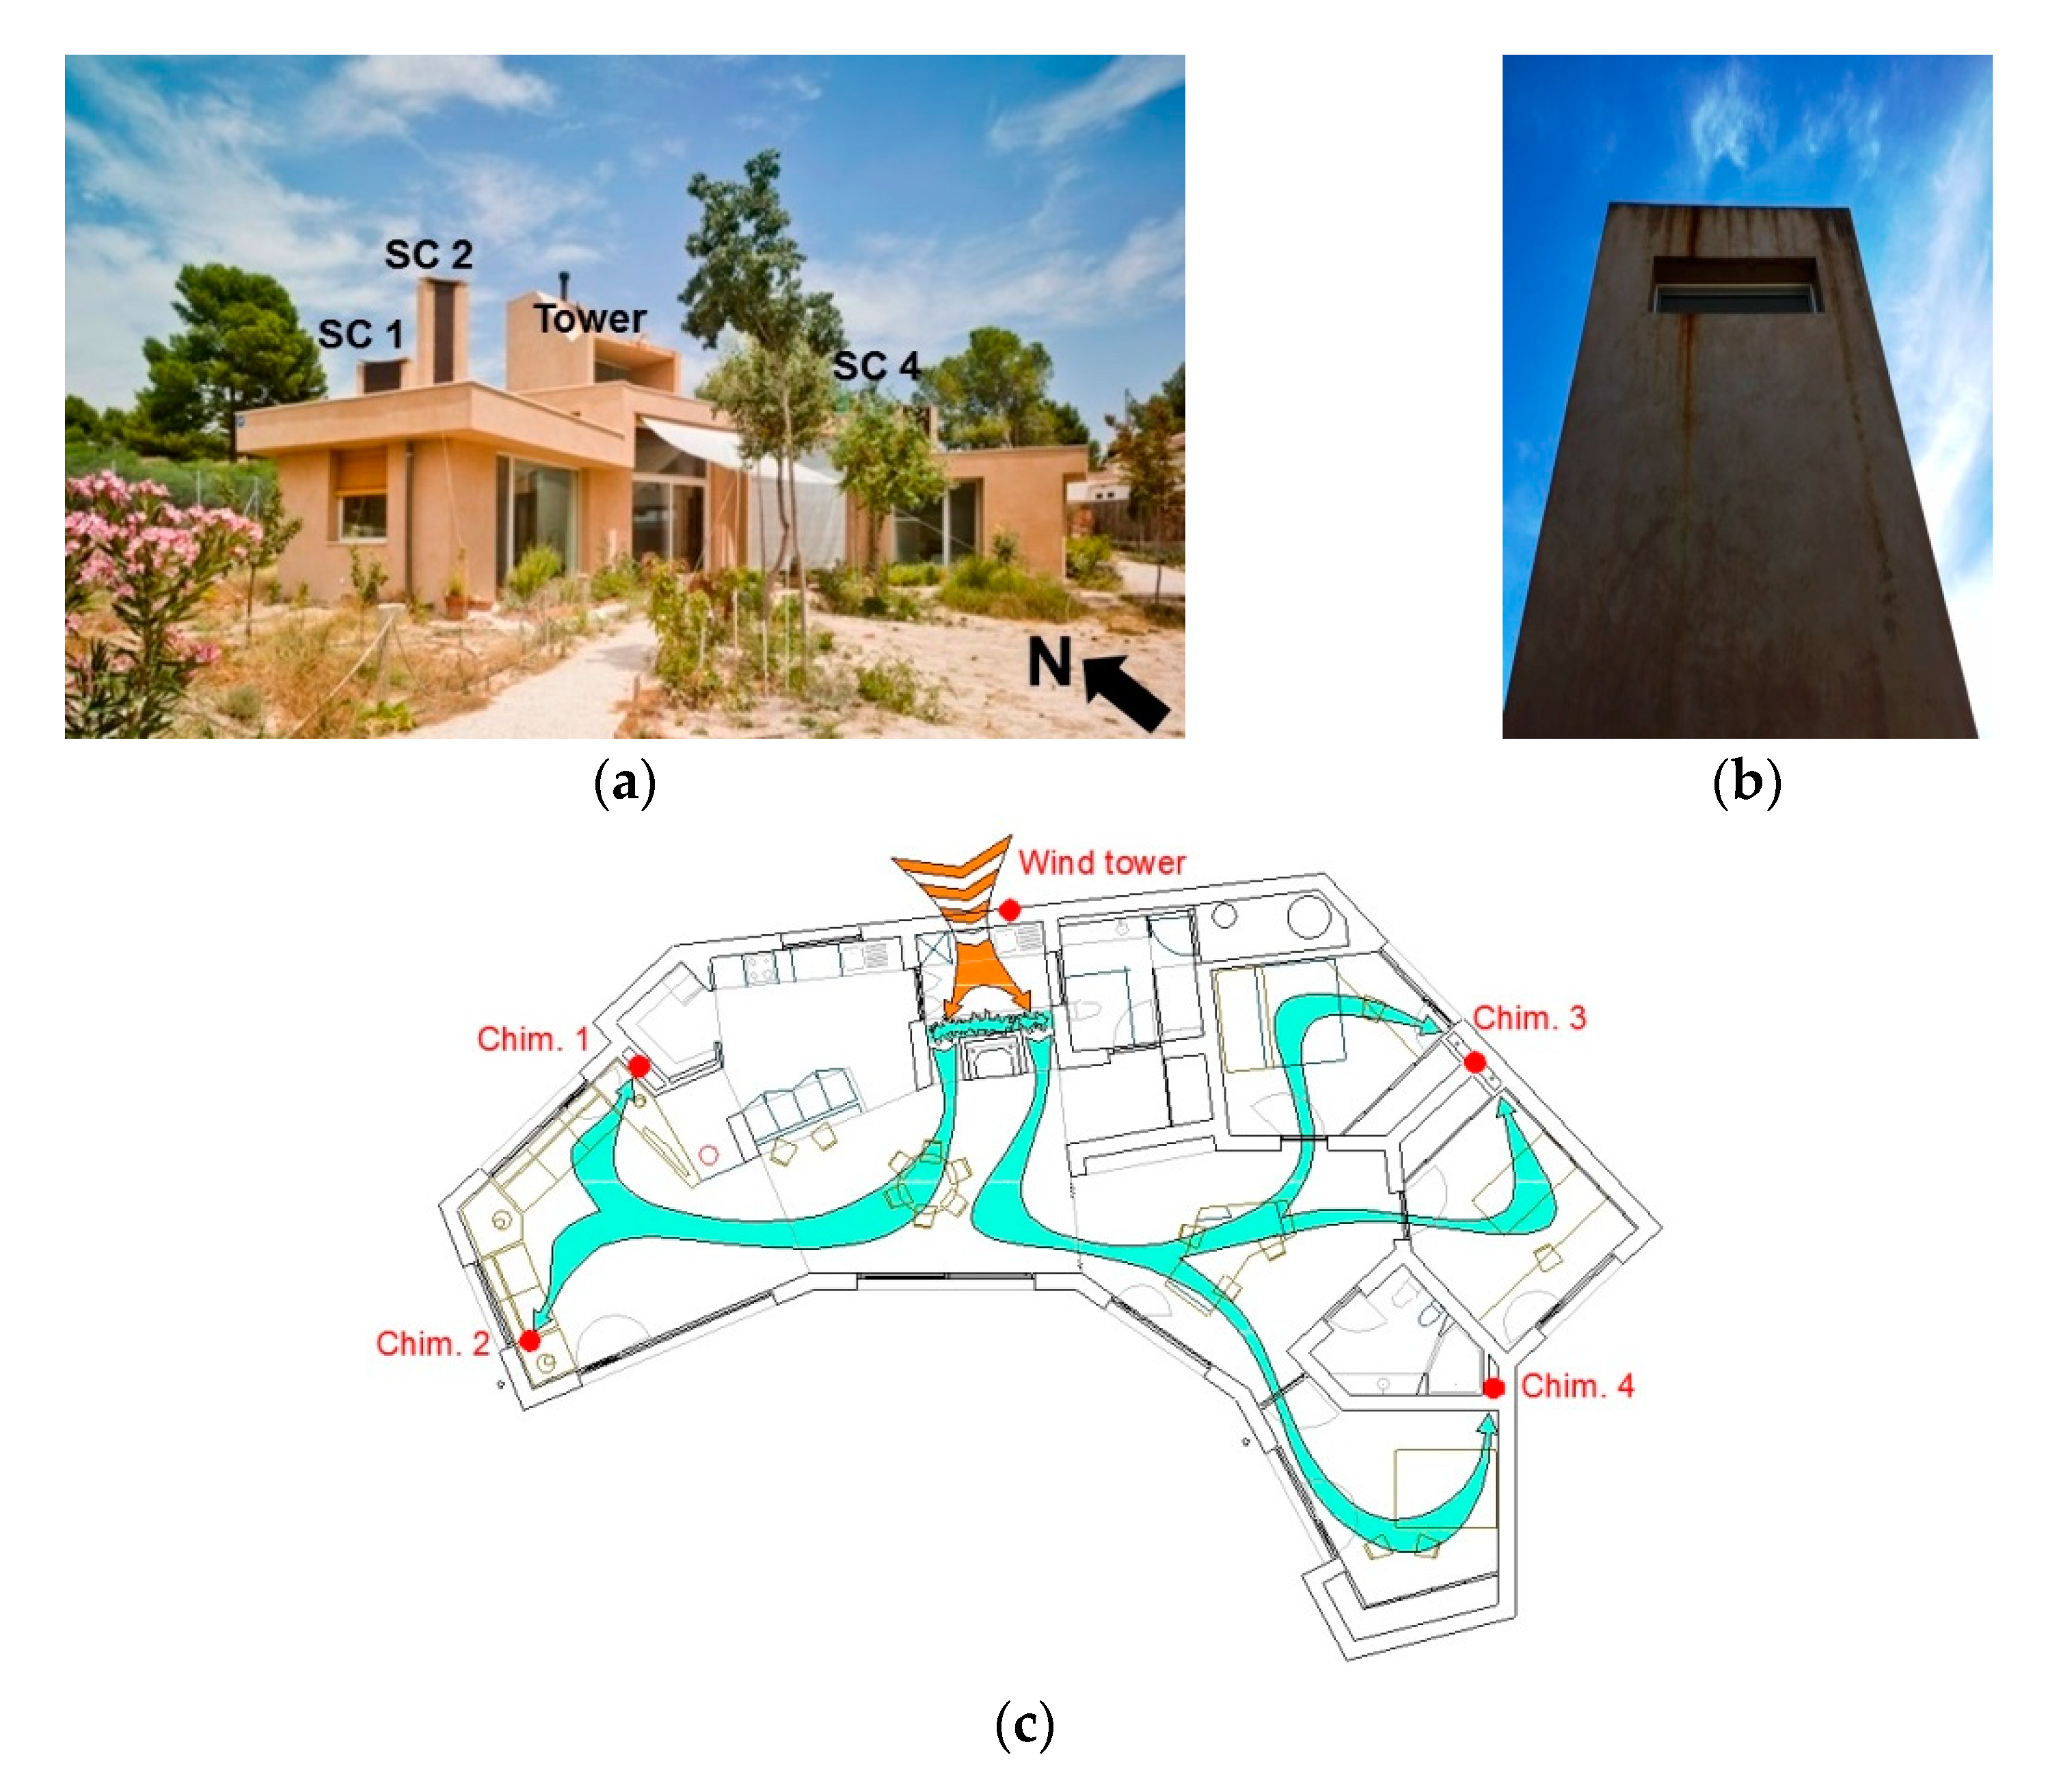
The reference house (
Figure 1a), located in Murcia (Spain), incorporated a natural ventilation system consisting of a north-facing wind tower (
Figure 1b) assisted by four solar chimneys that communicated with the rooms of the building (
Figure 1c). The wind tower favoured the natural inflow of outside air by producing a downward flow caused by the air velocity and pressure of the wind as it impinged on the façade openings. The air flow through the spaces was produced by convective ventilation wherein the air was extracted by the buoyancy effects and temperature differences that occurred in the chimneys. The solar chimneys had different geometries and were 2 m high. The solar radiation absorption surface consisted of a sheet of iron painted black.
In combination with the natural ventilation system described above, the house had a high thermal inertia. The walls acted as an energy store during the day. At night, ventilation was increased by the effect of the temperature difference, and this energy was dissipated when the outdoor temperature was lower than the indoor temperature.
The dwelling exhibited several ventilation modes, which depended on the outdoor conditions and the strategy considered. These ventilation modes were simulated and experimentally validated in a previous study [
20]. For this experimental validation, a hot-wire probe (Testo 440) was placed in the centre of the inlet section of each solar chimney to determine the temperature and air velocity. In the living room, the most occupied space, a Testo 480 multi-function instrument was installed to measure indoor air quality (IAQ) parameters and the predicted percentage of dissatisfied (PPD). The PPD index provides a quantitative prediction of the number of people who will be dissatisfied with the level of thermal comfort inside the house. This value was calculated directly according to ISO 7730, by the software integrated into the instrument, as a function of the measured indoor air and radiation temperatures, air velocity and relative humidity. The weather station (PCE-FWS 20N) was placed at the top of the building, and the electrical energy consumption was measured with a Circutor Myebox 1500 analyser. For the calibration test of the couplings, a Testo 420 balometer was used.
The evaporative system considered in the simulation consisted of a grid or mesh made of polyethylene wire with a diameter of 0.7 mm and measurements of 4 × 4 mm, according to the UNE-62.001 standard. The resulting compactness was 117.2 m2/m3, and it was characterised by good efficiency, low pressure drop and low installation and maintenance costs. The minimum water flow rate for the evaporative pad recommended by the manufacturer was 20 l/min of water per square metre of exposed horizontal (upper) surface of the pad.
In the empirical test presented in [
21], a pad with dimensions 492 × 712 mm was characterised for thicknesses of 80, 160 and 250 mm. A total of 91 tests were conducted for different airflows and water flow rates.
2.2. Model Description
The simulation of the PDEC system driven by solar chimneys was conducted using the building energy model developed from the experimentally validated models presented in [
20,
21].
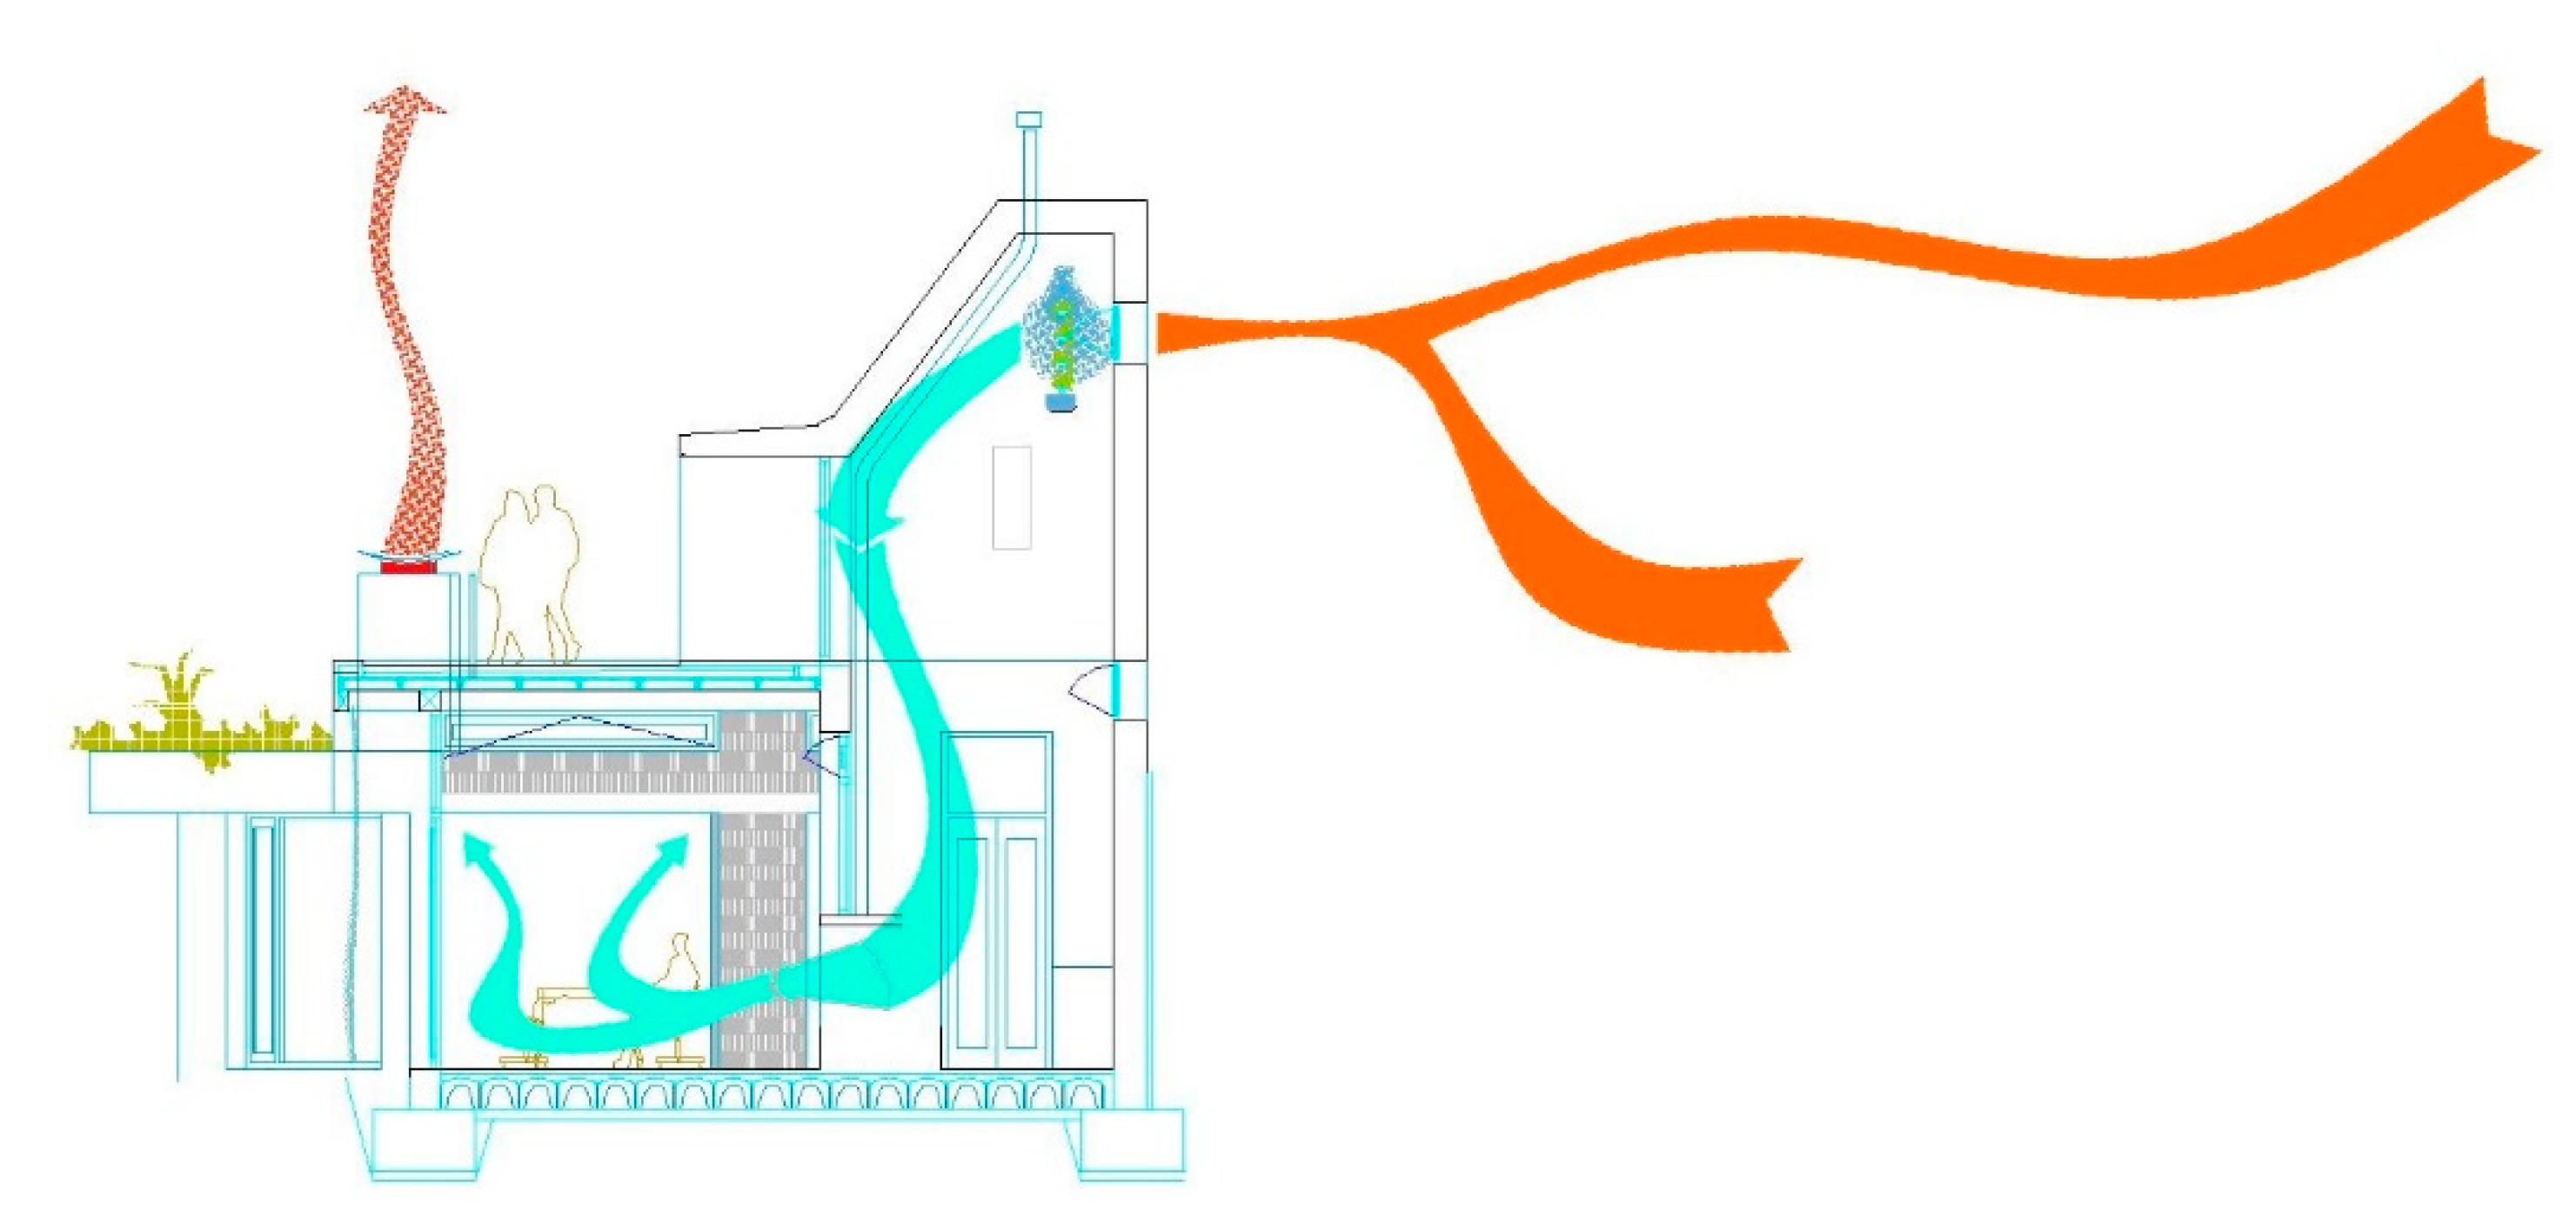
The inlet air was led through a direct evaporative pad and introduced into the tower that distributed the cooler air to the different zones of the house, according to the scheme in
Figure 2 and
Figure 3. The air inside was driven by forces that favoured its movement: wind pressure at the opening, suction at the solar chimneys and lower temperature at the tower that generated a downdraft of air.
The energy model was conducted in TRNSYS (Transient System Simulation Tool) [
22] and included the combination of the envelope ventilation flow model developed in EES (Engineering Equation Solver) [
23] and the multi-zone thermal model. A solution was obtained for the ventilation flow rates and temperatures for each zone. TRNSYS is a building energy simulation program for dynamic processes that, through its calculation engine, can be connected to other non-linear equation solving tools such as EES through functions called “types”. EES has a large database of thermodynamic functions and variables that allow the development of complex energy models.
The mathematical equations, coefficients and correlations that make up the mathematical model described are presented below.
The movement of air within spaces and through openings is driven by pressure differences, according to Bernoulli’s principle. The Conservation of Mass principle states that the sum of the mass flow rate of air through the building envelope is equal to zero.
The calculation of the flow rate (
qi) at each opening is obtained from Equation (1) from the pressure differential (Δ
pi) and the effective area (
Ai).
where “
M” is the sign of the pressure differential;
M = +1 for the flow entering the space, and
M = −1 for the flow leaving the space.
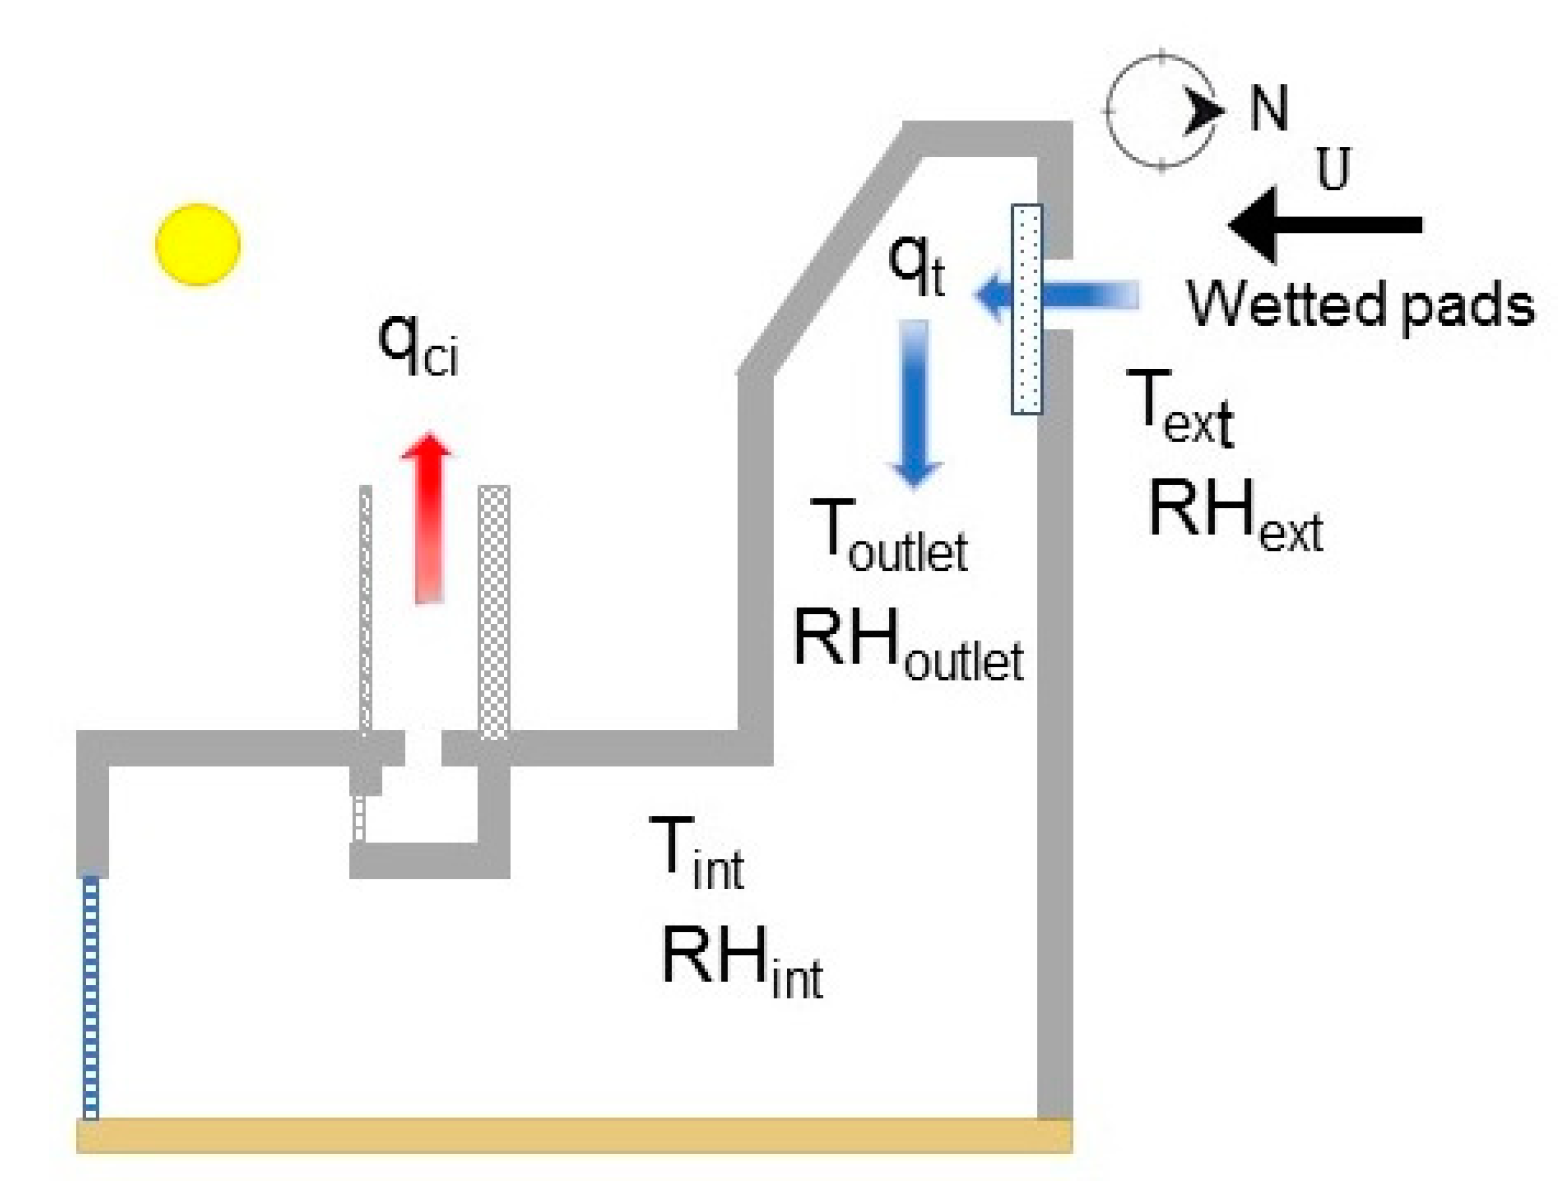
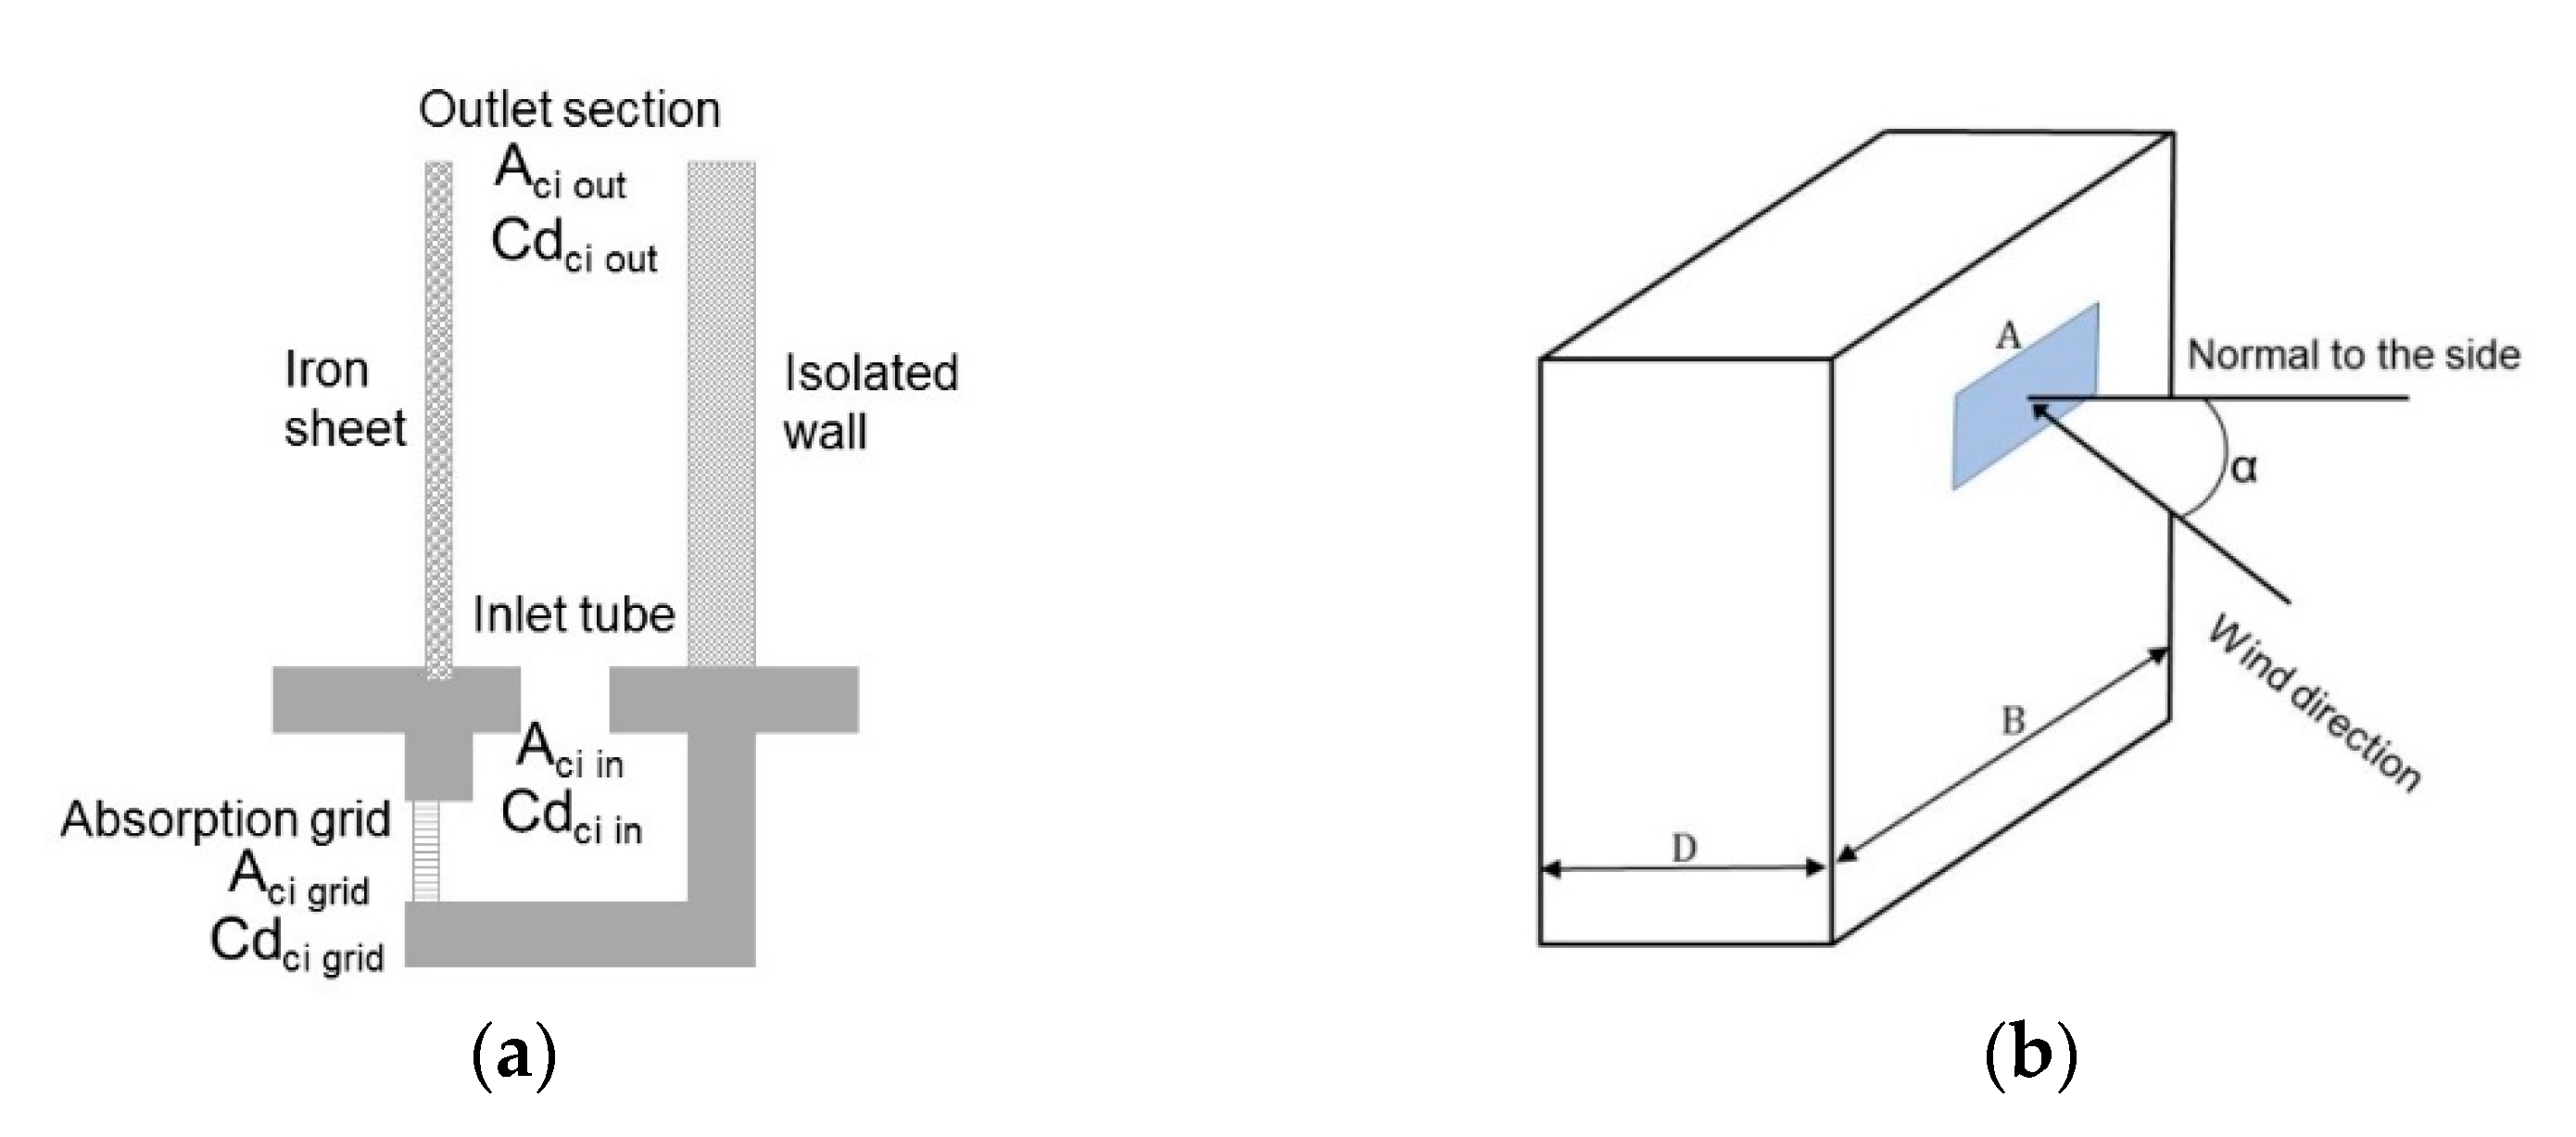
The pressure differential at the inlet of the downdraft evaporative system and at the outlet of the chimney is represented by the diagram shown in
Figure 4 and given by the following expressions, respectively:
The principle of conservation of mass of the system was defined by the following expression:
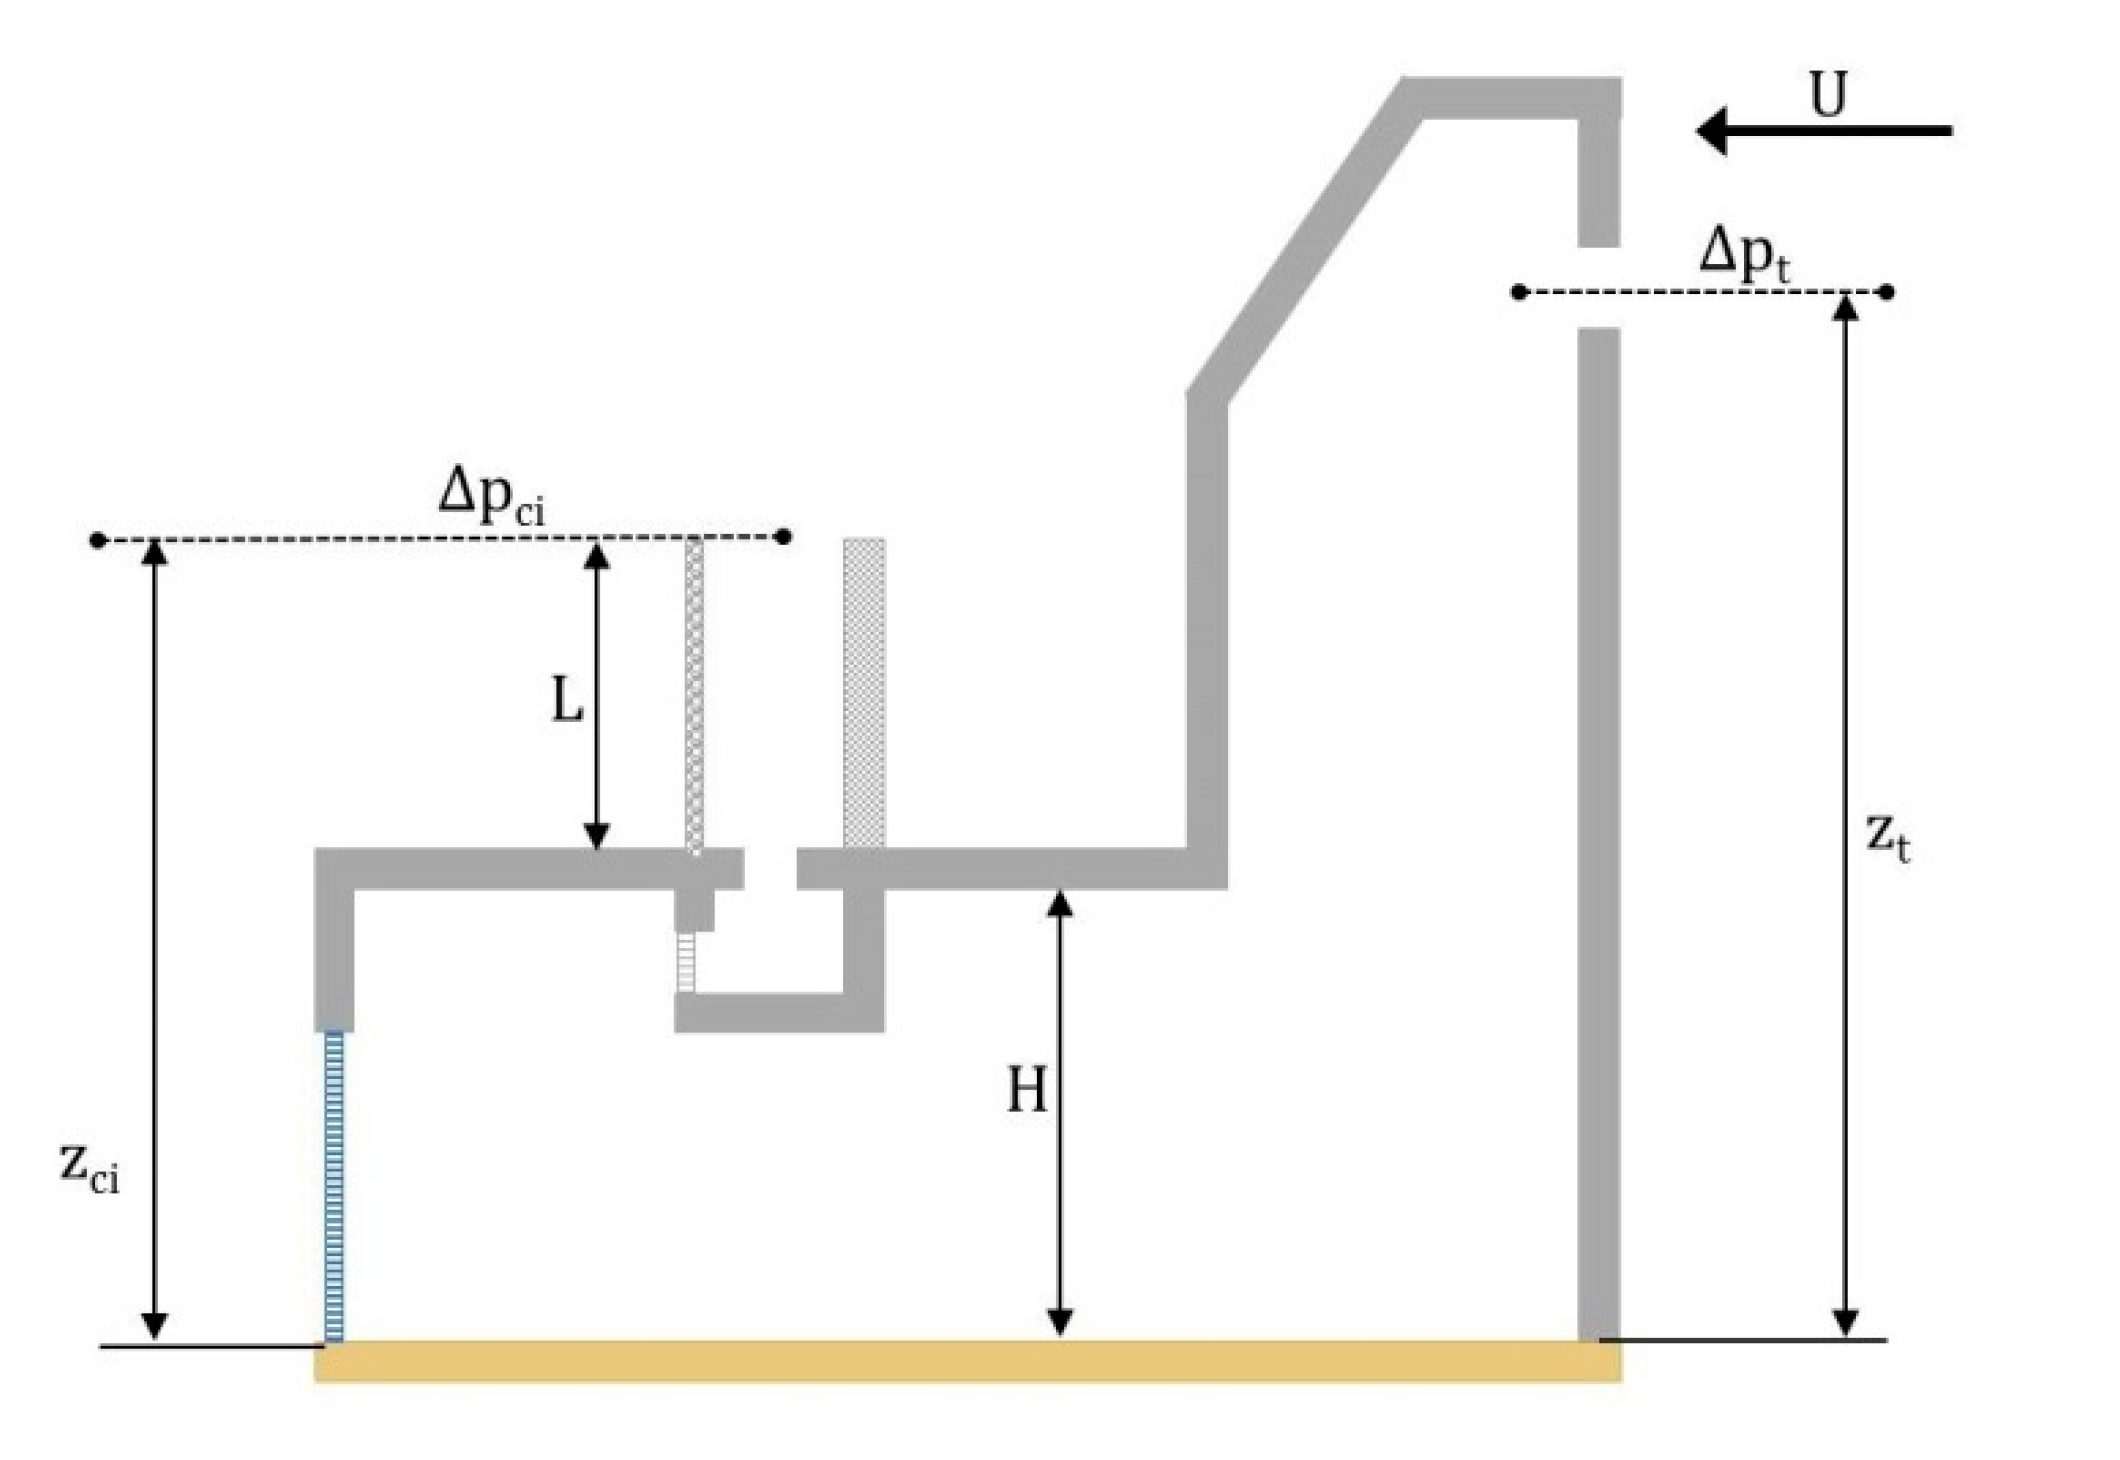
The discharge coefficient at the outlet section of the chimney was calculated using Equations (5) and (6), which considered the sections of the chimney which the air passed through: the absorption grid, inlet tube to the cavity and outlet section of the chimney.
At eff =
CdtAt is the effective area of the opening,
Cdci out and
Aci out are the discharge coefficient and the area of the chimney at the outlet and
Cdci in and
Aci in at the inlet.
Cdci grid and
Aci grid are the discharge coefficient and the area on the absorption grid, respectively (
Figure 5a). The inlet section corresponded to a 160 mm diameter tube. Chimney 1 was composed of two tubes, while the other chimneys had only one tube. Chimney 2 did not have an absorption grid.
The wind pressure coefficient at the air inlet opening was obtained using the correlation of Muehleisen and Patrizi [
24] for a low-rise building:
where
α is the angle between the normal to the side under consideration and the wind direction, S = D/B is the ratio depth to the breadth from the side under consideration and
G = ln(S).
The efficiency of the evaporative cooling system can be expressed according to Equation (8), where
Teva is the temperature at the outlet of the evaporative system,
Twb the wet bulb temperature and
TE the outside temperature.
As presented in [
21], the efficiency (
η) and pressure drop (Δ
peva) in the evaporative pad can be modelled using the empirical correlations below as a function of air velocity and inlet air flow rate (
vt y qt), pad thickness (
l), water recirculation flow rate (
qrw) and the introduction of the geometrical non-dimensional parameter (
l/
le):
2.3. TRNSYS Modelling
The mathematical model presented in the previous section was implemented in the EES environment. The output variables of this model (flow rates) were called input variables by the thermal model of the building in TRNSYS, according to the methodology presented in [
20], to calculate the indoor temperatures of each zone as output variables. The two models iterated at each time step until they converged to a solution for both variables (flow rates and indoor temperatures).
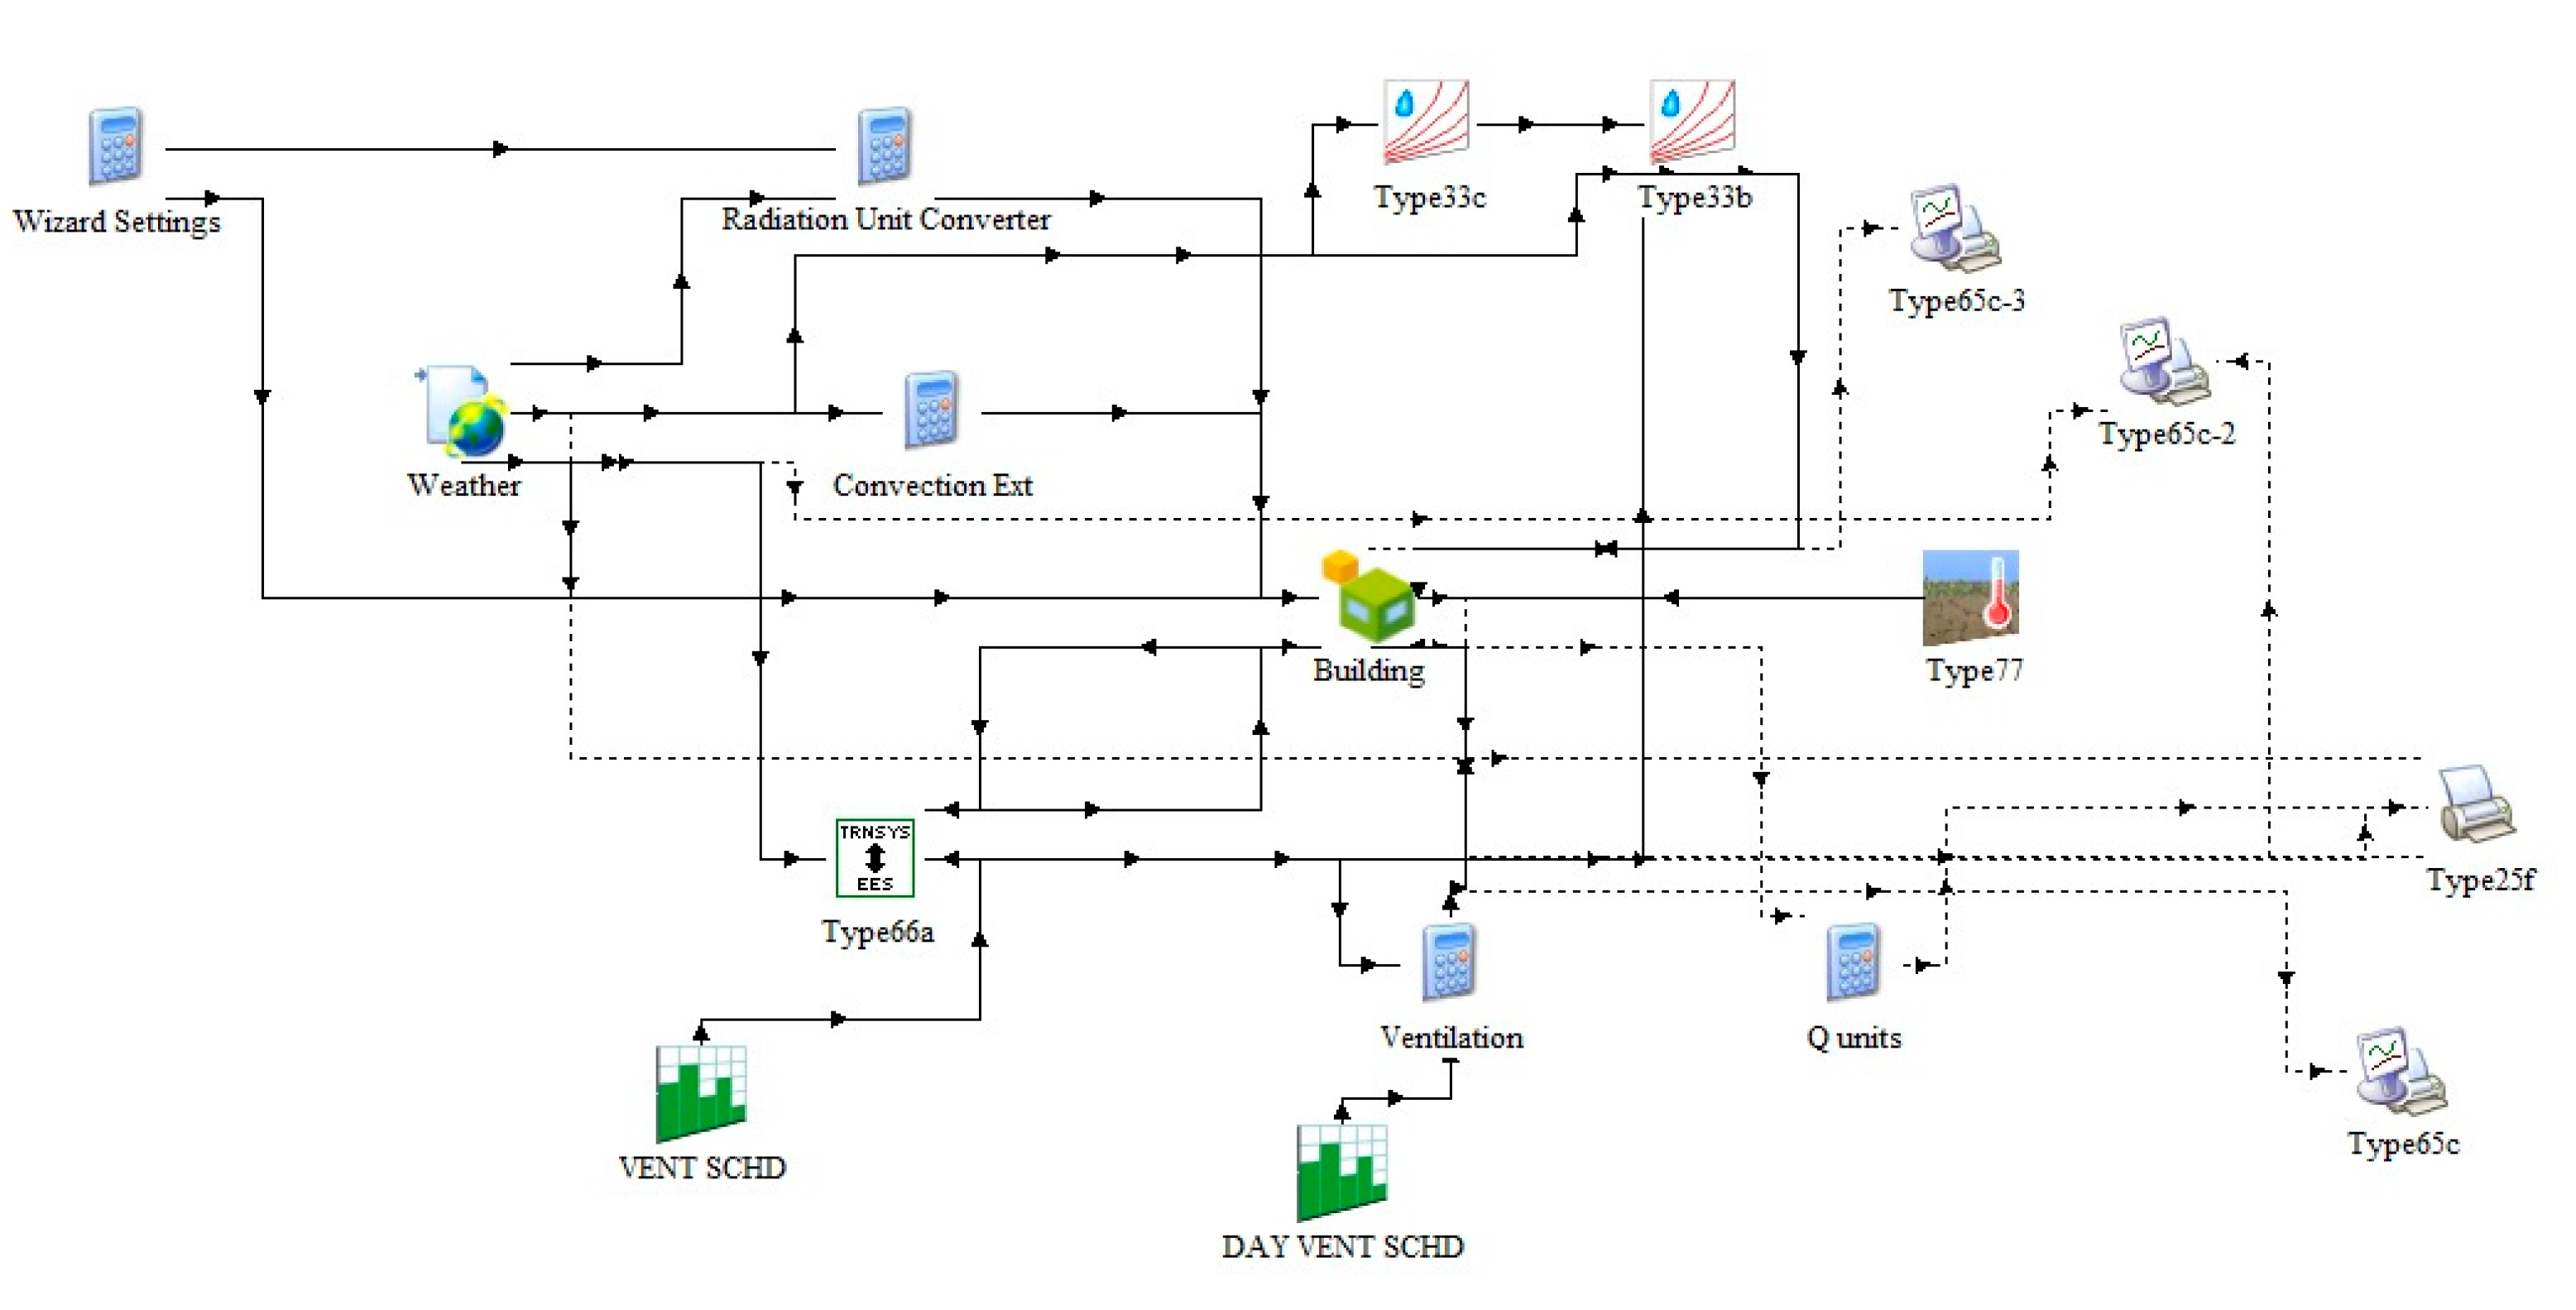
The energy model developed in TRNSYS, which combined the mathematical model implemented in EES and the multi-zone thermal model, is shown in
Figure 6.
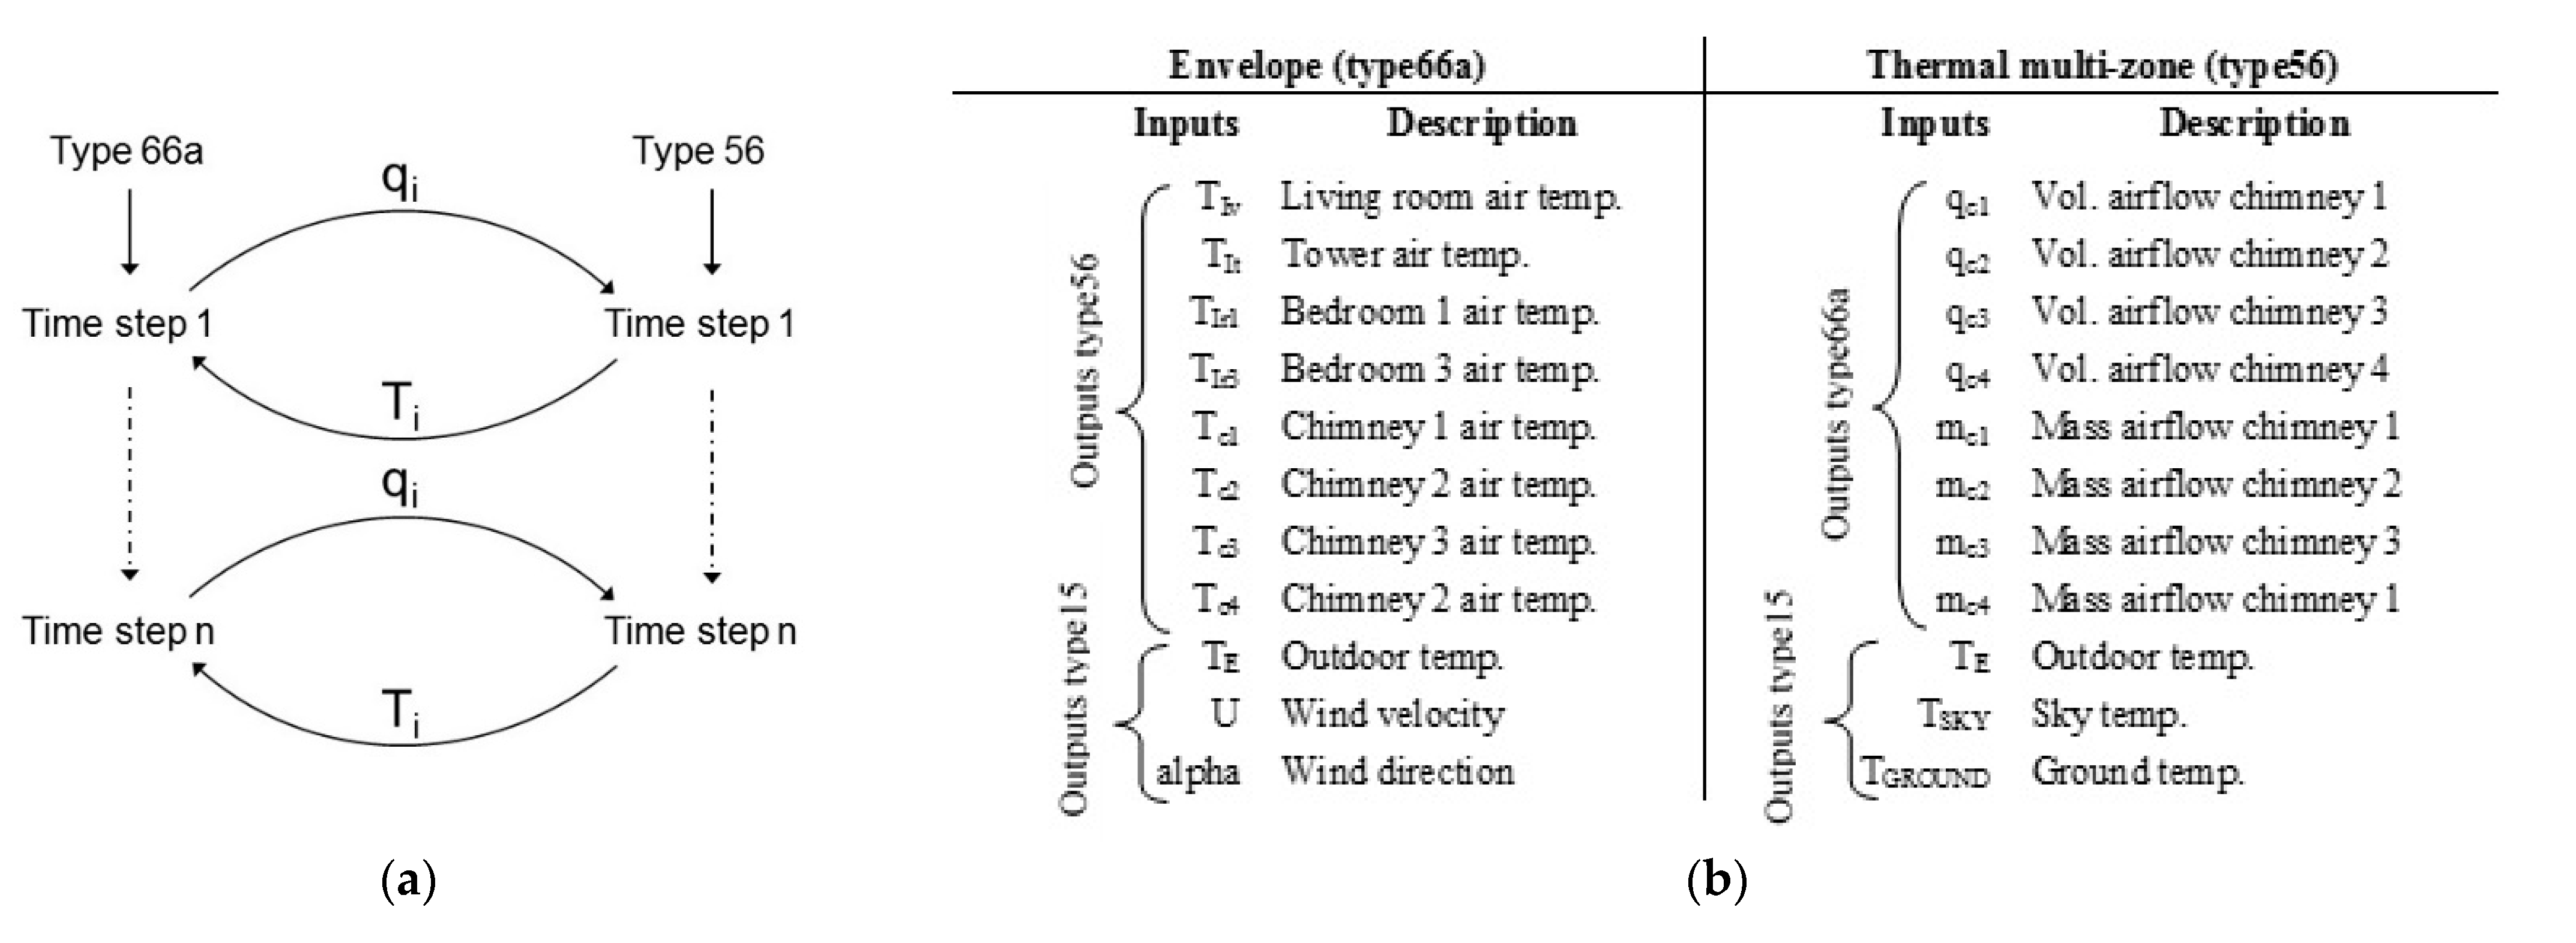
The iteration scheme of both models is depicted in
Figure 7a. The results of the flow rates calculated by the envelope model developed in ESS were called through function type 66a and introduced into the building thermal model in TRNSYS (type 56) to obtain the temperatures of each zone. These values were returned as inputs to the ventilation envelope model.
Figure 7b shows the inputs and outputs of the ventilation and thermal models.
The evaporative outlet temperature was calculated from the pad efficiency, according to Equation (9). To obtain the outlet relative humidity, the cooling evaporation process was considered isenthalpic. The model was capable of predicting consistent results for indoor temperature and flow rate, provided by the PDEC system at each time base (1 h).
4. Discussion
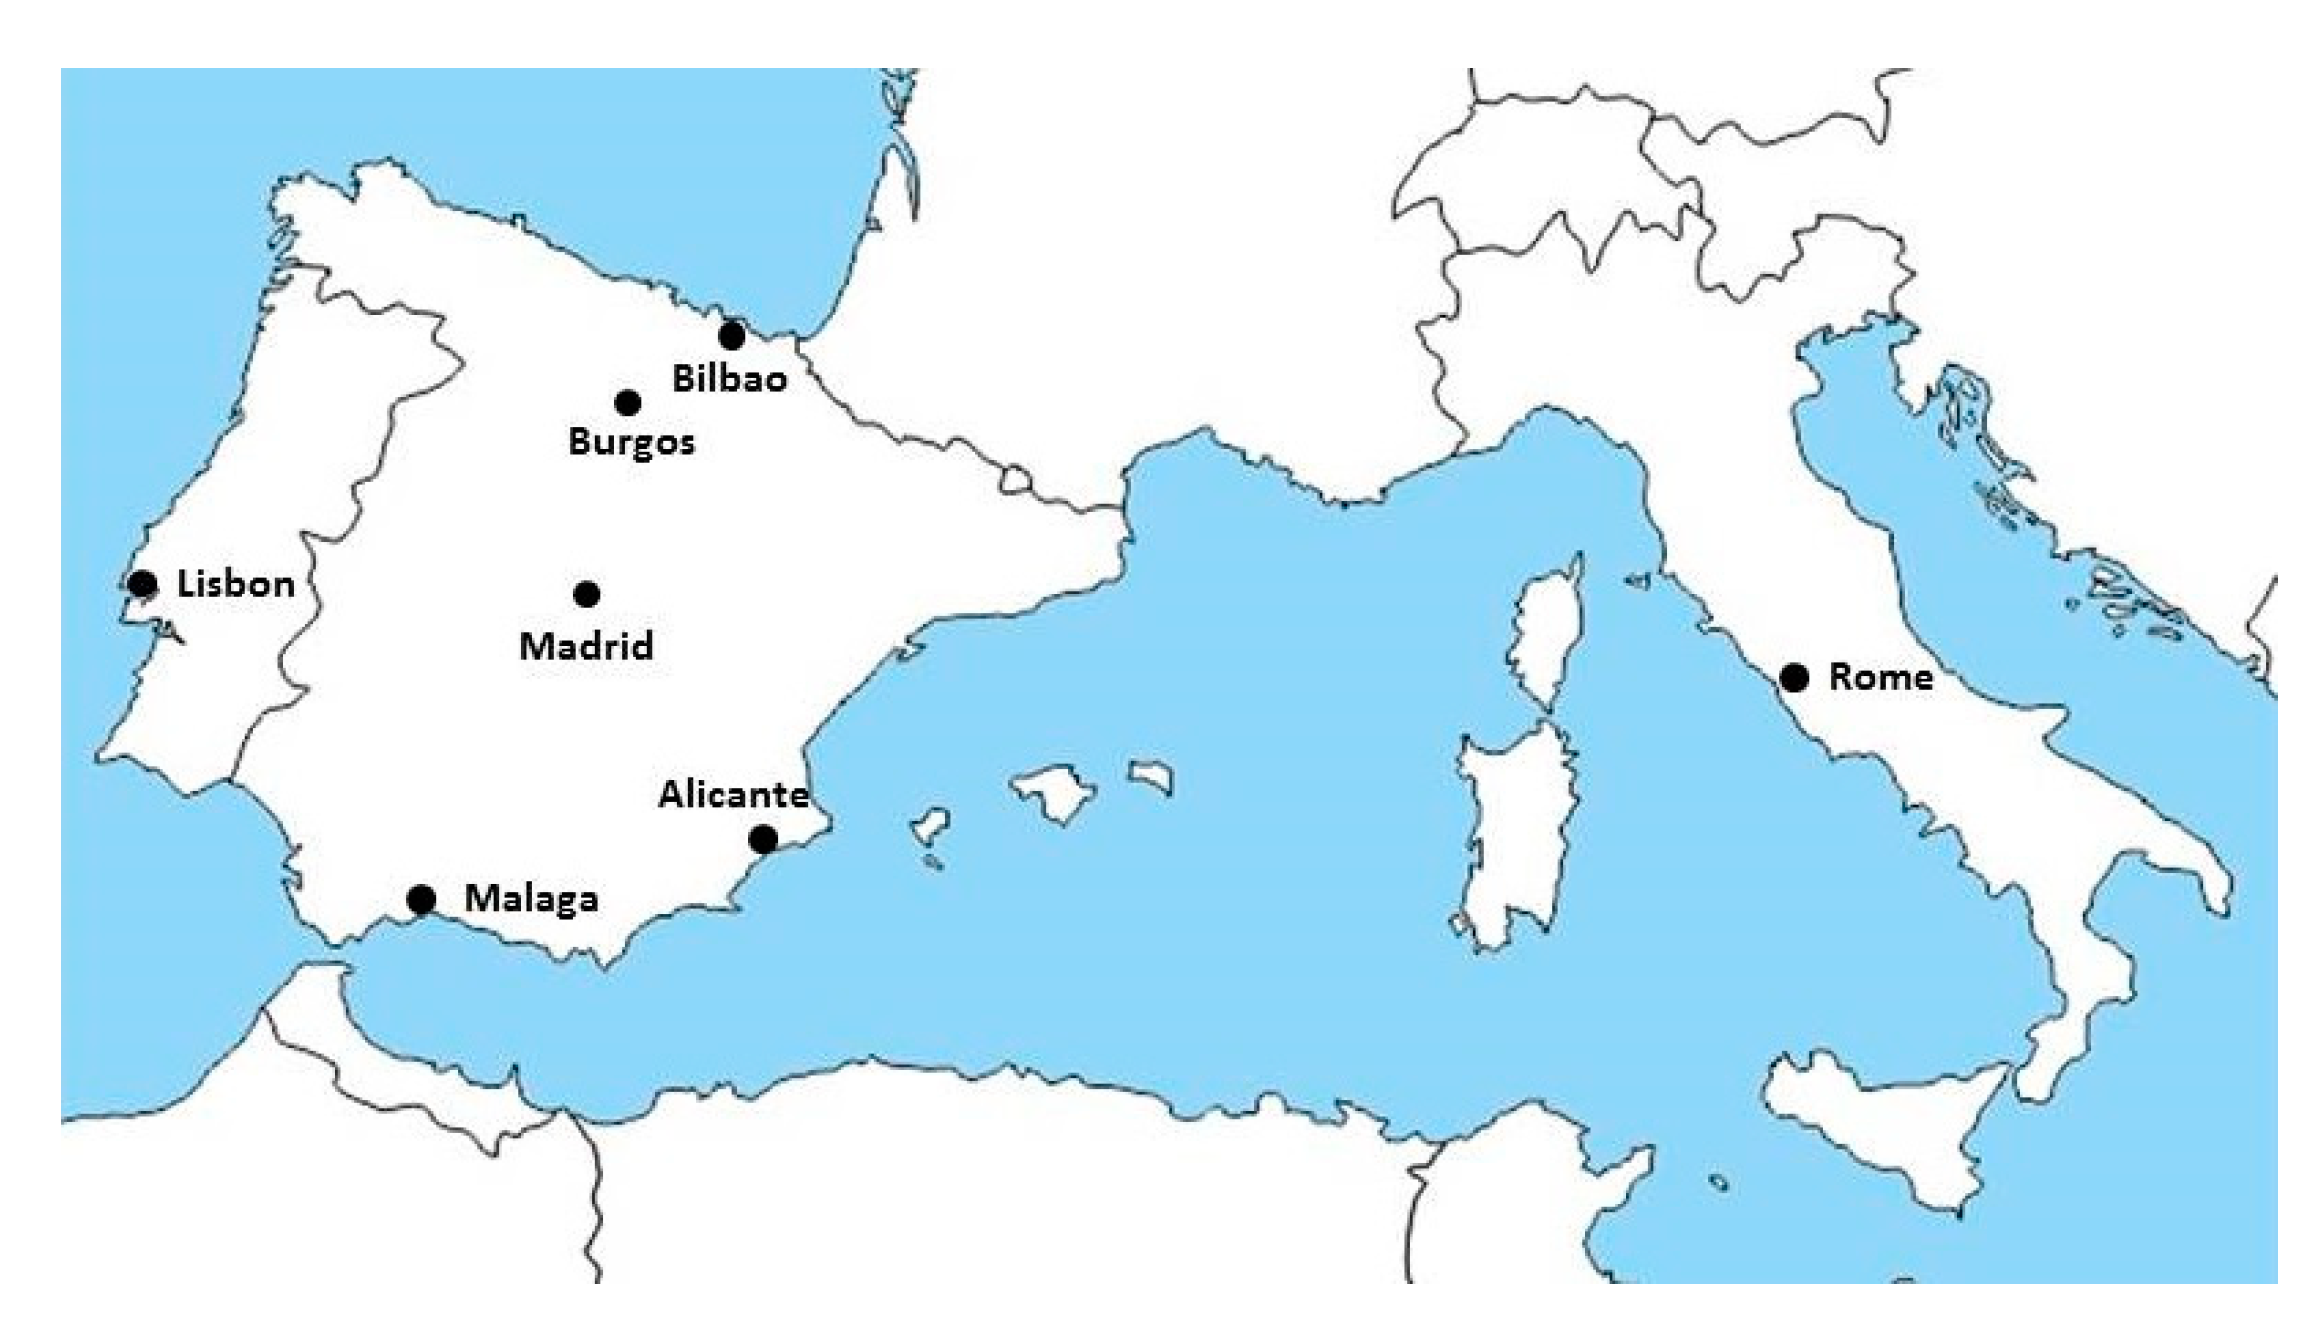
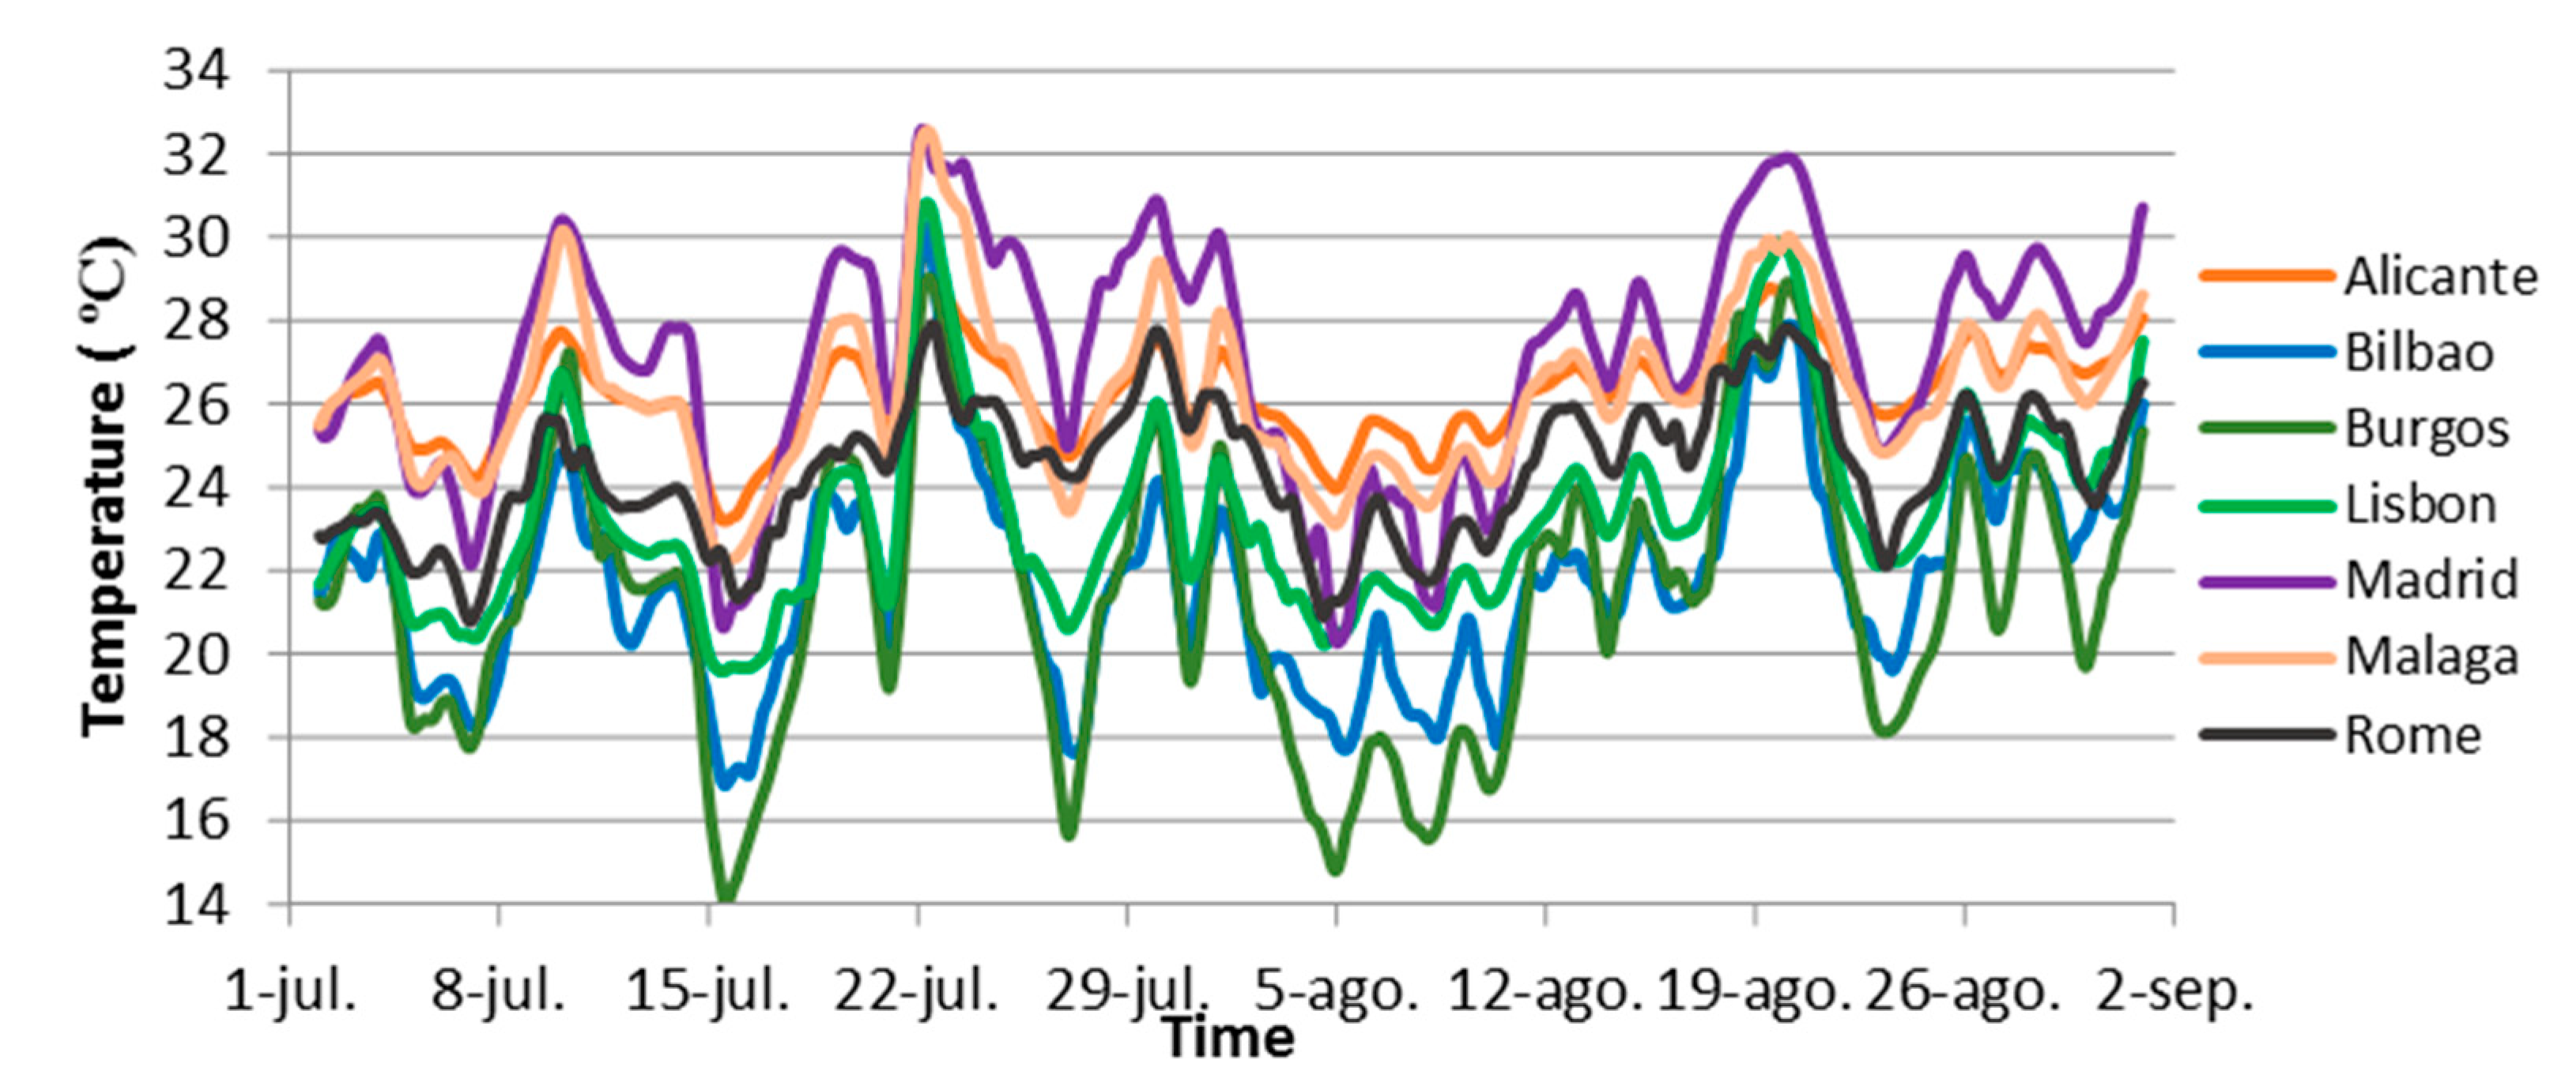
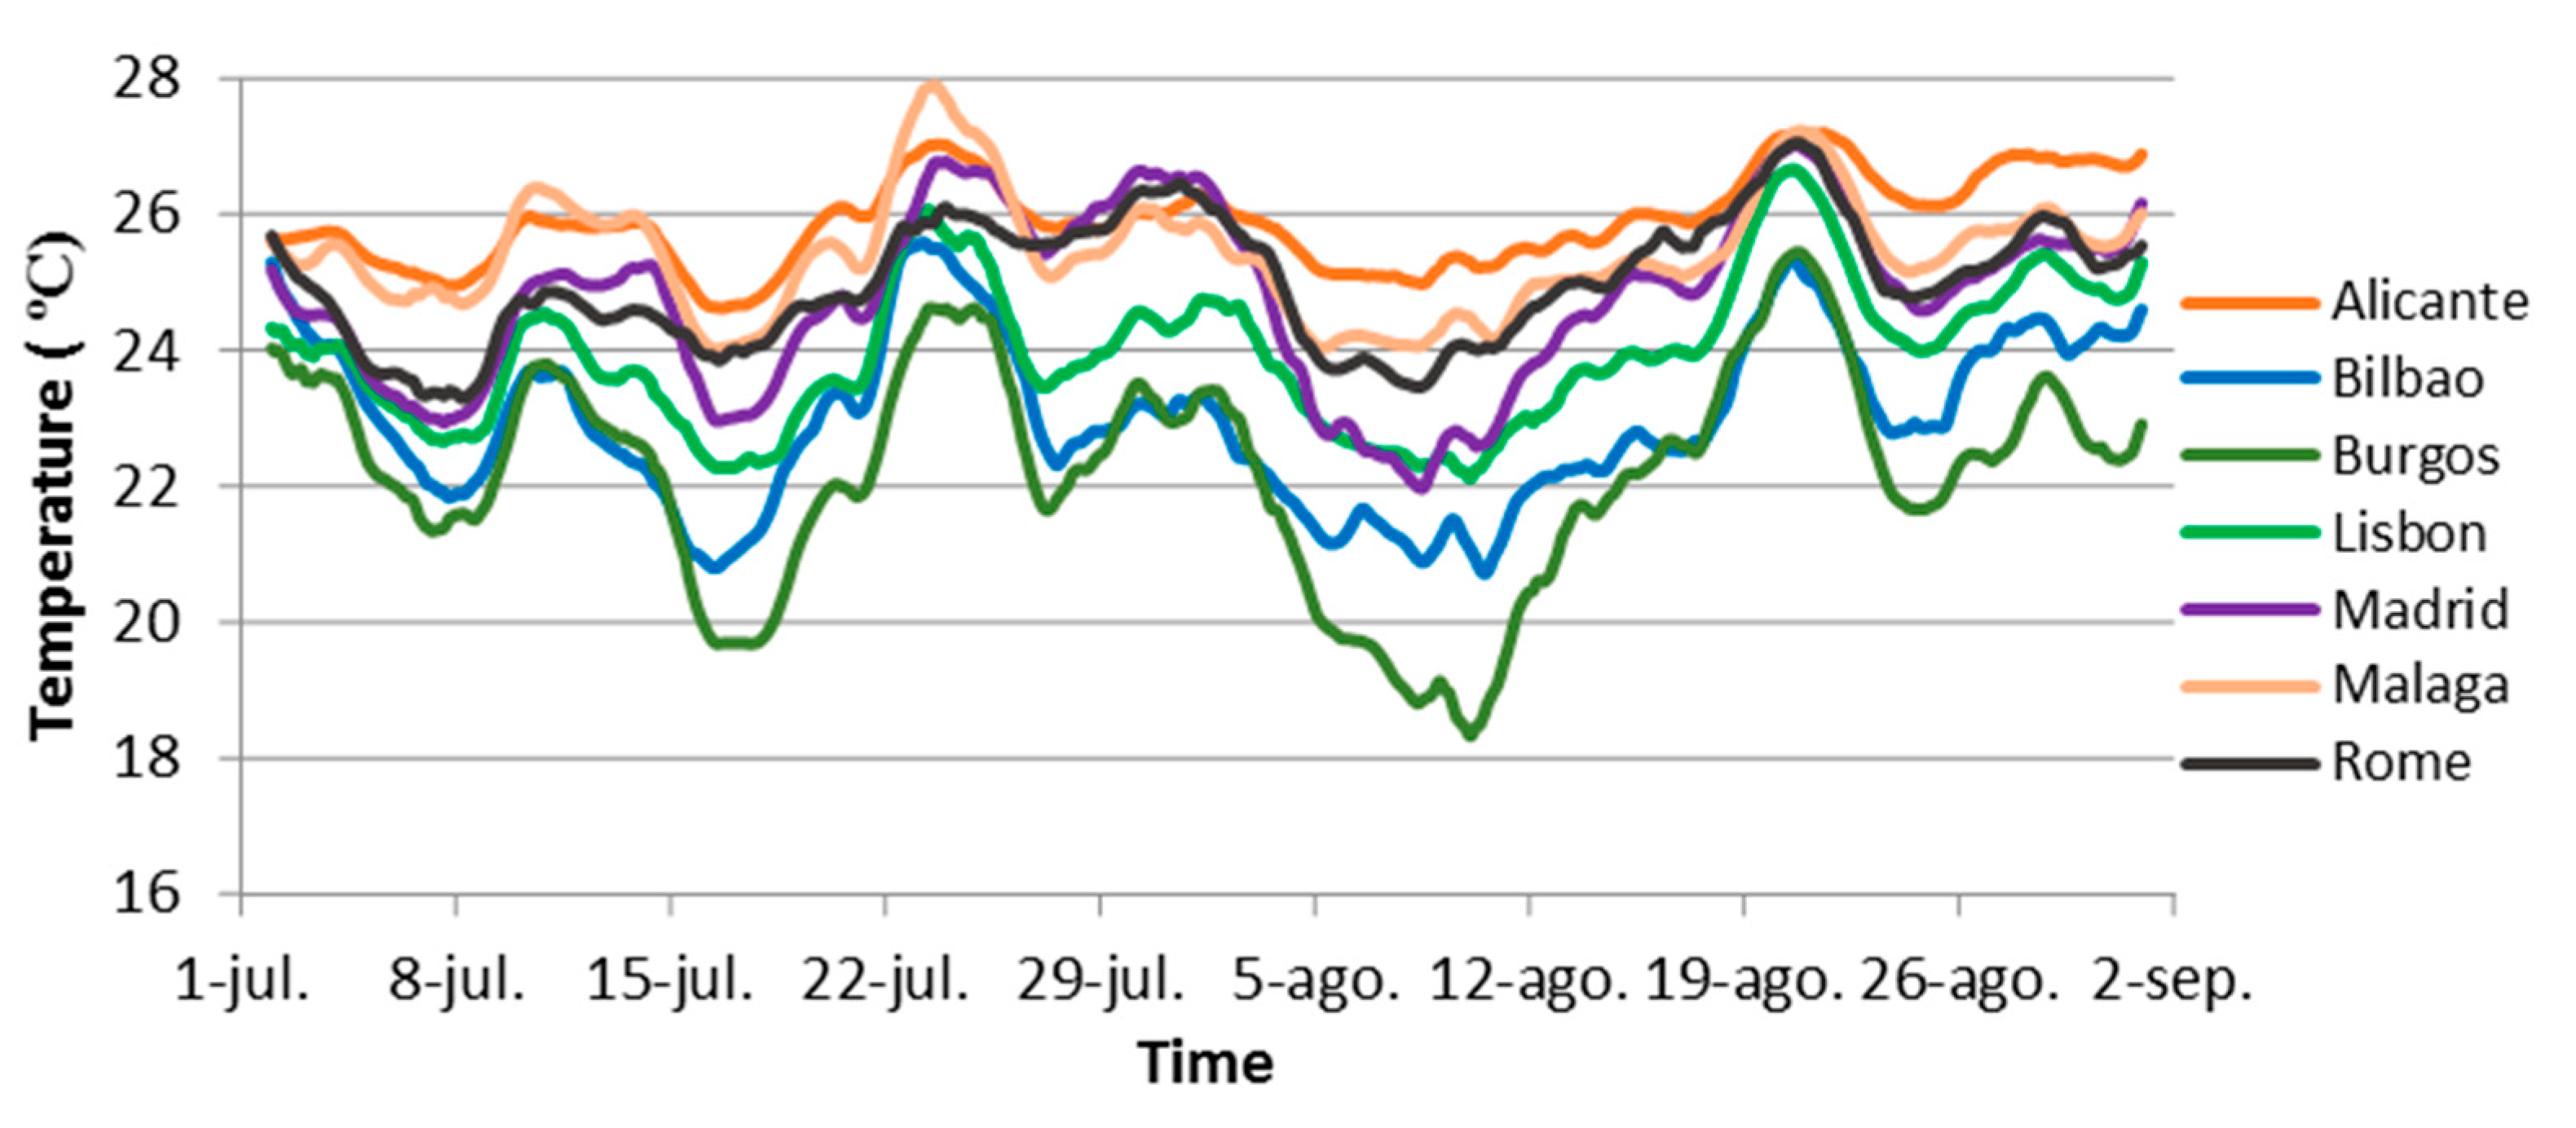
The highest ventilation flow corresponded to Alicante (hot climate with moderate humidity, TE > 25 °C, 40% < RH < 65%), which presented the highest horizontal solar radiation, with 523 W/m2, and a cooling energy provided by ventilation (Qv) of 412 kWh for the studied period. In the case of Madrid (hot and dry climate, TE > 25 °C, RH < 40%), the flow rate was slightly lower, but the system was capable of providing the highest ventilation cooling energy, up to 609 kWh. Burgos (cold climate with moderate humidity, TE < 21 °C, 40% < RH < 65%) presented the lowest airflow but on the other hand, a high Qv. The highest ratio of cooling energy per ventilated volume was found in Madrid and Burgos, with 0.79 and 0.78 Wh/m3, respectively. Alicante had the lowest value, with 0.53 Wh/m3; although it had the highest ventilation flow rate, the evaporative system presented the lowest performance. The maximum hourly cooling energy demand obtained in the experimental validation of the reference building was 2.78 kW. To cover this peak demand, a Toshiba air conditioner model RAS-13 with a nominal capacity of 3.1 kW and an indoor unit flow rate of 550 m3/h was selected to provide a cooling energy per air volume of 5.63 Wh/m3. This result could be compared with the maximum value of 0.79 Wh/m3 obtained for Madrid (TE > 25 °C, RH < 40%), which accounted for 14% of this value.
The cooling temperature potential (TCP) predicted the cooling capacity of the building with respect to outdoor temperature oscillations. Burgos had the lowest value of 2.98, slightly lower than Lisbon and Rome (temperate and wet climate, 21 °C < TE < 25 °C, RH > 65%). This indicated a higher indoor temperature oscillation (with high temperature drops) compared to the outdoor temperature oscillation. In the interpretation of this index, a low value implied oscillating indoor temperatures, while a high value implied more damped indoor temperatures.
The highest VCP value was obtained for Burgos (TE < 21 °C, 40% < RH < 65%), with 99% comfort hours, followed by Bilbao (TE < 21 °C, RH > 65%) and Lisbon (21 °C < TE < 25 °C, RH > 65%), with 98% and 94%, respectively.
Analysing these three indexes in all the proposed climates, Burgos was the location where the system had the highest performance, with a high CEP value of 0.79 Wh/m
3, a low TCP value of 2.98 and a VCP close to the unit. Lisbon had a low CEP, although a high indoor temperature oscillation was obtained, reaching a minimum of 20.7 °C, as a consequence of the low temperatures during the night and a high indoor comfort ratio. Alicante, however, had the lowest performance for all the evaluated indexes. In the case of Bilbao, the evaporative system presented a high comfort ratio, although the values of CEP and TCP did not indicate high performance of the system. This was due to the fact that the average daily outdoor temperature was low and therefore, the ventilation was able to provide a large number of hours of comfort, although the performance of the evaporative system was low. In the case of Burgos and Bilbao, it would be appropriate to consider a natural ventilation system alone. As can be seen in
Figure 4 above, Madrid had the highest outdoor temperatures and also a low TCP. The evaporative system had high performance, even though the comfort hours were limited in periods with high outdoor temperatures.
To analyse the effect that wind had on the total flow rate provided by the evaporative system, the cases of Burgos (U = 4 m/s, α = 5°) and Madrid (U = 2 m/s, α = 5°) were compared. The wind speed in Burgos was twice as high as in Madrid; however, the air flow supplied by the evaporative system was higher in Madrid (768,861 m
3 versus 658,588 m
3). This result was due to the lower humidity of the climate in Madrid (32.5%) compared to Burgos (53%), which resulted in a higher temperature difference. Hence, there was a stronger influence of the temperature and humidity of the local climate, with respect to the wind speed, on the flow provided by the PDEC system.
Table 5 provides a classification of each climate according to the indexes analysed for the following proposed parameters: outdoor temperature, performance, comfort and applicability.
The quality of the evaporative system to be applied in a specific climate (applicability) was determined by the qualitative evaluation of these parameters from the values of the indexes (CEP, TCP, VCP). The qualitative level of the parameter of outdoor temperature was established by the classification of the type of climate, as described in
Section 3.1, where a cold climate corresponded to a low parameter, and a temperate and a hot climate corresponded to a medium and a high parameter, respectively. Regarding the level of the performance parameter, it was set from the value of the CEP index: high for CEP > 0.7 Wh/m
3, medium for 0.5 < CEP < 0.7 Wh/m
3 and low for CEP < 0.5 Wh/m
3. High comfort would correspond to a CEP value close to 1 and low comfort to a value close to 0.5.
By analysing the proposed indexes together, it was possible to evaluate and make decisions on the incorporation of PDEC systems, combined with natural ventilation solutions, in the refrigeration of residential buildings. Although the VCP index predicted the hours that the evaporative system was capable of providing comfort, the analysis of the other two indexes gave additional information on the performance of the PDEC system in a specific climate and building.
The applicability defined above was classified according to the level of the parameters of outdoor temperature, performance and comfort. The more these parameters increased from low to high, the higher the applicability. The outdoor temperature parameter was the most decisive parameter for determining the level of applicability, as can be seen in
Table 5.
In the case of climate 1, the applicability was high because the outdoor temperature and performance parameter was high and the comfort parameter was medium. Climate 2, on the other hand, also had a medium outdoor temperature parameter, but the other two parameters were medium-low, which resulted in medium applicability. Climates 3 and 4 had a low outdoor temperature level; therefore, as discussed above, a ventilation strategy could be applied without the need for an evaporative system. Climate 5 presented medium parameters and hence, its applicability was medium.
5. Conclusions
The objective of this study was to evaluate the performance of an evaporative PDEC system, assisted by solar chimneys in five locations in Spain and two locations in Italy and Portugal, analysing three proposed indexes. A full-scale building energy model, developed in TRNSYS from the experimental models presented in [
20,
21], was used.
It was derived from [
20] that the combination of thermal and airflow models using EES and TRNSYS was suitable for predicting the ventilation flow rates and indoor temperatures generated by a PDEC system. In this simulation study, the influence of the building geometry on the airflow field was addressed, using the correlation of Equation (7) [
24].The locations analysed were classified into 5 different climate types. The simulated system produced specific results for the indoor conditions in each case.
The cooling energy potential (CEP) ranged between 0.53 Wh/m3 and 0.79 Wh/m3 for Alicante (climate 2) and Madrid (climate 1), respectively. The highest performance and applicability was obtained for Madrid (climate 1), where a value for the ventilation cooling potential (VCP) of 78% was obtained. Burgos (climate 3) and Bilbao (climate 4) presented VCP values of 99% and 98% respectively, although the applicability of the evaporative system was low. In both cases, due to the low outdoor temperature, a natural ventilation strategy, with intermittent supply of the evaporative system, would be appropriate. Malaga presented good results, with oscillating outdoor temperatures, damped indoor temperatures and a comfort ratio of 72%.
The study shows the importance of outdoor temperature and humidity conditions on the performance and applicability of evaporative systems beyond the ventilation flow rates provided by the system and the influence of wind. In addition, the flow rate provided by the cooling system was also influenced to a large extent by the flow rate extracted at the solar chimneys.
A PDEC system, assisted by solar chimneys, can provide interesting energy savings in fulfilment of the objectives set by the EU. The regulations do not establish a recommendation or obligation for the use of these systems in certain climates. The study undertaken presents certain criteria for evaluating an evaporative system in a specific climate in order to analyse its performance and applicability in the project phase.
An experimental study of the direct evaporative pad combined with the natural ventilation of the reference building could be studied in future projects.


