Article

A Method of Multi-Stage Reservoir Water Level Forecasting Systems: A Case Study of Techi Hydropower in Taiwan

1
Department of Electrical Engineering, National Taiwan Normal University, Taipei 106, Taiwan
2
Taiwan Power Company, Taipei 100, Taiwan
*
Author to whom correspondence should be addressed.
Energies 2021, 14(12), 3461; https://doi.org/10.3390/en14123461
Submission received: 7 April 2021 / Revised: 5 June 2021 / Accepted: 7 June 2021 / Published: 11 June 2021
(This article belongs to the Topic Exergy Analysis and Its Applications)

Abstract

:
Reservoirs in Taiwan often provide hydroelectric power, irrigation water, municipal water, and flood control for the whole year. Taiwan has the climatic characteristics of concentrated rainy seasons, instantaneous heavy rains due to typhoons and rainy seasons. In addition, steep rivers in mountainous areas flow fast and furiously. Under such circumstances, reservoirs have to face sudden heavy rainfall and surges in water levels within a short period of time, which often causes the water level to continue to rise to the full level even though hydroelectric units are operating at full capacity, and as reservoirs can only drain the flood water, this results in the waste of hydropower resources. In recent years, the impact of climate change has caused extreme weather events to occur more frequently, increasing the need for flood control, and the reservoir operation has faced severe challenges in order to fulfil its multipurpose requirements. Therefore, in order to avoid the waste of hydropower resources and improve the effectiveness of the reservoir operation, this paper proposes a real-time 48-h ahead water level forecasting system, based on fuzzy neural networks with multi-stage architecture. The proposed multi-stage architecture provides reservoir inflow estimation, 48-h ahead reservoir inflow forecasting, and 48-h ahead water level forecasting. The proposed method has been implemented at the Techi hydropower plant in Taiwan. Experimental results show that the proposed method can effectively increase energy efficiency and allow the reservoir water resources to be fully utilized. In addition, the proposed method can improve the effectiveness of the hydropower plant, especially when rain is heavy.

1. Introduction

Hydropower is a clean and non-exhaustive energy source, and it is relatively more stable than other renewable energies, such as solar and wind energy. As the operation of the hydroelectric units can start and stop instantly, it provides flexibility for operation. It can adjust the voltage and frequency of a power system with the instantaneous change of the load and has always played an essential role in ensuring the safety of power supply and maintaining the quality of power. At present, there are many studies on hydroelectric power generation and the integration of other renewable energy sources. The authors of [1] analysed the revenue evaluation of reservoirs in terms of water flow in the surrounding Amazon basin from an economic perspective, the authors of [2] discussed the benefits and drawbacks of reservoir-regulated water for livelihood farming from the perspective of irrigation and flood regulation, the authors of [3] discussed the subsequent impacts of power industry components and investment costs, and the authors of [4] designed a simulation system to evaluate the impact of future climate change on power system operations and regional dependencies, emphasizing the influence of the climate on hydropower. This study in [5] investigated how hydroelectricity under climate change affects the ability of the grid to integrate high wind and solar capacities, using California as an example. The impact of higher capacity green energy installations on the power system and the importance of increased hydro capacity are emphasized. In [6], the long-term ensemble rainfall forecast, and the one-week rainfall forecast were considered to assess the daily inflow forecast for the coming month and to plan the daily discharge to maintain the downstream livelihood water consumption during drought conditions. In [7], the physical model of flow prediction with a long prediction interval was proposed, which is not a suitable choice for Taiwan with its extreme weather with frequent typhoons. In [8], a decision system was developed to make decisions on the timing of electricity and water release by considering flow forecasting and energy prices. In [9], a hybrid support vector machine and an artificial neural networks approach for monthly incoming flow prediction was proposed. The authors of [10] proposed a model-based approach for assessing the impact of climate change on hydropower potential in the Nanliujiang River basin of China. The authors of [11] discussed the optimal scheduling of hydroelectric power generation, considering the status of renewable energy systems such as solar and wind energy. The authors of [12] systematically reviewed the drivers, benefits, and governance dynamics of transboundary dams. With the increasing global climate change, the phenomenon of extreme rainstorms and rapid rainfall in recent years has become more frequent. To efficiently generate electricity while taking into account flood prevention and water supply tasks at the same time is a significant challenge. Traditionally, the operators of hydroelectric power plants refer to their experience on the reservoir’s water level to decide the power generation operation. Considering the water demand of multiple goals and multiple conditions, if the reservoir water level forecast information for the next few coming days can be provided, it will significantly help the operators to manage the reservoir.
If the trend of reservoir inflow changes can be known in advance, it will greatly improve the optimization of power dispatch and reduce reservoir flood discharge. In general, there are two types of forecasting models for reservoir inflow: statistical models and mathematical models. Mathematical models require huge calculation costs and physical parameter data. The runoff model [13,14] needs to consider many parameters, such as evapotranspiration, infiltration, and soil storage, which has a good impact on the results. However, it is not easy to obtain this information for reservoirs that contain many watersheds upstream. On the other hand, the statistical approach is to find the correlation between a large amount of data and the output result, and it uses various statistical methods to find the best forecast result. For the statistical model’s training process, the calculation cost is relatively high. However, the actual operation does not require too much computation.
In recent years, the neural network of the statistical models has played an important role in system identification, mainly due to the progress in neural network development, which enables it to learn the relationship between data input and output without involving mathematical conversion functions to complete complex nonlinear mapping, association, data classification, knowledge processing. The study in [15] designed a method of adaptive fuzzy class neural controllers for nonlinear dynamical systems and demonstrated the usability of the method through simulation results. The study in [16] applied a fuzzy neural network to short-term rainfall prediction in Zhejiang, China, and showed that the fuzzy neural network can have good results in rainfall prediction. The study in [17] discussed the effect of training methods on hydropower prediction using neural networks and proposed many optimization suggestions in the overall training process of neural networks. The study in [18] proposed an adaptive fuzzy neural network system for weekly and monthly inflow prediction of the Guardialfiera dam in Italy. The study in [19] used a neural network for future inflow prediction, which illustrated the effectiveness of inflow prediction without the use of meteorological data. In [20,21], an artificial neural network model considering the historical time was applied to water level prediction and acceptable results were achieved. The study in [22] investigated which neural network architectures could be used to achieve better hydropower prediction. The study in [23] used artificial neural networks and multiple regression to predict rainfall in a watershed, the study in [24] used rainfall forecasting to forecast the cross-river inflow, and the authors of [25] used observations, weather forecasts and climate indices in stream flow forecasting. These methods have good results for inflow and rainfall forecasting, but they do not consider the actual power generation situation and the trend of hourly changes in the daily operation of the hydropower.
In rainfall forecasting, the addition of numerical meteorological forecasts has a significant benefit on the forecast’s accuracy. Regarding the numerical meteorological forecasts, grid-based ensemble forecasts are usually applied. There are so many applications and improvements for ensemble forecasts [26,27,28,29,30,31,32,33]. The study in [26] used the Fifth-Generation Penn State/NCAR Mesoscale Model (MM5) to simulate typhoon tracks. The study in [27] proposed the Weather Research and Forecasting (WRF) model to have a good grasp of the weather system in Taiwan, and analysed 20 years of historical data to compare the effectiveness of the WRF and MM5 models and to calibrate the forecasting model. The study in [28] proposed a quantitative precipitation forecasting technique to be applied to the rainfall forecasting system. In [29,30], a numerical dynamical model was applied to analyse the climate of Taiwan by considering the geomorphological and hydrological characteristics of the Techi Reservoir catchment area, and the spatial statistical theory of the kriging method [31,32] was used to downscale the numerical dynamical model grid rainfall forecast data to a specific area. A typhoon quantitative precipitation forecasting model was proposed in [33], and the average water withdrawal was defined based on the typhoon trajectory of the ensemble forecasting system to produce a quantitative rainfall forecast for the whole of Taiwan. In recent years, the development of the numerical dynamics model has expedited. The application of the WRF model has accelerated and gradually replaced the MM5 model [34,35]. Currently, MM5 is only used for numerical simulation and analysis in some studies. The design concept of the WRF model is to link academic research results with the need for real-time forecasting of data users. The WRF model can be used to simulate changes in the ideal atmosphere and the real atmosphere. The literatures have also pointed out that numerical forecasting is very helpful for rainfall forecasting [36].
With the improvement of rainfall forecasting accuracy and reliability, the inclusion of rainfall forecasting values in the inflow forecasting model will be of great help to forecasting accuracy, especially in Taiwan, where the weather changes dramatically in all seasons. Due to Taiwan’s island climate, rainfall mainly comes from the topographical rain in the southwest during the summer monsoon season, the northeast monsoon in winter, thunderstorms in summer, typhoon rain in summer and autumn, and frontal cyclone rain in spring and summer. Taiwan’s climate is mostly affected by the rainy season, and the water level of reservoirs often increases substantially during the rainy season. Because of the reasons, rainfall forecasts play an important role in the prediction of river flow. The effect of introducing climatic data on the prediction of river flow has been studied in [37,38]. In [37], Mann-Kendall nonparametric tests for streamflow analysis were used, and the authors of [38] experimentally demonstrated the feasibility of introducing meteorological forecasting grid point data for basin water flow prediction.
There are many studies in this area of hydropower forecasting. In [39], a long-term forecast system for average reservoir inflow with a time scale interval of 10 days was built, but this forecast interval may not be able to produce real-time forecast results for seasons with large rainfall variability, which may limit the short-term power dispatch. In [40], a rainfall runoff model was designed considering soil infiltration, and the results are suitable for application to the prediction of inflow volume. The study in [41] proposed a method to predict the downstream reservoir water level in real time using the upstream reservoir. The study in [42] analysed and compared the neural network for the one-hour ahead streamflow forecasting for the Lan-Yang river in Taiwan. The study in [43] designed a power generation prediction system for a small hydropower turbine and selected a non-gradient descent trade-off algorithm for the neural network training rule. In [44], a heuristic algorithm was used to train fuzzy neural networks to predict hydroelectricity. Currently, these algorithms have good results for rainfall and inflow forecasts. However, they do not consider the conditions of the local hydroelectric plants. Hydroelectric power plants are more concerned about future water level changes which are affected by the generation schedule of the plant, irrigation water, municipal water, flooding, etc. The development of a reservoir water level forecasting system that takes into account the plant conditions will help the operators of the plant to dispatch power and may even become the basis of a plant energy management system.
Techi reservoir in Taiwan provides hydroelectric power, irrigation water, municipal water, and flood control for the whole year. In recent years, the impact of climate change has caused flood control in extreme weather events more frequently. During the rainy season in May and June, or during typhoons from July to September, large amounts of rainfall can be achieved in a short period of time, and with Taiwan’s steep topography and fast flowing rivers, rainfall responds to water level quite quickly. If there is no reservoir water level forecasting system, when the water level starts to rise and the hydroelectric units are operating at full capacity, it will still not be able to cope with the large inflow, which can cause losses of several GWh. To cope with the management of reservoirs, this paper proposes a reservoir water level forecasting system using fuzzy neural networks for Techi Reservoir in Taiwan. The forecasting system is a 48-h ahead forecast system that considers the numerical characteristics of meteorological rainfall forecasts, analyses the correlation and delay between rainfall forecasts and rainfall observations on reservoir inflow in major upstream river basins, and considers the relationship between real-time flood discharge and power and water use in the plant area. The fuzzy neural networks are a three-stage architecture. The first stage generates the reservoir inflow estimation of Techi Reservoir, and the power to water ratio of the hydroelectric units and the flood discharge are considered to estimate the immediate inflow to the reservoir. The second stage predicts the 48-h ahead reservoir inflow, which considers the effect of observed and numerical predicted rainfall in the upper basin on future inflow and the current inflow estimation measurements to forecast the 48-h ahead inflow of Techi Reservoir. The third stage outputs the water level of Techi Reservoir.
The rest of the paper is structured as follows: Section 2 gives the background knowledge of Techi Reservoir in Taiwan. Section 3 describes the design of the reservoir water level forecasting system. Section 4 describes in detail the data analysis, experimental results, and discussions. Section 5 draws a final research summary.

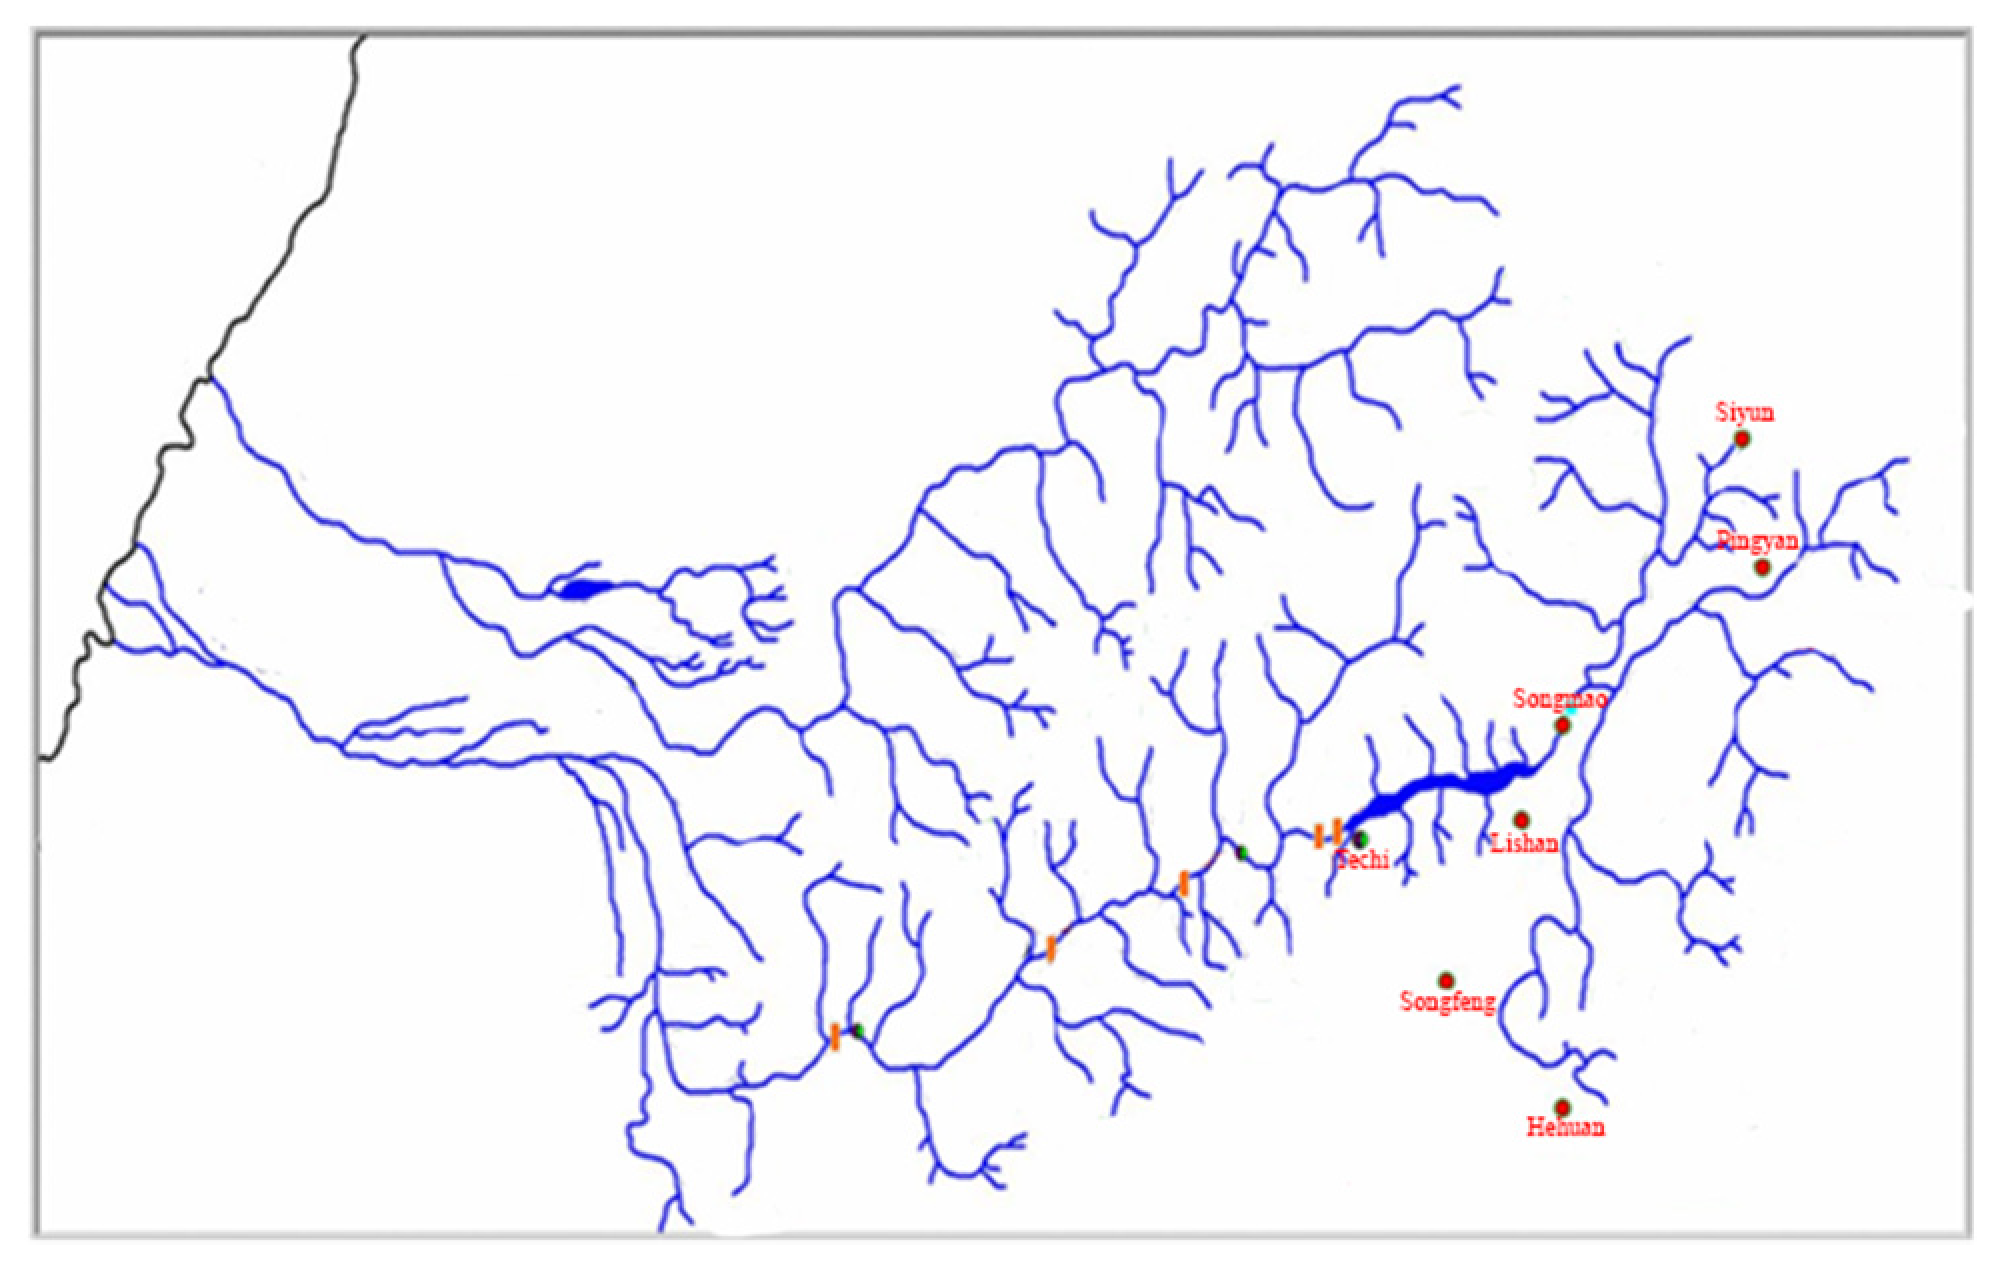
2. Techi Reservoir in Taiwan

Techi Reservoir originates in Heping District, Taichung City, Taiwan, and is located in the uppermost reservoir of the Dajia River. The Dajia River originates from the Central Mountain Range. It has a total length of 124.2 km from the source to the estuary. It has abundant rainfall and numerous upstream rivers. The drainage area is 1235.73 square kilometres. It is currently the river with the most abundant water resources in Taiwan. In addition, the middle and upper reaches of the riverbed are steep. The distance from below Techi Reservoir to Shigang is about 70 km, with a height drop of 1000 m above sea level. It is the river with the most favourable conditions for hydroelectric power generation. Taiwan is abundant in steep rivers, slopes, and water resources. The technical available hydro-energy resources of 30 major rivers are 5040 MW, and the electric energy is 20.15 billion kWh [45]. The conventional hydroelectric power plant completed in Taiwan at the end of 2020 has a total installed capacity of 2093.37MW and an annual power generation of approximately 3.02 billion kWh. The Techi branch of Dajiaxi Power Plant is located underground on the left bank of Techi Dam. It is 77 m long, 33 m high, and 17.5 m wide. The plant is equipped with a Francis turbine. There are 3 hydroelectric units with a design head of 143.1 m, a maximum water consumption of 72.5 cubic meters per second (CMS), a single unit capacity of 78,000 kW, and 3 hydroelectric units totalling 234,000 kW. It is the second largest hydroelectric power plant in Taiwan, with an average annual power generation of approximately 360 million kWh. The main structures of Techi Reservoir include dams, flooding structures, flood tunnels, waterways, an underground power plant and Zhilexi diversion tunnel. The dam was built in Techi Gorge, and it is a double curvature thin arch dam.
The inflow of Techi Reservoir is mainly affected by the rainfall in the upstream waters, and the location of rainfall observation stations in the relevant upstream watershed is shown in Figure 1. The rainfall of each upstream river will affect the inflow of Techi Reservoir by the topography of the upstream river and the distance between the river and the reservoir. Among them, because of the flow rate of the river, there will be a time delay for the upstream rainfall to affect the reservoir inflow.
The inflow of Techi Reservoir is mainly from the Dajiaxi River, considering that the rainfall in the Dajiaxi drainage basin between April and September accounts for about 80% of the annual rainfall, and the dry seasons between October and March of the following year accounts for about 20%. There are seven rainfall observation stations in Techi Reservoir and its upstream catchment area. The seven rainfall stations are located at Techi Reservoir, Siyuan, Pingyan, Songmao, Lishan, Songfeng and Hehuan. This paper uses the seven rainfall stations, their meteorological forecast data, and the water level of Techi Reservoir to develop the 48-h ahead water level forecast system.

3. The Design of Reservoir Water Level Forecasting System

This section discusses the architecture of fuzzy neural networks and the 48-h ahead reservoir water level forecasting system.

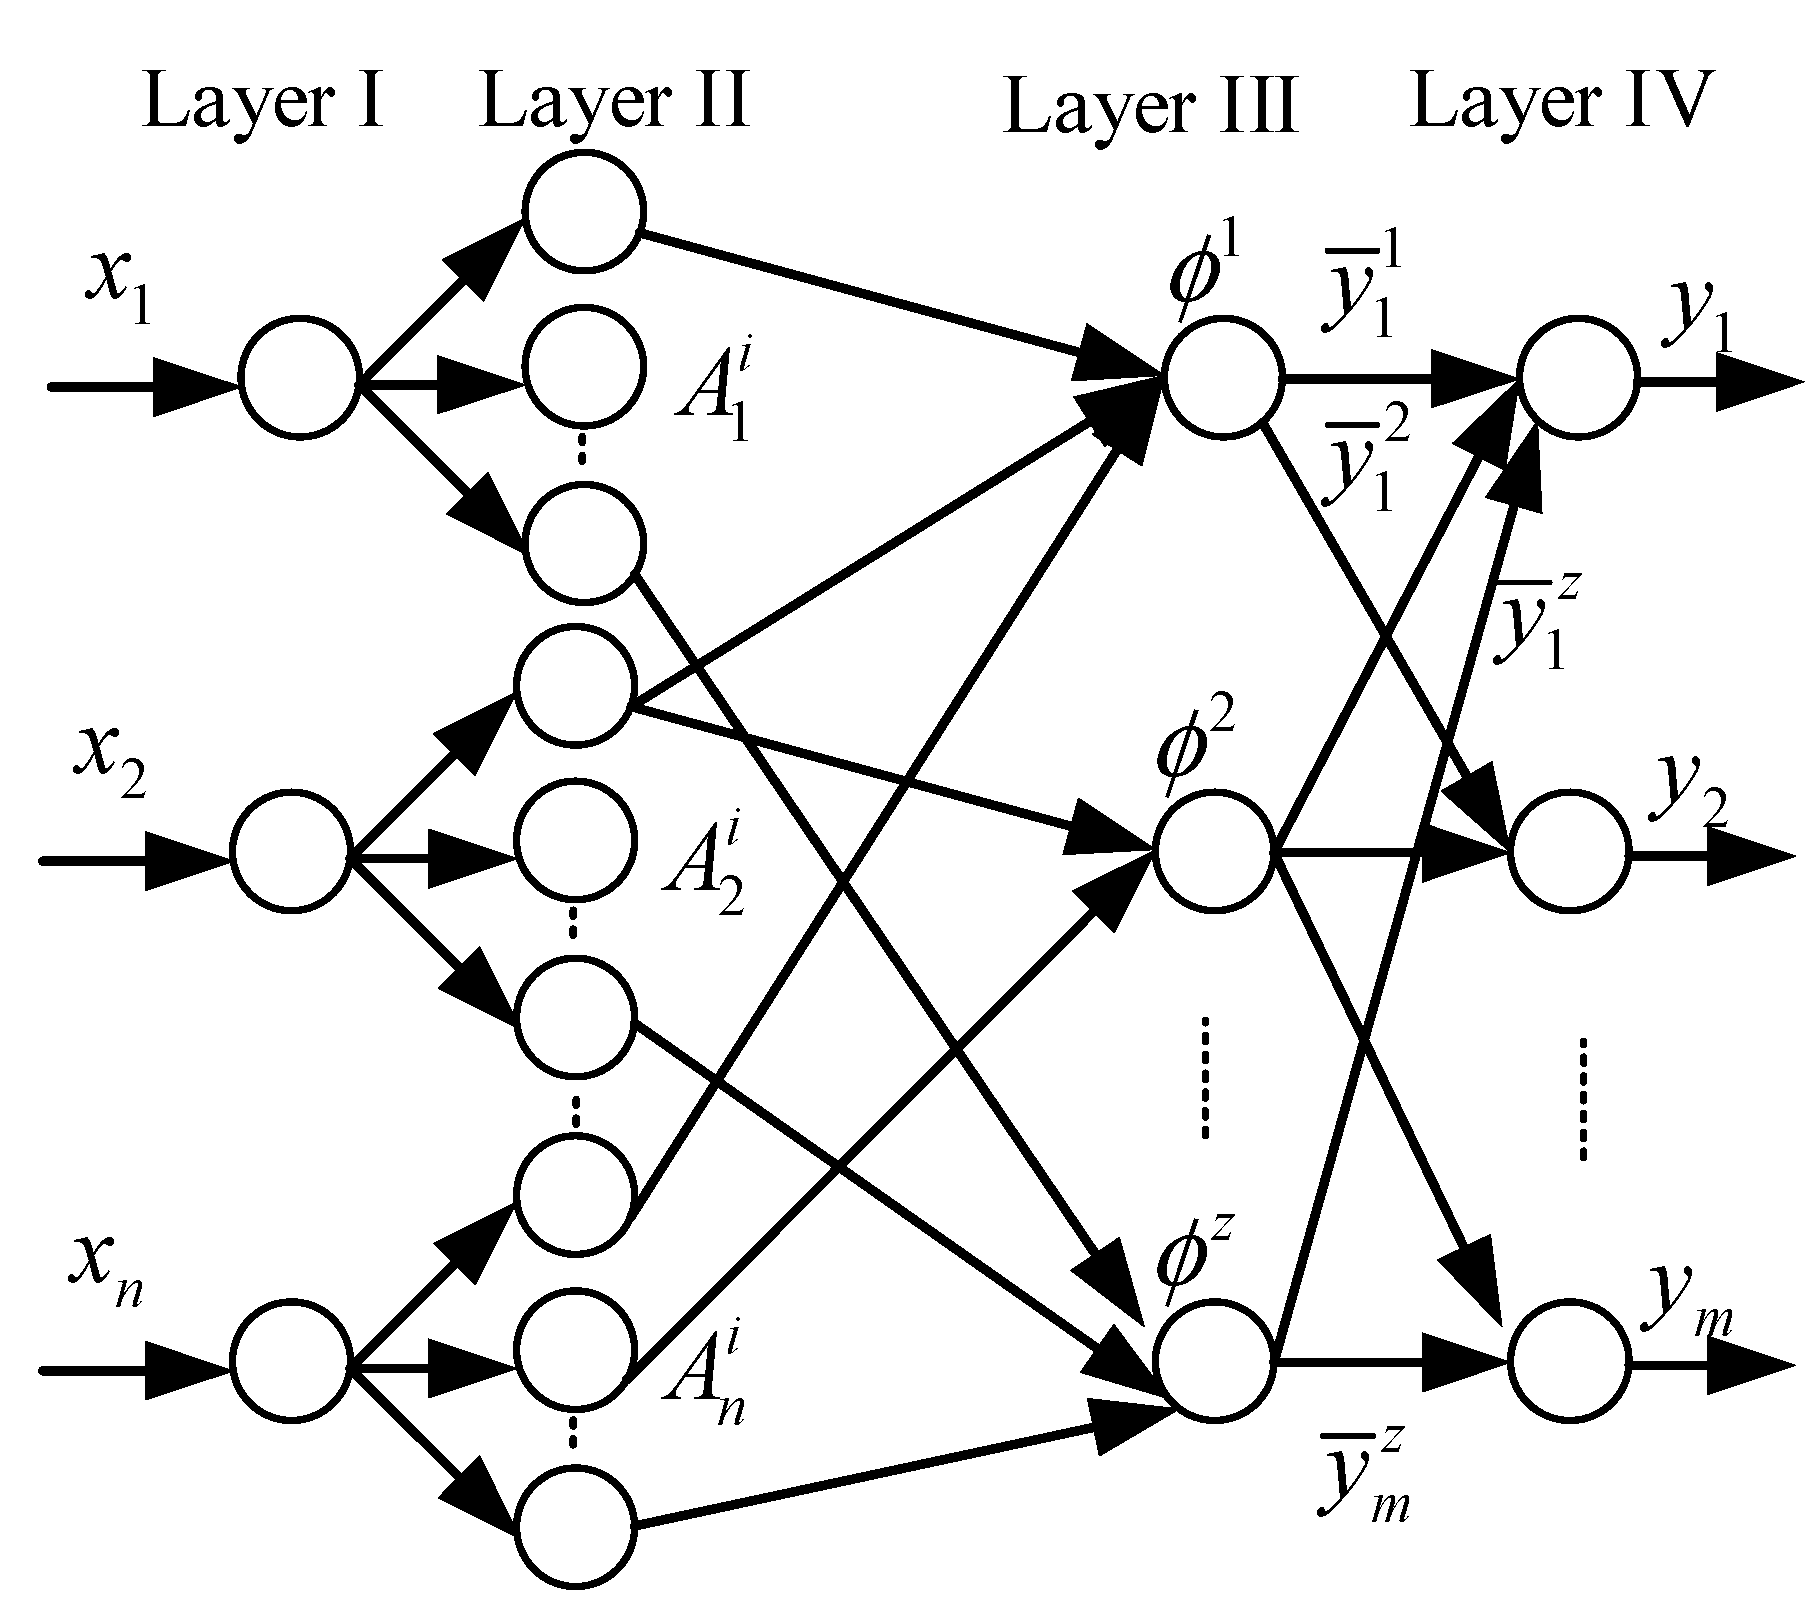
3.1. The Architecture of Fuzzy Neural Networks

In recent years, artificial neural network (ANN) has been very important in the field of system identification in intelligent forecast models. Artificial neural networks have excellent learning ability and it is easy to find the relationship between system input and output to build a model of the actual system, such as physical dynamic systems, nonlinear systems, and data-driven systems. ANN also has parallel computing capabilities to provide fast computing functions, and it is easy to complete multiple model predictions in real time. ANN is a mathematical model that imitates the structure of the brain neuron. ANN uses a set of massive data to obtain the relationship between input and output data. In the learning process, we don’t need to provide the corresponding mathematical functions. This feature is suitable for application in forecasting systems with variable inputs of different properties.
In scientific research, fuzzy theory provides a logical system to deal with the process of human logic inference and can be used to design intelligent systems to analyse semantics or analyse descriptive language. The fuzzy architecture consists of fuzzification, fuzzy logic rules, inference mechanism, and defuzzification. The applications of fuzzy logic systems include control systems, graphics recognition, voice recognition, diagnostic programs, time series forecasting, intelligent robots, decision-making systems, and other fields.
With the fuzzy neural network architecture [15,46,47], which is a neural network with fuzzy architecture, it is easy to model the input and output relationship of the real systems to establish the model characteristics of the actual system, and it also has the characteristics of easy integration of expert knowledge (fuzzy theory) and increases learning efficiency. The study in [46] proposed an observer-based direct adaptive fuzzy neural control scheme for nonlinear systems in the presence of unknown nonlinear structures. In [47], many architectures and examples of fuzzy neural networks were introduced. The configuration of fuzzy logic systems is comprised of a fuzzifier, some fuzzy IF-THEN rules, a fuzzy inference engine, and a defuzzifier [15]. The fuzzifier converts a crisp input to a fuzzy value, and defuzzification converts a fuzzy set to a crisp value. The fuzzy inference engine combines the fuzzy IF-THEN rules to make a map from an input linguistic vector to an output linguistic vector. The i th fuzzy IF-THEN rule can be written as:
R i : if   x 1   is   A 1 i   and   . . .   and   x n   is   A n i   ,   then   y 1   is   B 1 i   and   . . .   and   y m   is   B m i
where A 1 i , A 2 i , , A n i and B 1 i , B 2 i , , B m i are fuzzy sets, x T = x 1 x 2 x n n is an input vector, and y T = y 1 y 2 y m m is an output vector. Let z be the number of the fuzzy IF-THEN rules. By using product inference, centre-average, and singleton fuzzifier, the k th output of the fuzzy logic system can be expressed as:
y k x = i = 1 z y ¯ k i j = 1 n μ A j i x j i = 1 z j = 1 n μ A j i x j
= θ k T φ x
where μ A j i ( x j ) is the membership function value of the fuzzy variable x j , and y ¯ k i is the point at which μ B i y ¯ k i = 1 . θ k T = y ¯ k 1 y ¯ k 2 y ¯ k z is a weighting vector, and φ T = φ 1 φ 2 φ z is a fuzzy basis vector, where φ i is defined as:
φ i x = j = 1 n μ A j i x j i = 1 z j = 1 n μ A j i x j
The fuzzy logic system (3) can be implemented using neural network. Figure 2 shows the configuration of the fuzzy neural network [15], and it has four layers. The nodes of layer I stand for input vector x T = x 1 x 2 x n , the nodes of layer II represent the values of the membership function of total linguistic variables, and the nodes of layer III are the values of the fuzzy basis vector φ . The links between layer III and layer IV are fully connected by the weighting factors θ k T = y ¯ k 1 y ¯ k 2 y ¯ k z . The nodes of layer IV is the output vector y T = y 1 y 2 y m .
Therefore, this paper uses fuzzy neural network architecture to integrate meteorological rainfall data, rainfall observation data, water level and power generation to forecast reservoir inflow and water level, where the membership functions are selected as gauss functions.

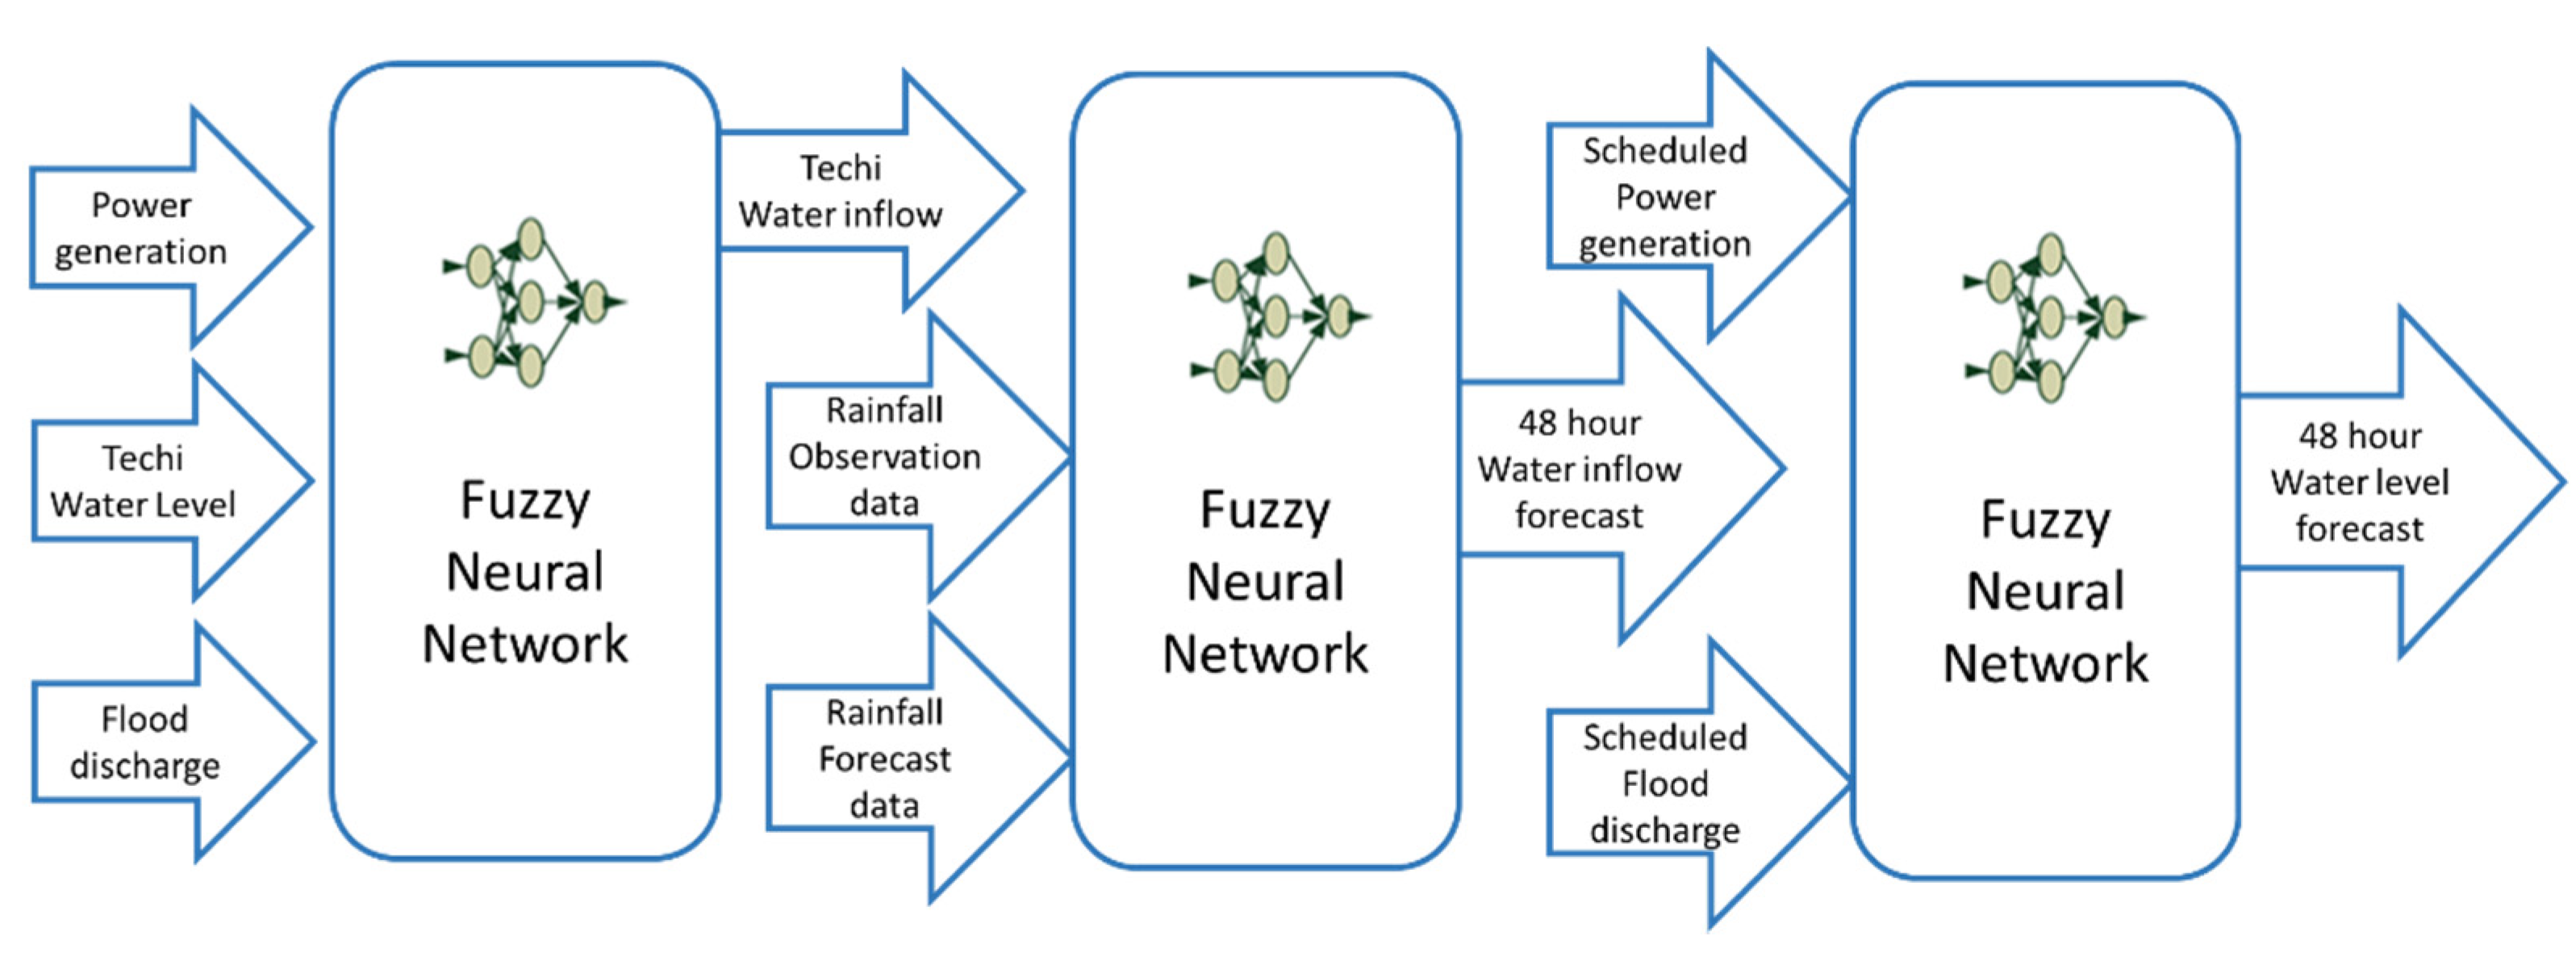
3.2. The 48-h Ahead Reservoir Water Level Forecasting System

In general, the traditional forecasting mechanism often only uses historical data to predict the future value. For example, using the historical data of water level, rainfall observation station, power generation and flood discharge predicts the water level change of Techi Reservoir in the next 1 to 48 h. However, its prediction accuracy will deteriorate as the forecast lead time becomes longer. If the meteorological rainfall data can be effectively integrated, the accuracy of the long lead time forecast will be improved. Moreover, too many feature inputs for a neural network increase the model complexity and learning difficulty. Therefore, this paper proposes a forecasting mechanism with three-stage fuzzy neural networks, as shown in Figure 3, to predict the water level of the reservoir. The fuzzy neural networks of the forecasting mechanism are a three-stage architecture. Among them, the first stage generates the reservoir inflow estimation of the reservoir by using real-time water level value, power generation of hydroelectric units and reservoir flood discharge as inputs. The purpose of the first stage is to find out the effect of actual plant operation on the reservoir inflow, which is important information for the establishment of the inflow observation and prediction system. The current water level and the power to water ratio curve can be used to find out the effect of the current power generation on the inflow rate. The current power generation, water level and flood discharge can derive the current reservoir inflow. On the basis of the reservoir inflow, observation rainfall data and meteorological rainfall data, the second stage predicts the 48-h ahead reservoir inflow. Finally, the third stage uses the total power generation, flood discharge and inflow forecast value to output the 1 to 48 h forecasting results of the reservoir water level. For Techi Reservoir, the input of the second stage neural network includes the inflow data of the past 9 h, the observation rainfall data of 7 rainfall observation stations in the past 6 h, and the meteorological rainfall data of 7 rainfall stations in the next 3 h. These inputs take into account the delay of rainfall from the Techi watershed to the reservoir.

4. Analysis, Results and Discussions

In this section, we first discuss the correlation between 7 rainfall observation stations and the water level of the Techi Reservoir. Secondly, the relationship between water level and reservoir inflow will be presented. The correlation between reservoir water level and meteorological rainfall data from the Taiwan Typhoon and Flood Research Institute (TTFRI) will also be analysed. Finally, the typhoons between 2013 and 2014 are used as cases to show the forecast results of the proposed method in this paper.

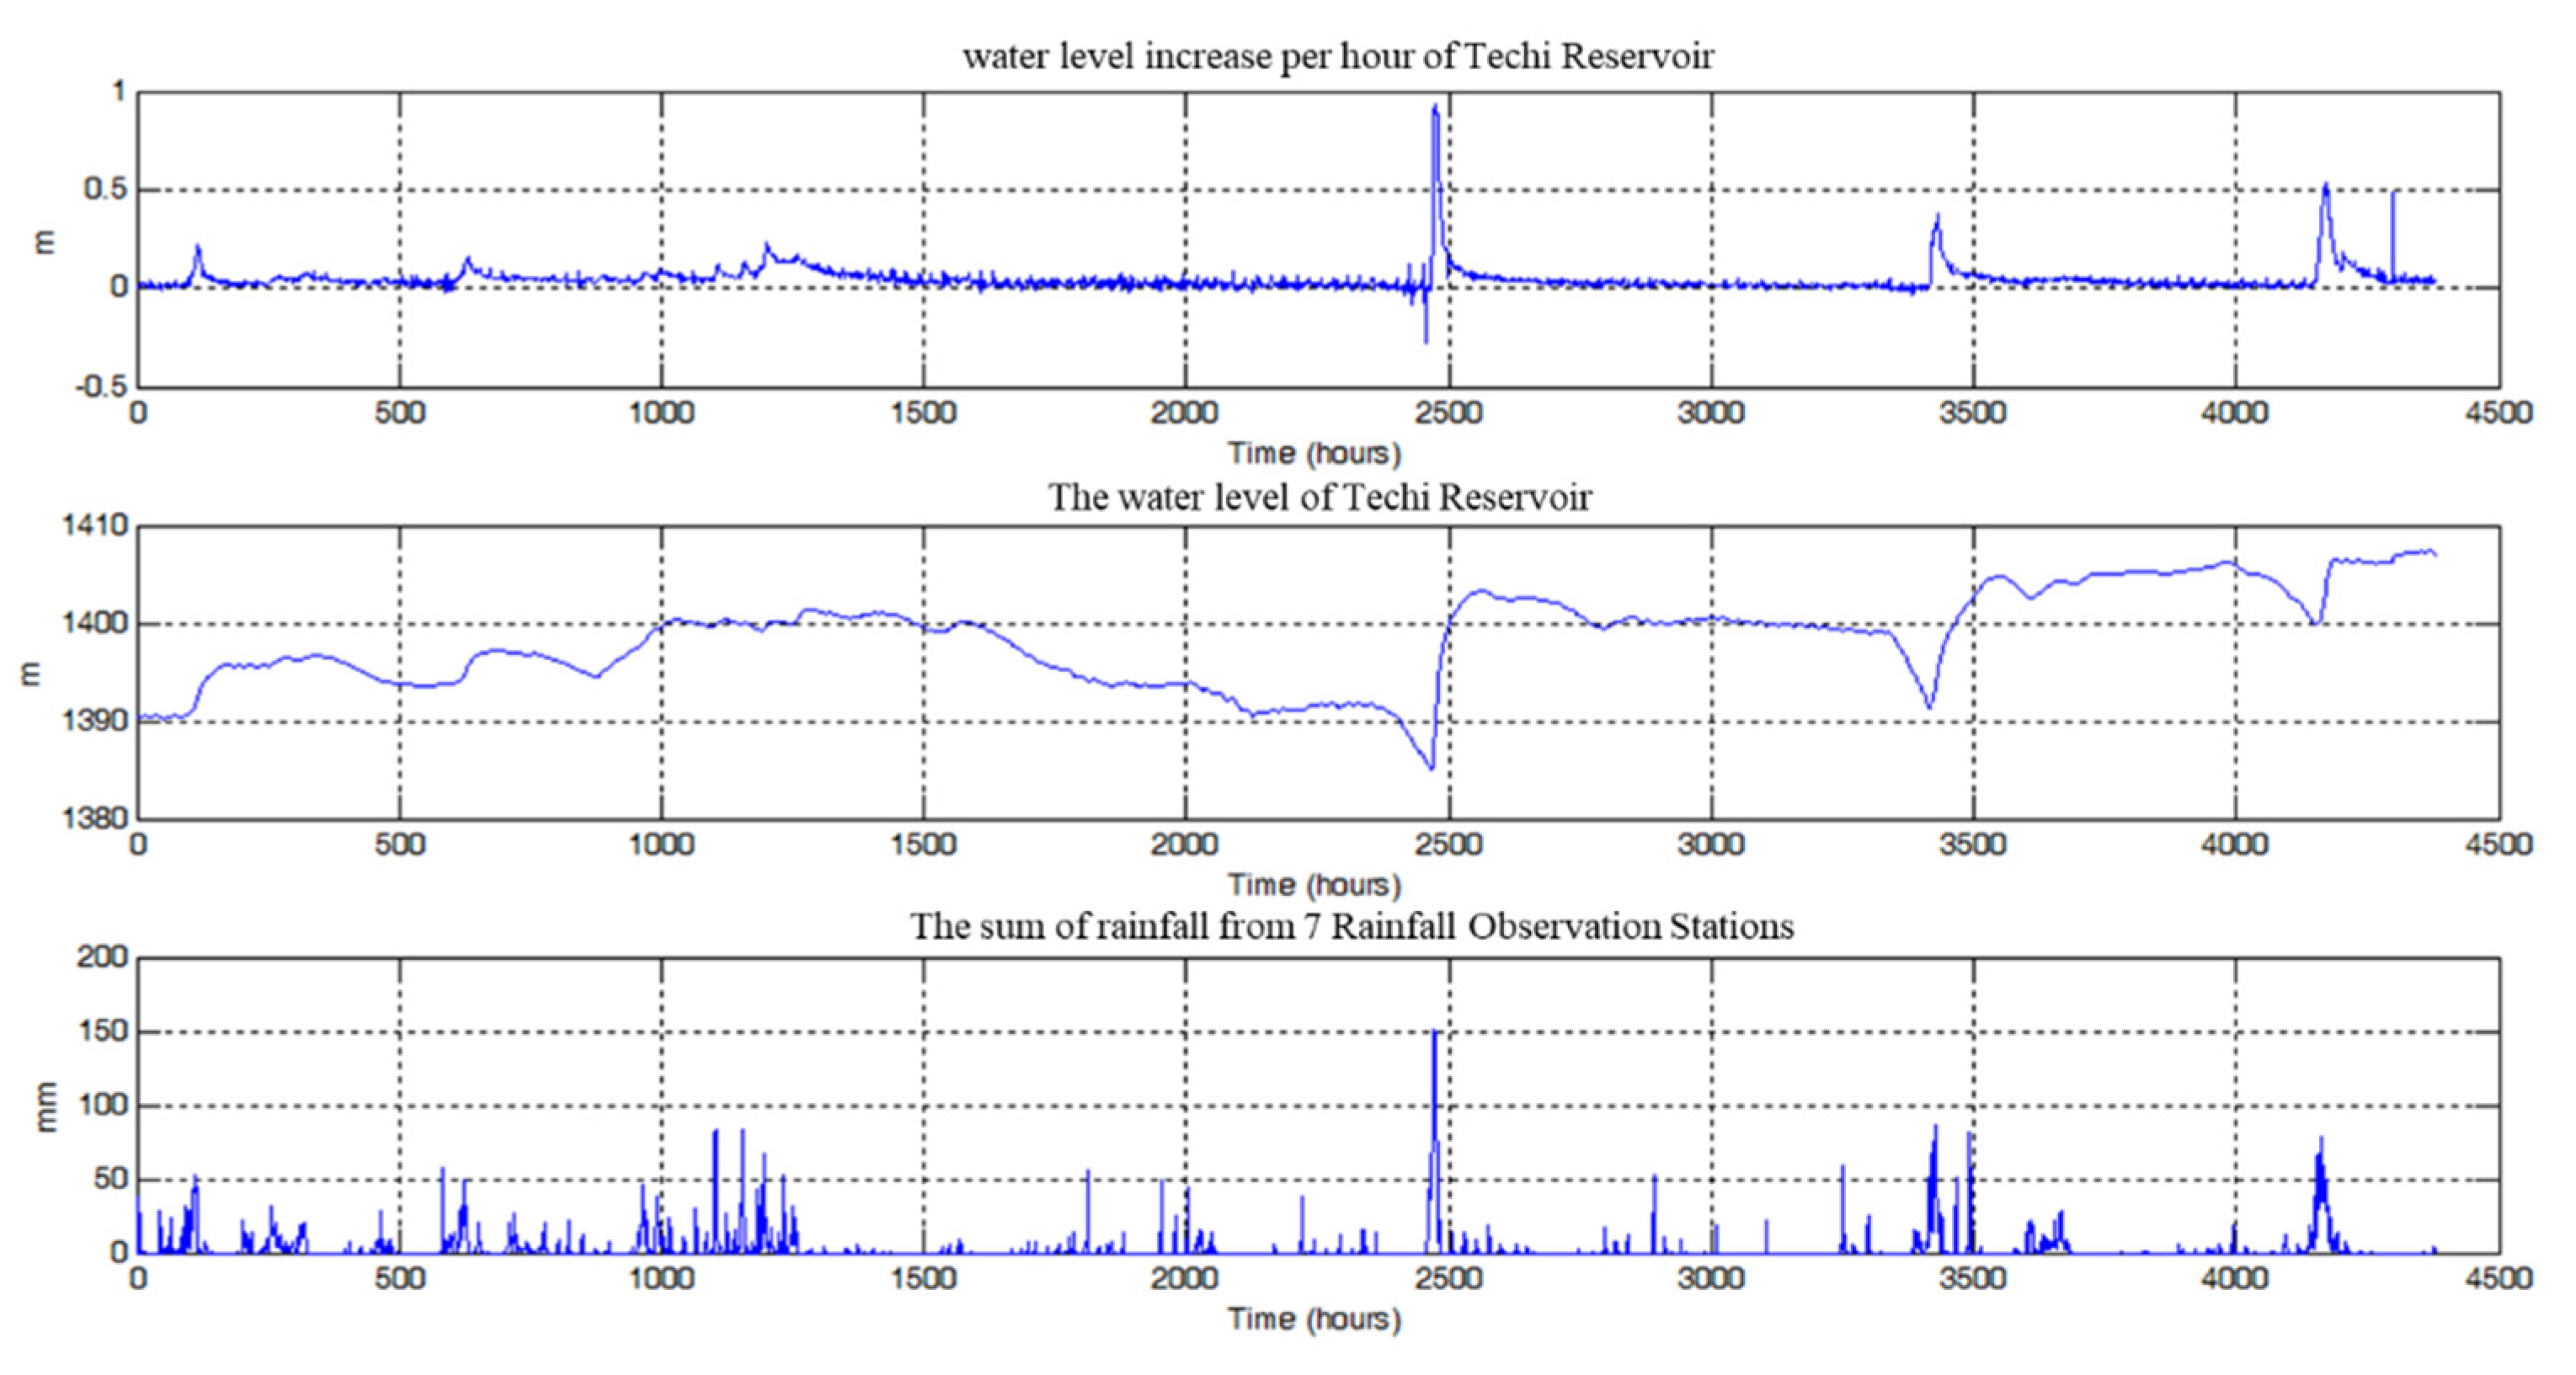
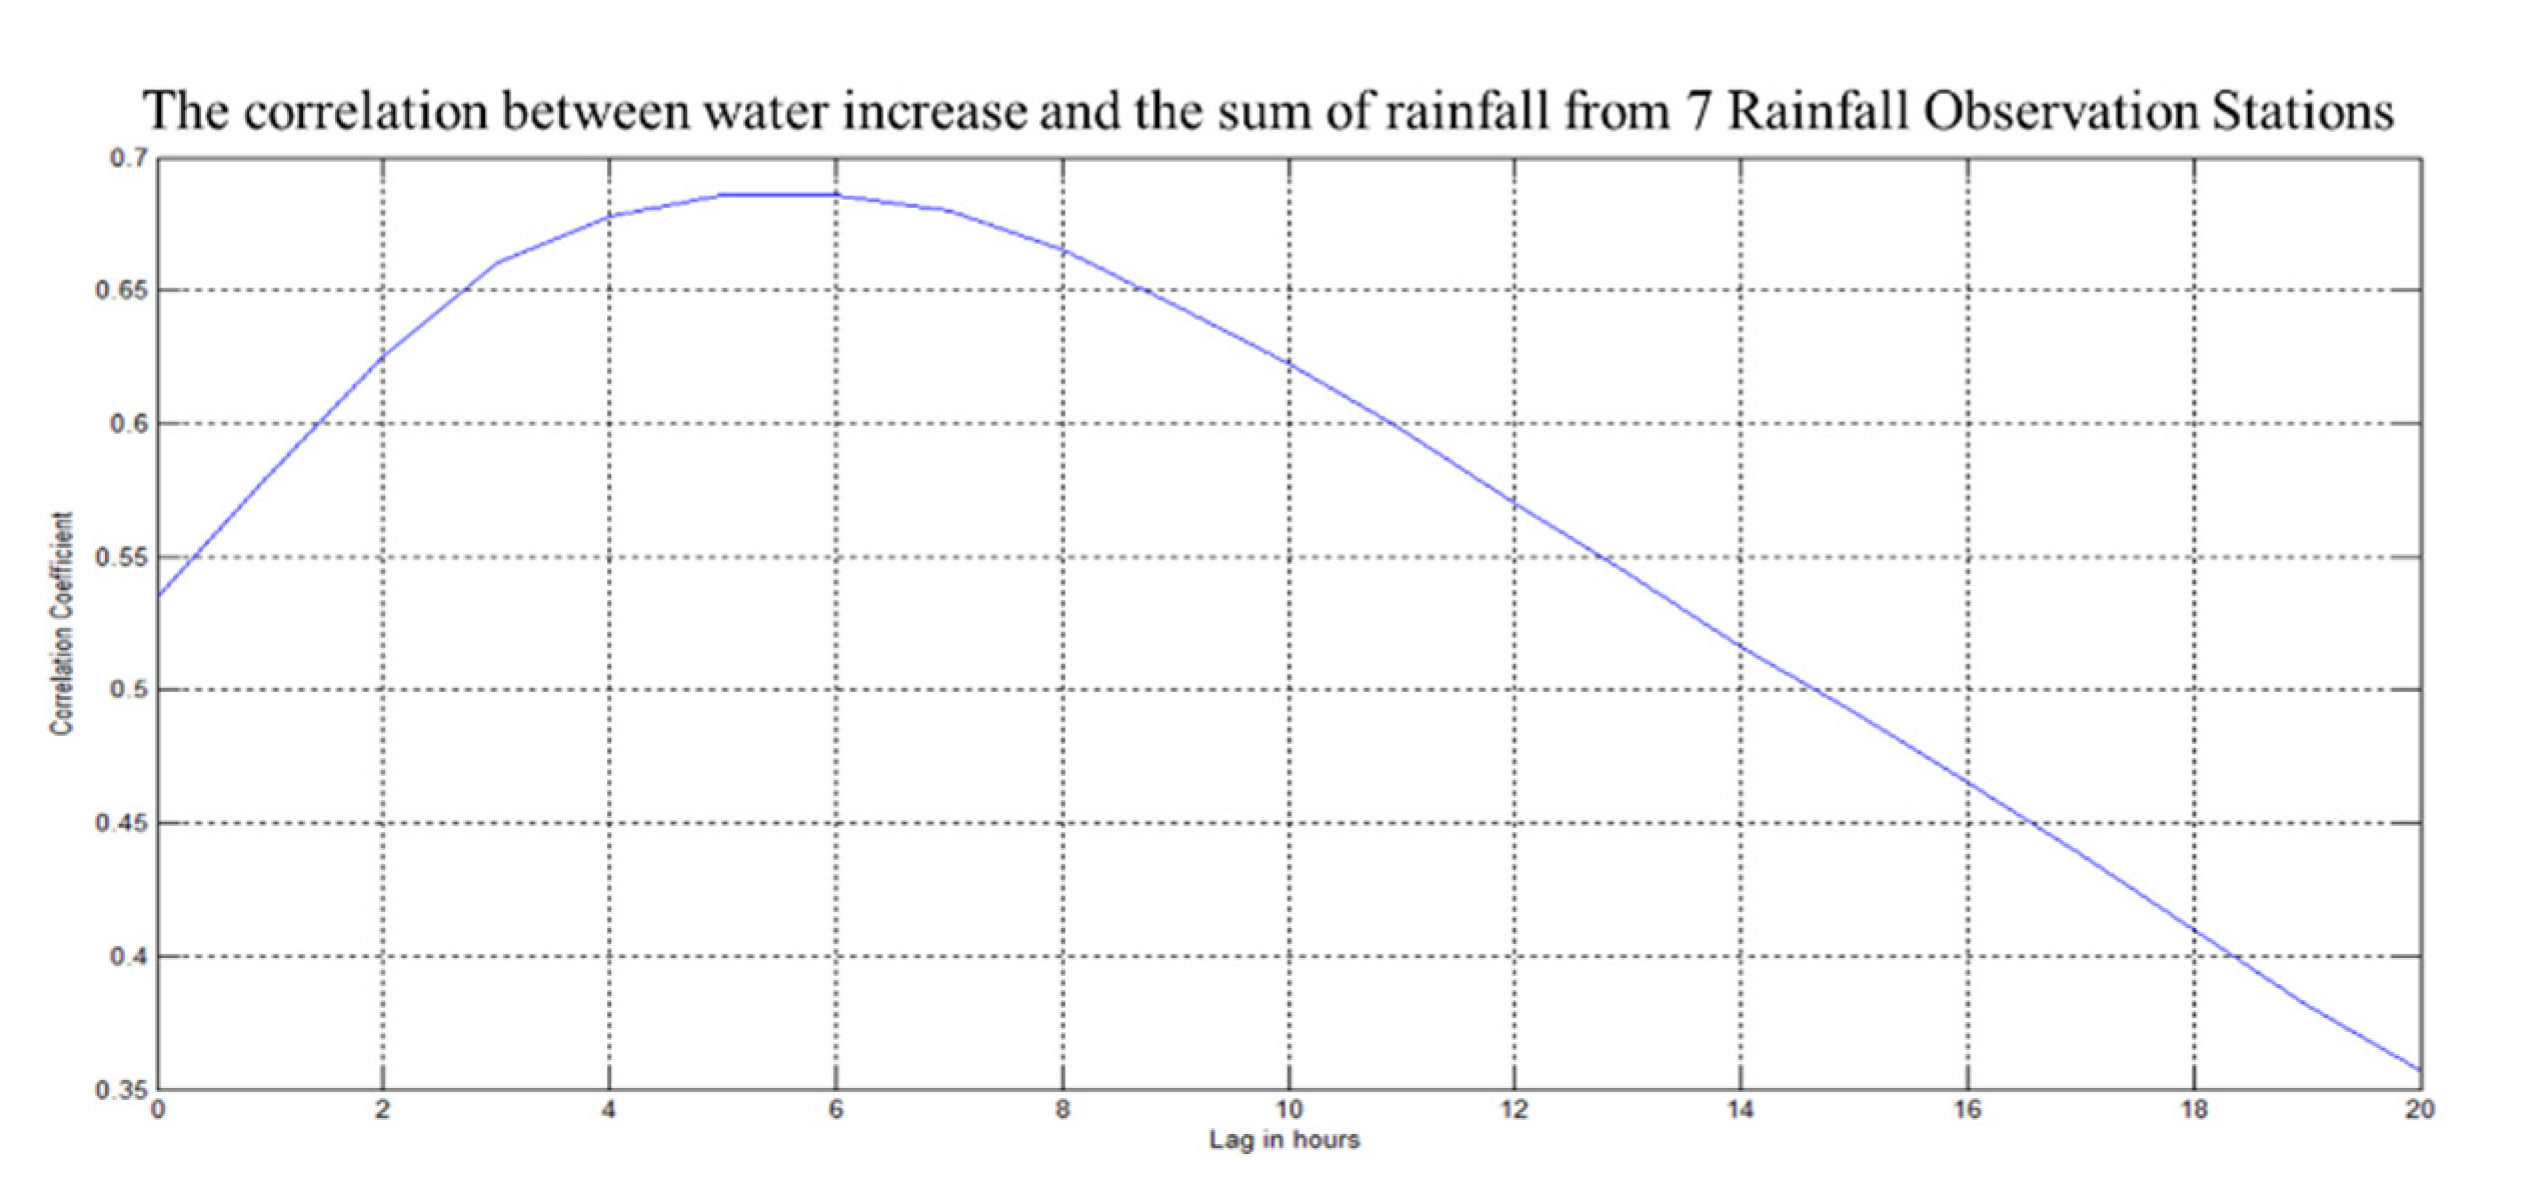
4.1. The Relationship between Water Level, Inflow and Rainfall of Techi Reservoir

In order to find out the time delay between rainfall observation stations in the catchment area and the water level of Techi Reservoir, Pearson product-moment correlation is used and shown in (5)–(6).
S x y = x i x ¯ y i y ¯ n 1
r x y = s x y s x s y = x i x ¯ y i y ¯ x i x ¯ 2 y i y ¯ 2
where S x y is the covariance of the two inputs, r x y is the correlation coefficient of the two inputs. From April to September in 2013, the total of 7 rainfall observation stations and the water level observation of Techi Reservoir are shown in Figure 4. According to Pearson product–moment correlation, the correlation between the water level and the total of 7 rainfall observation stations at different delay times can be obtained as shown in Figure 5. In Figure 5, it is shown that the time delay with the highest correlation is 6 h. In other words, when rainfall occurs, it takes about six hours for the total of the rainfall observation stations to affect the inflow of Techi Reservoir.

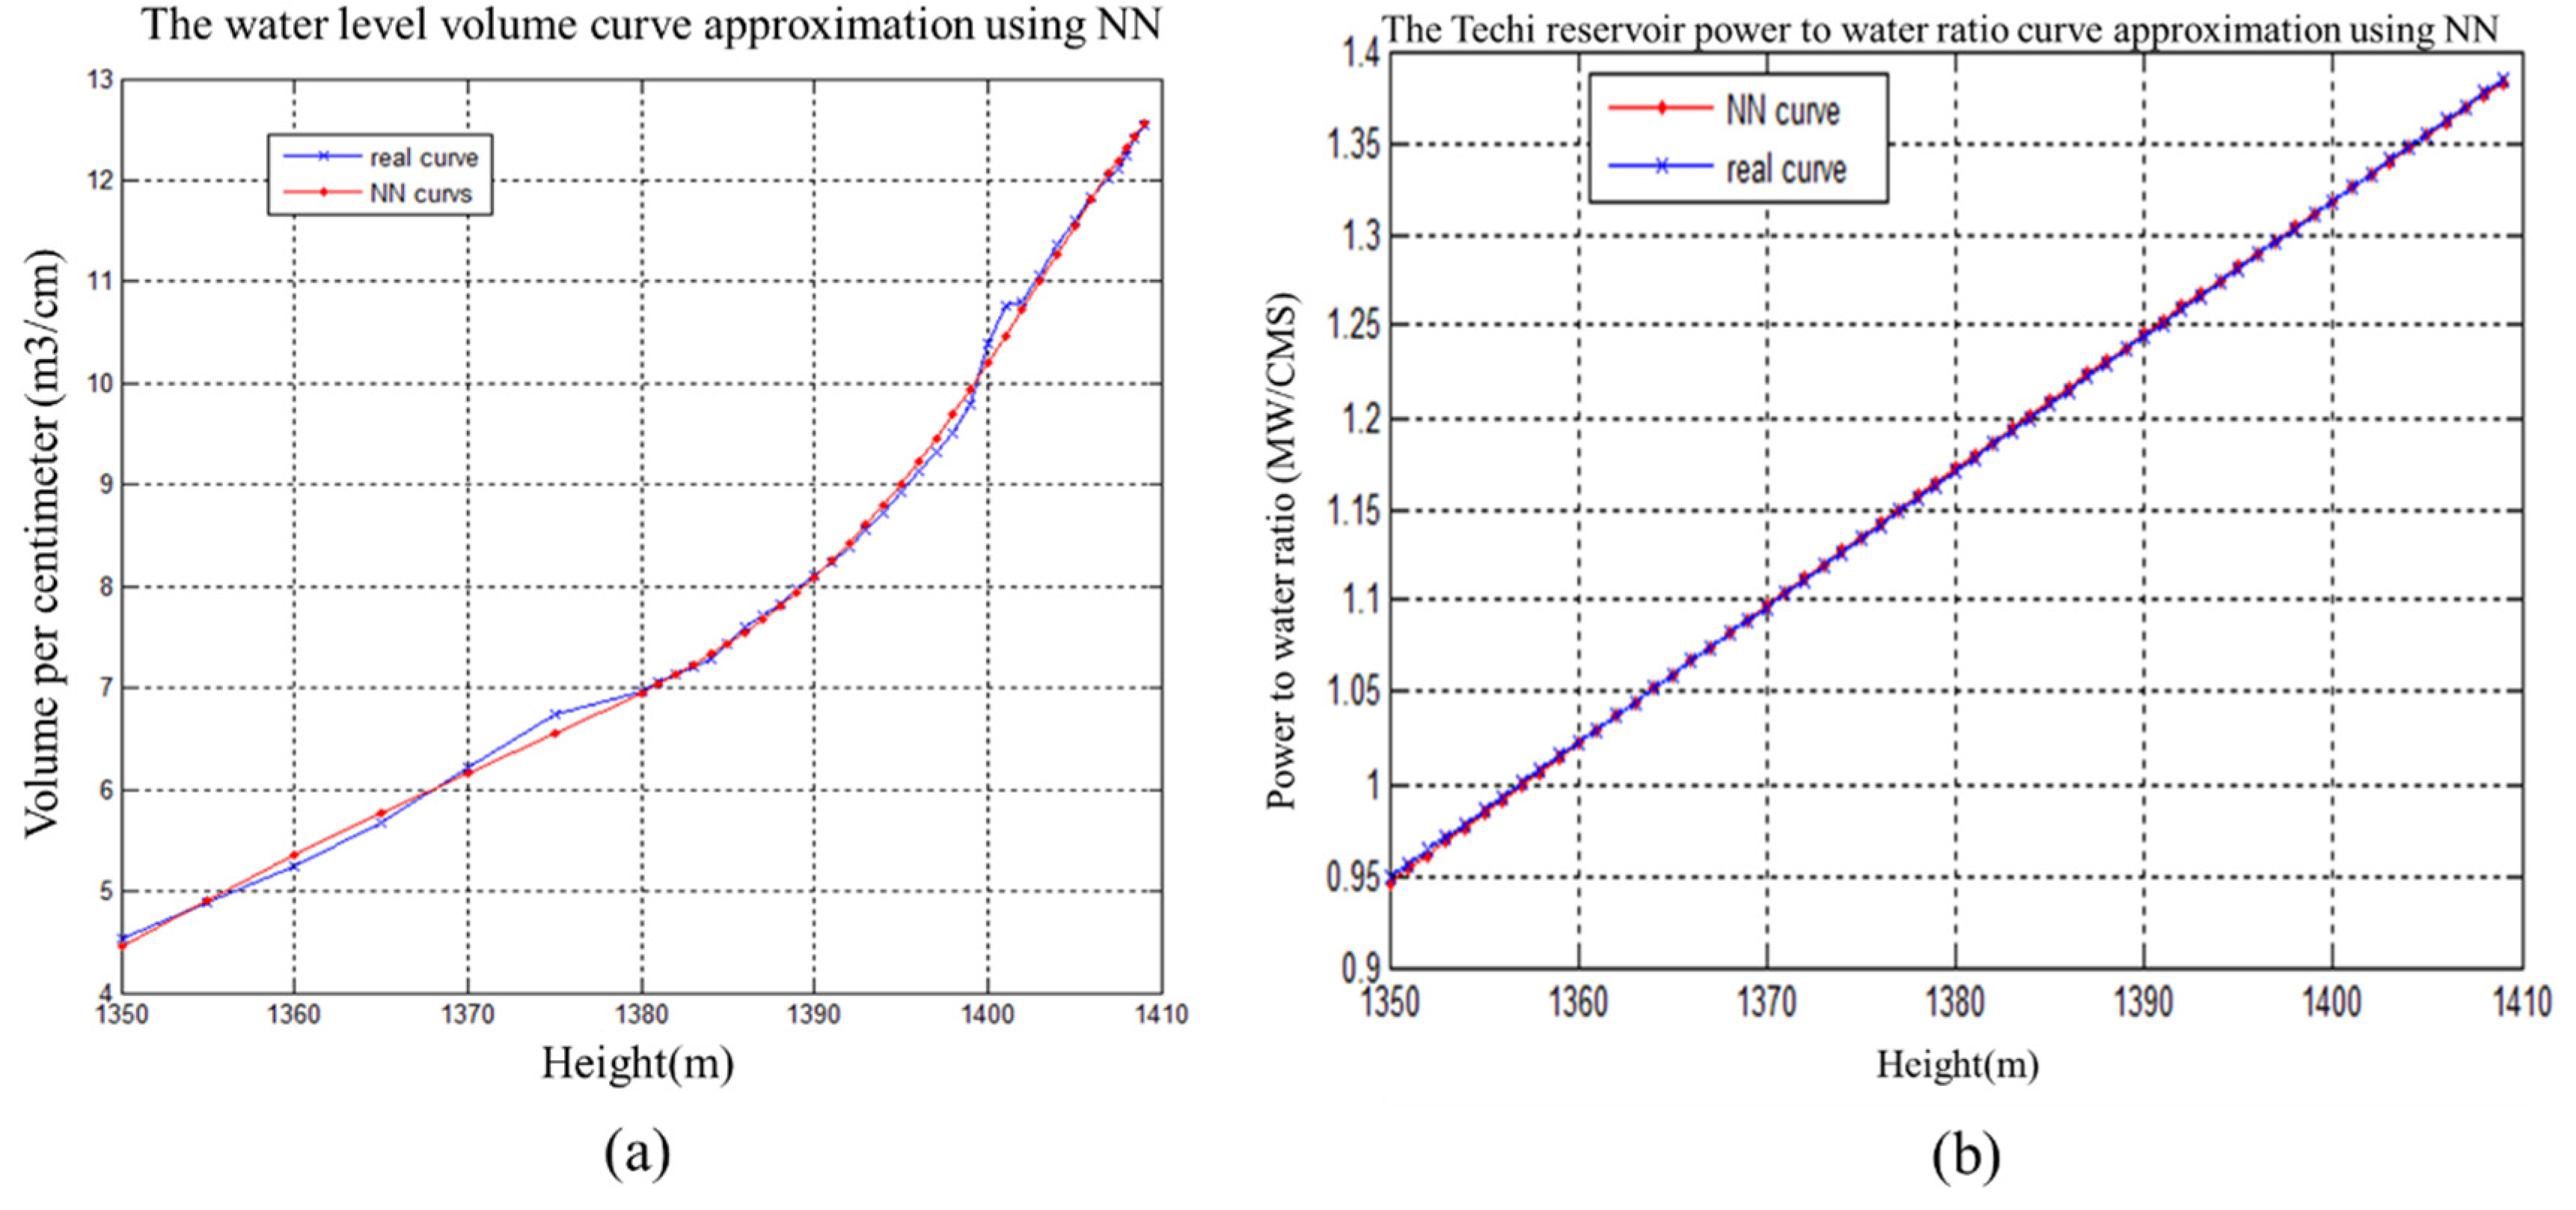
4.2. Design of Neural Network of Water Level and Reservoir Inflow

The influencing factors of water level changes have been introduced in the previous section. Among them, the curves of water level volume and power to water ratio can be trained through neural networks, and the approximation results are shown in Figure 6. Power generation and flood discharge are pre-arranged, and the schedule for the next two days can be known in advance. After knowing the relationship between reservoir inflow and water level volume and the power to water ratio curves, the relationship among reservoir inflow, power and water level can be obtained.

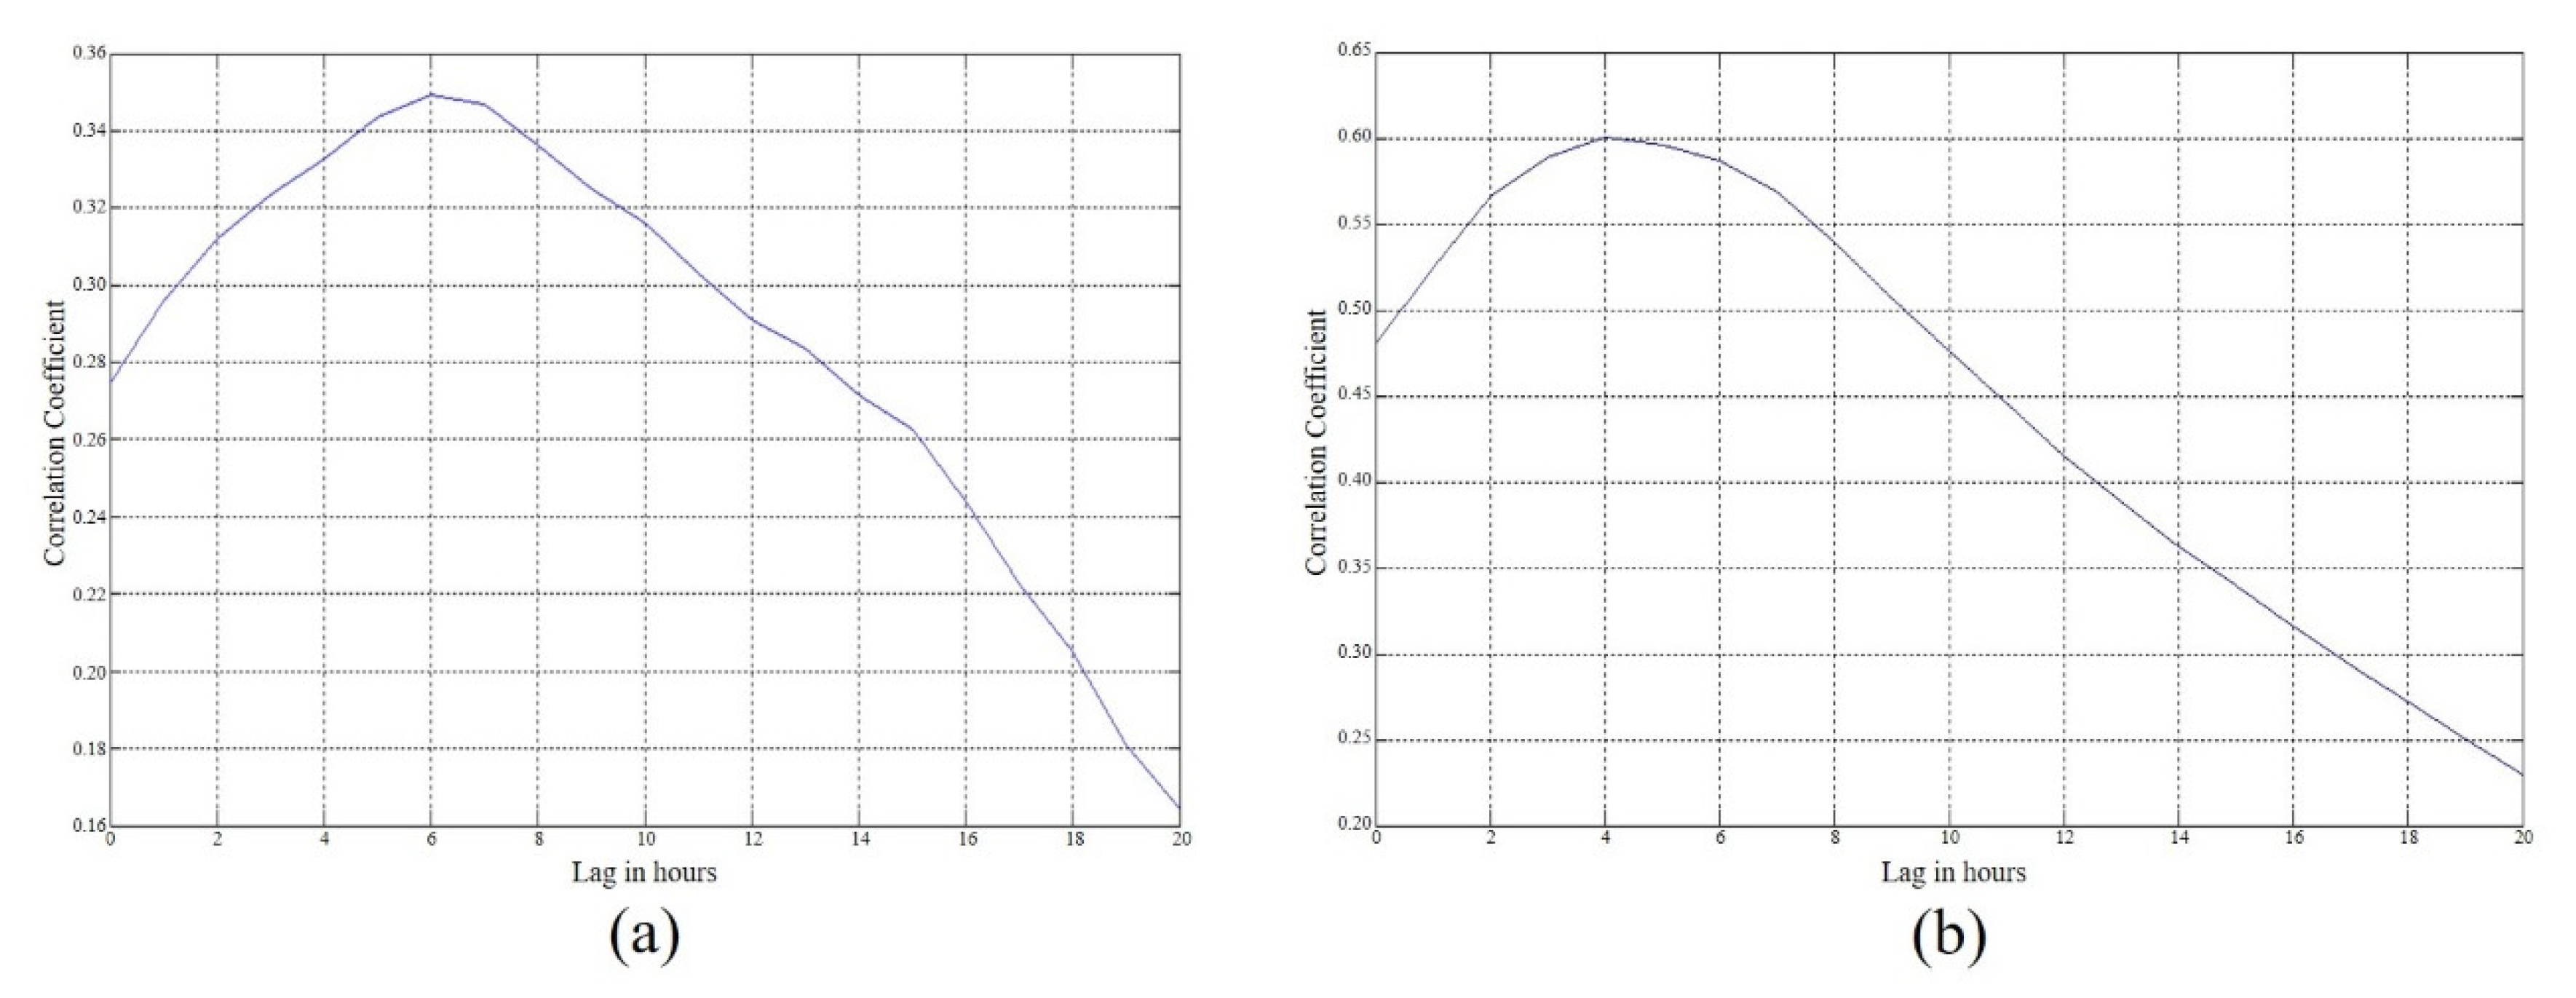
4.3. Correlation Analysis of Reservoir Water Level and Meteorological Rainfall Data from TTFRI in Catchment Area

Many studies have pointed out that renewable energy forecasts are more severely affected by weather [6,48,49]. The study in [48] introduced the current situation in the WRF mode of rainfall forecasting mainly used in Taiwan. The model in [49] integrated a variety of meteorological data and responded well to instantaneous inflows, reflecting the importance of rainfall forecasts for flow prediction. The reservoir inflow is affected by the rainfall. It is currently known that the rainfall data of the upstream rainfall observation stations is closely related to the reservoir inflow. If the meteorological rainfall data are included in the forecasting system, the forecasting accuracy will increase. In order to obtain the meteorological rainfall data in the Techi Reservoir catchment area, this paper cooperated with TTFRI. Since 2010, the TTFRI centre has developed and implemented the experience of Taiwan Cooperative Precipitation Ensemble Forecast Experiment (TAPEX). In addition, in order to consider the geological and hydrological characteristics of the Techi Reservoir catchment area, the TTFRI centre uses the Kriging method [34,35] in spatial statistical theory to convert the gridded rainfall data of the numerical model to the Dajiaxi meteorological rainfall data of seven rainfall observation stations. The seven meteorological rainfall stations include Techi Reservoir, Songmao, Siyuan, Lishan, Songfeng, Hehuan Mountain, and Pingyan Mountain. The meteorological rainfall data from TTFRI are provided every 6 h, and it provides hourly cumulative rainfall forecast data from 1 to 78 h for each rainfall station.
In order to confirm the accuracy of meteorological rainfall data, this paper analyses the periods of abundant rainfall from April to September 2013 in Taiwan. First, we analyse the delay correlation among the water level, Techi rainfall observation station and the meteorological rainfall data of Techi, and the results are shown in Figure 7. From Figure 7, it can be seen that the water level is delayed. Moreover, the correlation coefficient between TAPEX forecast data and reservoir water level is worse than that of rainfall observation data, but there are similar rainfall trends.
Then, according to the meteorological rainfall data and the actual value of the reservoir catchment area, error analysis is carried out using Mean Absolute Error (MAE) and Root Mean Square Error (RMSE) as in (7) and (8), respectively. The MAE, RMSE and Mean Square Error (MSE), as in (9), are commonly used to assess the accuracy of prediction.
MAE = 1 n i = 1 n f i y i
RMSE = 1 n i = 1 n f i y i 2
MSE = 1 n i = 1 n f i y i 2
The error analysis of meteorological rainfall data and Techi rainfall observation station is shown in Figure 8, and the errors are also within a certain degree of acceptable range. This meteorological rainfall data should be able to provide an important reference basis for the long-term lead water level forecasting.

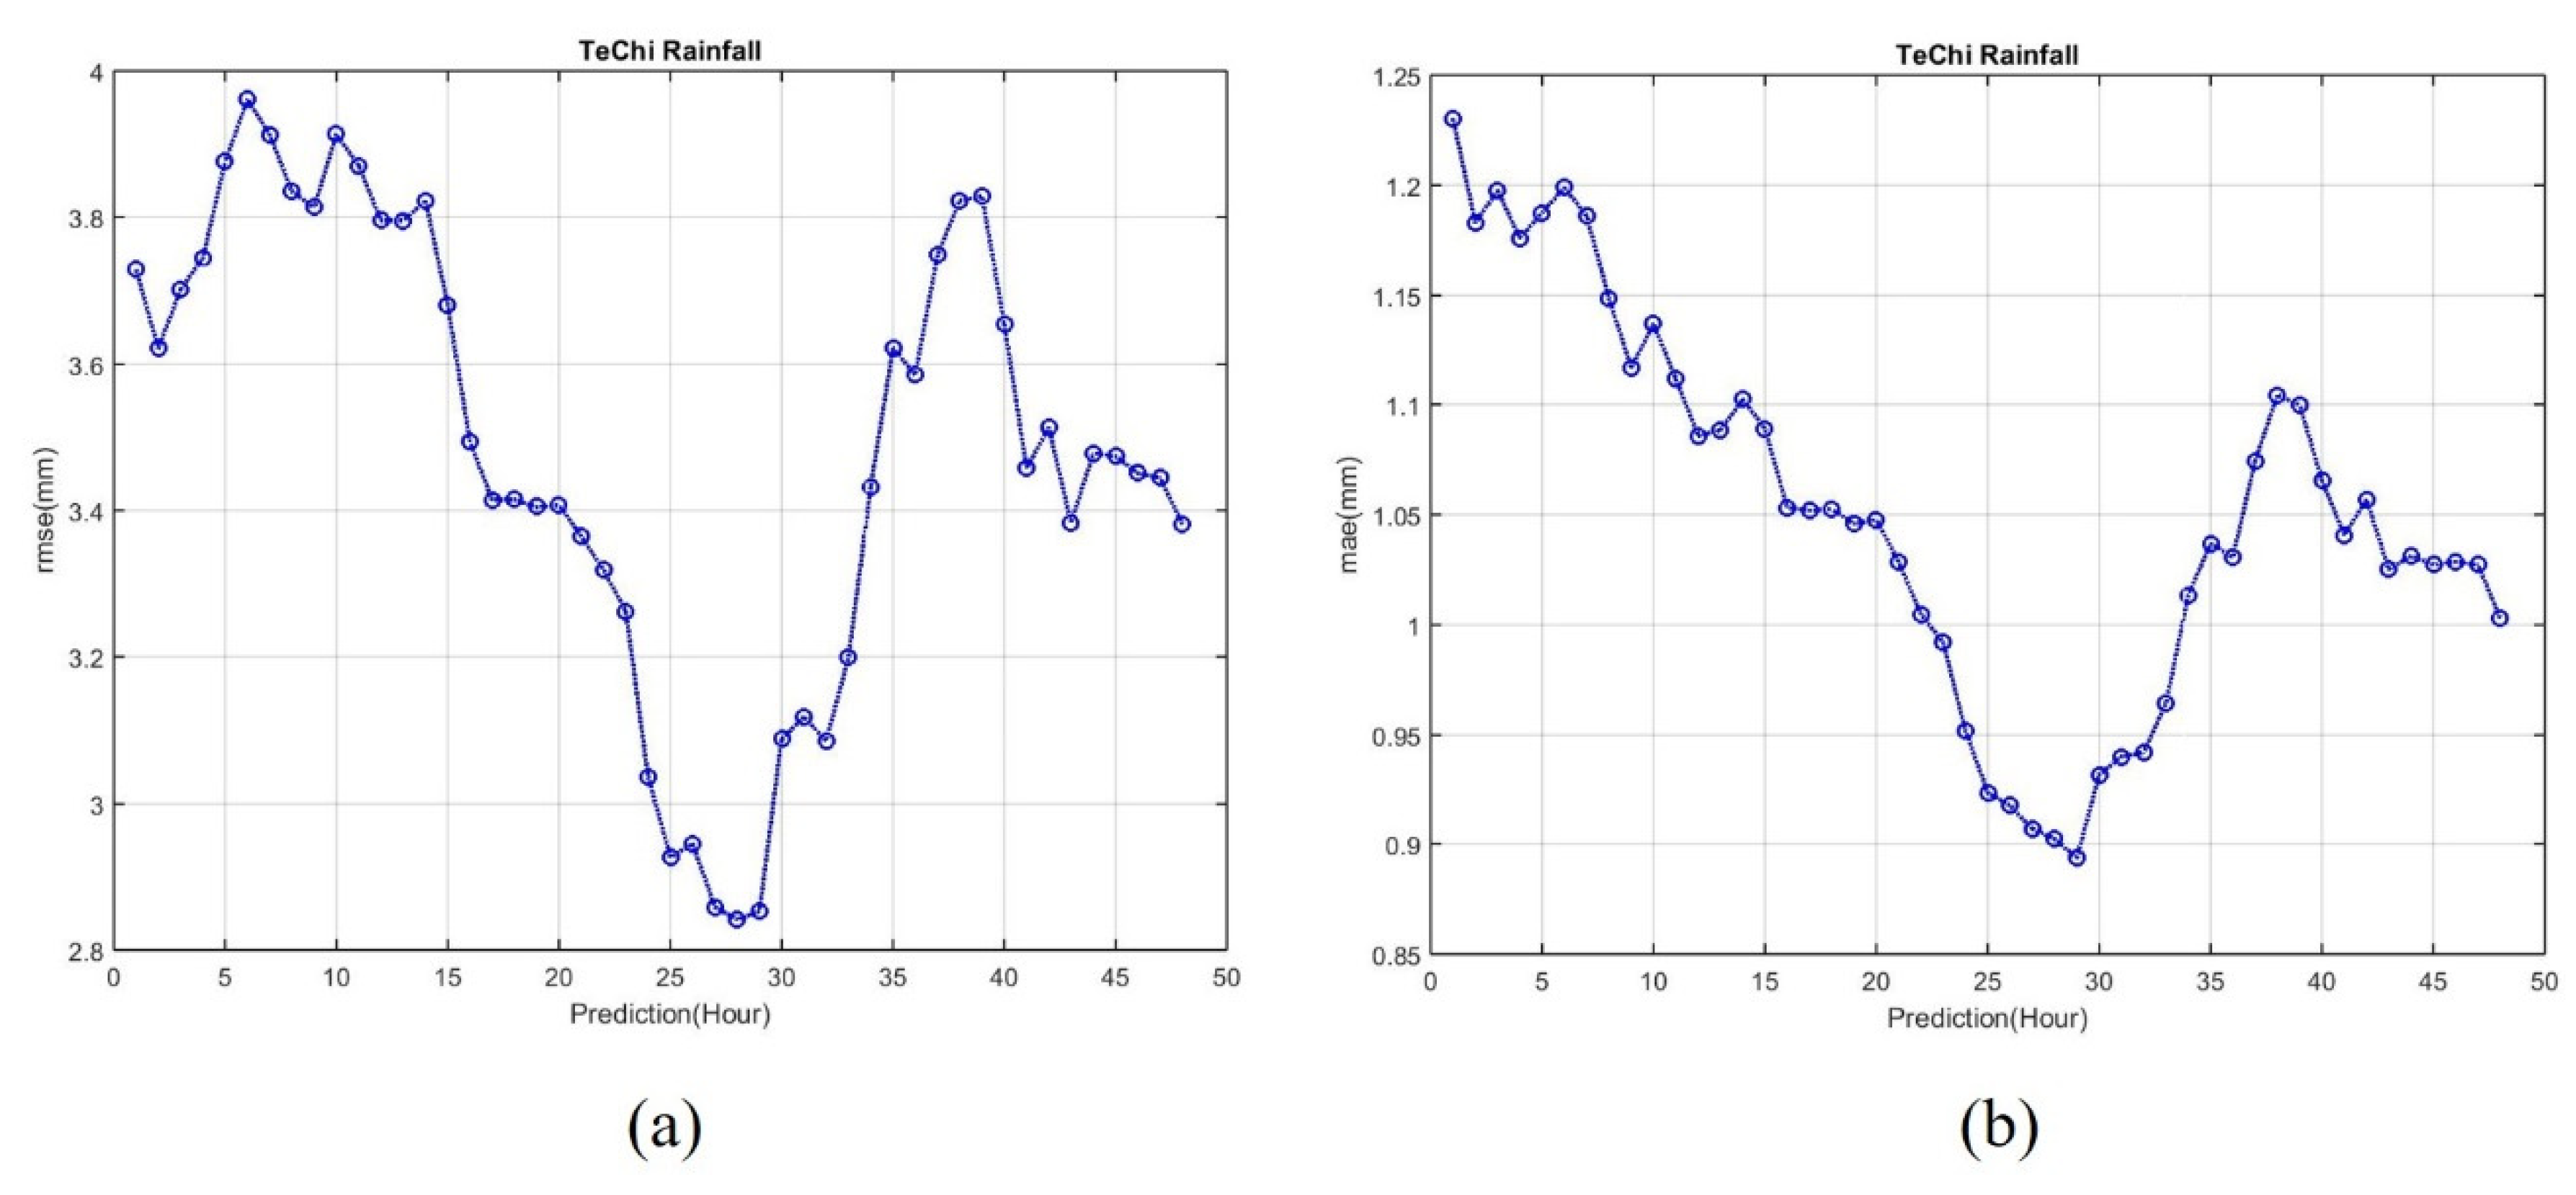
4.4. Experimental Results

It is assumed that only the historical water level change of Techi Reservoir is considered, and the neural network is used to predict the 6-h lead water level change of Techi Reservoir. The neural network is trained by using the water level measurement data from 1 January 2012 to 30 June 2013 of the Techi Reservoir, and the water level measurement data from 1 October 2013 to 30 December 2013 of the Techi Reservoir are used as the testing data after the learning of the neural network. The neural network consists of 5 input layer neurons, 7 hidden layer neurons, 1 output layer neuron, 5 inputs (4 historical water level data and 1 water level difference data) and 1 output (predicted water level value for the next 1 hour). The training method uses a gradient descent algorithm. The learning result of training data and the forecasting result of testing data are shown in Figure 9. The MSE of the training results is 0.0324. The MSE of the testing results is shown in Table 1.
This paper uses MATLAB as the development platform to develop a 48-h ahead reservoir water level forecasting system using fuzzy neural networks. The purpose of this system is to predict the trend of water level changes 48 h ahead, and update the forecasting results every hour. This system automatically retrieves power generation of hydroelectric units, water level of Techi Reservoir, seven rainfall observation stations and TAPEX meteorological data every hour for water level forecasting. To illustrate the validity of the prediction results, typhoons in Taiwan from 2013 to 2014 are used as the experimental data in this paper. The typhoon data are derived from the typhoon database of the Central Weather Bureau (CWB) in Taiwan [50], as shown in Table 2, to obtain the past typhoon landing time and related information.
For Typhoons Tammei, Kongrey, Usagi and Matmo in Table 2, the water level and inflow forecasting results of Techi Reservoir are shown in Figure 10, Figure 11, Figure 12, Figure 13, Figure 14, Figure 15, Figure 16 and Figure 17, respectively. In Figure 10, Figure 11, Figure 12, Figure 13, Figure 14, Figure 15, Figure 16 and Figure 17, the blue lines with square symbol represent the observed values and the red lines with plus symbol represent the forecasting values. It can be seen from Figure 10, Figure 11, Figure 12, Figure 13, Figure 14, Figure 15, Figure 16 and Figure 17 that the forecasting values have a similar trend to the actual future values.
The MAE of the 48-h ahead reservoir inflow forecasting in 2012 and 2013 can be obtained, and the results are shown in Figure 18 and Figure 19. It can be seen from Figure 18 and Figure 19 that the forecasting accuracy will gradually decrease as the lead time increases, and there will be a relatively large error in the sudden change of rainfall. This is partly due to the influence of the accuracy of the meteorological rainfall data, and the other part is that the training data with sudden rainfall changes account for a relatively small proportion of the training data. This will affect the forecasting accuracy during the typhoon landing.
As the water level changes significantly in the rainy season, this paper evaluates the accuracy of the forecasting performance by observing events with reservoir inflow greater than 100 CMS. The results of the RMSE and MAE in 2012 and 2013 are shown in Figure 20 and Figure 21, respectively. Figure 20 shows that the RMSE value for the first 24 h in 2012 is about 160 CMS, and Figure 21 shows that the RMSE value for the first 24 h in 2013 is about 120 CMS. In general, the designed fuzzy neural network model can obtain good water level forecasting results. However, the reservoir inflow during a typhoon or heavy rain may be hundreds of times different from the reservoir inflow during a normal period, and the water level of the reservoir may change by tens of meters. In addition, when the water level is predicted, the predicted reservoir inflow error value will continue to accumulate from 1 to 48-h, and the predicted water level will have a large error 48-h in the future.
In order to illustrate the relationship between reservoir level forecasting and hydroelectric power generation, this paper assumes the starting water level of 1400 m at the time of typhoon Matmo and conducts a simulation analysis. The impact on hydroelectricity generation is illustrated for the scenarios with and without the reservoir level forecasting system. It is assumed that without the forecast system, the dispatcher would normally start to operate the hydroelectric plant at full capacity when there is a large change in water level at 00:00 in the morning on 23 July 2014. Assuming that the forecast system is available, the dispatcher observes the predicted water level trend a day before and starts to operate the hydroelectric plant at full capacity immediately, based on the forecast system results. The results are shown as Figure 22 and Figure 23, and it can be seen that if the dispatcher starts to operate the hydroelectric plant at full capacity without the reservoir level forecasting system when the typhoon hits, the water level will be raised to the full level and it is necessary to discharge the flood, which is a loss of energy. From Figure 22 and Figure 23, if the operation of the hydroelectric plant at full capacity can be started 24 h before, the reservoir can avoid the flood discharge.
Next, we analyse in detail the loss of generation caused by the dispatcher’s hydroelectric operation at different times. When the predicted result was generated on 22 July, it showed that the reservoir would reach full level in 33 h. In this case, when the water level is full, there is no way to stop the water level from rising even if the hydroelectric plant is operating at full capacity. In case of high initial reservoir level and sudden heavy rain, the dispatcher starts to operate the hydroelectric plant at full capacity after different time points and analyses the water level change. During the process, the amount of flood discharge when the water level reaches the highest point of 1408 m is recorded, and the accumulated power generation loss of the hydroelectric units is evaluated according to the power to water ratio value. The results are shown in Figure 24, and it is clear that the dispatcher must start to operate the hydroelectric plant at full capacity 24 h prior, otherwise it will cause power generation loss due to flood discharge. From Figure 24, the loss in power generation is very impressive, which also shows the importance of water level forecasting for the dispatcher to operate the hydroelectric units.

4.5. Discussions

The effect of rainfall on the basin inflow can be seen from both the physical runoff model of [13,14,40] and the statistical model of [16,24,44]. The fact that rain in the upstream catchment increases the water level of the Techi Reservoir is well established. In order to understand the delay time of the river confluence at Techi Reservoir, the correlation between the rainfall station and reservoir water level was analysed. In Figure 7, it can be seen that the maximum correlation of the observed data on the reservoir inflow is at 4 h, while the predicted data have a more significant effect at about 6 h. Figure 4 also reflects the influence of the rainfall stations on the trend of water level variation. It can then be seen from Figure 6 that the power–water ratio curve learned by neural networks is similar to the actual curve, and the water level volume curve also has a good learning result.
Based on [16,17,19,24,25], they demonstrated the importance of rainfall forecasting for reservoir water level and inflow. For this purpose, we further analysed the correlation between the predicted rainfall data and the actual water level changes. From Figure 7a, it can be seen that the correlation between the rainfall forecasting and reservoir water level change is relatively low, compared to the observed rainfall values, and from Figure 8, the accuracy of the rainfall forecasting is acceptable but can be further optimized. When analysing the forecast data, it is found that sometimes the forecast data do not reflect the actual rainfall trend.
Next, we conducted a typhoon case study. The dispatcher usually relies on experience in scheduling hydroelectric units for hydroelectric power generation. In order to present the effectiveness of the proposed method, we simulated the inflow of typhoon Maghreb and added the water consumption of the hydroelectric power generation into the reservoir using the power–water ratio curve. In addition, in order to highlight the huge loss of power generation due to flood discharge, we assumed that the initial water level before the typhoon arrives is 1400 m and simulated that if the dispatcher can start to operate the hydroelectric plant at full capacity earlier, the loss of power generation due to flood discharge can be greatly reduced, which may reach 7GWh loss in a single typhoon, which is a very large energy loss.
Finally, because of the characteristics of Taiwan’s island climate, the rainy season in Taiwan is concentrated between May and September, and there are often very drastic changes in reservoir inflow during this period. Based on [1,2,4], the impact of extreme rainfall on water resources can be understood. Obviously, it is not very objective to use RMSE and MAE directly to evaluate the annual reservoir inflow and water level. Therefore, this paper selected representative typhoons from 2013 to 2014 as experimental data, aiming to investigate whether the water level forecasting system can reflect the future water level trend in real time when heavy rainfall occurs. From Figure 10, Figure 11, Figure 12, Figure 13, Figure 14, Figure 15, Figure 16 and Figure 17, it can be seen that the forecasting system has a good ability to follow the water level in case of extreme rainfall. In addition, the accuracy of the inflow prediction was analysed for the case of reservoir inflow exceeding 100 CMS, i.e., a certain level of rainfall occurred. As can be seen in Figure 10 and Figure 21, the forecasting system is able to provide good forecasting results for both special cases and rainfall events.

5. Conclusions

Taiwan is blessed with abundant water resources. Among them, Techi Reservoir is the uppermost reservoir in the Dajiaxi Basin. The operation of the Techi branch of Dajiaxi Power Plant is critical to the power generation, and downstream water supply of power plants in the entire Dajiaxi River Basin, and its importance is beyond words. Therefore, for Techi Reservoir, based on the meteorological rainfall information and the rainfall stations in the catchment area, reservoir level, flood discharge, and power generation, this paper has developed a fuzzy neural network 48-h ahead reservoir water level forecasting system that is capable of predicting the hourly water level 1 h to 48 h ahead.
The main objective of this paper is to enable the power plant operator to efficiently dispatch the hydroelectric units with the dynamic information of future water level in the reservoir in order to increase the power generation. If the proposed water level forecasting system can be integrated into the energy management system of hydroelectric power plant, the hydroelectric power, irrigation water, municipal water, and flood control can be managed more effectively to achieve the optimal use of energy. During the prior typhoon period, the actual reservoir inflow analysis also proved that the proposed forecasting system has a certain leading predictive ability and the ability to predict the changes in the reservoir’s inflow and water level when the offshore typhoon warning is issued. Therefore, the operators can refer to the real-time information on the dynamic changes of the reservoir water level to manage the water level. Besides retaining storage capacity for storing floods, reducing peaks, and stably supplying water for various downstream targets, the reservoir operator can also adjust the reservoir’s water level to increase the amount of power generated and increase power generation revenue.
The most important part of the model training is that the training data should cover a complete range of local climatic characteristics, especially in the area of heavy rainfall, which is very important for a successful water level forecast system to be able to respond rapidly to drastic water level changes. In order to enhance the effectiveness of the water level forecast system, the accuracy of the meteorological data is also very important, in addition to the coverage of upstream rainfall observation stations. Since most meteorological data use tuned observations from nearby urban areas, this sometimes makes it impossible for them to reflect accurate rainfall values in mountainous areas due to many factors, such as topography and climate. In this case, if the rainfall observation stations in the upper watershed can be used to calibrate the meteorological data, the accuracy of water level prediction will be improved.

Author Contributions

Investigation, H.-H.T., L.-F.C. and C.-Y.T.; data curation, H.-H.T. and L.-F.C.; conceptualization and methodology, Y.-G.L.; software, validation and formal analysis, H.-H.T. and Y.-G.L.; writing—original draft preparation, H.-H.T.; supervision, Y.-G.L. and C.-Y.T.; resources, L.-F.C. and C.-Y.T. All authors have read and agreed to the published version of the manuscript.

Funding

This research received no external funding.

Institutional Review Board Statement

Not applicable.

Informed Consent Statement

Not applicable.

Data Availability Statement

Not applicable.

Conflicts of Interest

The authors declare no conflict of interest.

References

  1. Mendes, C.A.B.; Beluco, A.; Canales, F.A. Some important uncertainties related to climate change in projections for the Brazilian hydropower expansion in the Amazon. Energy 2017, 141, 123–138. [Google Scholar] [CrossRef]
  2. Amjath-Babu, T.S.; Sharma, B.; Brouwer, R.; Rasul, G.; Wahid, S.M.; Neupane, N.; Bhattarai, U.; Sieber, S. Integrated modelling of the impacts of hydropower projects on the water-food-energy nexus in a transboundary Himalayan river basin. Appl. Energy 2019, 239, 494–503. [Google Scholar] [CrossRef]
  3. Turner, S.W.D.; Hejazi, M.; Kim, S.H.; Clarke, L.; Edmonds, J. Climate impacts on hydropower and consequences for global electricity supply investment needs. Energy 2017, 141, 2081–2090. [Google Scholar] [CrossRef]
  4. Voisin, N.; Dyreson, A.; Fu, T.; O’Connell, M.; Turner, S.W.; Zhou, T.; Macknick, J. Impact of climate change on water availability and its propagation through the Western U.S. power grid. Appl. Energy 2020, 276, 115467. [Google Scholar] [CrossRef]
  5. Tarroja, B.; Forrest, K.; Chiang, F.; AghaKouchak, A.; Samuelsen, S. Implications of hydropower variability from climate change for a future, highly-renewable electric grid in California. Appl. Energy 2019, 237, 353–366. [Google Scholar] [CrossRef]
  6. Nohara, D.; Hori, T.; Sato, Y. Real-time reservoir operation for drought management considering operational ensemble predictions of precipitation in Japan. In Advances in Hydroinformatics; Springer: Singapore, 2018; pp. 331–345. [Google Scholar] [CrossRef]
  7. Faber, B.A.; Stedinger, J.R. Reservoir optimization using sampling SDP with ensemble streamflow prediction (ESP) forecasts. J. Hydrol. 2001, 249, 113–133. [Google Scholar] [CrossRef]
  8. Alemu, E.T.; Palmer, R.N.; Polebitski, A.; Meaker, B. Decision support system for optimizing reservoir operations using ensemble streamflow predictions. J. Water Resour. Plan. Manag. 2011, 137, 72–82. [Google Scholar] [CrossRef]
  9. Cheng, C.T.; Feng, Z.K.; Niu, W.J.; Liao, S.L. Heuristic methods for reservoir monthly inflow forecasting: A case study of Xinfengjiang Reservoir in Pearl River. Water 2015, 7, 4477–4495. [Google Scholar] [CrossRef]
  10. Wang, H.; Xiao, W.; Wang, Y.; Zhao, Y.; Lu, F.; Yang, M.; Hou, B.; Yang, H. Assessment of the impact of climate change on hydropower potential in the Nanliujiang river basin of China. Energy 2019, 167, 950–959. [Google Scholar] [CrossRef]
  11. Gupta, A.; Kumar, A.; Khatod, D.K. Optimized scheduling of hydropower with increase in solar and wind installations. Energy 2019, 183, 716–732. [Google Scholar] [CrossRef]
  12. Llamosas, C.; Sovacool, B.K. The future of hydropower? A systematic review of the drivers, benefits and governance dynamics of transboundary dams. Renew. Sustain. Energy Rev. 2020, 137, 110495. [Google Scholar] [CrossRef]
  13. Kuo, C.-C.; Gan, T.Y.; Yu, P.-S. Seasonal streamflow prediction by a combined climate-hydrologic system for river basins of Taiwan. J. Hydrol. 2010, 387, 292–303. [Google Scholar] [CrossRef]
  14. Le, V.T.; Kuo, C.-M.; Yang, T.-C. Application of Non-Dominated Sorting Genetic Algorithm in Calibration of HBV Rainfall-Runoff Model: A Case Study of Tsengwen Reservoir Catchment in Southern Taiwan. In Proceedings of the 12th International Conference on Hydroscience & Engineering, Tainan, Taiwan, 6–10 November 2016. [Google Scholar]
  15. Leu, Y.G.; Lee, T.T.; Wang, W.Y. Observer-based adaptive fuzzy-neural control for unknown nonlinear dynamical systems. IEEE Trans. Syst. Man Cybern. Part B 1999, 29, 583–591. [Google Scholar] [CrossRef]
  16. Wang, W.; Zhao, X. (Eds.) A new model of fuzzy neural networks and its application. In Proceedings of the Fifth World Congress on Intelligent Control and Automation (IEEE Cat No 04EX788), Hangzhou, China, 15–19 June 2004. [Google Scholar]
  17. Maier, H.R.; Dandy, G.C. Neural networks for the prediction and forecasting of water resources variables: A review of modelling issues and applications. Environ. Model. Softw. 2000, 15, 101–124. [Google Scholar] [CrossRef]
  18. Termite, L.F.; Todisco, F.; Vergni, L.; Mannocchi, F. A neuro-fuzzy model to predict the inflow to the guardialfiera multipurpose dam (Southern Italy) at medium-long time scales. J. Agric. Eng. 2013, 44. [Google Scholar] [CrossRef]
  19. Ishak, W.W.; Mahamud, K.R.K.; Norwawi, N.M. Modelling reservoir water release decision using temporal data mining and neural network. Int. J. Emerg. Technol. Adv. Eng. 2012, 2, 422–428. [Google Scholar]
  20. Ashaary, N.A.; Wan, I.W.H.; Ku-Mahamud, K.R. Forecasting model for the change of reservoir water level stage based on temporal pattern of reservoir water level. In Proceedings of the 5th International Conference on Computing and Informatics, Istanbul, Turkey, 11–13 August 2015. [Google Scholar]
  21. Wan, I.W.H.; Ku-Mahamud, K.R.; Md, N.N. Modelling of human expert decision making in reservoir operation. J. Teknol. 2015, 77, 1–5. [Google Scholar]
  22. Ashaary, N.A.; Wan, I.W.H.; Ku-Mahamud, K.R. Neural network application in the change of reservoir water level stage forecasting. Indian J. Sci. Technol. 2015, 8, 1–6. [Google Scholar] [CrossRef] [Green Version]
  23. Mekanik, F.; Imteaz, M.; Gato-Trinidad, S.; Elmahdi, A. Multiple regression and Artificial Neural Network for long-term rainfall forecasting using large scale climate modes. J. Hydrol. 2013, 503, 11–21. [Google Scholar] [CrossRef]
  24. Akhtar, M.; Corzo, G.; Van Andel, S.; Jonoski, A. River flow forecasting with artificial neural networks using satellite observed precipitation pre-processed with flow length and travel time information: Case study of the Ganges river basin. Hydrol. Earth Syst. Sci. 2009, 13, 1607–1618. [Google Scholar] [CrossRef] [Green Version]
  25. Rasouli K, Hsieh WW, Cannon AJ. Daily streamflow forecasting by machine learning methods with weather and climate inputs. J. Hydrol. 2012, 414, 284–293. [Google Scholar]
  26. Lee, C.S. The Analysis and Numerical Simulation of Typhoons Invading Taiwan from the South (I); Research Report of the National Science Council: Taipei, Taiwan, 2005. [Google Scholar]
  27. Lee, C.S.; Fang, W.T.; Hwang, L.R. The Development of Integrated Quantitative Precipitation Forecasting Technique for Typhoon; Research Report of Central Weather Bureau: Taipei, Taiwan, 2009. [Google Scholar]
  28. Chen, Y.C.; Chang, L.Y.; Hsiao, L.F.; Chiang, C.C.; Tsai, C.C.; Wang, C.J. Quantitative precipitation forecasting technology in Taiwan. In Proceedings of the 2012 Conference on Weather Analysis and Forecasting, Taipei, Taiwan,, 17–20 September 2012. [Google Scholar]
  29. Chiang, C.C.; Chen, Y.C.; Hwang, L.R.; Wu, M.Z.; Feng, L.; Lee, C.S. 2013 Taiwan Quantitative Rainfall Prediction Experimental Platform (TAPEX) in the path and rainfall performance evaluation. In Proceedings of the 2014 Conference on Weather Analysis and Forecasting, Taipei, Taiwan, 16–18 September 2014. [Google Scholar]
  30. Chen, Y.C. A Study of Typhoon Structure and Quantitative Precipitation Forecast by Using High Resolution Ensemble Models; Research Report of the National Science Council: Taipei, Taiwan, 2013. [Google Scholar]
  31. Lee, C.S.; Ho, H.Y.; Lee, K.T.; Wang, Y.C.; Guo, W.D.; Chen, D.Y.C.; Hsiao, L.F.; Hsiao, L.-F.; Chiang, C.-C.; Yang, M.-J.; et al. Assessment of sewer flooding model based on ensemble quantitative precipitation forecast. J. Hydrol. 2013, 506, 101–113. [Google Scholar] [CrossRef]
  32. Yang, S.-C.; Yang, T.-H. Uncertainty Assessment: Reservoir Inflow Forecasting with Ensemble Precipitation Forecasts and HEC-HMS. Adv. Meteorol. 2014, 2014, 581756. [Google Scholar] [CrossRef] [Green Version]
  33. Chang, L.Y.; Hsiao, L.F.; Chen, D.Y.C.; Yang, M.J.; Tsai, C.C.; Wang, C.J. Ensemble Forecast Experiment for Typhoon Quantitatively Precipitation in Taiwan. Weather Forecast. 2014, 30, 217–237. [Google Scholar]
  34. Bras, R.L.; Rodriguez, I. Random Functions and Hydrology; Courier Corporation: Chelmsford, MA, USA, 1993. [Google Scholar]
  35. Kitanidis, P.K. Geostatistics. In Handbook of Hydrology; Maidment, D.R., Ed.; McGraw-Hill: New York, NU, USA, 1993. [Google Scholar]
  36. Michalakes, J. Design of a next-generation regional weather research and forecast model. Argonne Natl. Lab 1999. [Google Scholar] [CrossRef] [Green Version]
  37. Burn, D.H. Climatic influences on streamflow timing in the headwaters of the Mackenzie River Basin. J. Hydrol. 2008, 352, 225–238. [Google Scholar] [CrossRef]
  38. Cannon, A.J.; Whitfield, P.H. Downscaling recent streamflow conditions in British Columbia, Canada using ensemble neural network models. J. Hydrol. 2002, 259, 136–151. [Google Scholar] [CrossRef]
  39. Yang, T.C.; Yu, P.S.; Chen, C.C. Long-term runoff forecasting by combining hydrological models and meteorological records. Hydrol. Process. Int. J. 2005, 19, 1967–1981. [Google Scholar] [CrossRef]
  40. Yu, P.-S.; Yang, T.-C. Fuzzy multi-objective function for rainfall-runoff model calibration. J. Hydrol. 2000, 238, 1–14. [Google Scholar] [CrossRef]
  41. Shang, Y.; Xu, Y.; Shang, L.; Fan, Q.; Wang, Y.; Liu, Z. A method of direct, real-time forecasting of downstream water levels via hydropower station reregulation: A case study from Gezhouba Hydropower Plant, China. J. Hydrol. 2019, 573, 895–907. [Google Scholar] [CrossRef]
  42. Chiang, Y.-M.; Chang, L.-C.; Chang, F.-J. Comparison of static-feedforward and dynamic-feedback neural networks for rainfall–runoff modeling. J. Hydrol. 2004, 290, 297–311. [Google Scholar] [CrossRef]
  43. Hammid, A.T.; Sulaiman, M.H.B.; Abdalla, A.N. Prediction of small hydropower plant power production in Himreen Lake dam (HLD) using artificial neural network. Alex. Eng. J. 2018, 57, 211–221. [Google Scholar] [CrossRef]
  44. Dehghani, M.; Riahi-Madvar, H.; Hooshyaripor, F.; Mosavi, A.; Shamshirband, S.; Zavadskas, E.K.; Chau, K.W. Prediction of Hydropower Generation Using Grey Wolf Optimization Adaptive Neuro-Fuzzy Inference System. Energies 2019, 12, 289. [Google Scholar] [CrossRef] [Green Version]
  45. Water Resources Agency, MOEA. Available online: https://www.wra.gov.tw/News_Content.aspx?n=3254&s=19375 (accessed on 30 September 2020).
  46. Leu, Y.G.; Wang, W.Y.; Lee, T.T. Observer-Based Direct Adaptive Fuzzy-Neural Control for Nonaffine Nonlinear Systems. IEEE Trans. Neural Netw. 2005, 16, 853–861. [Google Scholar] [CrossRef] [PubMed]
  47. Wang, L.X. Adaptive Fuzzy Systems and Control: Design and Stability Analysis; Prentice-Hall: Englewood Cliffs, NJ, USA, 1994. [Google Scholar]
  48. Michalakes, J.; Chen, S.; Dudhia, J.; Hart, L.; Klemp, J.; Middlecoff, J.; Skamarock, W. Development of a next-generation regional weather research and forecast model. In Developments in Teracomputing; World Scientific: Singapore, 2001; pp. 269–276. [Google Scholar]
  49. Falk, A.K.; Butts, M.; Madsen, H.E.N.R.I.K.; Hartnack, J.N. Data assimilation to improve forecast quality of river basin models. In Proceedings of the XVI International Conference on Computational Methods in Water Resource, Copenhagen, Denmark,, 18–22 June 2006. [Google Scholar]
  50. Typhoon Database. Available online: https://rdc28.cwb.gov.tw/ (accessed on 18 September 2020).
Figure 1. The location of Techi Reservoir and upstream rainfall observation stations.
Energies 14 03461 g001
Figure 2. The configuration of a fuzzy neural network.
Energies 14 03461 g002
Figure 3. Forecasting mechanism with three-stage fuzzy neural networks.
Energies 14 03461 g003
Figure 4. Comparison of water level change of Techi Reservoir and the total of seven rainfall observation stations.
Energies 14 03461 g004
Figure 5. The correlation between the water level and the total of seven rainfall observation stations.
Energies 14 03461 g005
Figure 6. (a) The water level volume curve approximation; (b) The power to water ratio curve approximation.
Energies 14 03461 g006
Figure 7. (a) The correlation between the water level and meteorological rainfall data of Techi; (b) The correlation between the water level and Techi rainfall observation station.
Energies 14 03461 g007
Figure 8. The error analysis of Techi meteorological and observation rainfall, (a) RMSE; (b) MAE.
Energies 14 03461 g008
Figure 9. (a) The learning result of training data; (b) The forecasting result of testing data.
Energies 14 03461 g009
Figure 10. Forecasting results of water level at 00:00 on 21 August 2013 (during Typhoon Trami).
Energies 14 03461 g010
Figure 11. Forecasting results of reservoir inflow at 00:00 on 21 August 2013 (during Typhoon Trami).
Energies 14 03461 g011
Figure 12. Forecasting results of water level at 06:00 pm on 28 August 2013 (during Typhoon Kongrey).
Energies 14 03461 g012
Figure 13. Forecasting results of reservoir inflow at 06:00 pm on 28 August 2013 (during Typhoon Kongrey).
Energies 14 03461 g013
Figure 14. Forecasting results of water level at 02:00 am on 22 September 2013 (during Typhoon Usagi).
Energies 14 03461 g014
Figure 15. Forecasting results of reservoir inflow at 02:00 am on 22 September 2013 (during Typhoon Usagi).
Energies 14 03461 g015
Figure 16. Forecasting results of water level at 00:00 on 22 July 2014 (during Typhoon Matmo).
Energies 14 03461 g016
Figure 17. Forecasting results of reservoir inflow at 00:00 on 22 July 2014 (during Typhoon Matmo).
Energies 14 03461 g017
Figure 18. MAE of reservoir inflow forecasting in 2012.
Energies 14 03461 g018
Figure 19. MAE of reservoir inflow forecasting in 2013.
Energies 14 03461 g019
Figure 20. Forecasting error of observed reservoir inflow greater than 100 CMS in 2012.
Energies 14 03461 g020
Figure 21. Forecasting error of observed reservoir inflow greater than 100 CMS in 2013.
Energies 14 03461 g021
Figure 22. The effect on hydropower regulation with and without forecasting (water level).
Energies 14 03461 g022
Figure 23. The effect on hydropower regulation with and without forecasting (difference between reservoir inflow and water consumption for power generation).
Energies 14 03461 g023
Figure 24. Effect of start-up time of hydroelectric units on flood discharge.
Energies 14 03461 g024
Table 1. The MSE of the testing results.
Lead-Time (Hour)t + 1t + 2t + 3t + 4t + 5t + 6
MSE0.04370.05580.08250.12290.17240.2078
Table 2. From 2013 to 2014, typhoons landing in Taiwan.
Typhoon NameDuring Typhoon LandingTyphoon IntensityMaximum Wind Speed of Central Pressure (m/s)
Matmo21 July–23 July 2014middle typhoon38
Hagibis14 June–15 June 2014light typhoon20
Fitow4 October–7 October 2013middle typhoon38
Usagi19 September–22 September 2013strong typhoon55
Kongrey27 August–27 August 2013light typhoon25
Trami20 August–22 August 2013light typhoon30
Cimaron17 July–18 July 2013light typhoon18
Publisher’s Note: MDPI stays neutral with regard to jurisdictional claims in published maps and institutional affiliations.

