
Life Cycle Cost of Electricity Production: A Comparative Study of Coal-Fired, Biomass, and Wind Power in China

 ,
, 

Abstract
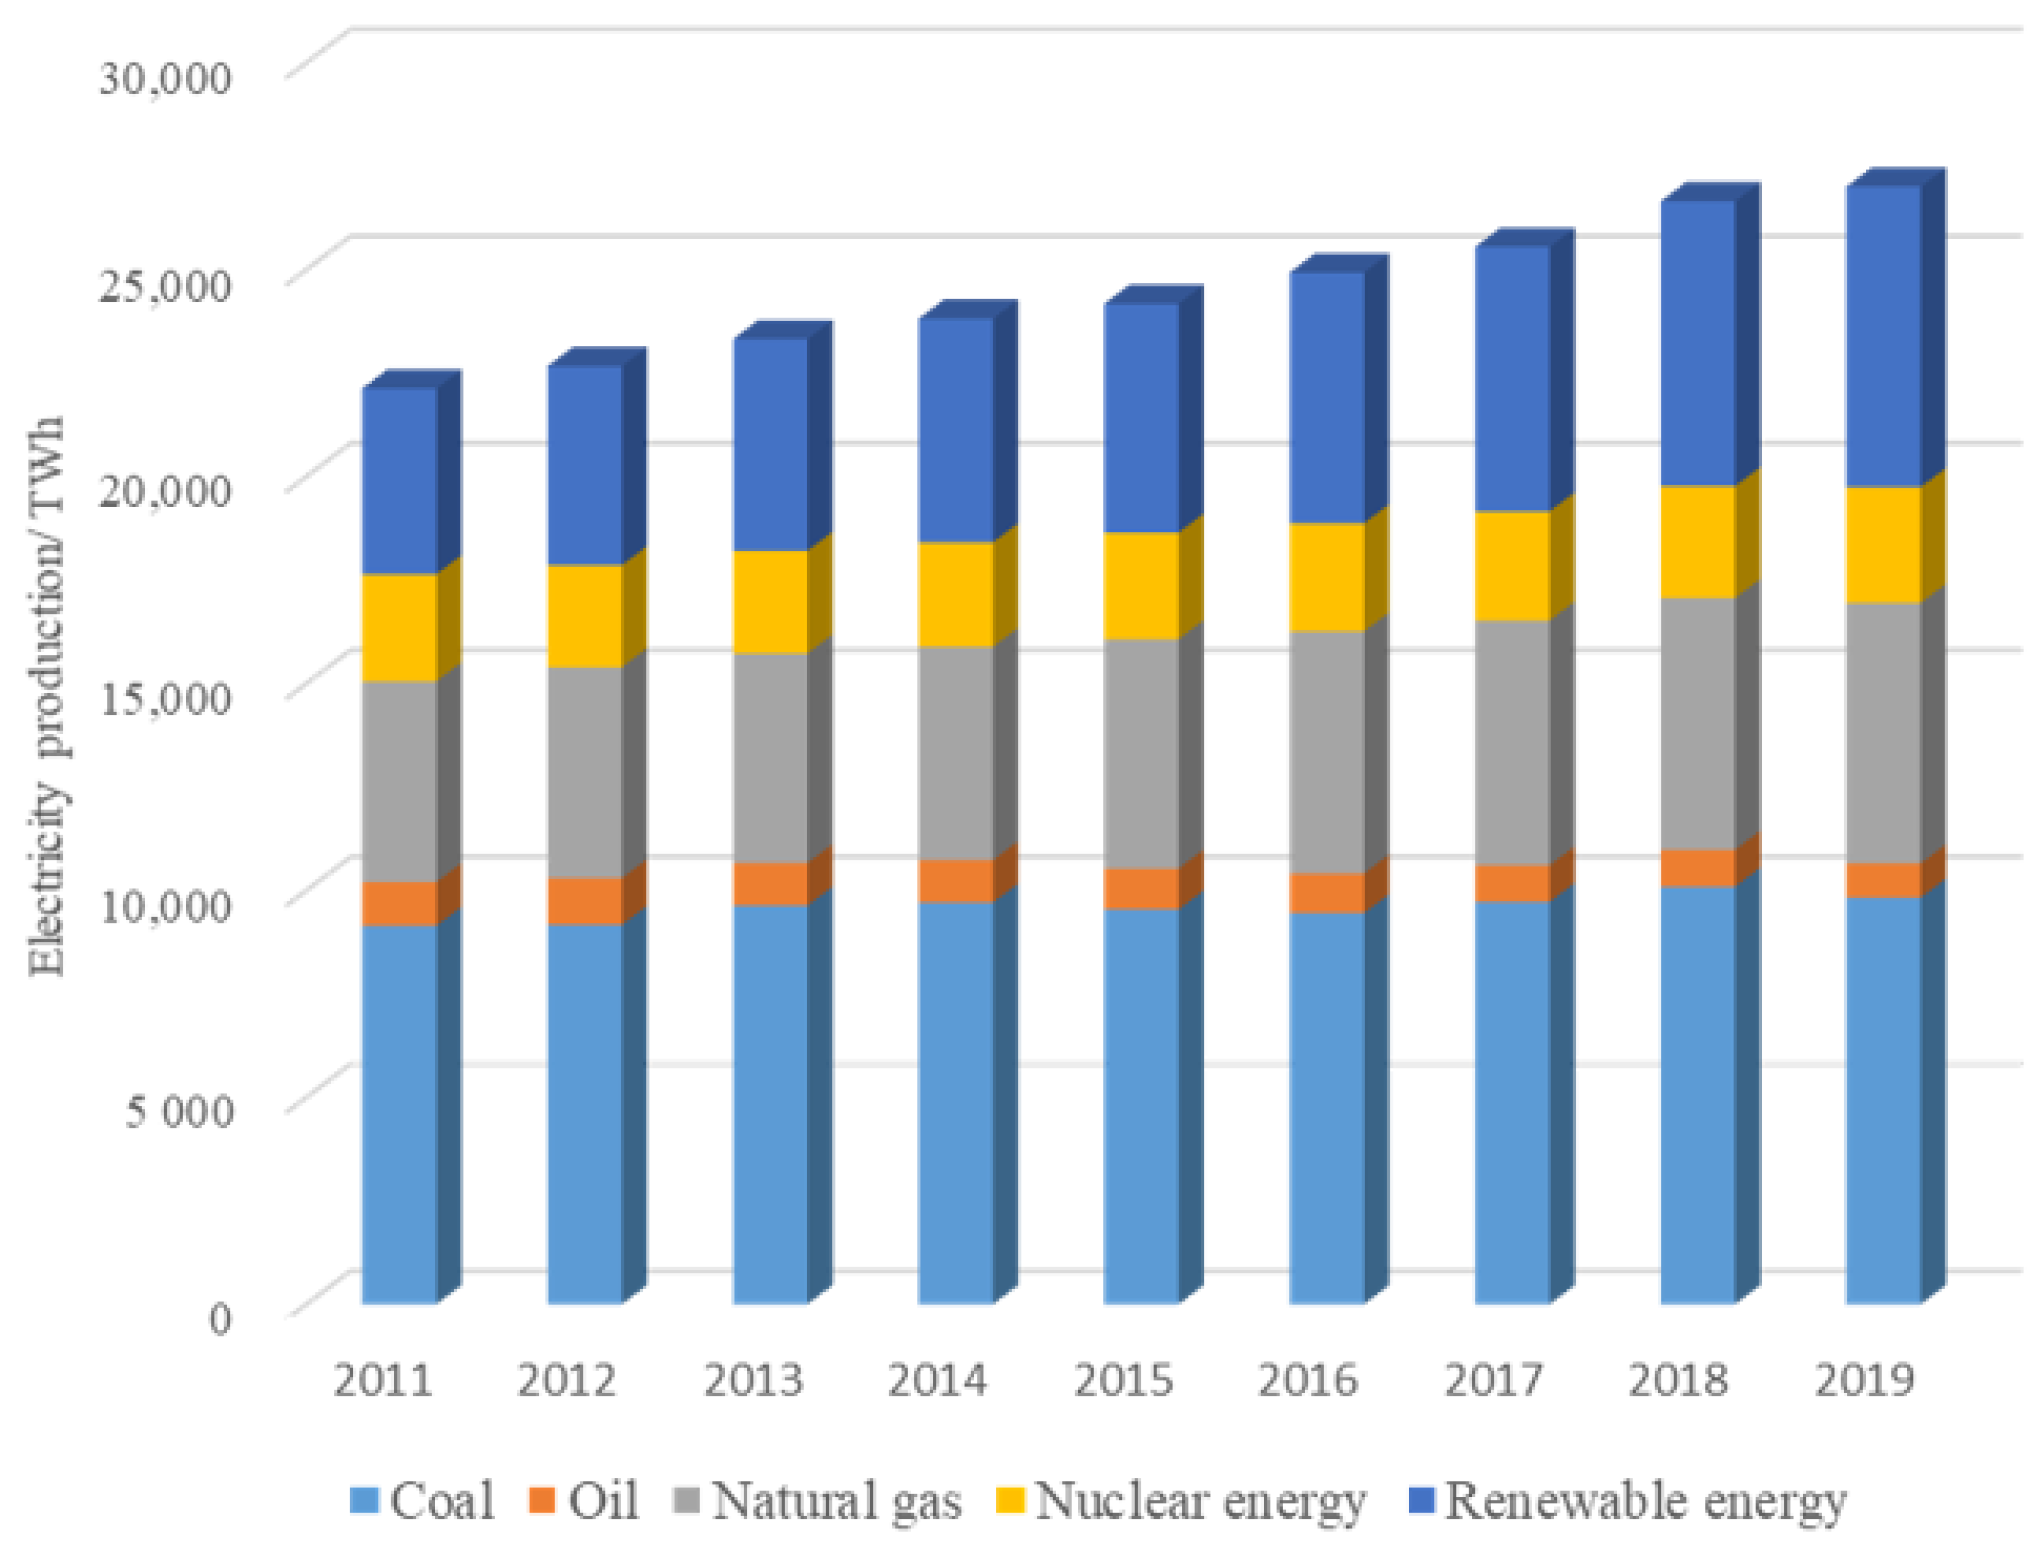
1. Introduction
2. Materials and Methods
2.1. The Improvement of the LCOE Model
- Considering the quantification of external cost: in this paper, integration of LCA and LCC is conducted to establish a corresponding calculation model. In the framework of LCA, the objective, scope, system boundary, function unit and inventory data of LCC should be consistent with LCA. The external cost is quantified based on the ReCiPe model in the SimaPro database. As a multiparametric method, ReCiPe provides an integrated vision that takes various environmental aspects into account when calculating the impacts [48].
- Expanding the compositions of internal cost: internal costs consist of capital cost, raw material cost, O&M cost, other annual costs. The compositions of capital cost are comprehensive including power plant construction cost, equipment installation cost, equipment and tool purchase cost, other engineering and construction costs, basic reserve cost, reserve fund for price variation, and interest expenses during the construction period. Additionally, the compositions of other annual costs consist of salary and welfare funds, insurance, sales tax, and some daily tariff.
- Discounting power generation: when choosing one year as the base year, the cost factors and power generation of the selected case should be converted to present value to obtain the cost of producing 1 kWh electricity. However, that is not to say the power generation also has time value analogous to the time value of money. The discount of power generation is regarded as the discount of income during each period.
2.2. Quantification Model of External Cost
- Climate Change
- Terrestrial Acidification
- Freshwater and Marine Eutrophication
- Terrestrial, Freshwater, and Marine Ecotoxicity
- Agricultural Land Occupation and Natural Land Transformation
- Urban Land Occupation
- Water Depletion
- Metal Depletion
- Fossil Depletion
- Ozone Depletion, Photochemical Oxidant Formation, Particulate Matter Formation, Human Toxicity, and Ionizing Radiation
2.3. Case Study
3. Results
3.1. Internal Cost Accounting
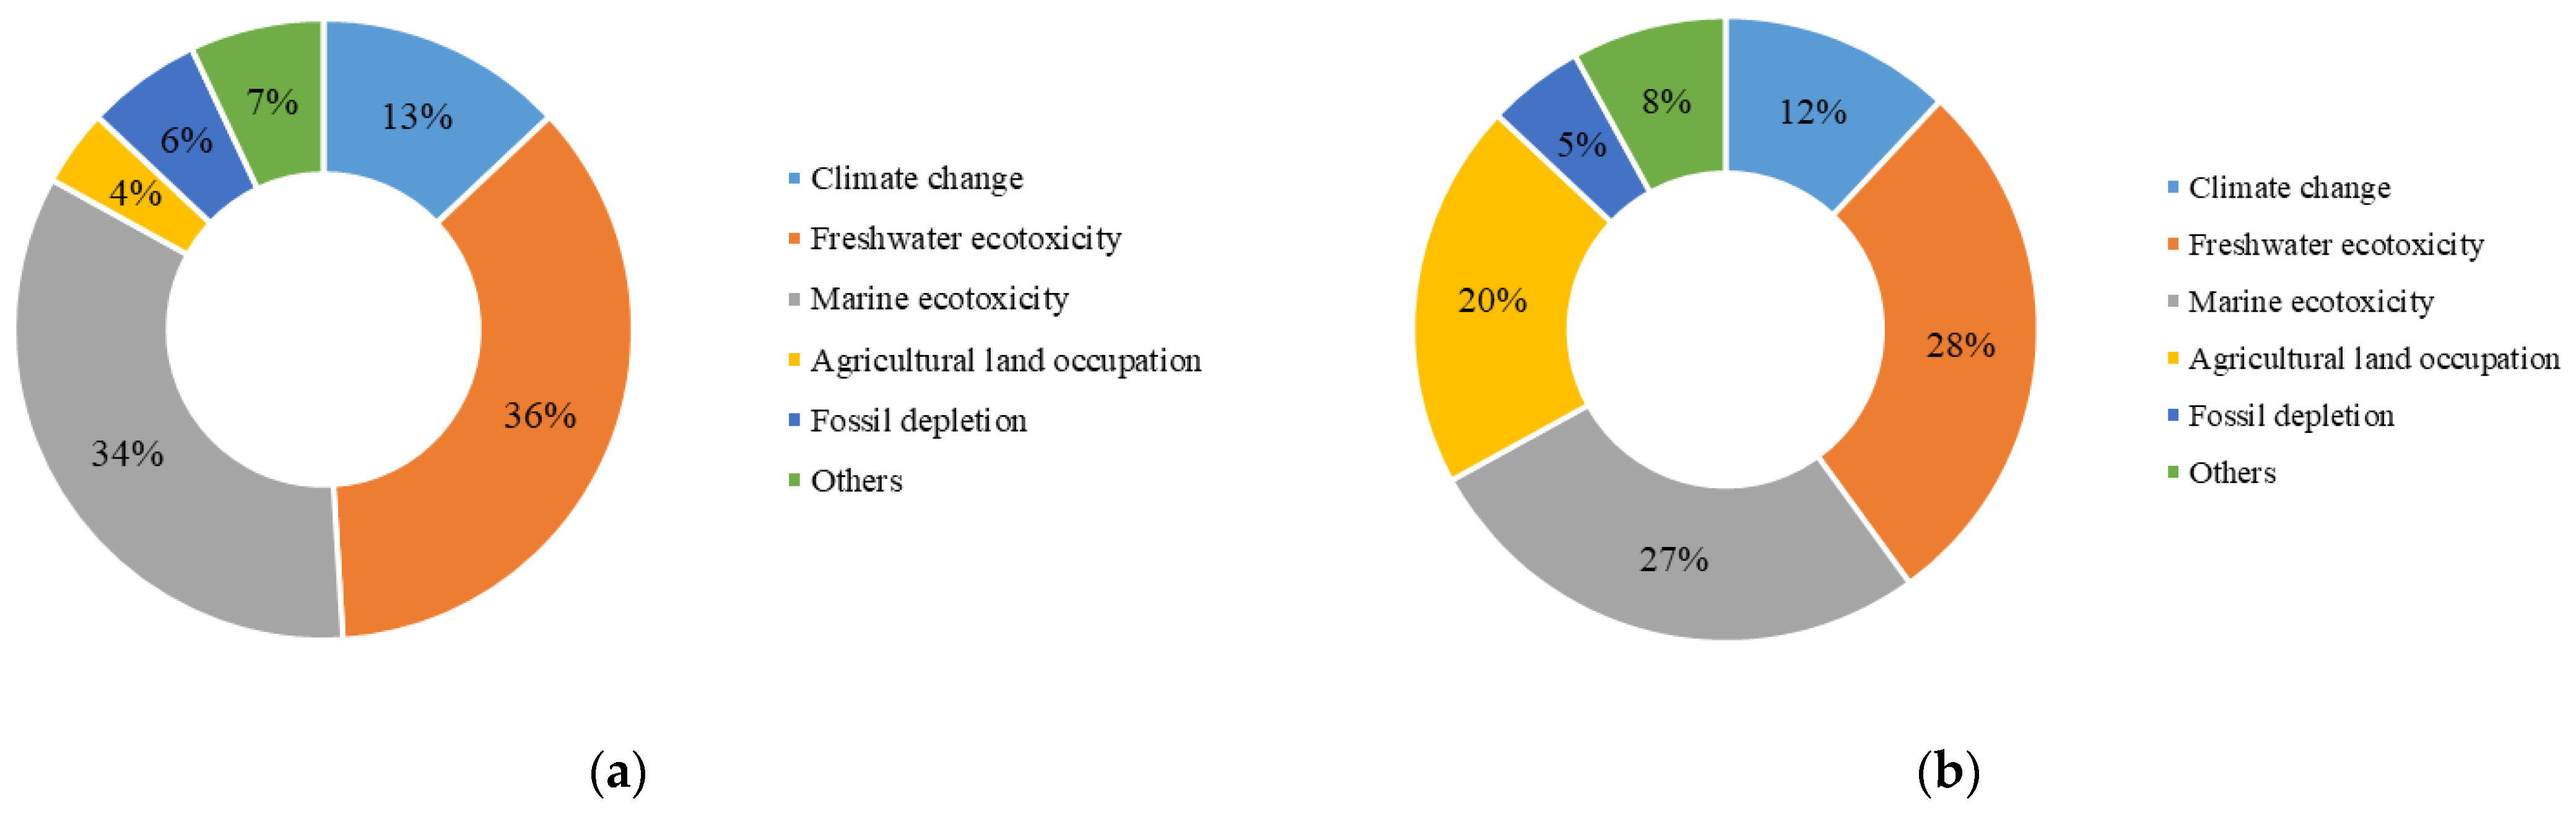
3.2. External Cost Accounting
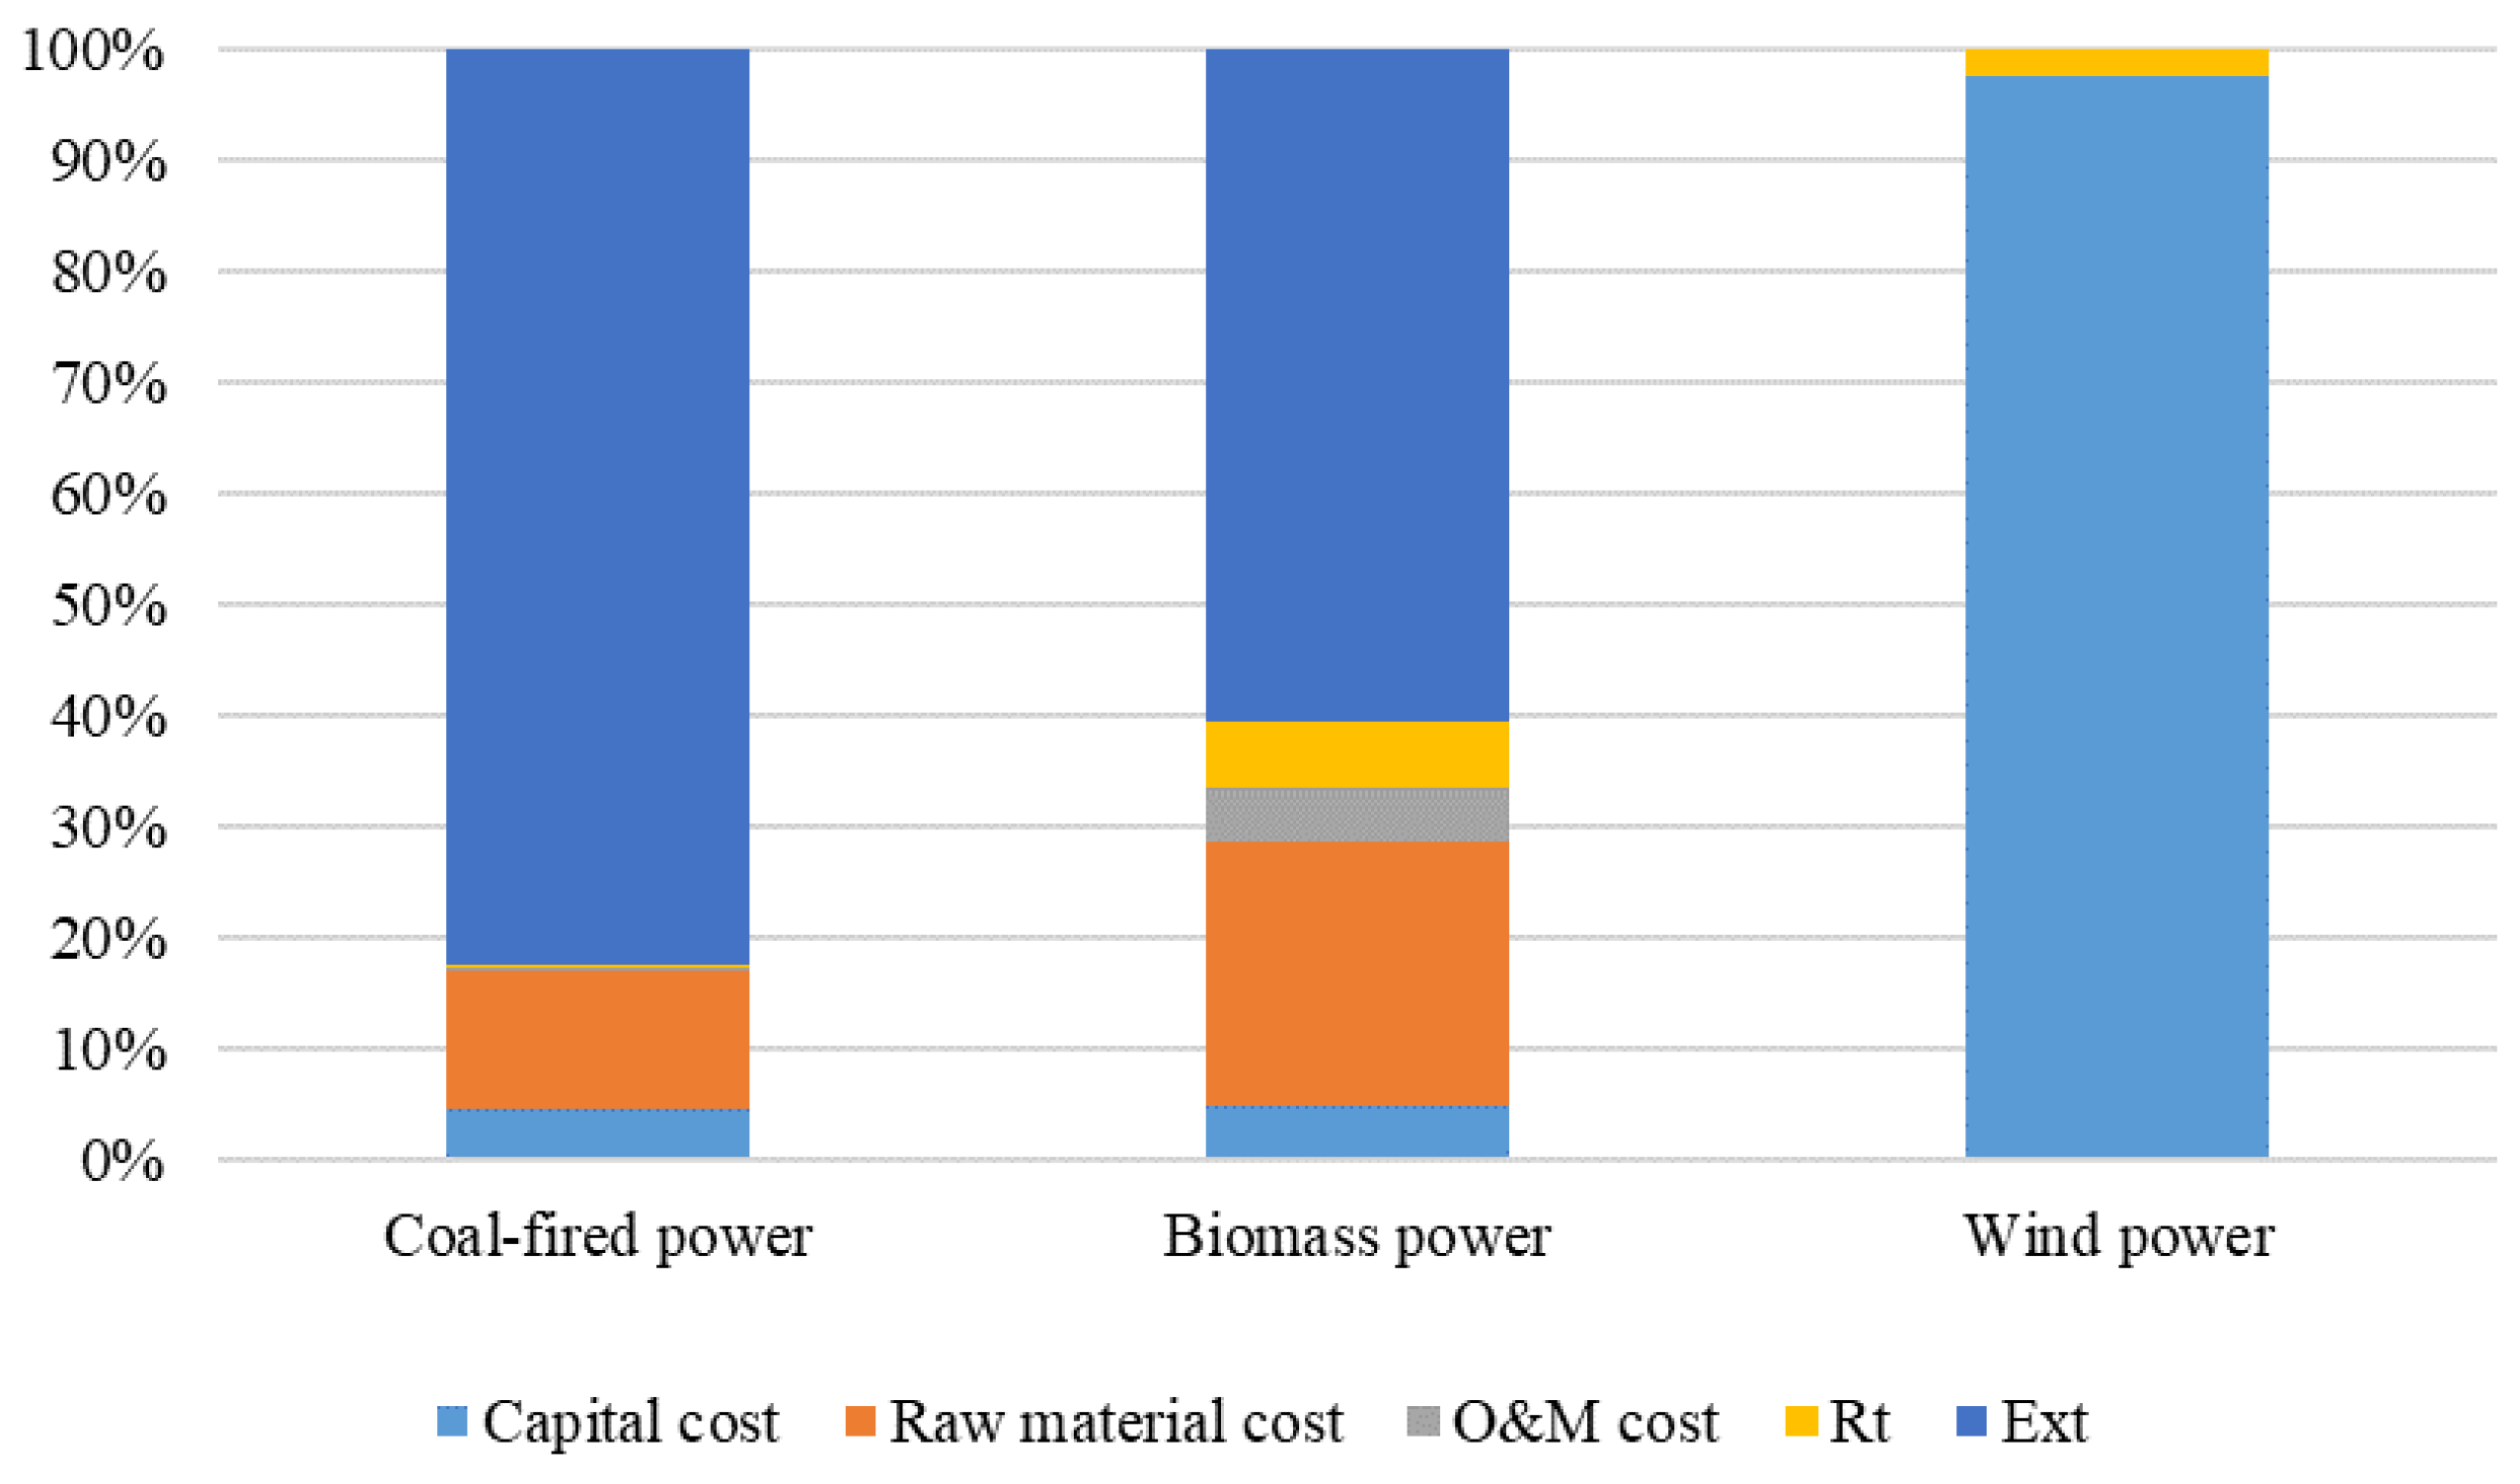
3.3. Life Cycle Cost
4. Discussion
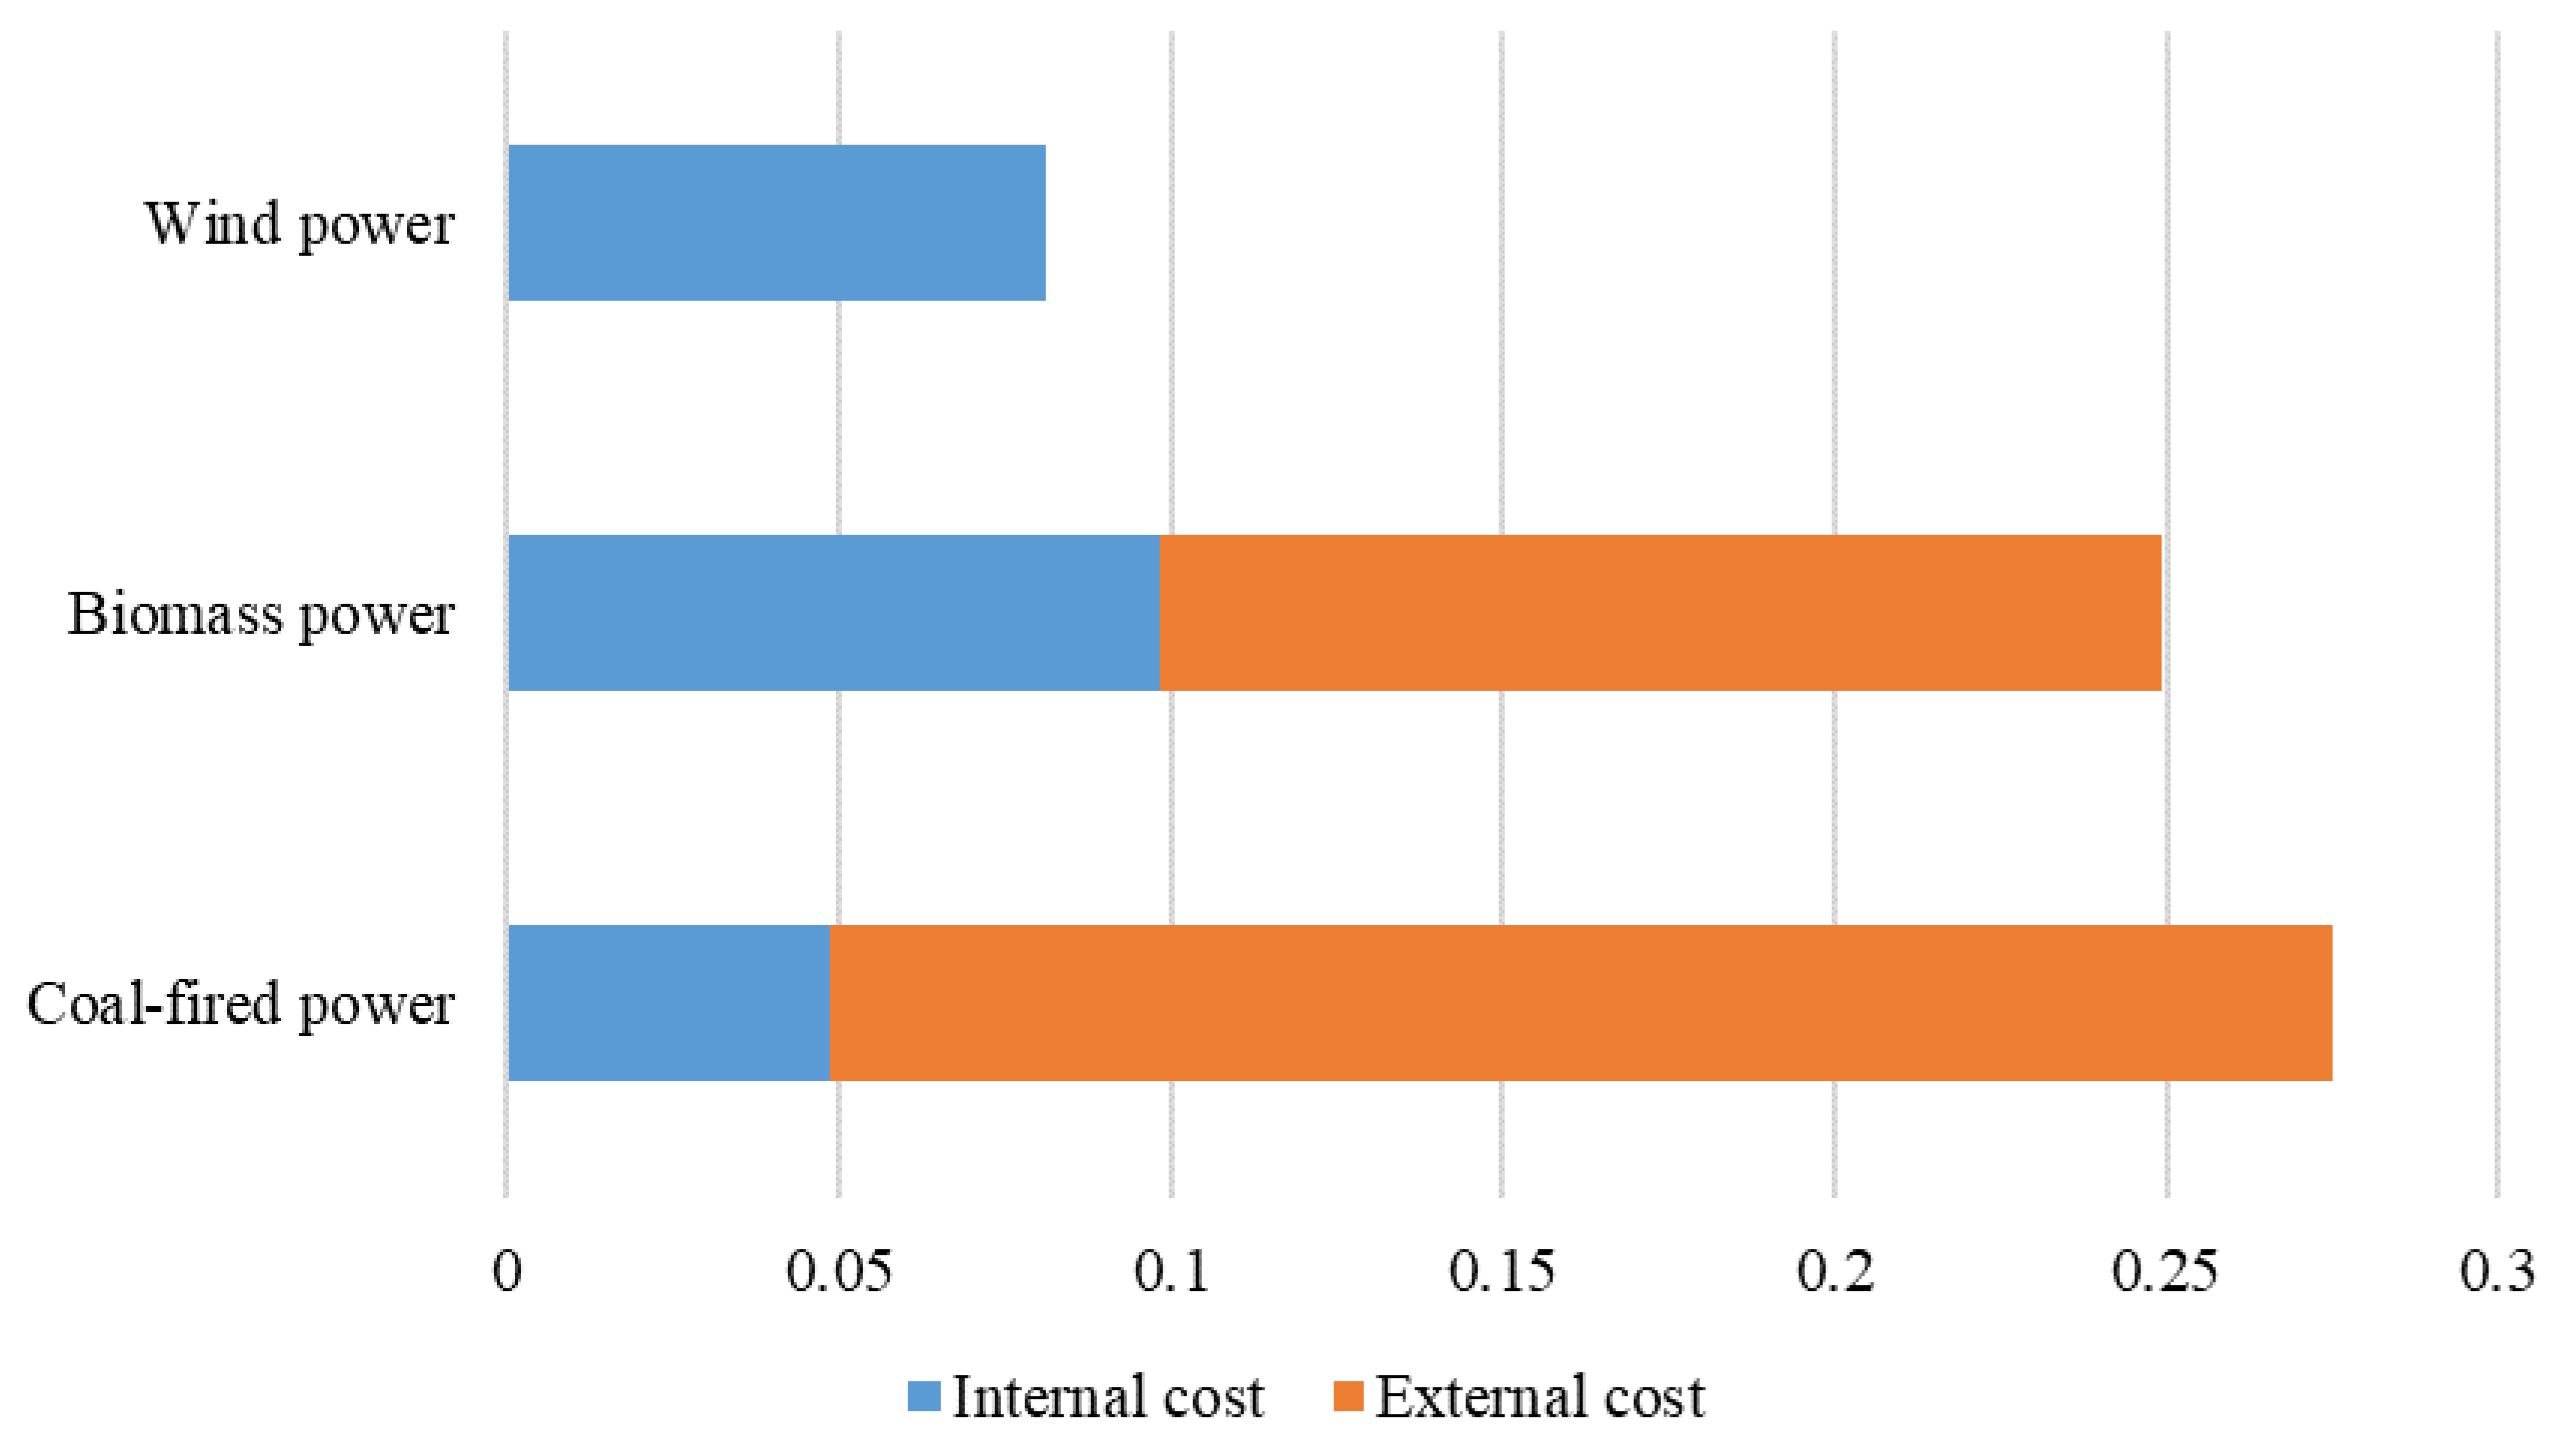
4.1. Comparisons of Life Cycle Cost
4.2. Sensitivity Analysis
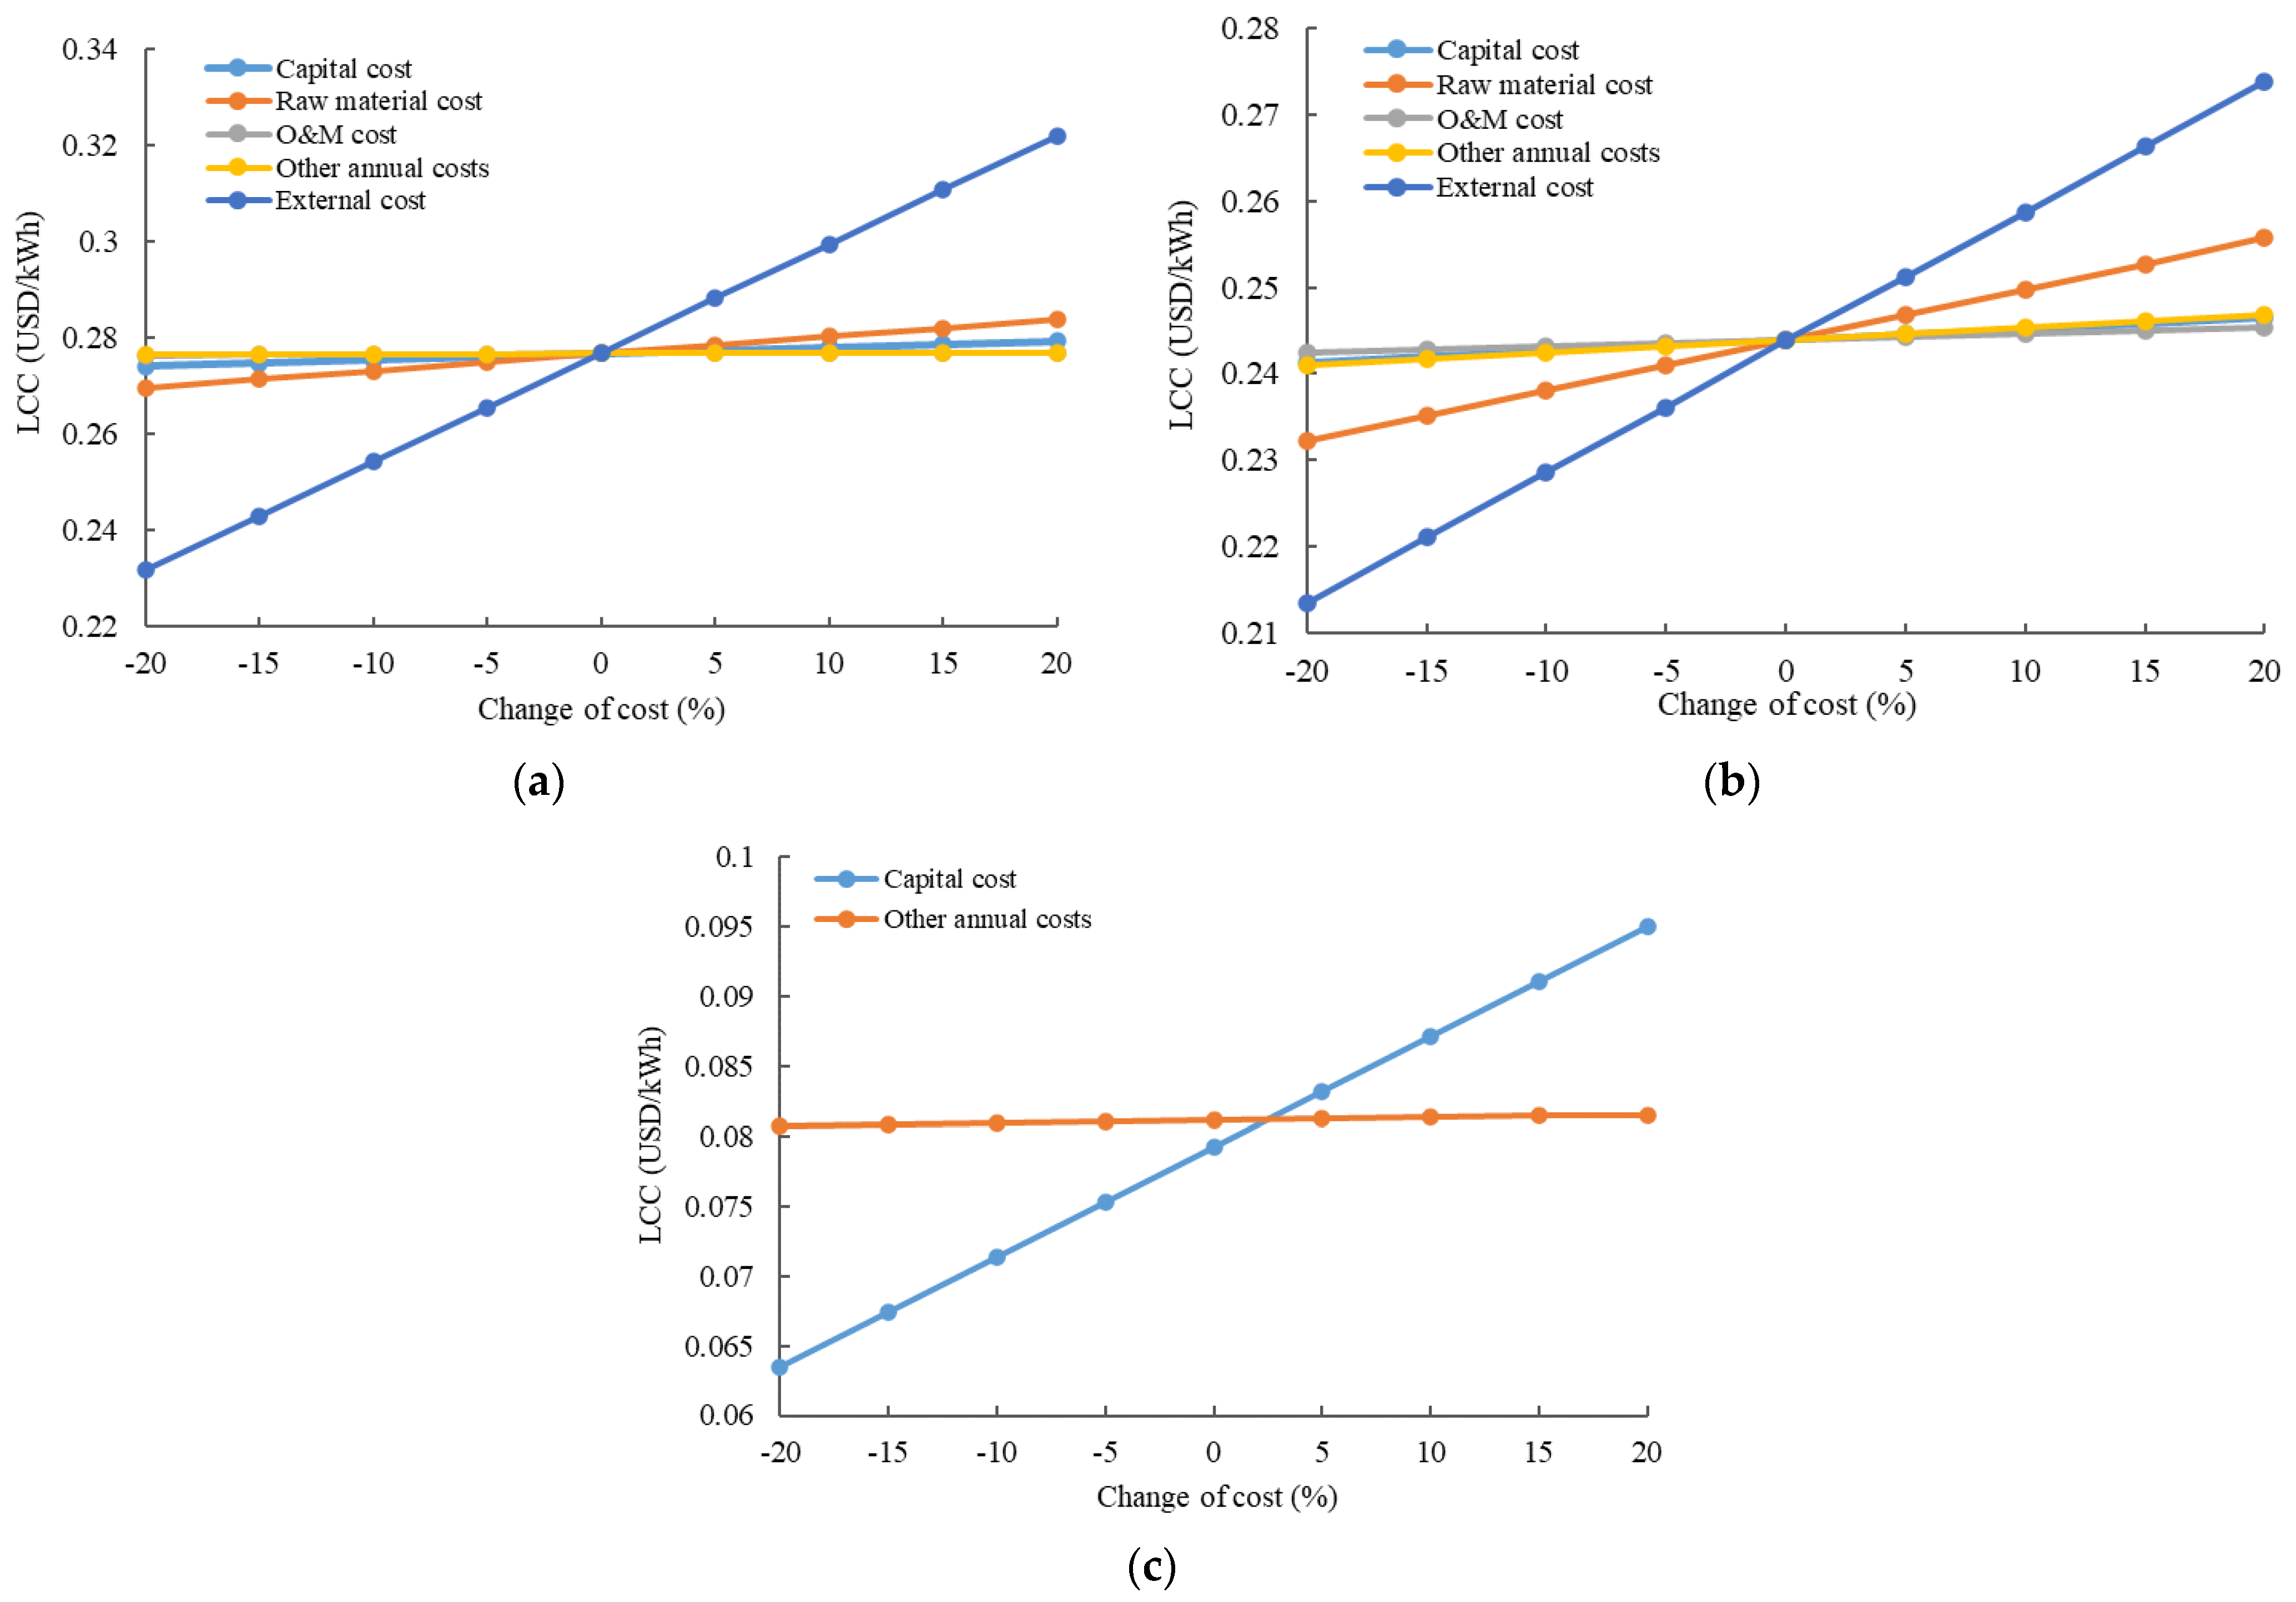
4.2.1. Sensitivity Analysis of Cost Factors
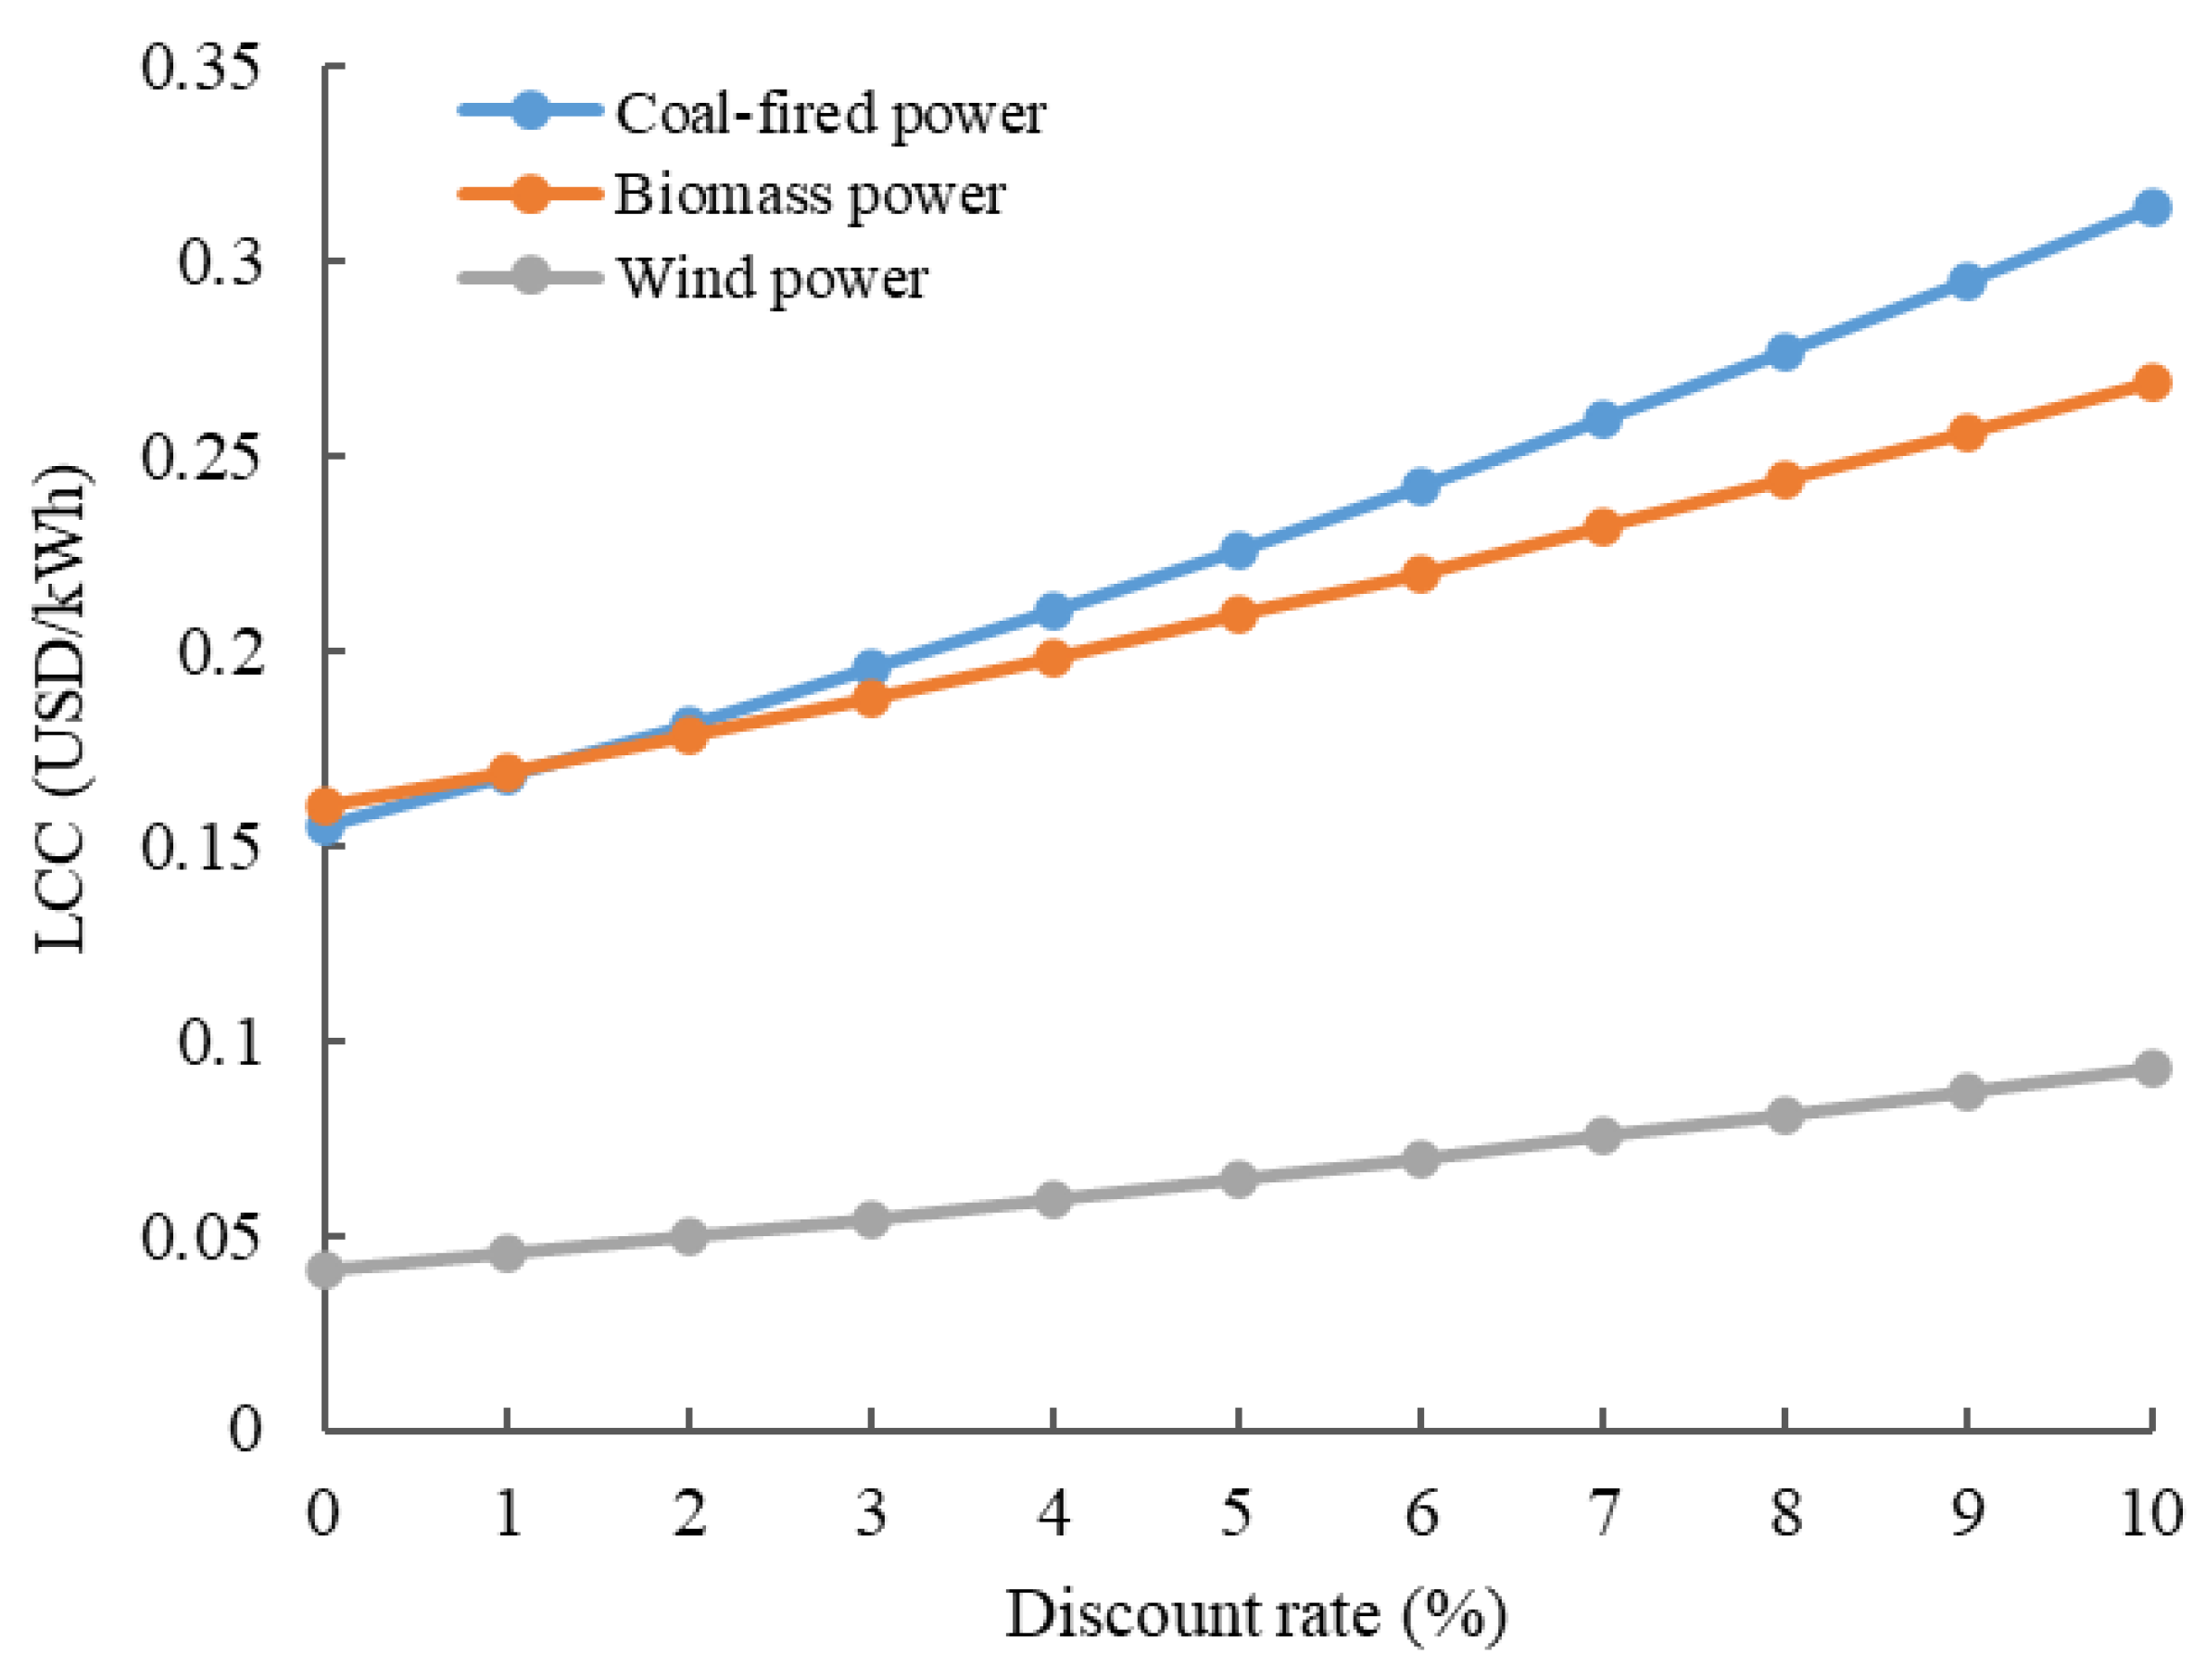
4.2.2. Sensitivity Analysis of Discount Rate
4.3. Policy Implications
5. Conclusions
Author Contributions
Funding
Institutional Review Board Statement
Informed Consent Statement
Data Availability Statement
Conflicts of Interest
References
- Simon, S.; Naegler, T.; Gils, H. Transformation towards a Renewable Energy System in Brazil and Mexico-Technological and Structural Options for Latin America. Energies 2018, 11, 907. [Google Scholar] [CrossRef]
- BP. Statistical Review of World Energy 2012–2020; BP: London, UK, 2020. [Google Scholar]
- Soni, V.; Singh, S.P.; Banwet, D.K. Sustainable coal consumption and energy production in India using life cycle costing and real options analysis. Sustain. Prod. Consum. 2016, 6, 26–37. [Google Scholar] [CrossRef]
- Gluch, P.; Baumann, H. The life cycle costing (LCC) approach: A conceptual discussion of its usefulness for environmental decision-making. Build. Environ. 2004, 39, 571–580. [Google Scholar] [CrossRef]
- Woodward, D.G. Life cycle costing—Theory, information acquisition and application. Int. J. Proj. Manag. 1997, 15, 335–344. [Google Scholar] [CrossRef]
- Santamaria, B.M.; Gonzalo, F.A.; Griffin, M.; Aguirregabiria, B.L.; Ramos, J.A.H. Life Cycle Assessment of Dynamic Water Flow Glazing Envelopes: A Case Study with Real Test Facilities. Energies 2021, 14, 2195. [Google Scholar] [CrossRef]
- Gaterell, M.R.; Lester, J.N. Establishing the true costs and benefits of environmental protection and enhancement in the aquatic environment. Sci. Total Environ. 2000, 249, 25–37. [Google Scholar] [CrossRef]
- Mehany, M.S.H.M.; Kumar, S. Analyzing the feasibility of fracking in the U.S. using macro level life cycle cost analysis and assessment approaches—A foundational study. Sustain. Prod. Consump. 2019, 20, 375–388. [Google Scholar] [CrossRef]
- Glick, S.; Guggemos, A.A. Life-Cycle Assessment and Life-Cycle Cost as collaborative tools in residential heating system selection. J. Green Build. 2010, 3, 107–115. [Google Scholar] [CrossRef]
- Xu, W.; Li, Y.; Wang, H. Full Life Cycle Cost Analysis of coal-fired and wind power generation. Industry 2014, 6, 50–55. (In Chinese) [Google Scholar]
- Kim, J.L.; Greene, M.; Kim, S. Economic impact of new green building code on residential project development from energy consumption perspectives. J. Green Build. 2014, 4, 105–124. [Google Scholar] [CrossRef]
- Georgakellos, D.A. Climate change external cost appraisal of electricity generation systems from a life cycle perspective: The case of Greece. J. Clean. Prod. 2012, 32, 124–140. [Google Scholar] [CrossRef]
- Hunkeler, D.; Lichtenvort, K.; Rebitzer, G. Environmental Life Cycle Costing; CRC Press: Boca Raton, FL, USA, 2008; pp. i–iv. [Google Scholar]
- Zhang, Q.; Zhou, D.; Zhou, P.; Ding, H. Cost Analysis of straw-based power generation in Jiangsu Province, China. Appl. Energy 2013, 102, 785–793. [Google Scholar] [CrossRef]
- Cleary, J.; Wolf, D.P.; Caspersen, J.P. Comparing the life cycle costs of using harvest residue as feedstock for small- and large-scale bioenergy systems (part II). Energy 2015, 86, 539–547. [Google Scholar] [CrossRef]
- Roth, I.F.; Ambs, L.L. Incorporating externalities into a full cost approach to electric power generation life-cycle costing. Energy 2004, 29, 2125–2144. [Google Scholar] [CrossRef]
- Nissen, U.; Harfst, N. Shortcomings of the traditional “levelized cost of energy” [LCOE] for the determination of grid parity. Energy 2019, 171, 1009–1016. [Google Scholar] [CrossRef]
- Sajid, M.U.; Bicer, Y. Comparative life cycle cost analysis of various solar energy-based integrated systems for self-sufficient greenhouses. Sustain. Prod. Consump. 2021, 27, 141–156. [Google Scholar] [CrossRef]
- Karkour, S.; Ichisugi, Y.; Abeynayaka, A.; Itsubo, N. External-Cost Estimation of Electricity Generation in G20 Countries: Case Study Using a Global Life-Cycle Impact-Assessment Method. Sustainability 2020, 12, 2002. [Google Scholar] [CrossRef]
- Allouhi, A. Energetic, exergetic, economic and environmental (4E) assessment process of wind power generation. J. Clean. Prod. 2019, 235, 123–137. [Google Scholar] [CrossRef]
- Arceo, A.; Biswas, W.K.; John, M. Eco-efficiency improvement of Western Australian remote area power supply. J. Clean. Prod. 2019, 230, 820–834. [Google Scholar] [CrossRef]
- Jin, C. The Research on Wind Power Cost Forecast and Pricing Game Model; North China Electric Power University: Beijing, China, 2019. [Google Scholar]
- Wang, C.; Zhang, L.; Zhou, P.; Chang, Y.; Zhou, D.; Pang, M.; Yin, H. Assessing the environmental externalities for biomass- and coal-fired electricity generation in China: A supply chain perspective. J. Environ. Manag. 2019, 246, 758–767. [Google Scholar] [CrossRef]
- Ko, N.; Lorenz, M.; Horn, R.; Krieg, H.; Baumann, M. Sustainability Assessment of Concentrated Solar Power (CSP) Tower Plants–Integrating LCA, LCC and LCWE in One Framework. Procedia CIRP 2018, 69, 395–400. [Google Scholar] [CrossRef]
- Liu, C.; Wang, Y.; Zhu, R. Assessment of the economic potential of China’s onshore wind electricity. Resour. Conserv. Recycl. 2017, 121, 33–39. [Google Scholar] [CrossRef]
- Rhodes, J.D.; King, C.; Gulen, G.; Olmstead, S.M.; Dyer, J.S.; Hebner, R.E.; Beach, F.C.; Edgar, T.F.; Webber, M.E. A geographically resolved method to estimate levelized power plant costs with environmental externalities. Energy Policy 2017, 102, 491–499. [Google Scholar] [CrossRef]
- Weldu, Y.; Assefa, G. The search for most cost-effective way of achieving environmental sustainability status in electricity generation: Environmental life cycle cost analysis of energy scenarios. J. Clean. Prod. 2017, 142, 2296–2304. [Google Scholar] [CrossRef]
- Gan, L.; Shek, J.K.H.; Mueller, M.A. Hybrid wind–photovoltaic–diesel–battery system sizing tool development using empirical approach, life-cycle cost and performance analysis: A case study in Scotland. Energy Convers. Manag. 2015, 106, 479–494. [Google Scholar] [CrossRef]
- Rentizelas, A.; Georgakellos, D. Incorporating life cycle external cost in optimization of the electricity generation mix. Energy Policy 2014, 65, 134–149. [Google Scholar] [CrossRef]
- Streimikiene, D.; Alisauskaite-Seskiene, I. External costs of electricity generation options in Lithuania. Renew. Energy 2014, 64, 215–224. [Google Scholar] [CrossRef]
- Amor, M.B.; Pineau, P.O.; Gaudreault, C.; Samson, R. Assessing the economic value of renewable distributed generation in the Northeastern American market. Renew. Sustain. Energy Rev. 2012, 16, 5687–5695. [Google Scholar] [CrossRef]
- Rentizelas, A.A.; Tolis, A.I.; Tatsiopoulos, I.P. Investment planning in electricity production under CO2 price uncertainity. Int. J. Prod. Econ. 2012, 140, 622–629. [Google Scholar] [CrossRef]
- Dimitrijević, Z.; Tatić, K.; Knežević, A.; Salihbegović, I. External costs from coal-fired thermal plants and sulphur dioxide emission limit values for new plants in Bosnia and Herzegovina. Energy Policy 2011, 39, 3036–3041. [Google Scholar] [CrossRef]
- Kannan, R.; Leong, K.C.; Osman, R.; Ho, H.K. Life cycle energy, emissions and cost inventory of power generation technologies in Singapore. Renew. Sustain. Energy Rev. 2007, 11, 702–715. [Google Scholar] [CrossRef]
- Kannan, R.; Tso, C.P.; Osman, R.; Ho, H.K. LCA–LCCA of oil-fired steam turbine power plant in Singapore. Energy Convers. Manag. 2004, 45, 3093–3107. [Google Scholar] [CrossRef]
- Wang, Y.; Yu, L. Can the current environmental tax rate promote green technology innovation? -Evidence from China’s resource-based industries. J. Clean. Prod. 2021, 278, 123443. [Google Scholar] [CrossRef]
- Huang, L.; Liu, S.; Han, Y.; Peng, K. The nature of state-owned enterprises and collection of pollutant discharge fees: A study based on Chinese industrial enterprises. J. Clean. Prod. 2020, 271, 122420. [Google Scholar] [CrossRef]
- Reich, M.C. Economic assessment of municipal waste management systems—case studies using a combination of life cycle assessment (LCA) and life cycle costing (LCC). J. Clean. Prod. 2005, 13, 253–263. [Google Scholar] [CrossRef]
- Li, X.; Wu, X.; Zhang, Z. Study on social WTP for environmental impacts based on the LCA theory. J. Harbin Inst. Technol. 2005, 11, 1507–1510. [Google Scholar]
- Cui, L.; Li, Y.; Tang, Y.; Shi, Y.; Wang, Q.; Yuan, X.; Kellett, J. Integrated assessment of the environmental and economic effects of an ultra-clean flue gas treatment process in coal-fired power plant. J. Clean. Prod. 2018, 199, 359–368. [Google Scholar] [CrossRef]
- Li, Y.; Yuan, X.L.; Tang, Y.Z.; Wang, Q.S.; Ma, Q.; Mu, R.M.; Fu, J.H.; Hong, J.L.; Kellett, J.; Zuo, J. Integrated assessment of the environmental and economic effects of “coal-to-gas conversion” project in rural areas of northern China. Environ. Sci. Pollut. Res. 2020, 27, 14503–14514. [Google Scholar] [CrossRef] [PubMed]
- Tang, Y.Z.; Li, Y.; Shi, Y.F.; Wang, Q.S.; Yuan, X.L.; Zuo, J. Environmental and economic impacts assessment of prebaked anode production process: A case study in Shandong Province, China. J. Clean. Prod. 2018, 196, 1657–1668. [Google Scholar] [CrossRef]
- Cui, L.; Ba, K.M.; Li, F.Q.; Wang, Q.S.; Ma, Q.; Yuan, X.L. Life cycle assessment of ultra-low treatment for steel industry sintering flue gas emissions. Sci. Total Environ. 2020, 725, 138292. [Google Scholar] [CrossRef]
- Karkour, S.; Ihara, T.; Kuwayama, T.; Yamaguchi, K.; Itsubo, N. Life Cycle Assessment of Residential Air Conditioners Considering the Benefits of Their Use: A Case Study in Indonesia. Energies 2020, 14, 447. [Google Scholar] [CrossRef]
- Ciroth, A. Cost data quality considerations for eco-efficiency measures. Ecol. Econ. 2009, 68, 1583–1590. [Google Scholar] [CrossRef]
- Swarr, T.E.; Hunkeler, D.; Klöpffer, W.; Pesonen, H.L.; Ciroth, A.; Brent, A.C.; Pagan, R. Environmental life-cycle costing: A code of practice. Int. J. Life Cycle Assess. 2011, 16, 389–391. [Google Scholar] [CrossRef]
- Soenen, C.; Reinbold, V.; Meunier, S.; Cherni, J.A.; Darga, A.; Dessante, P.; Quéval, L. Comparison of Tank and Battery Storages for Photovoltaic Water Pumping. Energies 2021, 14, 2483. [Google Scholar] [CrossRef]
- Yuan, X.L.; Tang, Y.Z.; Li, Y.; Wang, Q.S.; Zuo, J.; Song, Z.L. Environmental and economic impacts assessment of concrete pavement brick and permeable brick production brick production process—A case study in China. J. Clean. Prod. 2018, 171, 198–208. [Google Scholar] [CrossRef]
- He, K.; Huang, H. The Research Development of Carbon Emissions Trading in China. Chin. Agr. Account. 2020, 7, 78–79. [Google Scholar]
- RTCCCCS (Research Team of China Climate Change Country Study). China Climate Change Country Study; Tsinghua University Press: Beijing, China, 2000. [Google Scholar]
- CSC (China State Council). Regulations for the Implementation of the Environmental Protection Tax Law of the People’s Republic of China. 2017. Available online: http://www.gov.cn/zhengce/content/2017-12/30/content_5251797.htm (accessed on 13 May 2021).
- CSC (China State Council). Environmental Protection Tax Law of the People’s Republic of China. 2018. Available online: http://www.npc.gov.cn/npc/xinwen/2018-11/05/content_2065629.htm (accessed on 13 May 2021).
- ECPCSP (Executive Committee of the People’s Congress of Shandong Province). The Decision on the Specific Tax of Taxable Air Pollutants and Water Pollutants in Shandong Province and the Number of Taxable Pollutants to Environmental Protection Taxes Levied for the Same Discharge Outlet. 2017. Available online: http://www.sdrd.gov.cn/articles/ch00023/201712/bf29bab9-a79c-4826-8183-0063b81cf912.shtml (accessed on 13 May 2021).
- STA (State Taxation Administration). Law of the People’s Republic of China on the Occupation of Cultivated Land. 2018. Available online: http://www.chinatax.gov.cn/n810341/n810755/c3987131/content.html (accessed on 13 May 2021).
- CSC (China State Council). Measures for the Implementation of Urban Land Use Tax. 2014. Available online: http://www.gov.cn/gongbao/content/2014/content_2695319.htm (accessed on 13 May 2021).
- WRDSP (The Water Resource Department of Shandong Province). Administrative Measures for Collection and Use of Water Resources Fees in Shandong Province. 2010. Available online: http://www.sdwr.gov.cn/tszyc/szyf/201011/t20101123_1112581.html (accessed on 13 May 2021).
- CSC (China State Council). Resource Tax Law of the People’s Republic of China. 2019. Available online: http://www.gov.cn/npc/c30834/201908/d80a55c3e81d48ec861399d2c73fe0f6.shtml (accessed on 13 May 2021).
- TASP (The Taxation Administration of Shandong Province). The Table of Resource Tax Items and Rates in Shandong Province. 2020. Available online: http://www.shui5.cn/article/8b/137331.html (accessed on 13 May 2021).
- Shi, H.; Qian, Y. A review and forecast of recent international oil prices. Int. Petrol. Econ. 2020, 10, 109–112. [Google Scholar]
- STA (State Taxation Administration). Detailed Rules for the Implementation of the Provisional Regulations of the People’s Republic of China on Resource Tax. 2011. Available online: http://www.chinatax.gov.cn/n810341/n810765/n812156/n812459/c1185865/content.html (accessed on 13 May 2021).
- NBSC (National Bureau of Statistics of China). China Statistical Yearbook 2019. 2019. Available online: http://www.stats.gov.cn/tjsj/ndsj/2019/indexch.htm (accessed on 13 May 2021).
- WHO (World Health Organization). The Global Health Observatory. 2019. Available online: https://www.who.int/data/gho/indicator-metadata-registry (accessed on 13 May 2021).
- Wang, H.; Wang, K. Comparative study on comprehensive benefits of biomass and coal power generation project. J. Arid Land Resour. Environ. 2020, 34, 56–61. [Google Scholar]


| Country | LCC Calculation Methods | External Cost Quantification Model | Source |
|---|---|---|---|
| G20 | LIME3 | [19] | |
| Morocco | LCOE | [20] | |
| Australia | NPV | [21] | |
| China | LCOE | [22] | |
| China | GHG, PM2.5, SO2, NOX | [23] | |
| Germany | NPV | [24] | |
| China | LCOE | [25] | |
| USA | LCOE | GHG, SO2, NOX, PM10, PM2.5 | [26] |
| Alberta | NPV | Carbon tax | [27] |
| Canada | NPV and IRR | [15] | |
| Scotland | NPV | [28] | |
| Greece | LCOE | ExternE methodology, Impact pathway approach | [29] |
| Lithuania | ExternE methodology, Impact pathway approach | [30] | |
| China | NPV | [14] | |
| Canada | NPV | [31] | |
| Greece | ExternE methodology | [12] | |
| Greece | LCOE | Carbon trade | [32] |
| Bosnia and Herzegovina | ExternE methodology | [33] | |
| Singapore | NPV | [34] | |
| USA | LCOE | Air pollution, Resource depletion, Distribution, Securing resources and use impacts | [16] |
| Singapore | NPV | [35] |
| Items | Coal-Fired Power | Biomass Power | Wind Power |
|---|---|---|---|
| Installed capacity (MW) | 2000 | 35 | 75 |
| Electricity generation (kWh/a) | 9.97 × 10⁹ | 2.72 × 10⁸ | 6.74 × 10⁷ |
| Capital cost (million USD) | 1239 | 33.3 | 52.3 |
| Raw material cost (million USD/a) | 339.4 | 15.98 | / |
| O&M cost (million USD/a) | 4.96 | 1.96 | / |
| Other annual cost (million USD/a) | 12.4 | 3.94 | 0.14 |
| Number of employees | 1541 | 102 | 17 |
| Material | Input/Output | Unit | Overall Consumption | Consumption per kWh | Unit Price (USD) | Annual Total Cost (USD) |
|---|---|---|---|---|---|---|
| Coal | Input | t | 4,048,033 | 4.0602 × 10⁻⁴ | 80.274 | 324,965,721.5 |
| Diesel | Input | t | 761 | 7.6329 × 10⁻⁸ | 963.329 | 733,093.5714 |
| Water | Input | m3 | 16,404,421 | 1.6454 × 10⁻³ | 0.161 | 2,633,809.807 |
| Electricity | Input | 104 kWh | 65,322.24 | 6.5519 × 10⁻² | 0.064 | 4195.1217 |
| Limestone | Input | t | 229,539 | 2.3023 × 10⁻⁵ | 11.239 | 2,579,752.424 |
| Liquid ammonia | Input | t | 5727 | 5.7442 × 10⁻⁷ | 353.221 | 2,022,895.126 |
| V-W-TiO2 | Input | m3 | 3219 | 3.2287 × 10⁻⁷ | 1894.548 | 6,098,548.584 |
| Hydrochloric acid | Input | t | 1998 | 2.0040 × 10⁻⁷ | 91.516 | 182,849.528 |
| NaOH | Input | t | 1833 | 1.8385 × 10⁻⁷ | 112.388 | 206,007.9635 |
| Particulate matter | Output | t | 176.68 | 1.7721 × 10⁻⁸ | ||
| SO2 | Output | t | 1088.305 | 1.0916 × 10⁻⁷ | ||
| NOx | Output | t | 1480.495 | 1.4850 × 10⁻⁷ | ||
| Mercury and its compounds | Output | kg | 23 | 2.3069 × 10⁻⁹ | ||
| Waste water | Output | m3 | 2,589,573 | 2.5974 × 10⁻⁴ | ||
| COD | Output | t | 134.40 | 1.3480 × 10⁻⁸ | ||
| Ammonia nitrogen | Output | t | 11.70 | 1.1735 × 10⁻⁹ | ||
| Electricity | Output | kWh | 9.97 × 10⁹ |
| Material | Input/Output | Unit | Overall Consumption | Consumption per kWh | Unit Price (USD) | Annual Total Cost (USD) |
|---|---|---|---|---|---|---|
| Straw | Input | t | 163,900 | 6.0257 × 10⁻⁴ | 48.166 | 7,894,407 |
| Branch | Input | t | 42,600 | 1.5662 × 10⁻⁴ | 48.166 | 2,051,872 |
| Electricity | Input | kWh | 2.7216 × 10⁷ | 0.10006 | 0.064 | 1,741,824 |
| Coal | Input | t | 50,159.48 | 1.8441 × 10⁻⁴ | 80.277 | 4,026,653 |
| Limestone | Input | t | 19,352 | 7.1147 × 10⁻⁵ | 11.239 | 217,497.1 |
| Intermediate water | Input | t | 830,000 | 3.0515 × 10⁻³ | 0.048 | 39,840 |
| Tap water | Input | t | 3600 | 1.3235 × 10⁻⁵ | 0.369 | 1328.4 |
| Particulate matter | Output | t | 17.54 | 6.4485 × 10⁻⁸ | ||
| SO2 | Output | t | 59.4 | 2.1838 × 10⁻⁷ | ||
| NOx | Output | t | 119.3 | 4.3860 × 10⁻⁷ | ||
| NH3 | Output | t | 0.8 | 2.9412 × 10⁻⁹ | ||
| Electricity | Output | kWh | 2.74 × 10⁸ |
| Impact Category | Unit | Economic Value Conversion Factor (USD) | Coal-Fired Power Generation | Biomass Power Generation | ||
|---|---|---|---|---|---|---|
| Total (/kWh) | External Cost (USD/kWh) | Total (/kWh) | External Cost (USD/kWh) | |||
| Climate change | kg CO2 eq | 0.03 | 0.4679 | 0.0140 | 0.2972 | 8.9150 × 10⁻³ |
| Terrestrial acidification | kg SO2 eq | 1.01 | 2.5551 × 10⁻³ | 2.5807 × 10⁻³ | 1.6670 × 10⁻³ | 1.6840 × 10⁻³ |
| Freshwater eutrophication | kg P eq | 4.48 | 1.9601 × 10⁻⁴ | 8.7810 × 10⁻⁴ | 9.6800 × 10⁻⁵ | 4.3400 × 10⁻⁴ |
| Marine eutrophication | kg N eq | 1.40 | 1.1717 × 10⁻⁴ | 1.6404 × 10⁻⁴ | 3.8600 × 10⁻⁵ | 5.4000 × 10⁻⁵ |
| Terrestrial ecotoxicity | kg 1,4-DB eq | 11.24 | 4.1252 × 10⁻⁶ | 4.6370 × 10⁻⁵ | 5.0200 × 10⁻⁶ | 5.6400 × 10⁻⁵ |
| Freshwater ecotoxicity | kg 1,4-DB eq | 11.24 | 3.5302 × 10⁻³ | 0.0397 | 1.8690 × 10⁻³ | 0.0210 |
| Marine ecotoxicity | kg 1,4-DB eq | 11.24 | 3.3678 × 10⁻³ | 0.0379 | 1.7870 × 10⁻³ | 0.0201 |
| Agricultural land occupation | m2a | 0.163 | 0.0236 | 3.8514 × 10⁻³ | 0.0928 | 0.0151 |
| Urban land occupation | m2a | 0.114 | 0.0107 | 1.2146 × 10⁻³ | 0.0067 | 7.6700 × 10⁻⁴ |
| Natural land transformation | m2 | 3.26 | 4.8533 × 10⁻⁵ | 1.5822 × 10⁻⁴ | 3.4500 × 10⁻⁵ | 1.1200 × 10⁻⁴ |
| Water depletion | m3 | 0.06 | 2.3629 × 10⁻³ | 1.4177 × 10⁻⁴ | 3.3670 × 10⁻³ | 2.0200 × 10⁻⁴ |
| Metal depletion | kg Fe eq | 0.0048 | 5.9180 × 10⁻³ | 2.8406 × 10⁻⁵ | 3.4420 × 10⁻³ | 1.6500 × 10⁻⁵ |
| Fossil depletion | kg oil eq | 0.027 | 0.2535 | 6.8435 × 10⁻³ | 0.1336 | 3.6070 × 10⁻³ |
| Ozone depletion | DALY | 9309.70 | 8.3400 × 10⁻¹² | 7.7643 × 10⁻⁸ | 1.1600 × 10⁻¹¹ | 1.0800 × 10⁻⁷ |
| Photochemical oxidant formation | DALY | 9309.70 | 3.6000 × 10⁻¹¹ | 3.3515 × 10⁻⁷ | 2.4100 × 10⁻¹¹ | 2.2400 × 10⁻⁷ |
| Particulate matter formation | DALY | 9309.70 | 2.8000 × 10⁻⁷ | 2.6067 × 10⁻³ | 1.7900 × 10⁻⁷ | 1.6660 × 10⁻³ |
| Human toxicity | DALY | 9309.70 | 1.0800 × 10⁻⁷ | 1.0054 × 10⁻³ | 4.6600 × 10⁻⁸ | 4.3400 × 10⁻⁴ |
| Ionising radiation | DALY | 9309.70 | −1.0000 × 10⁻¹¹ | −9.3097 × 10⁻⁸ | 3.4500 × 10⁻¹¹ | 3.2100 × 10⁻⁷ |
| Total | 0.111 | 0.074 | ||||
Publisher’s Note: MDPI stays neutral with regard to jurisdictional claims in published maps and institutional affiliations. |
© 2021 by the authors. Licensee MDPI, Basel, Switzerland. This article is an open access article distributed under the terms and conditions of the Creative Commons Attribution (CC BY) license (https://creativecommons.org/licenses/by/4.0/).
Share and Cite
Yuan, X.; Chen, L.; Sheng, X.; Liu, M.; Xu, Y.; Tang, Y.; Wang, Q.; Ma, Q.; Zuo, J. Life Cycle Cost of Electricity Production: A Comparative Study of Coal-Fired, Biomass, and Wind Power in China. Energies 2021, 14, 3463. https://doi.org/10.3390/en14123463
Yuan X, Chen L, Sheng X, Liu M, Xu Y, Tang Y, Wang Q, Ma Q, Zuo J. Life Cycle Cost of Electricity Production: A Comparative Study of Coal-Fired, Biomass, and Wind Power in China. Energies. 2021; 14(12):3463. https://doi.org/10.3390/en14123463
Chicago/Turabian StyleYuan, Xueliang, Leping Chen, Xuerou Sheng, Mengyue Liu, Yue Xu, Yuzhou Tang, Qingsong Wang, Qiao Ma, and Jian Zuo. 2021. "Life Cycle Cost of Electricity Production: A Comparative Study of Coal-Fired, Biomass, and Wind Power in China" Energies 14, no. 12: 3463. https://doi.org/10.3390/en14123463
APA StyleYuan, X., Chen, L., Sheng, X., Liu, M., Xu, Y., Tang, Y., Wang, Q., Ma, Q., & Zuo, J. (2021). Life Cycle Cost of Electricity Production: A Comparative Study of Coal-Fired, Biomass, and Wind Power in China. Energies, 14(12), 3463. https://doi.org/10.3390/en14123463