Article

A Novel Optimization Method for a Multi-Year Planning Scheme of an Active Distribution Network in a Large Planning Zone

School of Electrical and Electronic Engineering, Huazhong University of Science and Technology, Wuhan 430074, China
*
Author to whom correspondence should be addressed.
Energies 2021, 14(12), 3450; https://doi.org/10.3390/en14123450
Submission received: 24 May 2021 / Revised: 4 June 2021 / Accepted: 8 June 2021 / Published: 10 June 2021
(This article belongs to the Special Issue Sector Coupling for Sustainable Urban and Regional Energy Systems)

Abstract

:
Electric power distribution networks plays a significant role in providing continuous electrical energy to different categories of customers. In the context of the present advancements, future load expansion in the active distribution networks (ADNs) poses the key challenge of planning to be derived as a multi-stage optimization task, including the optimal expansion planning scheme optimization (EPSO). The planning scheme optimization is a multi-attribute decision-making issue with high complexity and solving difficulty, especially when it involves a large-scale planning zone. This paper proposes a novel approach of a multi-year planning scheme for the effective solution of the EPSO problem in large planning zones. The proposed approach comprises three key parts, where the first part covers two essential aspects, i.e., (i) suggesting a project condition set that considers the elements directly related to a group of specific conditions and requirements (collectively referred to as conditions) to ADN planning projects; and (ii) Developing a condition scoring system to evaluate planning projects. The second part of our proposed scheme is a quantization method of correlativity among projects based on two new concepts: contribution index (CI) and dependence index (DI). Finally, considering the multi-year rolling optimization, a detailed mathematical model of condition evaluation and spatiotemporal optimization sequencing of ADN planning projects is developed, where the evaluation and optimization are updated annually. The proposed model has been successfully validated on a practical distribution network located in Xiantao, China. The investigated case study and comparisons verify the various advantages, suitability, and effectiveness of the proposed planning scheme, consequently saving more than 10% of the investment compared with the existing implemented scheme.

Graphical Abstract

1. Introduction

The distribution network is an essential subpart of the power system, which takes the electric power from transmission lines and makes it available for customer’s utilization. The growing electricity demands escalated the utilization of electric power. In practical active distribution networks (ADNs), the long-distance of feeders, load expansions, and seasonal load variations seriously affect the voltage quality and the power reliability of the distribution systems. Researchers around the globe appreciated the integration of distributed generations (DGs) due to privileged prices, low carbon emissions, and other technical benefits. As reported in reference [1], the emerging trend of DG-integrated distribution networks offers various techno–economic benefits. Moreover, long-term planning optimization, such as the multi-year expansion planning of ADNs, plays an important role toward techno–economic benefits augmentation. The multi-year expansion planning in ADNs is a multi-stage optimization task to be solved optimally. Generally, it consists of three stages: the investigation of load growth and distributed generation expansion over the planning period in the planning zone, the design of annual expansion planning schemes coordinated with the previous distribution networks, and the expansion planning scheme optimization (EPSO). The complexity of the multi-year EPSO problem escalates in the larger planning zone. The multi-attribute decision-making issue is not simply to screen out the necessary projects from the project library recommended in the expansion planning scheme design stage but also to simultaneously optimize the spatiotemporal sequence of the projects selected. Meanwhile, among some projects in an ADN expansion planning scheme, there are several relationships, such as the advent of a new substation and its corresponding substation supporting project.
In recent years, the investment in distribution network expansion has substantially increased, and several studies have been presented concerning the ADN planning optimization strategies [2]. For instance, in the conventional distribution networks, the classical expansion strategies include expanding or constructing substations, reinforcing or constructing feeders, and installing new normally opened switches (NO), etc. Furthermore, it can be argued that ADNs need intelligent strategies that should also be taken into consideration [3,4], including but not limited to the installation of new DG units [5,6,7], distributed energy storage (DES) units [8,9], or the integration of electric vehicles [10]. However, most of the ADN planning models aim to satisfy load growth and constraints while maximizing the investment interests of grid companies [11,12,13]. The planning optimization of ADNs concerning various factors and benefits are investigated by the researchers, such as in reference [14], the reliability, economic efficiency, operating performance, and technical feasibility are considered the main criteria for the planning, and the game theory algorithm is adopted to find the best compromise solution. In [15], authors focused on economic benefits and environmental benefits and used the Pareto front planning approach to represent different optimum points, among which the distribution company can choose on its preferences. The authors in [16] considered reliability and economic aspects by jointly regarding reliability, investment, and operating costs, with the planning problem being turned into mixed integer programming. In [17], the planning objective was to minimize the voltage deviation as well as active and reactive power losses. The Analytic Hierarchy Process (AHP) and its modified methods are widely employed to construct a comprehensive evaluation index system to analyze individual projects [18,19,20,21,22]; likewise, investment project portfolios [23,24] are presented to determine and investigate the optimal investment plan from the analysis results. The authors in [20] established an evaluation index system from perspectives of project implementation effect and project construction. The planning problem of the electric power system was addressed in reference [21] and proposed a hierarchical decision-making structure considering economic attributes, technical attributes, environmental attributes, and regional primary energy attributes. The authors in [23,24] developed the index system for project portfolio in terms of reliability, economy, adaptability, coordination, etc. Reference [24] brings disaster-resisting factors into the assessment indices.
The above survey shows that choosing appropriate strategies and developing a reasonable investment schedule for the selected ones is crucial for ADN planning. However, it is worth mentioning that the existing research concerning the optimization of ADN planning has not yet formed a comprehensive and unified evaluation index system for planning projects and has not considered the mutual influence and interdependence between different planning projects. Besides, most of the optimization goals are limited to maximizing the investment benefits of grid companies, and the research on the solution method is mainly limited to specific scenarios. In addition, the mentioned models based on AHP and modified AHP are static models, which involve only one planning horizon and lack the integrated layout of long-term investment strategies. To address the above-stated challenges, this paper focuses on EPSO and proposes a novel method for multi-year planning considering the various features including evaluation, time and locality prioritization, and optimal scheduling of ADN planning projects. The proposed approach aims to obtain the maximum benefit of the overall social resources in the planning area rather than to maximize the economic efficiency of the grid company or another particular investor. The evaluation of ADN projects includes boundary condition evaluation for individual projects, dominant condition evaluation for single projects, and spatiotemporal correlation evaluation between different planning projects. Furthermore, we developed a novel planning model based on the sequence optimization concerning to the project time and locality for ADN projects implementing a new idea of rolling planning and optimization.
The main novelties and contributions of this paper are listed as follows:
  • Propose the concepts of the boundary condition and dominant condition and put forward the corresponding evaluation method to assess the ideal performance of individual projects.
  • Propose the concepts of the contribution index (CI) and dependence index (DI) to quantify the correlation among ADN planning projects.
  • Propose a methodology to prioritize the planning projects during the planning period in conjunction with an assessment of individual projects and an assessment of the correlation among the projects.
  • Put forward a rolling optimization strategy for multi-year ADN planning, where the project library, project conditions, and project correlation are updated annually. Therefore, the proposed optimization model can be adapted to long-term planning problems.
The rest of this paper is organized as follows. In Section 2, the critical investment conditions of ADN projects are analyzed, and the boundary condition evaluation and dominant condition evaluation methods are introduced. Section 3 describes the spatiotemporal correlation between different planning projects and proposes a correlation evaluation method based on the improved PageRank algorithm. Section 4 presents the optimization decision-making model of ADN projects. The results of verification for the appropriateness of the proposed approach are given in Section 5. Finally, the paper is concluded in Section 6.

2. Condition Set and Condition Scoring of ADN Planning Projects

2.1. Definitions of Conditions of ADN Planning Projects

In order to assess each project in an ADN planning scheme or in the recommended project library, it is a common measure to use a set of orthogonal features to describe projects. In this paper, the orthogonal feature set is called a ‘Condition Set’, and the elements of the set are referred to as ‘Conditions’. Hence, it is essential to give a clear explanation of the conditions of ADN planning projects. It is easy to understand that for the decision-making to elect any of the ADN planning projects, there are certainly multiple positive or negative factors from user requirements, environmental protection policies or other aspects. Here, all of these factors are collectively named the ‘Condition’. Based upon set theory, the key factors that impact ADN investment efficiency can be summarized into the following seven subsets.
(1)
Policy:
In response to the enormous threat to sustainable development posed by the extensive use of fossil energy, governments have implemented a number of policies to facilitate energy transition, which should be considered in the planning process. For example, low-carbon policies include renewable production tax credits, carbon taxes, and national CO2 cap-and-trade [25].
(2)
Renewable energy development plan:
The U.S. plans to supply 80% of total electricity generation from renewable power generation (RPG) by 2050; Europe and North Africa plan to achieve a 2050 goal of 100% RPG; China has two “50%” targets, namely, to supply 50% of its primary energy from non-fossil fuels and to make electricity account for more than 50% of energy end-use by 2050 [26,27].
(3)
Regional economic and social development planning:
ADN planning is part of urban planning and needs to be coordinated with urban development, including the population, land layout, social and economic development, etc. Besides, reasonable reserve capacity should be considered for power balance based on load forecasting according to urban development planning.
(4)
Environmental protection requirements:
During the planning, design, construction, and transformation of the distribution network, the needs of energy-saving, loss reduction, and ecological protection shall be met, including but not limited to the selection of energy-saving equipment, the implementation of loss reduction measures, the optimization of the network structure, the rational allocation of reactive power compensation equipment and the taking of necessary prevention and control measures for noise, electromagnetic environment, wastewater, and other pollution factors.
(5)
The development scale and technical equipment level of the existing distribution network in the planning area.
(6)
Development plan of the grid company.
(7)
The scale of ADN investment.
The total amount of investment, the source of funds, the total volume of the projects, the timing of investment, and other practical operational factors determine the scale of the distribution network investment and are essential constraints in developing a distribution network investment plan.
A specific investment condition may be an element in two or more subsets simultaneously. For example, incentive policies for renewable energy development belong to both subset one and subset two. On the other hand, the influence of different investment conditions on the performance of projects may differ significantly. Therefore, in this paper, the factors with strong relevance to the investment results are identified by the investment correlation analysis method [28]. Then, through preliminary decoupling, the boundary conditions and the dominant conditions are summarized.

2.2. Boundary Conditions

Boundary conditions are a set of mandatory indexes (MI) and veto indexes (VI), which can directly determine whether a project must be approved to be implemented. Mandatory conditions must be satisfied in the distribution network construction process, such as solving the electricity problem of the population without electricity and supplying electricity to national key construction projects. In particular, for projects with a deadline for commissioning, it is necessary to ensure that they are invested and put into operation on time. Veto conditions mainly include restriction indexes. For instance, new substations must not be located on important mineral deposits and should avoid flammable and explosive places.
The boundary condition evaluation provides a preliminary screening of projects to obtain the initial project database.

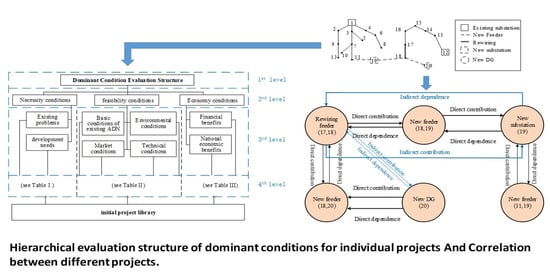
2.3. Dominant Conditions

Dominant conditions have an important impact on the investment efficiency of distribution network projects, and the corresponding four-level hierarchical evaluation structure is shown in Figure 1. The first level is the purpose of this evaluation structure, i.e., to conduct an assessment of the dominant conditions of individual projects. In the second level, the dominant conditions are classified into three main categories: necessity conditions, feasibility conditions, and economy conditions. In the third level, these three categories of conditions are divided into sub-conditions, which are further subdivided in the fourth level. The details of level three and level four are shown in the following tables.
(1)
Necessity: the necessary condition is used to analyze the severity and urgency of the problem addressed by a distribution network project and the extent to which this project can resolve or improve the problem. The necessary condition evaluation of the distribution network project is mainly carried out from two aspects: the existing problems and the development needs, as shown in Table 1.
(2)
Feasibility: the purpose of feasibility evaluation is to analyze the possibility of successful project implementation. The feasibility conditions shown in Table 2 are clustered into four categories.
(3)
Economy: the economic condition assessment analyzes and calculates the inputs and outputs of the distribution network projects, thereby measuring the economic reasonableness and economic benefits of the suggested project. The economic condition evaluation of distribution network projects includes two levels: from the perspective of the power company, calculate the financial benefits and expenses, whereby planners can evaluate the financial rationality of the project; from the perspective of the overall economic benefits of the planning area, analyze the project’s contribution to the national economy, thereby evaluating the macroeconomic rationality of the project. The set of economic conditions is displayed in Table 3.
In order to describe the planning problem from multiple sides, the above three dominant condition sets may have some redundancy. During the actual planning process, it is necessary to select a set of irrelevant or approximate irrelevant dominant conditions to build the hierarchical evaluation structure, taking into account the practical requirements and the completeness principle.

2.4. Principle of Condition Scoring

(1)
Improved method for weight calculation
A modified AHP method combined with the Delphi method is employed to calculate the weights for each level of the hierarchical evaluation structure of dominant condition, and the detailed procedure is as follows.
Supposing there are n conditions in a level, request m experts to construct m (m ≥ 5) judgment matrices through the pairwise comparison matrices method [21]. Let the judgment matrix given by the kth (k = 1, 2,…,m) expert be A k = { a i j , k } n × n , and the mean matrix be A ¯ = { a ¯ i j } n × n = { k = 1 m a i j , k / m } n × n . If there is an element a i j , k that deviates from a ¯ i j more than the threshold value (50% is desirable), the opinions should be summarized and fed back to the experts for modification. Repeat until the dispersion level meets the requirement and note the corresponding mean matrix as A . The positive reciprocal judgment matrix is A = { a i j } n × n , where
{ a i j = a ¯ i j             a ¯ i j 1 a i j = 1 / a ¯ j i       a ¯ i j < 1 i , j = 1 , 2 , , n
Check the consistency of A. If the consistency ratio is less than 0.1, the weight of each condition can be obtained from A w = λ max w , where λ max is the maximum eigenvalue and w is the corresponding eigenvector; otherwise, A needs to be corrected:
(a)
Calculate the interference matrix P
p i j = ( a i j w i w j ) / w i w j ( i , j = 1 , 2 , , n )
where wi and wj are elements of w = ( w 1 , w 2 , , w n ) T .
(b)
If P is a zero matrix, then A has complete consistency. By contrast, the larger the pij, the greater the influence of the corresponding aij on the inconsistency of A. Find out | p s t | = | p i j | max ( i , j = 1 , 2 , , n ) , and record the values of s and t.
(c)
Modify A and obtain matrix G = {gij}n×n through (3)
g s t = { 1 / ( 1 / a s t + 0.5 ) , p s t > 0   &   a s t < 1 a s t 0.5 , p s t > 0   &   a s t > 1 1 / ( 1 / a s t 0.5 ) ,   p s t < 0   &   a s t < 1 a s t + 0.5 , p s t < 0   &   a s t > 1 g i j = { 1 / g s t , i = t , j = s a i j , i , j s , t i , j = 1 , 2 , , n  
(d)
Check the consistency of this modified judgment matrix G. If G passes the check, the weights can be solved directly by the eigenvalue method; if it fails the check, return to step (b). If the verification still fails after four revisions, consider rebuilding the judgment matrix A.
It is worth noting that the selected experts should include specialists and engineers with sufficient experience in the three fields of distribution network planning, distribution network operation, and planning project construction.
(2)
Calculation of the dominant condition score considering different planners’ opinions.
The fuzzy comprehensive evaluation method is adopted to score the bottom-level elements in the hierarchical evaluation structure, so that the basic data of these conditions can be converted into intuitive scoring values. Set a five-level comment set as{Excellent (100–85), Good (84–70), Satisfactory (69–60), Weak (59–40), Poor (below 39)}. According to the proposed comment set, require l(l ≥ 5) ADN planners to grade the n bottom elements that are subordinate to the same upper element, under the assumption that the project being scored is fully functional. The corresponding fuzzy membership matrix is F = {fij}n×5 = {lij/l}n × 5, where lij represents the number of planners who rate the ith condition as the jth level of the comment set. Simultaneously, the average score of condition i in each level is calculated as the matrix I n ¯ i = ( I n ¯ i , 1 , I n ¯ i , 2 , I n ¯ i , 3 , I n ¯ i , 4 , I n ¯ i , 5 ) . The final score of the ith bottom condition I N i that considers the opinions of l planners can be calculated by (4).
I N i = F i ( I n i ¯ ) T
where Fi is the ith row of the matrix F.
Then, the score of the related upper element given by the l planners is
I N = i = 1 n w i I N i
where wi is the weight coefficient of the ith bottom element.
If, for a particular project, only part of the conditions in the hierarchical evaluation structure is meaningful, namely, there exists at least one upper-level element whose lower-level elements have a sum of weights less than one, then the planners’ score of this upper-level element is as (6) shows.
I N = i = 1 q w i I N i / ( 1 i = 1 q w i )
where q indicates the number of lower-level elements that are valid for the project being analyzed.
Through upward calculation in each level with formula (5) or (6), the dominant condition scores of all projects can be obtained. Record the dominant condition score of the ith project as DSi.

3. Quantization Method with Correlations for ADN Planning Projects

The ADN planning projects correlate with several certain items or other projects, where the necessary correlation between the elements needs to be identified. In order to describe the interrelated and mutually influential relationship between ADN construction projects, this paper proposes the concept of correlation evaluation and uses it to optimize distribution network planning. Correlation assessment includes the dependence index and contribution index. DI refers to the extent to which the implementation of a distribution network project and its role after implementation depends on the performance of other projects; CI refers to the degree to which the performance of a distribution network project contributes to the implementation of other projects and their post-implementation effects. Dependence and contribution have two forms, direct and indirect.
Take the planning scheme shown in Figure 2 as an example. In the existing distribution network, transformer 1 has an overload problem, nodes 11, 17, and 18 suffer low voltage problems, line (17,18) needs to be reconfiguring, and a new business center is planned at Node 18. To solve these existing challenges and meet the new load demand, six projects (1–6) are considered: new feeders (11,19), (18,19), (19,20), a reconfiguring feeder (17,18), a new substation to be installed at node 19, along with DG unit at node 20 that needs access to the ADN.
The benefits of the substation construction project (proj.5) depend on the completion of the substation supporting project (proj.2). If proj.2 has not yet been completed, then proj.5 will not be fully functional even if it is put into operation itself. Thus, there is a direct dependence from proj.5 to proj.2, and a direct contribution from proj.2 to proj.5. There is also a similar relationship between proj. 2 and proj.4. Therefore, proj.4 has an indirect contribution to proj.5, while the latter has an indirect dependence on the former. The accurate correlations between the six projects are illustrated in Figure 3.
In addition, the actual distribution network planning requires the optimal planning of different voltage levels. Therefore, the possible correlations between cross-voltage ADN projects need to be taken into account.
Obviously, a project has a higher contribution score if it contributes to other high contribution score items or contributes to more items. Similarly, if a project depends on high-dependence score items or depends on more items, its dependence score would be higher. To translate these characteristics into mathematical equations, this paper introduces the PageRank method.
PageRank is a searching ranking algorithm that measures the relative importance of pages [29]. The importance of a page (its PageRank score) is the sum of the PageRank scores of its backlinks, which can perfectly match the characteristics of correlation scores. To guarantee convergence to a unique, positive steady-state correlation vector, an improved PageRank algorithm [30] is adopted, based on which the calculation method of the correlation score is proposed. Take the calculation process of contribution score as an example:
(a)
Set the total contribution value of all projects as CVT, and the initial contribution value of each project in the initial project library ϕ as CVT/N:
C S i 0 i ϕ = C V T / N
where C S i 0 is the original contribution score of project i, N is the number of projects in the initial project library.
(b)
According to formula (8), perform iterative calculation of the correlation score until iterates have converged.
C S i k i ϕ = ( 1 σ ) N + σ h j i C S j k 1 h j i = { 1 P o u t ( j ) , P o u t ( j ) > 0   &   j γ ( i ) 0 , P o u t ( j ) > 0   &   j γ ( i ) 1 N , P o u t ( j ) = 0
where C S i k is the contribution score of project i in the kth iteration, γ ( i ) is the set of projects that have a direct dependence on project i, h j i is the element of the Google matrix in correlation evaluation, P o u t ( j ) is the number of projects that project j directly depends on, and σ is the damping coefficient, which is usually set as 0.85.
Transform γ ( i ) into the set of projects that contribute directly to project i, and set P o u t ( j ) as the number of projects that project j directly contributes to; then, the dependence score of project i can be derived from the above process. In practical ADN planning, either the contribution score or dependence score can be arbitrarily chosen to discuss the correlation between different ADN projects. This paper uses the contribution score to quantify the correlations between different projects, and the dependence is used to calculate the actual dominant condition score for individual projects, which is discussed in Section 3.

4. Rolling Optimization Strategy of ADN Multi-Year Planning Scheme

4.1. The Rolling Optimization Process

As mentioned in Section 3, the boundary condition evaluation provides an initial project library, and for those projects that pass the boundary condition screening, their dominant condition scores and correlation scores need to be calculated to decide whether and when to invest. Combining the idea of rolling optimization, the above process would be repeated every year in the planning horizon, and the investment scheme for the next year is optimized based on the previous investment status. The flow chart of the proposed ADN rolling optimization planning method is shown in Figure 4.

4.2. The Rolling Optimization Process

Assume the set of projects in year t and the corresponding initial project library filtered by the boundary condition evaluation are Mt and ϕ t , respectively. The model to prioritize projects and determine the investment scheme for year t is described below.
(1)
Objective Function:
The objective is to ensure that the sum of the dominant condition score and the correlation score (namely, contribution score in this paper) of the construction projects is maximized in the following planning period, as (9) shows.
m ax t = t T i ϕ t d i t S i t
where T represents the entire planning period, S i t is the comprehensive score of project i in year t.
The details of Sit are given as follows.
S i t = D S i t + C S i t
D S i t = 0.5 b i t D S i t 0
b i t = { 0 , k = 1 t j P i n ( i ) d j k 0 1 , k = 1 t j P i n ( i ) d j k = 0
where D S i t represents the actual dominant condition scores that consider the influence of the operation status of the projects in which project i directly depends, d i t is the 0–1 variable that indicates whether project i is under construction in year t (0 means no, 1 means yes), b i t is the correlation coefficient of project i in year t and represents the impact of the projects’ commissioning associated with project i, D S i t 0 is the dominant condition score calculated based on ADN planners’ opinion, which is the ideal score under the circumstance that i is fully functional, P i n ( i ) is the set of projects that project i directly depends on.
It is clear that the interactions among ADN projects influence the actual effectiveness of the projects, as Figure 5 shows.
(2)
Constraint conditions:
(a)
Latest operation time constraints: assume ϕ 1 is the set of projects without a deadline of production, ϕ 2 is the collection of projects with a deadline, and ti is the exact year by which project i must be invested. Obviously, each project can only be executed once during the planning horizon; then, the constraints are
t = t T d i t 1 , i ϕ 1
t = t t i d i t = 1 , i ϕ 2
(b)
Successor constraints: two projects may have a successor relationship due to technical, land, or staffing reasons, which means project j can only be arranged after project i, and once project i is put into production, project j must be invested immediately, as formula (15) shows
d j t [ d i t ]
where [dit] is the largest integer less than or equal to dit.
(c)
Maximum investment constraint:
i ϕ t c i d i t I C t
where c i is the cost of project i, I C t is the max investment budget in year t.
The optimization model (9)–(16) can provide an investment schedule for the rest (T-t + 1) of the years in the planning horizon. Extract the investment scheme for year t from this schedule and remove the projects to be invested in year t from Mt to obtain the set of projects Mt + 1, the original set of projects to be analyzed in year (t + 1). Then, the investment plan of year (t + 1) can be decided by the procedure illustrated in Figure 4. The evolution of Mt during the planning horizon is presented in Figure 6.

5. Case Study

In order to prove the effectiveness of the proposed multi-year planning scheme, a practical case study has been considered for the evaluation and validation of the proposed method. Taking the Xiantao City power grid of China as a representative application, the proposed method has been applied to optimize its 13th Five-Year Distribution Network Plan.
Combining the current situation of the Xiantao distribution network, and according to the project attributes of each project in the 13th Five-Year Plan, the hierarchical evaluation structure of dominant conditions for distribution network projects can be established, and the corresponding weights are calculated, as shown in Table 4.
Since the projects analyzed in this section come from the 13th Five-Year Plan, they are considered executable projects filtered by the boundary conditions. The annual investment quota ICt and total investment quota are obtained based on the investment budget in the 13th Five-Year Plan. Note that the 110 kV Zabawan transformation and transmission project was invested in the last five-year plan and has to be completed in the first year of 13th Five-Year Plan. Then, prioritize other projects and determine the optimized planning scheme.
(1)
Calculate the ideal dominant condition score of individual projects
Take the 110 kV Louhe power transmission and transformation project (project 1) for example. Require five planners to score the seven bottom-level dominant conditions for Louhe project and calculate the average score for each condition within each level. Table 5 shows the statistics of the planners’ ratings for part of the conditions.
The corresponding fuzzy relation matrix F is shown in Table 6:
The scoring matrix I n ¯ is as Table 7 shows.
Using formula (4), the final score of the bottom-level conditions can be calculated, and then the ideal dominant condition score of project 1 can be calculated, as shown in Table 8.
(2)
Construct the Google matrix for correlation evaluation and calculate the contribution score of projects. There are 1291 projects in the project library, so set CVT to be 100.
(3)
Check the completion status of projects in P i n ( i ) for project i (i =1,…,1291) and calculate the actual dominant condition score using formula (11) and the comprehensive score of projects using formula (10).
(4)
Rank the projects in order of comprehensive score from highest to lowest score, considering the constraint conditions, and obtain the projects to be invested in the following year.
(5)
Update Mt and go back to (1), obtaining the optimized planning scheme for the entire planning period.
After the optimized planning scheme is obtained, a comprehensive evaluation system is constructed from four aspects: technical attributes, economic attributes, social attributes, and environmental attributes. The construction process of the index system and the scoring process of the indexes are consistent with the method used for the dominant condition assessment. This index system is used to evaluate and compare the “13th Five-Year Plan” and the optimized plan. The specific evaluation results are shown in Table 9.
Compared with the “13th Five-Year Plan”, the optimized plan adjusts the investment schedule of some projects, postponing some projects that require larger investments but are not very urgent. The delay of these projects had an acceptable influence on the indicators of 35 kV substation capacity ratio, medium voltage line load factor, and N-1 calibration of medium voltage lines, so the technical indicators of the distribution network optimization investment program scored slightly lower than those of the 13th Five-Year Plan. At the same time, due to the postponement of these projects, the optimized scheme has resulted in relative “savings” in investment. Calculating the cost (consisting of bank loan interest and depreciation) for the planning period of these two plans, the cost of the optimized plan is 10.1% lower than that of the 13th Five-Year Plan. Therefore, the economic indicators of the optimized plan are better than those of the 13th Five-Year Plan. The projects implemented in both schemes are the same in general; only the construction time of some of them is different. Thus, the scores of social benefit and environmental indicators of the two plans are the same. Obviously, the optimized planning plan of the distribution network obtained according to the integrated optimization decision method proposed in this paper is reasonable and feasible and can achieve better economic benefits.

6. Conclusions

In line with the emerging trend of distribution network planning optimization in large zones, this paper proposes a novel approach of a multi-year optimal planning scheme as well as the new concepts of boundary conditions, dominant conditions, and correlation between projects. The proposed planning scheme for optimizing the investment decision-making scheme uses the AHP, Delphi, and fuzzy comprehensive evaluations in dominant condition scoring and uses the PageRank method in correlation quantization. The practical implementation of the proposed multi-year planning scheme and the corresponding simulation results that refer to the conclusions are as follows:
  • We addressed the Expansion Planning Scheme Optimization (EPSO) for the optimal planning of large zone ADN projects.
  • Considering the multi-year rolling optimization, a detailed mathematical model considering the various features including evaluation, time and locality prioritization, and optimal scheduling of ADN planning projects is established.
  • The proposed multi-year planning scheme implementation shows the maximum benefit of the overall social resources in the planning area rather than maximizing the economic efficiency of the grid company or another particular investor.
  • The validation of the proposed method and comparisons prove the relevance and augmentation of various advantages, suitability, and effectiveness of the proposed planning scheme, consequently saving more than 10% of the investment than the existing implemented scheme.
  • The results provide valuable insights into investment decision-making and greatly help power companies looking for the multi-year planning of ADN projects.

Author Contributions

Conceptualization, X.Z. and S.W.; Methodology, X.Z. and S.W.; Software, X.Z.; Validation, X.Z.; Formal analysis, X.Z.; Investigation, X.Z.; Resources, X.Z. and S.W.; Data curation, X.Z.; Writing—original draft preparation, X.Z.; Writing—review and editing, Z.U., M.X. and C.Y.; Visualization, X.Z. and Z.L.; Supervision, S.W.; Project administration, X.Z. All authors have read and agreed to the published version of the manuscript.

Funding

The authors would like to thank for the sponsorship offered by Hubei Electric Engineering Corporation: 0231132439.

Institutional Review Board Statement

Not applicable.

Informed Consent Statement

Not applicable.

Data Availability Statement

Not applicable.

Conflicts of Interest

The authors declare no conflict of interest.

References

  1. Ullah, Z.; Elkadeem, M.R.; Wang, S.; Sharshir, S.W.; Azam, M. Planning Optimization and Stochastic Analysis of RE-DGs for Techno-Economic Benefit Maximization in Distribution Networks. Internet Things 2020, 11, 100210. [Google Scholar] [CrossRef]
  2. Ghadi, M.J.; Rajabi, A.; Ghavidel, S.; Azizivahed, A.; Li, L.; Zhang, J. From Active Distribution Systems to Decentralized Microgrids: A Review on Regulations and Planning Approaches Based on Operational Factors. Appl. Energy 2019, 253, 113543. [Google Scholar] [CrossRef]
  3. Grond, M.O.W.; Morren, J.; Slootweg, J.G. Integrating Smart Grid Solutions into Distribution Network Planning. In Proceedings of the 2013 IEEE Grenoble Conference, Grenoble, France, 16–20 June 2013; pp. 1–6. [Google Scholar]
  4. Future Power Distribution Grids: Integration of Renewable Energy, Energy Storage, Electric Vehicles, Superconductor, and Magnetic Bus|IEEE Journals & Magazine|IEEE Xplore. Available online: https://ieeexplore.ieee.org/document/8629960 (accessed on 4 June 2021).
  5. Martins, V.F.; Borges, C.L.T. Active Distribution Network Integrated Planning Incorporating Distributed Generation and Load Response Uncertainties. IEEE Trans. Power Syst. 2011, 26, 2164–2172. [Google Scholar] [CrossRef]
  6. Pesaran, M.H.A.; Huy, P.D.; Ramachandaramurthy, V.K. A Review of the Optimal Allocation of Distributed Generation: Objectives, Constraints, Methods, and Algorithms. Renew. Sustain. Energy Rev. 2017, 75, 293–312. [Google Scholar] [CrossRef]
  7. Energies|Free Full-Text|Electric Distribution System Planning Methodology Considering Distributed Energy Resources: A Contribution towards Real Smart Grid Deployment. Available online: https://www.mdpi.com/1996-1073/14/7/1924 (accessed on 20 May 2021).
  8. Venkateswaran, V.B.; Saini, D.K.; Sharma, M. Environmental Constrained Optimal Hybrid Energy Storage System Planning for an Indian Distribution Network. IEEE Access 2020, 8, 97793–97808. [Google Scholar] [CrossRef]
  9. Xiang, Y.; Han, W.; Zhang, J.; Liu, J.; Liu, Y. Optimal Sizing of Energy Storage System in Active Distribution Networks Using Fourier–Legendre Series Based State of Energy Function. IEEE Trans. Power Syst. 2018, 33, 2313–2315. [Google Scholar] [CrossRef]
  10. Mohammad, A.; Zamora, R.; Lie, T.T. Integration of Electric Vehicles in the Distribution Network: A Review of PV Based Electric Vehicle Modelling. Energies 2020, 13, 4541. [Google Scholar] [CrossRef]
  11. Vahidinasab, V.; Tabarzadi, M.; Arasteh, H.; Alizadeh, M.I.; Mohammad Beigi, M.; Sheikhzadeh, H.R.; Mehran, K.; Sepasian, M.S. Overview of Electric Energy Distribution Networks Expansion Planning. IEEE Access 2020, 8, 34750–34769. [Google Scholar] [CrossRef]
  12. Asakura, T.; Genji, T.; Yura, T.; Hayashi, N.; Fukuyama, Y. Long-Term Distribution Network Expansion Planning by Network Reconfiguration and Generation of Construction Plans. IEEE Trans. Power Syst. 2003, 18, 1196–1204. [Google Scholar] [CrossRef]
  13. Kim, J.-H.; Lee, B.-S.; Kim, C.-H. A Study on the Development of Machine-Learning Based Load Transfer Detection Algorithm for Distribution Planning. Energies 2020, 13, 4358. [Google Scholar] [CrossRef]
  14. Orths, A.; Schmitt, A.; Styczynski, Z.A.; Verstege, J. Multi-Criteria Optimization Methods for Planning and Operation of Electrical Energy Systems. Electr. Eng. 2001, 83, 251–258. [Google Scholar] [CrossRef]
  15. Zidan, A.; Shaaban, M.F.; El-Saadany, E.F. Long-Term Multi-Objective Distribution Network Planning by DG Allocation and Feeders’ Reconfiguration. Electr. Power Syst. Res. 2013, 105, 95–104. [Google Scholar] [CrossRef]
  16. Muñoz-Delgado, G.; Contreras, J.; Arroyo, J.M. Distribution Network Expansion Planning With an Explicit Formulation for Reliability Assessment. IEEE Trans. Power Syst. 2018, 33, 2583–2596. [Google Scholar] [CrossRef] [Green Version]
  17. Ehsan, A.; Cheng, M.; Yang, Q. Scenario-Based Planning of Active Distribution Systems under Uncertainties of Renewable Generation and Electricity Demand. CSEE J. Power Energy Syst. 2019, 5, 56–62. [Google Scholar] [CrossRef]
  18. Ribas, J.R.; Arce, M.E.; Sohler, F.A.; Suárez-García, A. Data and Calculation Approach of the Fuzzy AHP Risk Assessment of a Large Hydroelectric Project. Data Brief 2019, 25, 104294. [Google Scholar] [CrossRef] [PubMed]
  19. Ribas, J.R.; Arce, M.E.; Sohler, F.A.; Suárez-García, A. Multi-Criteria Risk Assessment: Case Study of a Large Hydroelectric Project. J. Clean. Prod. 2019, 227, 237–247. [Google Scholar] [CrossRef]
  20. Ma, Q.; Wang, B.; Hu, W.; Cheng, L.; Ji, S. Study on Evaluation and Decision Optimization of Distribution Network Construction and Innovation Reconstruction Projects. Power Syst. Clean Energy 2015, 31, 11–17. [Google Scholar]
  21. Zangeneh, A.; Jadid, S.; Rahimi-Kian, A. A Hierarchical Decision Making Model for the Prioritization of Distributed Generation Technologies: A Case Study for Iran. Energy Policy 2009, 37, 5752–5763. [Google Scholar] [CrossRef]
  22. Huang, H.; Wu, Z.; Ju, J.; Zhang, B.; Wang, X.; Pan, Y.; Zheng, H.; Zhao, Z. Research on Precision Investment Strategy of Distribution Network Based on Data Mining Technology. Zhejiang Electr. Power 2019, 38, 92–97. [Google Scholar]
  23. Wang, W.; Liu, Y.; Xia, R. Research on the evaluation system of distribution network planning based on improved AHP. Electron. Meas. Technol. 2019, 42, 24–28. [Google Scholar]
  24. Liu, N.; Ma, L.; Zhu, T. Synthetical Assessment on Distribution Network Planning Scheme Considering Anti-Disaster Ability and Regional Characteristics. Power Syst. Technol. 2012, 36, 219–225. [Google Scholar]
  25. Chen, X.; Lv, J.; McElroy, M.B.; Han, X.; Nielsen, C.P.; Wen, J. Power System Capacity Expansion Under Higher Penetration of Renewables Considering Flexibility Constraints and Low Carbon Policies. IEEE Trans. Power Syst. 2018, 33, 6240–6253. [Google Scholar] [CrossRef]
  26. Mai, T.; Wiser, R.; Sandor, D.; Brinkman, G.; Heath, G.; Denholm, P.; Hostick, D.J.; Darghouth, N.; Schlosser, A.; Strzepek, K. Renewable Electricity Futures Study. Volume 1: Exploration of High-Penetration Renewable Electricity Futures; National Renewable Energy Laboratory: Golden, CO, USA, 2012. [Google Scholar]
  27. Liang, Z.; Chen, H.; Chen, S.; Lin, Z.; Kang, C. Probability-Driven Transmission Expansion Planning with High-Penetration Renewable Power Generation: A Case Study in Northwestern China. Appl. Energy 2019, 255, 113610. [Google Scholar] [CrossRef]
  28. Liu, F. Study on Investment Efficiency Evaluation System for Distribution Networks Based on Investment Correlation Analysis. Zhejiang Electr. Power 2016, 35, 68–71. [Google Scholar]
  29. Page, L.; Brin, S.; Motwani, R.; Winograd, T. The PageRank Citation Ranking: Bringing Order to the Web. Available online: http://ilpubs.stanford.edu:8090/422/ (accessed on 13 April 2021).
  30. Langville, A.N.; Meyer, C.D. Google’s PageRank and beyond: The Science of Search Engine Rankings; Princeton University Press: Princeton, NJ, USA, 2006; ISBN 978-0-691-12202-1. [Google Scholar]
Figure 1. Hierarchical evaluation structure of dominant conditions for individual projects.
Energies 14 03450 g001
Figure 2. Example of an active distribution network planning scheme.
Energies 14 03450 g002
Figure 3. Example of the correlation between different distribution network projects.
Energies 14 03450 g003
Figure 4. Flow chart of active distribution network rolling optimization planning.
Energies 14 03450 g004
Figure 5. Comprehensive score of individual projects considering the interactions among projects: (a) Schematic diagram of the comprehensive score calculation; (b) The actual dominant condition score of individual projects.
Energies 14 03450 g005
Figure 6. Evolution of Mt during the planning horizon.
Energies 14 03450 g006
Table 1. Conditions and sub-conditions of necessity.
Third Level Fourth Level
Existing problemsSolving equipment overload
Improving low voltage
Strengthening the grid structure
Supporting power delivery
Replacing old equipment
Anti-Disaster
Meeting environmental protection requirements
Development needsMeeting load growth
Satisfying the development planning requirements of the power company
Meeting policy requirements
Table 2. Conditions and sub-conditions of feasibility.
Third Level Fourth Level
Conditions of existing
distribution network
Support from the existing distribution network
Market conditionsCoordination between market demand and project scale
Technical conditionsTechnology applicability
Table 3. Conditions and sub-conditions of Economy.
Third Level Fourth Level
Financial benefitsCost
Solvency
Profitability
Ability to resist risks and adapt to market changes
National economic benefitsSocial benefit
Table 4. The hierarchical evaluation structure of dominant conditions for Xiantao ADN.
Second LevelWeightBottom LevelWeight
Necessity0.6DC1: Solving equipment overload/
DC1: Improving low voltage/
DC1: Strengthening the grid structure/
DC1: Replacing old equipment/
DC1: Meeting load growth/
DC01: Others
1
Feasibility0.1DC2: Support from the existing distribution network
DC3: Natural conditions for the site selected
DC4: Coordination between market demand and project scale
DC5: Technology applicability
0.3
0.3
0.3
0.1
Economy0.3DC6: Financial benefits
DC7: Social benefits
0.5
0.5
Table 5. Statistics of planners’ ratings for part of the conditions of project 1.
Project No.Bottom-Level ConditionRating LevelNumber of Planners in This LevelAverage Score
1DC1excellent597
DC3Excellent
good
4
1
92.1
84.5
DC6excellent594.7
Table 6. Fuzzy relationship matrix F for part of the conditions of project 1.
ConditionProbability
ExcellentGoodSatisfactoryWeakPoor
DC110000
DC30.80.2000
DC610000
Table 7. The scoring matrix for part of the conditions of project 1.
ConditionExcellentGoodSatisfactoryWeakPoor
DC1970000
DC392.184.5000
DC694.70000
Table 8. The ideal dominant condition score of project 1.
Bottom LevelScoresSecond LevelScoresIdeal Dominant Condition Score
DC197Necessity9795.68
DC2
DC3
DC4
DC5
90
90.58
88
97
Feasibility90.27
DC6
DC7
94.7
95
Economy94.85
Table 9. Comparison of the two planning schemes.
Comprehensive EvaluationOptimized Planning Scheme “13th Five-Year Plan”
Technical indicators88.1388.72
Economic indicators86.8980.41
Social benefit indicators96.4896.48
Environmental indicators 88.588.5
Comprehensive score89.5987.67
Publisher’s Note: MDPI stays neutral with regard to jurisdictional claims in published maps and institutional affiliations.

