Article

Extending a Homogenized Model for Characterizing Multidirectional Jellyroll Failure in Prismatic Lithium-Ion Batteries

1
State Key Laboratory of Automotive Safety and Energy, Tsinghua University, Beijing 100084, China
2
Guangzhou Automobile Group Co., Ltd., Guangzhou 511458, China
*
Author to whom correspondence should be addressed.
Energies 2021, 14(12), 3444; https://doi.org/10.3390/en14123444
Submission received: 5 May 2021 / Revised: 5 June 2021 / Accepted: 6 June 2021 / Published: 10 June 2021
(This article belongs to the Special Issue Crash Safety of Lithium-Ion Batteries)

Abstract

:
Lithium-ion batteries have been widely used in electric vehicles but may cause severe internal short circuit during extreme intrusion-type accidents. A well-defined homogenized model of battery or jellyroll is necessary for safety assessment and design on large-scale structure level. In our previous study, the jellyroll of prismatic lithium-ion battery cell shows anisotropic mechanical behavior and failure tolerance. For homogenized characterization of jellyroll, in the present paper, the user subroutine of a constitutive model taking anisotropy into account is implanted into Abaqus finite element analysis software, which is capable of capturing the force versus displacement responses along different loading directions before jellyroll failure. To extend the capability of the homogenized model, five single-parameter failure criteria and two combined failure criteria are examined in predicting the failure onsets in jellyroll along different directions. The result proves the combined failure criteria is competent to correctly predict the multidirectional failure onsets compared with the single-parameter ones.

1. Introduction

Lithium-ion batteries have been widely used as the power source of electric vehicles due to their high energy and power density. However, many accidents of electric vehicles have been reported in recent years [1]. In many cases, the battery cells suffered severe mechanical deformation and got smoked, fired, and even exploded. Research on the mechanical behavior of lithium-ion battery is necessary to achieve better understanding of failure mechanism of the lithium-ion battery under mechanical loading and to develop more safe design of the battery system.
Many studies have been carried out to build up a finite element model to predict the mechanical behavior of lithium-ion battery cells and jellyrolls. There are mainly two categories of modeling methods. One is the detailed finite element model, which includes all components including current collectors, coatings, and separators of the jellyroll [2,3,4,5]. A well-defined detailed model can predict both the global mechanical behavior and the detailed deformation and failure in battery cells. Zhu et al. [3] conducted axial compression tests of 18,650 battery cells and developed a detailed finite element model to perform a detailed analysis of the local failure mechanism. Zhang et al. [4] designed and conducted mechanical tests on constitutive properties of porous electrodes and built up a heterogeneous model for pouch cells. Pan et al. [5] designed an impact test on a pouch battery cell and built a 3D detailed model to reveal the battery deformation for each part of the cell. However, development of the detailed or heterogeneous models requires a large number of component material tests and onerous calibration processes of material parameters, and the large number of elements (usually more than 100,000 elements in a detailed model [6,7]) and the tiny mesh size tend to incur large computational cost. This means that lack of efficiency is a big issue for the detailed model, so it is unsuitable for vehicle or pack level simulation or optimization design.
The other category is the homogenized finite element model. This method simplifies the battery cell or jellyroll as a homogeneous part, and only one constitutive model is required for the equivalent material theoretically. Such a treatment brings the advantage that the model can be easily discretized with larger mesh size owing to relatively simple geometry and composition. Therefore, the homogenized model is usually computationally efficient compared with the detailed model. Sahraei et al. [8,9,10,11] developed homogenized models based on crushable foam or honeycomb material models in Ls-Dyna as well as the model calibration methods. Those models are applied to predict the load versus displacement responses from a series of indentation tests on 18,650 cells and pouch cells. Xu et al. [12] carried out the mechanical tests of 18,650 cells under different loading speeds, and developed a homogenized model taking strain-rate effect into consideration. Lian et al. [13] compared seven failure criteria for Deshpande–Fleck crushable foam model with Abaqus/Explicit in the effort to predict shear crack formation in jellyrolls of pouch cells under rod indentation.
The research on pouch cells and prismatic cells mentioned above mainly focused on the out-of-plane loading cases (i.e., loading is normal to the stacked multilayer of jellyroll in the battery cell). We can notice that the jellyroll of prismatic cell is a winding structure. The structure itself looks highly directional, necessarily corresponding to apparent mechanical anisotropy if the homogenization assumption is made. Li et al. [14] built a homogenized model for pouch cell considering mechanical anisotropy, damage, strain-rate dependence, and SOC dependence. Kotter et al. [15] carried out a series of loading tests on large-format prismatic lithium-ion battery cells considering different loading directions and speeds. Zhu et al. [16] conducted indentation tests on prismatic battery cells and jellyrolls along different directions, and the force-displacement responses and failure intrusions show apparent anisotropy. In realistic accidents, the battery pack may suffer intrusions along different directions. The pack consists of battery modules, which also introduce the second level of structural directionality. Therefore, from cell to pack, there should be at least three levels of directionality, which brings sufficient complexity for the safety assessment or design of the final battery system. From the utmost basic level, cell level, it is important to enable the numerical models to comprehensively capture the deformation responses and failure risks at different directions.
In the present study, a user subroutine of a constitutive model describing anisotropic mechanical behavior is written and implanted in Abaqus/Explicit for a homogenized FE model of the jellyroll in prismatic cell to capture the force versus displacement responses along different loading directions before failure. Then, the model is extended with failure definitions. Two categories of failure criteria, i.e., five single-parameter criteria and two combined criteria, are examined and compared with each other to determine the ones that can be applied to predict the multidirectional failure of jellyroll.

2. Basic Framework of the Constitutive Model

The constitutive relationship for the homogenized equivalence of the jellyroll basically comes from the Modified Honeycomb model (Material Type 126 in Ls-Dyna) [17]. The model is originally developed for cellular materials with anisotropic behavior, especially aluminum honeycombs. When the deformation is below a certain amount, the normal and shear stress-strain behaviors in all directions are assumed fully uncoupled, and nonlinear elastoplastic material behavior can be defined separately for each stress component. It is similar to the apparently anisotropic mechanical behavior of the jellyroll when it is subjected to compression or indentation from different directions. When the deformation becomes sufficiently large, i.e., the volume of the block decreases to a certain value, the material is fully compacted and becomes isotropic.
Before being full compacted, the behavior of material is orthotropic, and the components of the stress tensor are uncoupled. A material coordinate system (1,2,3) is defined for the orthotropic material model and 1,2,3 represent the major direction. The Cauchy stress and the total strain tensors follow the Voigt notation: σ 11 , σ 22 , σ 33 , σ 23 , σ 13 , σ 12 and ε 11 , ε 22 , ε 33 , 2 ε 23 , 2 ε 13 , 2 ε 12 . For each component of Cauchy stresses σ i j , the relationship with the total strains is given by:
σ i j = σ i j ε i j ,   i , j = 1 , 2 , 3
Einstein’s summation convention is not used in this paper, i.e., no summation over i , j . The relationship means that for each component σ i j , it is only related to the corresponding component of total strain ε i j .
The detailed implementation process is described as below. The elastic moduli vary from the initial values to the fully compacted values linearly with the relative volume:
E i i = E i i U + α E E i i U ,   i = 1 , 2 , 3
G i j = G i j U + α G G i j U ,   i j ,   i , j = 1 , 2 , 3
where α = max min 1 V / 1 V f , 1 , 0 , and E i i and G i j are the elastic modulus and shear modulus along different direction, respectively, for the uncompacted state. E and G are the elastic modulus and shear modulus for the fully compacted state, while E i i U and G i j U are initial values of the elastic modulus and shear modulus. V is the relative volume (i.e., the ratio of the current volume to the initial volume), and V f is the fully compacted volume.
The model adopts six load curves σ i j ε i j to define the normal stress and shear stress values during deformation along different direction. For the uncompacted state, at the beginning the trial, stress values are updated as:
σ i i n + 1 t r i a l = σ i i n + E i i Δ ε i i ,   i = 1 , 2 , 3
σ i j n + 1 t r i a l = σ i j n + 2 G i j Δ ε i j ,   i j ,   i , j = 1 , 2 , 3
Each component of the updated stress tensor is checked to make sure that it does not exceed the permissible value determined from the load curve. If
σ i j n + 1 t r i a l > λ σ i j ε i j ,   i , j = 1 , 2 , 3
then
σ i j n + 1 = σ i j ε i j λ σ i j n + 1 t r i a l σ i j n + 1 t r i a l ,   i , j = 1 , 2 , 3
where λ represents the scale factor defining strain-rate effect. For the quasi-static cases, λ = 1 .
When V V f , corresponding to the fully compacted state, the material behavior is isotropic elastic-perfectly plastic, which means that there is no work hardening. The Cauchy stress σ and the elastic strain ε e tensors follow the Voigt notation: σ 11 , σ 22 , σ 33 , σ 23 , σ 13 , σ 12 and ε 11 e , ε 22 e , ε 33 e , 2 ε 23 e , 2 ε 13 e , 2 ε 12 e . The relationship with Cauchy stresses and the elastic strains is given by:
σ = C ε e
C is the elastic stiffness matrix, and there are only two individual parameters determined by Young’s modulus E and Poisson’s ratio μ .
The trial deviatoric stress components are updated as:
s i j t r i a l = s i j n + 2 G Δ ε i j d e v ,   i , j = 1 , 2 , 3
where the deviatoric strain increment is defined as:
Δ ε i j d e v = Δ ε i j 1 3 Δ ε k k δ i j ,   i , j = 1 , 2 , 3
The effective trial stress is defined as:
s eff trial = i = 1 3 j = 1 3 3 2 s i j trial s i j trial 1 / 2
It is checked to see if the yield stress is exceeded. If the effective trial stress exceeds the yield stress, we need to scale back the stress components to the yield surface:
s i j n + 1 = σ y s eff   trial   s i j trial   ,   i , j = 1 , 2 , 3
The pressure is updated as:
p n + 1 = p n K Δ ε k k n + 1 / 2
where K is the elastic bulk modulus and the stress is calculated by:
σ i j n + 1 = s i j n + 1 p n + 1 δ i j ,   i , j = 1 , 2 , 3
The framework described above is written as a user subroutine and implanted in Abaqus/Explicit. Key inputs for the mechanical anisotropy of the jellyroll contain the elastic modulus and the load curves along different directions.

3. Experiments and Experimental Results

To validate the homogenized FE model in this study, jellyrolls from a large format commercial prismatic lithium-ion battery cell for electric vehicles are tested. The jellyroll dimensions are 215 mm, 90 mm, and 15 mm (length, width and thickness). Three types of quasi-static indentation tests are conducted on the jellyrolls along three directions. Along the length (X) and thickness (Z) direction, the indentation object is a cylindrical bar with a diameter of 50 mm. Along the width (Y) direction, the indentation object is a hemispherical head with a diameter of 25 mm. To keep the jellyroll from unstable deformation along X and Y directions, the fixtures for side constraint are designed and applied in these two experiments. The loading setup of jellyroll experiments and the fixtures are shown in Figure 1. The quasi-static tests with a speed of 2 mm/min were conducted on a universal test machine. A CCD camera with a frame of 10 fps was used to record the intrusion in the quasi-static tests. The intrusion distance of the impactor is calculated by the digital image correlation (DIC) method. The contact force was collected with a 200 kN force sensor.
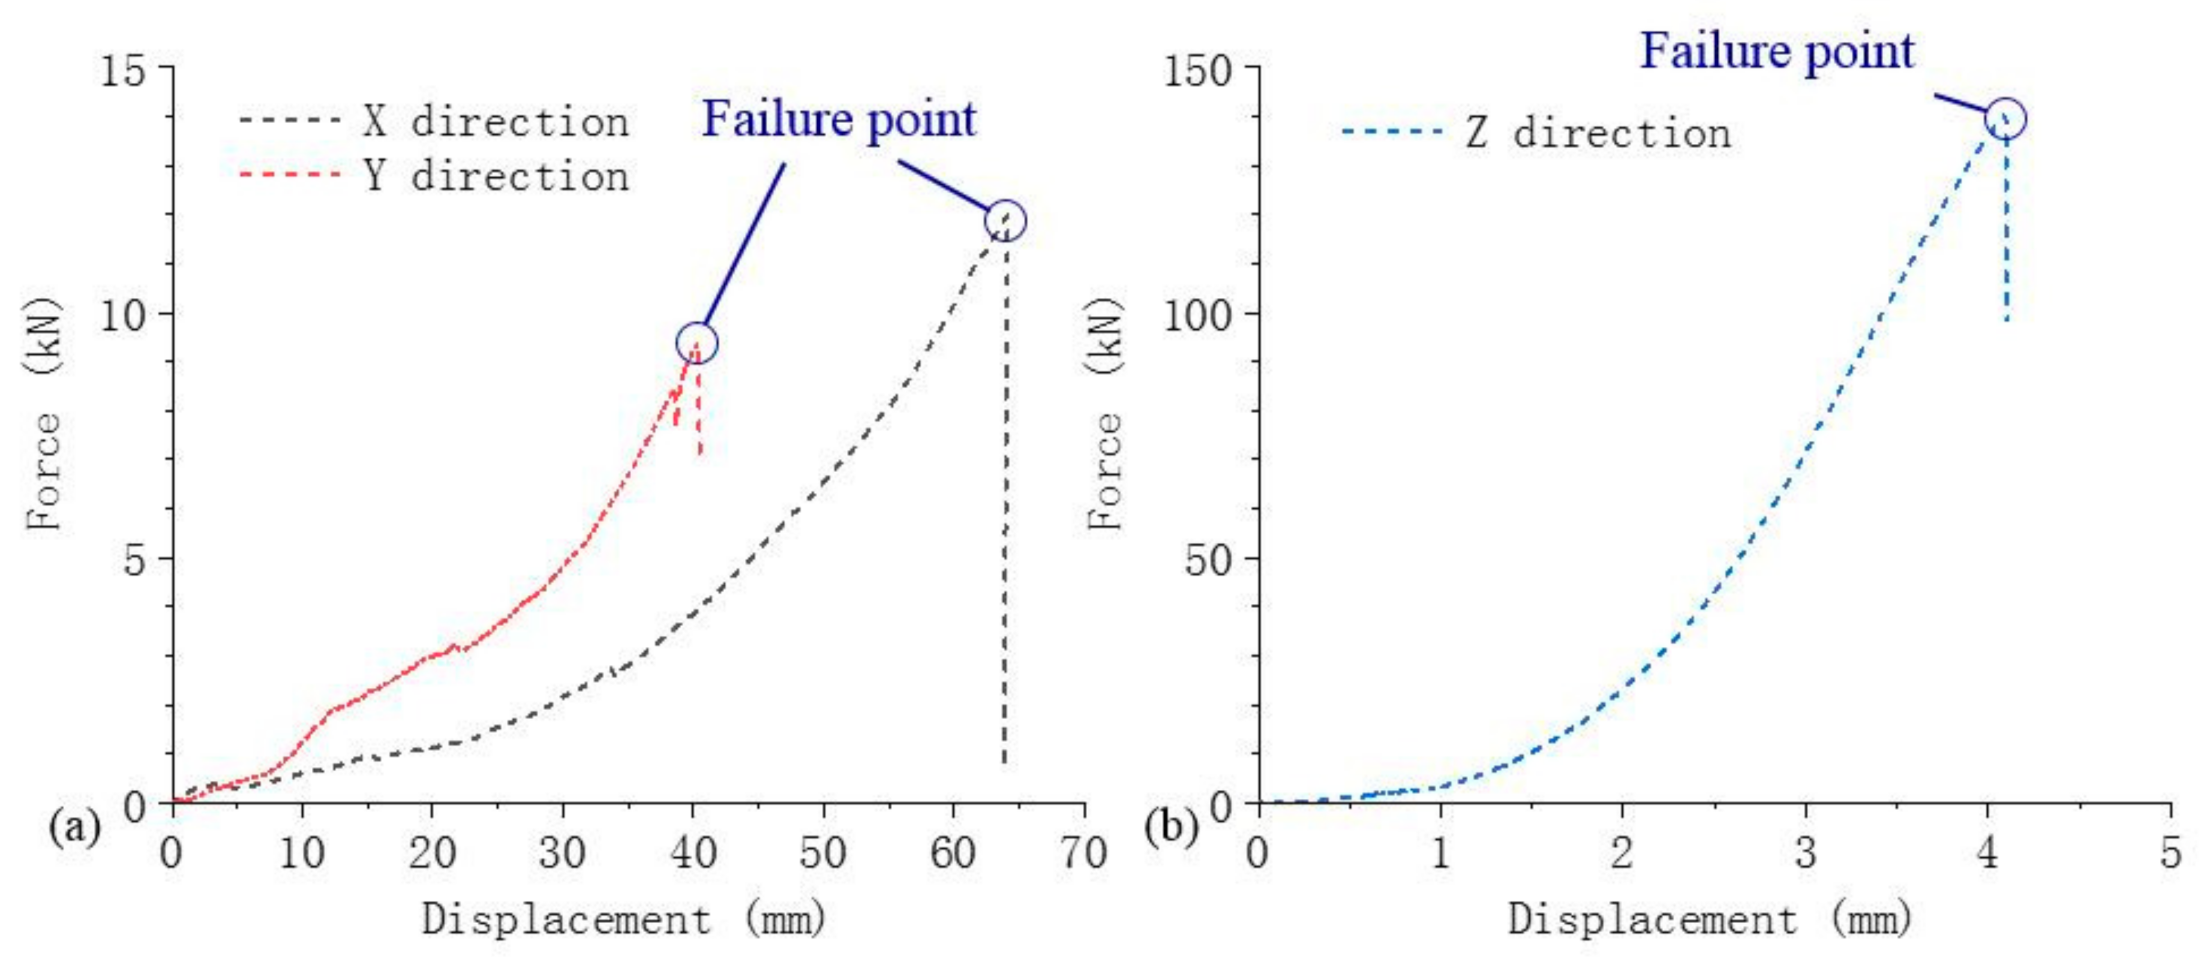
The force-displacement responses and the failure intrusions are shown in Figure 2. The experimental results indicate remarkably different deformation responses and failure tolerances along different directions of the jellyroll in prismatic cell. For detailed information about the cells and the experimental setup, the readers can refer to Zhu et al. [16].
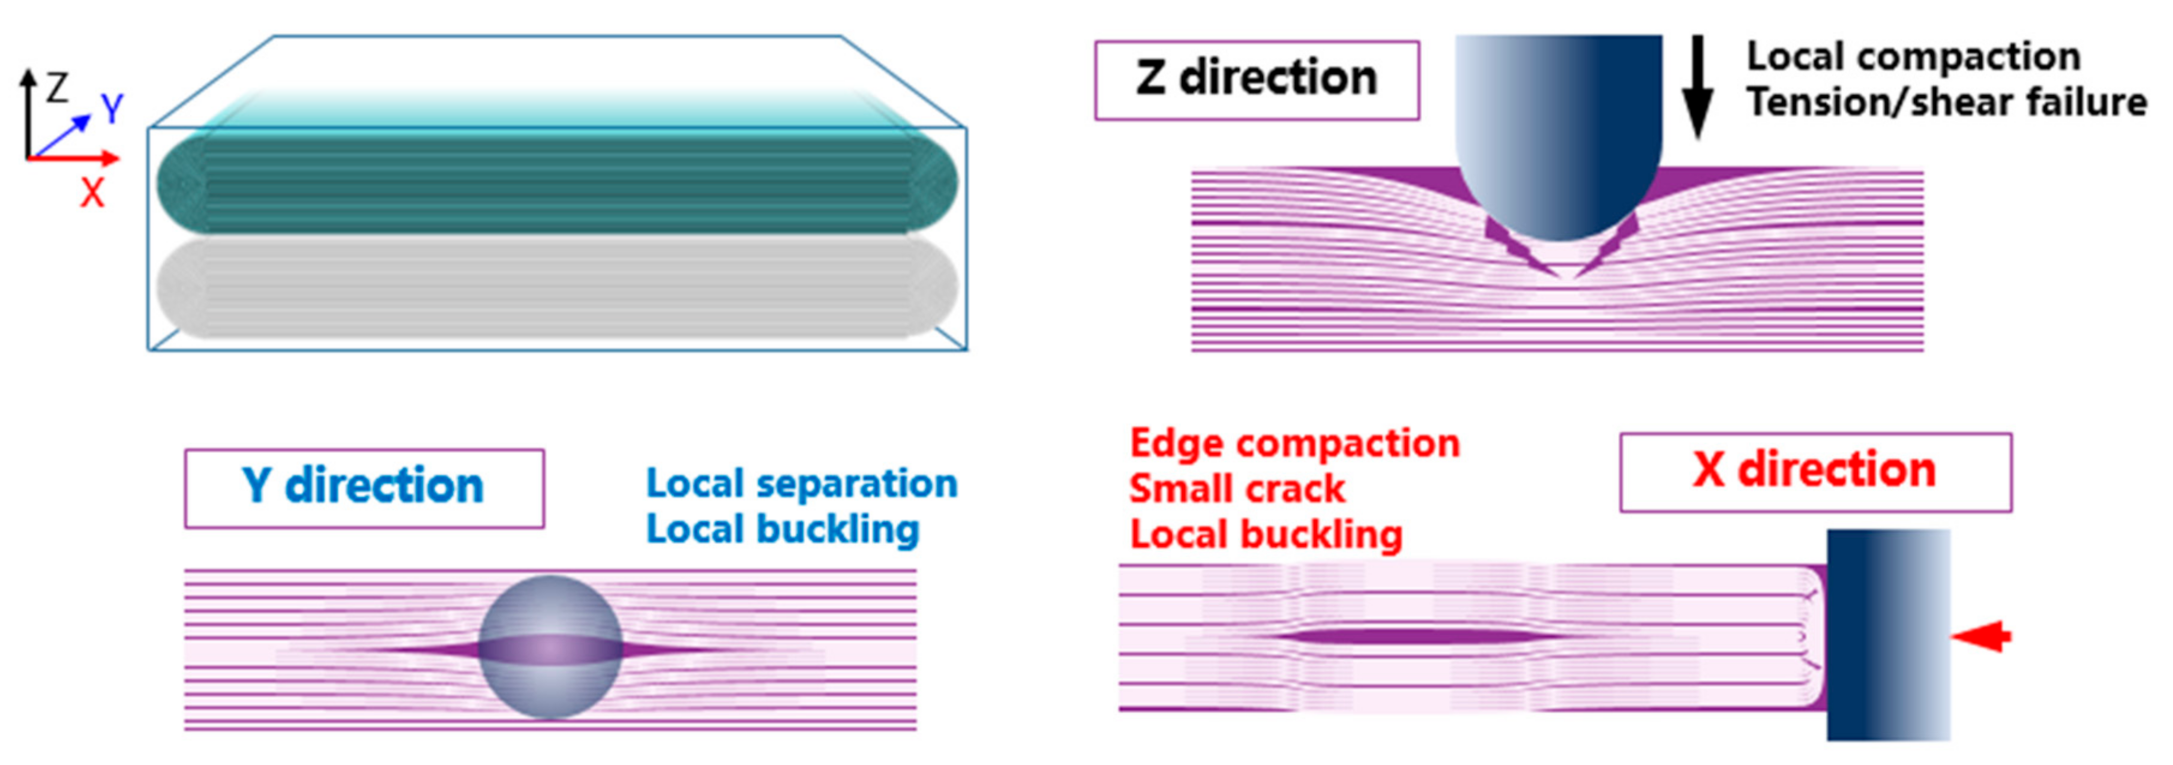
During the tests, we noticed that in the indentation test along Z direction, a crack penetrated the whole sample below the indenter and the jellyroll was divided into two parts. Inclined shear zones were found at both sides of the crack (as shown in the figure with purple line) and the jellyroll deformed more seriously between the shear zones. At this area, the components of jellyroll suffered tensile and shear deformation. As for the samples along X and Y directions, no apparent crack across the layers was found after the tests and the deformation type of the jellyrolls was mainly the buckling of the layer structures. Under the indentation test along Y direction, the indenter tended to separate the layer structures of jellyroll and local buckling was found. For the indentation test along X direction, the edge of the jellyroll was compacted, and small crack occurred under the indenter. The shape of small crack was similar to the crack along Z direction impact. Local buckling was also found in the middle of jellyroll. The two parts of jellyroll on the either side of the rolling center tends to disperse to the sides of itself, and this phenomenon reduces the contact stiffness and the risk of internal short circuit. The deformation and failure/buckling modes are shown in Figure 3.

4. Simulations with Homogenized Model

4.1. Model Calibration

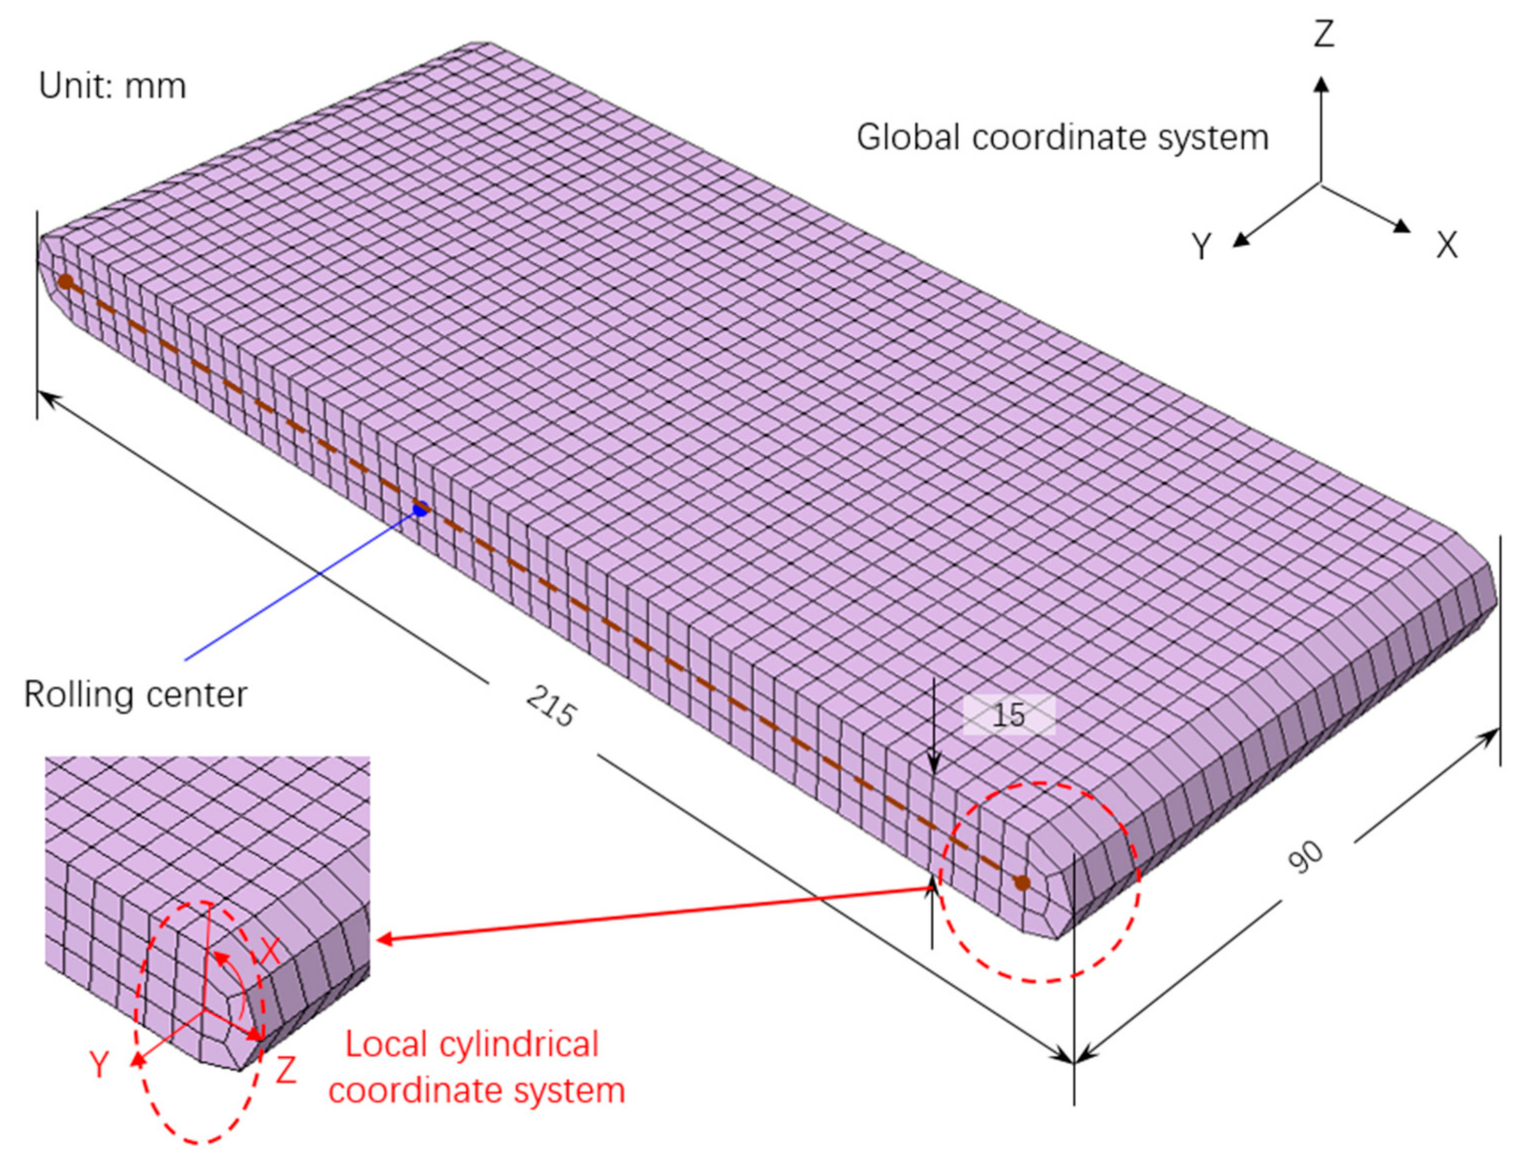
The global dimensions and the overall shape of the jellyroll in the homogenized FE model are the same as those of the real sample, as shown in Figure 3. The characteristic mesh size is 4 mm. The jellyroll model contains more than 6000 elements, and only 4 layers of elements distribute along the thickness direction. To mimic the winding structure of the jellyroll in the model, the upper and lower part are separated from each other in the major area, between which the contact interface is defined, as shown with the brown dash line in Figure 4. The upper and lower part are connected to each other at the two rounded ends along the length (X) direction. A local material cylindrical coordinate system is defined for each rounded end so that the material properties can be correctly added in the end area. The models for the three loading cases are shown in Figure 5. The fixtures, the support plates, and the indentation objects are all simplified as rigid bodies. The unit system in this model is millimeter/second/tonne.
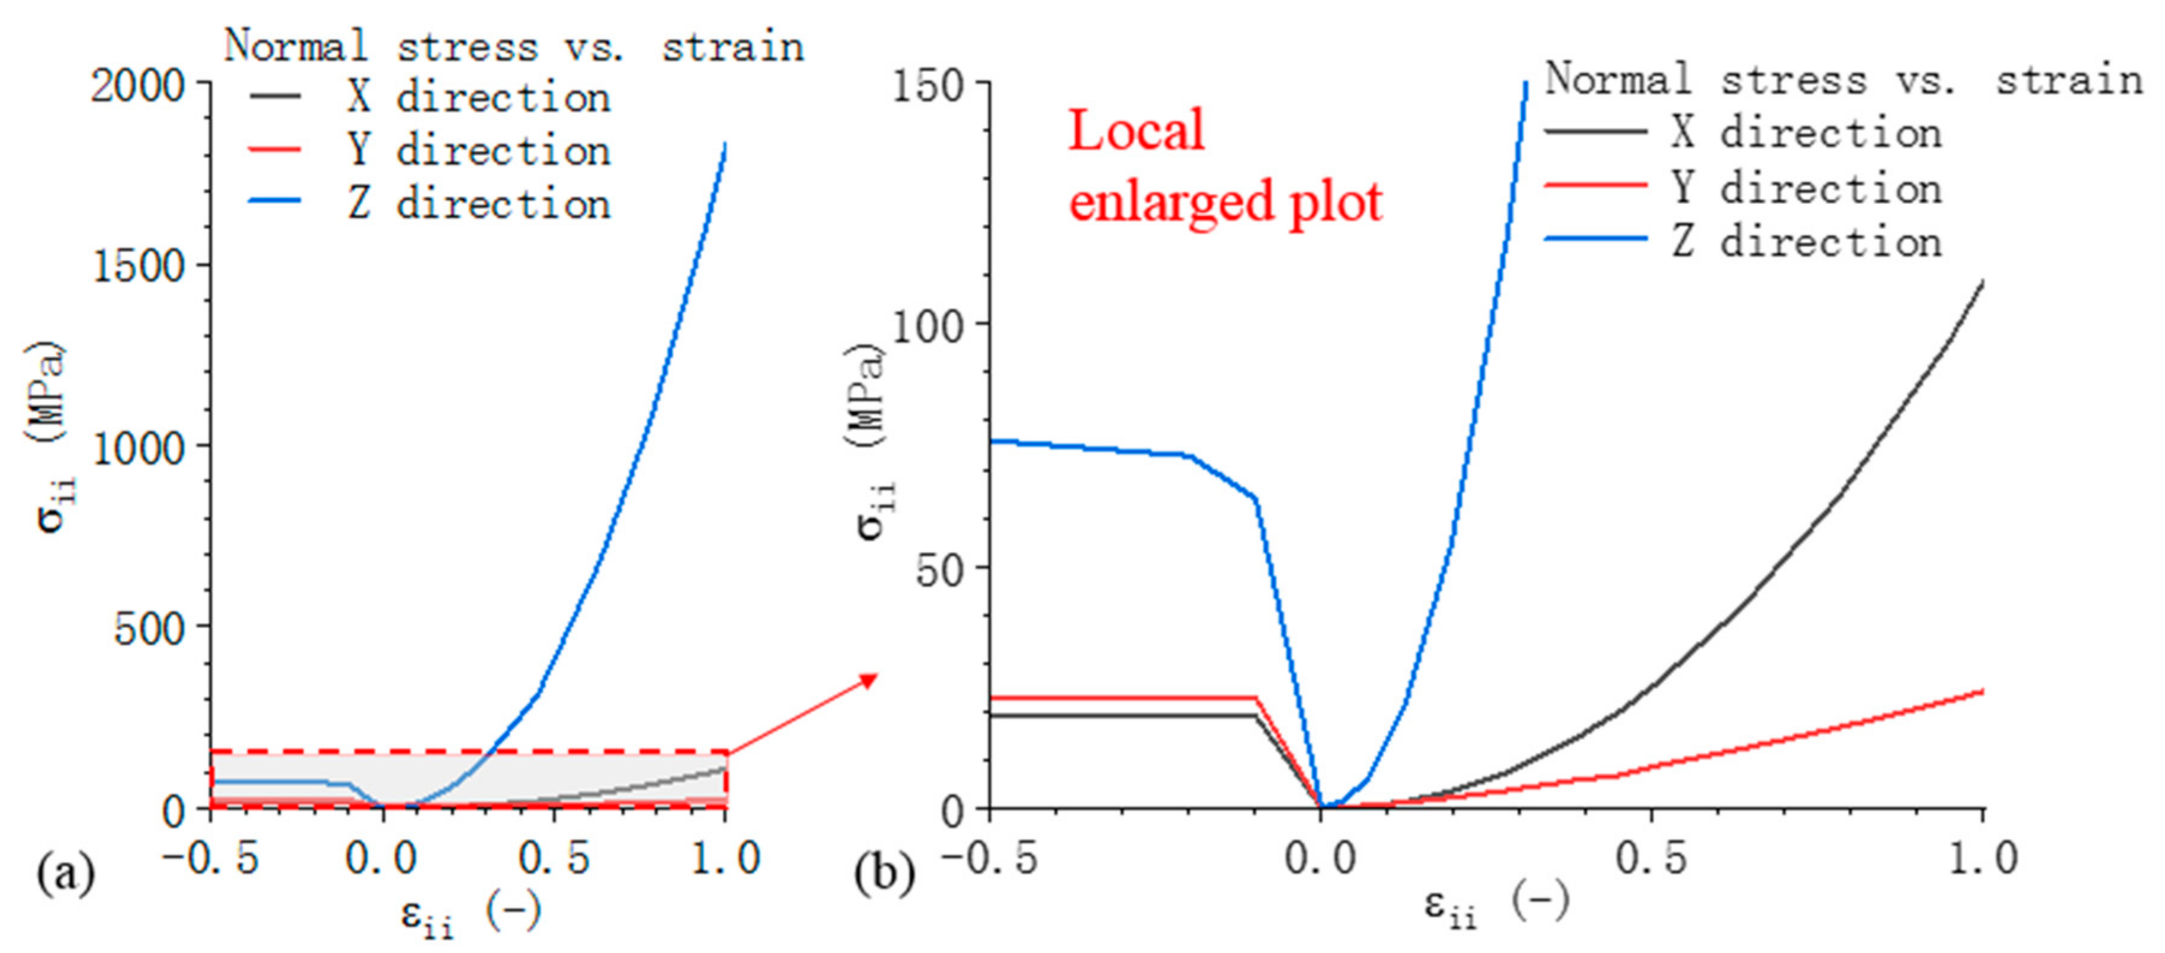
The hardening curves σ i j ε i j introduced in Section 2 are the core part of the model input to simulate the global mechanical behavior of the jellyroll under compression or indentation. Three compression hardening curves are required to determine the compressive stress-strain behaviors along three directions of the jellyroll. They are the dominant input data because in the loading case of indentation, a large portion of material (or structure) underneath the indenter undergoes a compressive state, and they mainly affect the global force response. The tensile behavior has little effect on the contact force versus displacement response during the indentation simulation process. However, if the tensile behavior of the material is defined improperly, the deformation mode or model may seem strange. For proper deformation mode of the material model, appropriate tension curves are also required. We use a power-law function to identify the compression curves and a linear function for tension on each component in the material coordinate system, as shown in Equation (15):
σ i j = σ 0 + K i j ε i j n   C o m p r e s s i o n ,   ε > 0 σ 0 + H i j ε i j   T e n s i o n ,   ε < 0   ,   i , j = 1 , 2 , 3
The hardening curves of three major directions are shown in Figure 6. The compression parts of curves are determined by reverse simulations and tension parts are based on the uniaxial tests of components and adjusted at a proper range. It is noticed that the compression stiffness along the out-of-plane direction is much larger than the other two directions, which has the same characteristic as the real tests. During compaction, the material model shows apparent anisotropic mechanical behavior at the beginning. While the deformation becomes sufficiently large (the relative volume of material lower than fully compacted volume of the material), the material is seen as fully compacted and it shows isotropic elastic mechanical behavior. In our simulations, the anisotropic part mainly determines the mechanical behavior of the jellyroll. During the indentation process before the failure, the jellyroll model does not reach the compacted volume and the compacted part of the material (isotropic linear elastic material part of material model) contributes little in our simulations. The other material parameters are shown in Table 1. The parameters list in Table 1 are introduced in Section 2.

4.2. Simulation Results

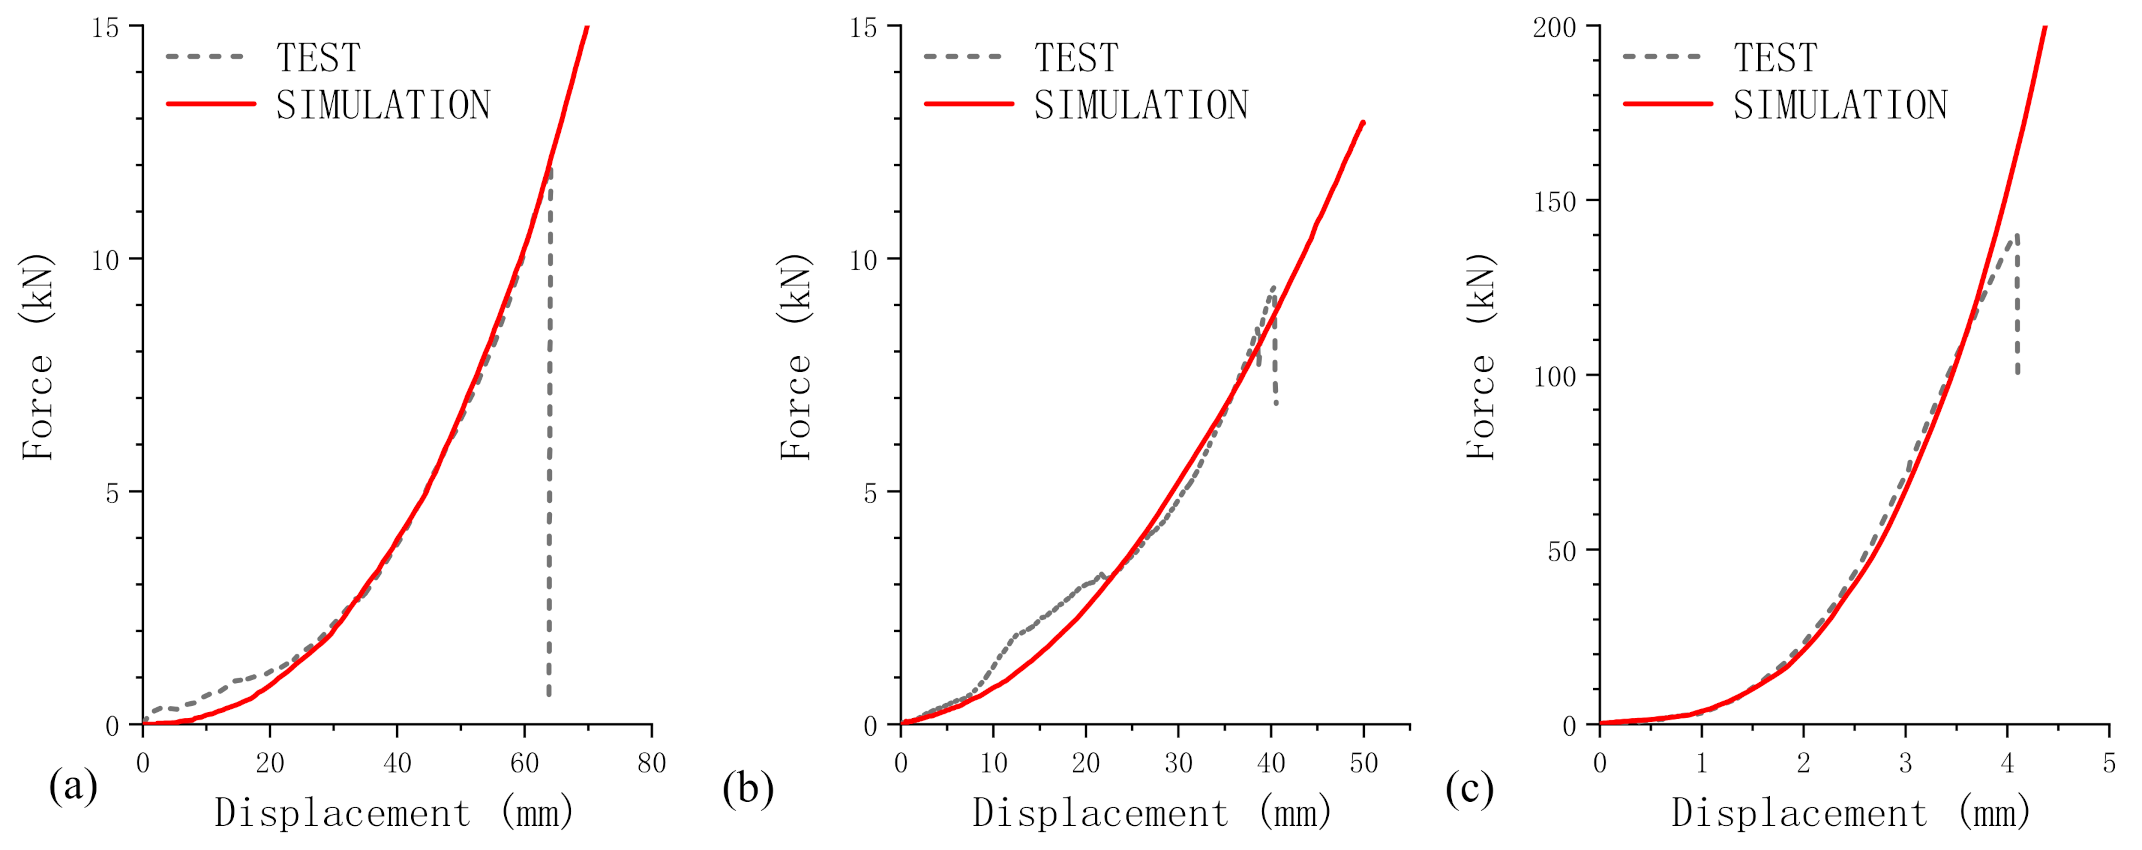
The simulation results without failure criterion are shown in Figure 7 together with the test results of the three loading cases. The simulation curves fit the experimental ones quite well, indicating that this model can properly predict the global anisotropic mechanical behavior of the jellyroll before failure. This provides a reliable basis for examining failure criteria in the next step.

5. Simulations Considering Failure

5.1. Single-Parameter Failure Criteria

Some single-parameter failure criteria are examined to predict the failure of the jellyroll. Five failure criteria are considered in this part, including maximum von-Mises stress, maximum principal stress, maximum shear stress, volumetric strain, and maximum principal strain. The single-parameter failure criteria considered in our research are as shown in Table 2.
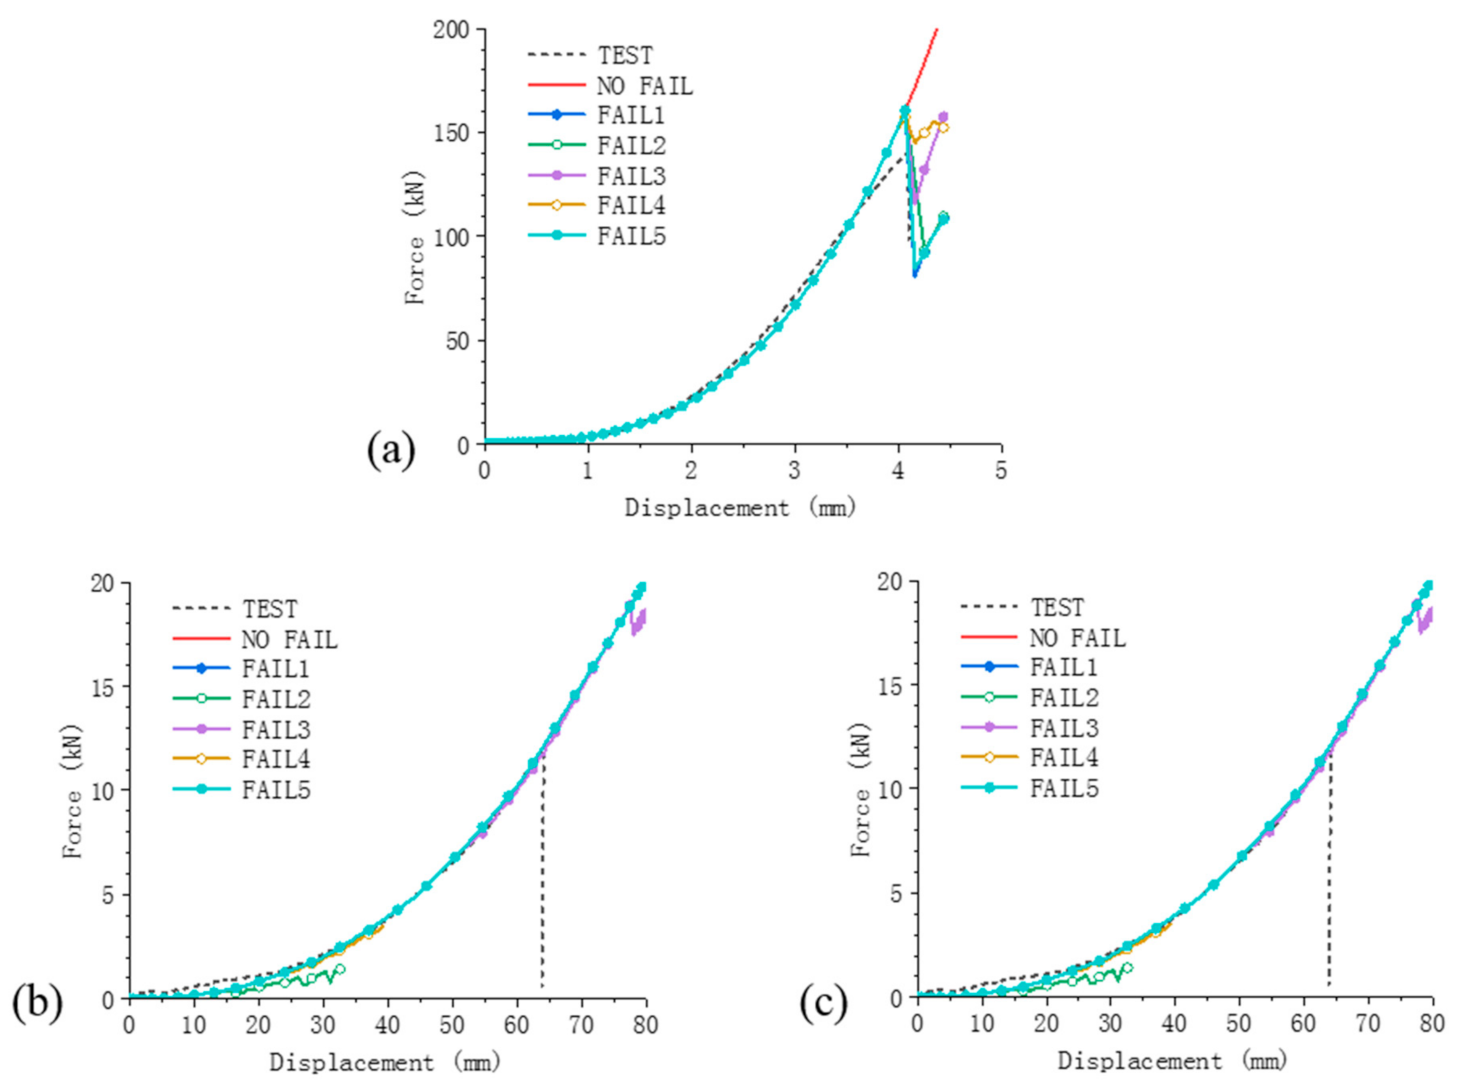
Indentation tests along the out-of-plane direction are mainly considered to calibrate the mechanical behavior of jellyroll and battery cells. Thus, we use the test result along the Z direction to calibrate these five failure criteria and try to verify the criteria with the tests along X and Y directions. Figure 8 shows the simulation results along the X and Y directions with the calibrated parameter from the simulation along the Z direction. It is noticed that with proper definition of all five failure criteria, the simulation along the Z direction fits well at the force drop point compared with the test results. However, these single-parameter failure criteria cannot predict the failure of the impact cases along different loading directions properly. It shows that these single-parameter failure criteria calibrated along out-of-plane direction cannot predict the accurate failure intrusion along in-plane directions. Further simulations are done to calibrate the failure parameters independently with all three tests along different directions. Each parameter calibrated by the test results along different directions are also shown in Table 2. The parameters calibrated by different tests are different from each other. A certain parameter of these single-parameter failure criteria can only give a good failure prediction in one case, and these criteria cannot give a perfect prediction of the failure time for all the tests.
From the analysis in Section 3, the reasons leading to force drop along different impact directions are different. It suggests that an anisotropic failure criterion is required for the jellyroll model.

5.2. Analysis on Combined Failure Criteriion

Based on the discussion above, it suggests that the failure modes of the jellyroll are different along different directions in the impact tests. The winding structure of the jellyroll leads to different failure modes. This means that if we want to use a homogenized model to predict the mechanical behavior of the jellyroll, we may use different failure criteria to describe the reason of force drop along different directions. More detailed analysis about the indentation simulation results along three directions is discussed below.
Figure 9 shows the X component of strain in the indentation test along the out-of-plane (Z) direction. It shows that the area under the indentation head suffers the maximum X component of tension strain (the red area). In the real test, the fracture also occurs at the same position of jellyroll. The component of jellyroll suffers great tension stress and fractures generate across the jellyroll. Therefore, the X component of tension strain is considered to be the failure criterion for the out-of-plane indentation test.
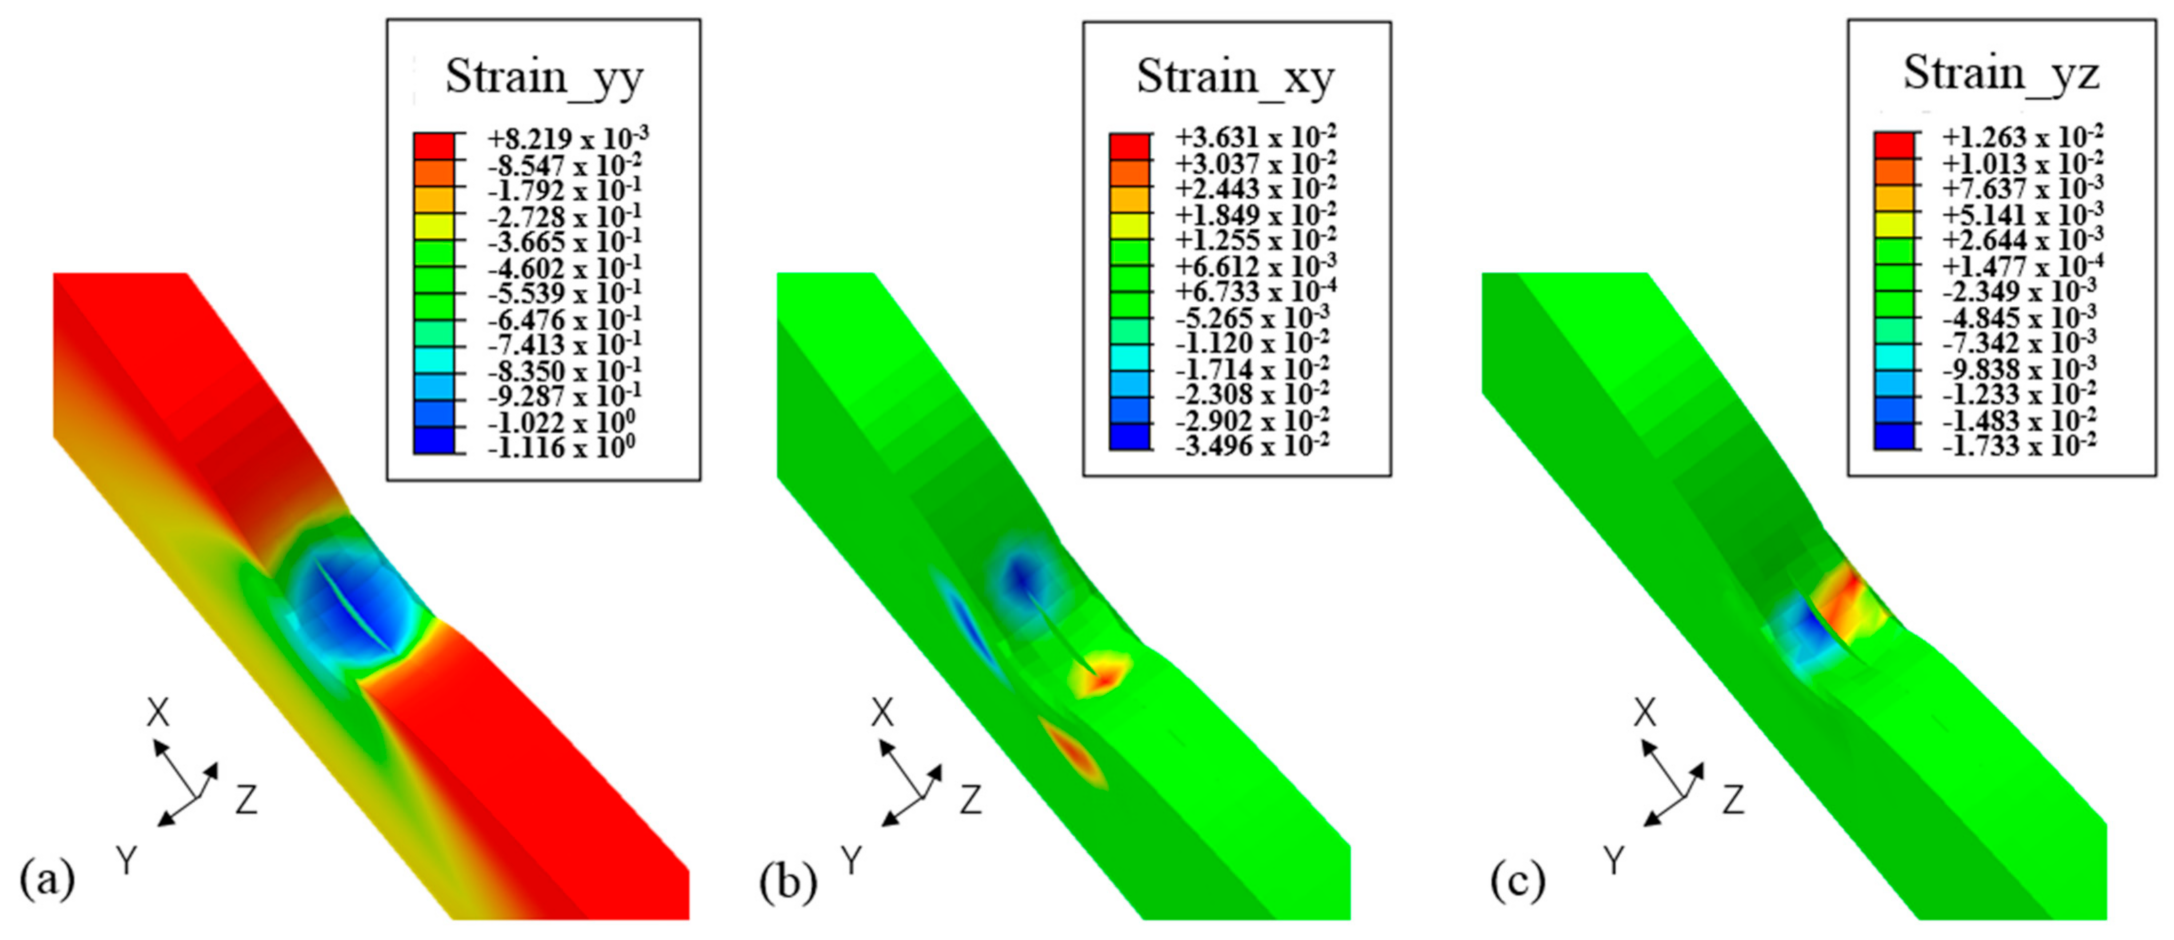
Figure 10 shows the Y, XY, and YZ components of strain in the indentation test along the Y direction. The area under the indentation head (blue area in Figure 10a) suffers the maximum Y component of compression strain. In the real test, local fracture and buckling may occur at the intrusion area and it may lead to force drop and local internal short circuit. The areas next to the edge of the indentation head (blue and red areas in Figure 10b,c) suffer the maximum shear components (XY and YZ) of strain. For the components of jellyroll, shear deformation may lead to fracture across the layer structure and lead to internal short circuit as well. Therefore, these components of strain could be considered to be the failure criteria for the indentation test along the Z direction.
Figure 11 shows the X, XY, and XZ components of strain in the indentation test along the X direction. The area under the indentation head (blue area in Figure 11a) suffers the maximum X component of compression strain. In the real test, the edge of the jellyroll is compressed at the blue area. Local fracture may occur at the intrusion area, and it may lead to local internal short circuit. The areas next to the edge of the indentation head (blue and red areas in Figure 11b,c) suffer the maximum shear components (XY and XZ) of strain. The components on the either side of rolling center tend to be separate from each other and lead to the buckling of the jellyroll. Therefore, these components of strain could be considered to be the failure criterion for indentation test along the Y direction.
Because of the layer structure of the jellyroll, the deformation along different directions may lead to different deformation modes on the jellyroll. For example, the tension force along the X direction causes the tension deformation of the jellyroll, while the tension force along the Z direction causes the separation of layer structures. As a result, a single-parameter failure criterion may not be effective, and it is reasonable to use a combined failure criteria on the jellyroll to predict the different failure moments in the impact simulations along different directions.

5.3. Combined Failure Criterion Considering Tension Strain and Compression Strain

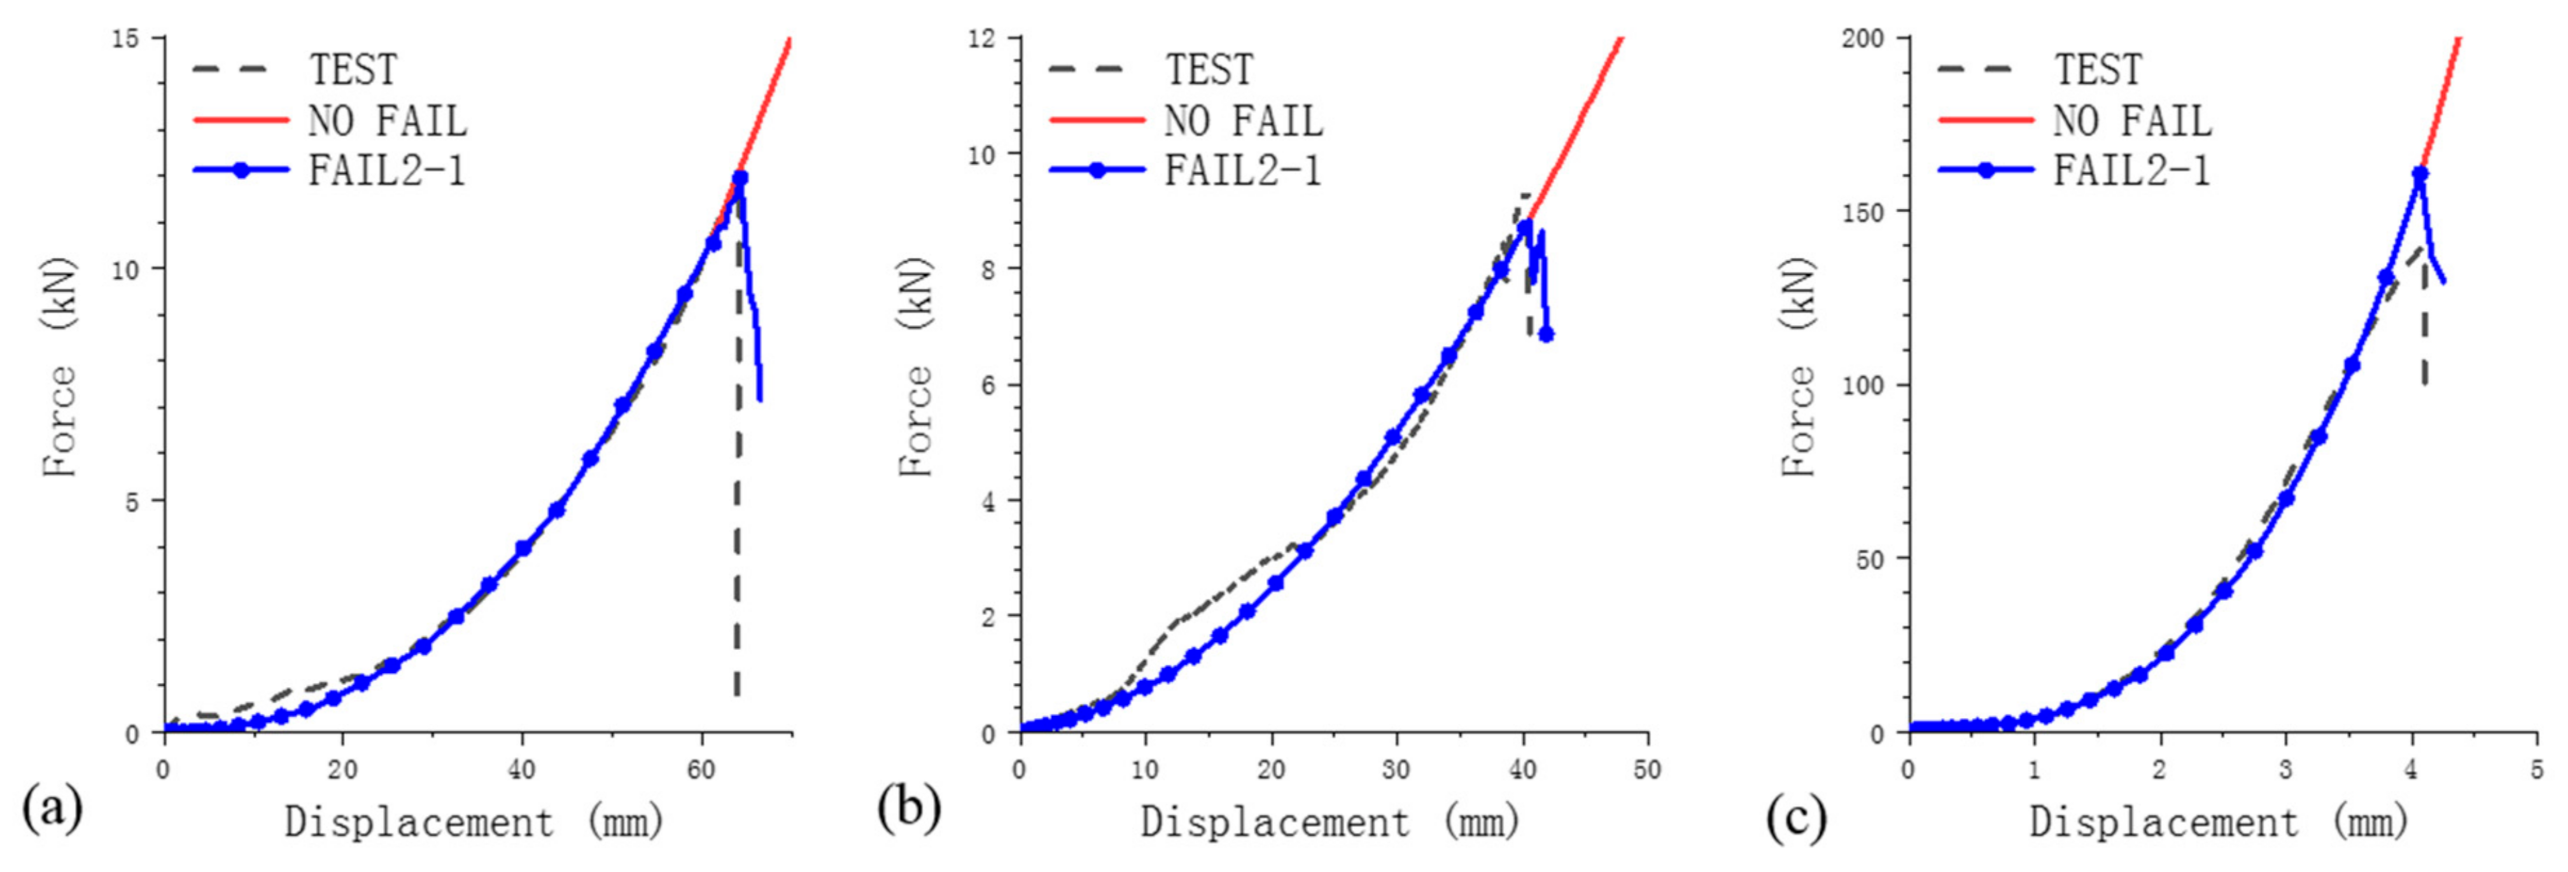
A combined failure criterion with tension strain and compression strain is modified in this section. We simulate the failure along the Z-direction intrusion by the tension strain along the in-plane direction (X direction) and the failure along X and Y directions by the compression strain along the in-plane direction (X and Y directions). The failure criterion and values are shown in Table 3. Positive value means tension strain and negative value means compression strain. Any failure criterion can lead to the failure of the elements during the simulation. The combined failure criteria described above are written in the user subroutine. The simulation results are shown in Figure 12. In the simulation along the Z direction, the elements at the red area in Figure 9 come to failure first due to the failure criterion of the tension strain along the X direction. In the simulations along the X and Y directions, the failure area is the blue area, as shown in Figure 10a and Figure 11a. The predicted failure displacement fit the test results well in all three simulations.

5.4. Combined Failure Criterion Considering Tension Strain and Shear Strain

A combined failure criterion with tension strain and shear strain is used in this section. We simulate the failure along the Z-direction intrusion by the tension strain along the in-plane direction (X direction) and the failure along the X and Y directions by the shear strain along the in-plane direction (XY direction). The failure criteria and values are shown in Table 4. Any failure criterion can lead to the failure of the elements during the simulation. The combined failure criterion is defined in the user subroutine. The simulation results are shown in Figure 13. A local force drop occurs at an intrusion of 44 mm, while a total force drop occurs at around the failure intrusion of 63 mm in the X-direction indentation. Similar to the results in Section 5.3, the elements at the red area in Figure 9 come to failure first due to the failure criterion in the Z-direction indentation. In the simulations along the X and Y directions, the failure areas are the red and blue areas, as shown in Figure 10b and Figure 11b. The predicted failure displacement fit the test results well in other two simulations along the Y and Z directions.

5.5. Quantitative Comparison of All Failure Criteria

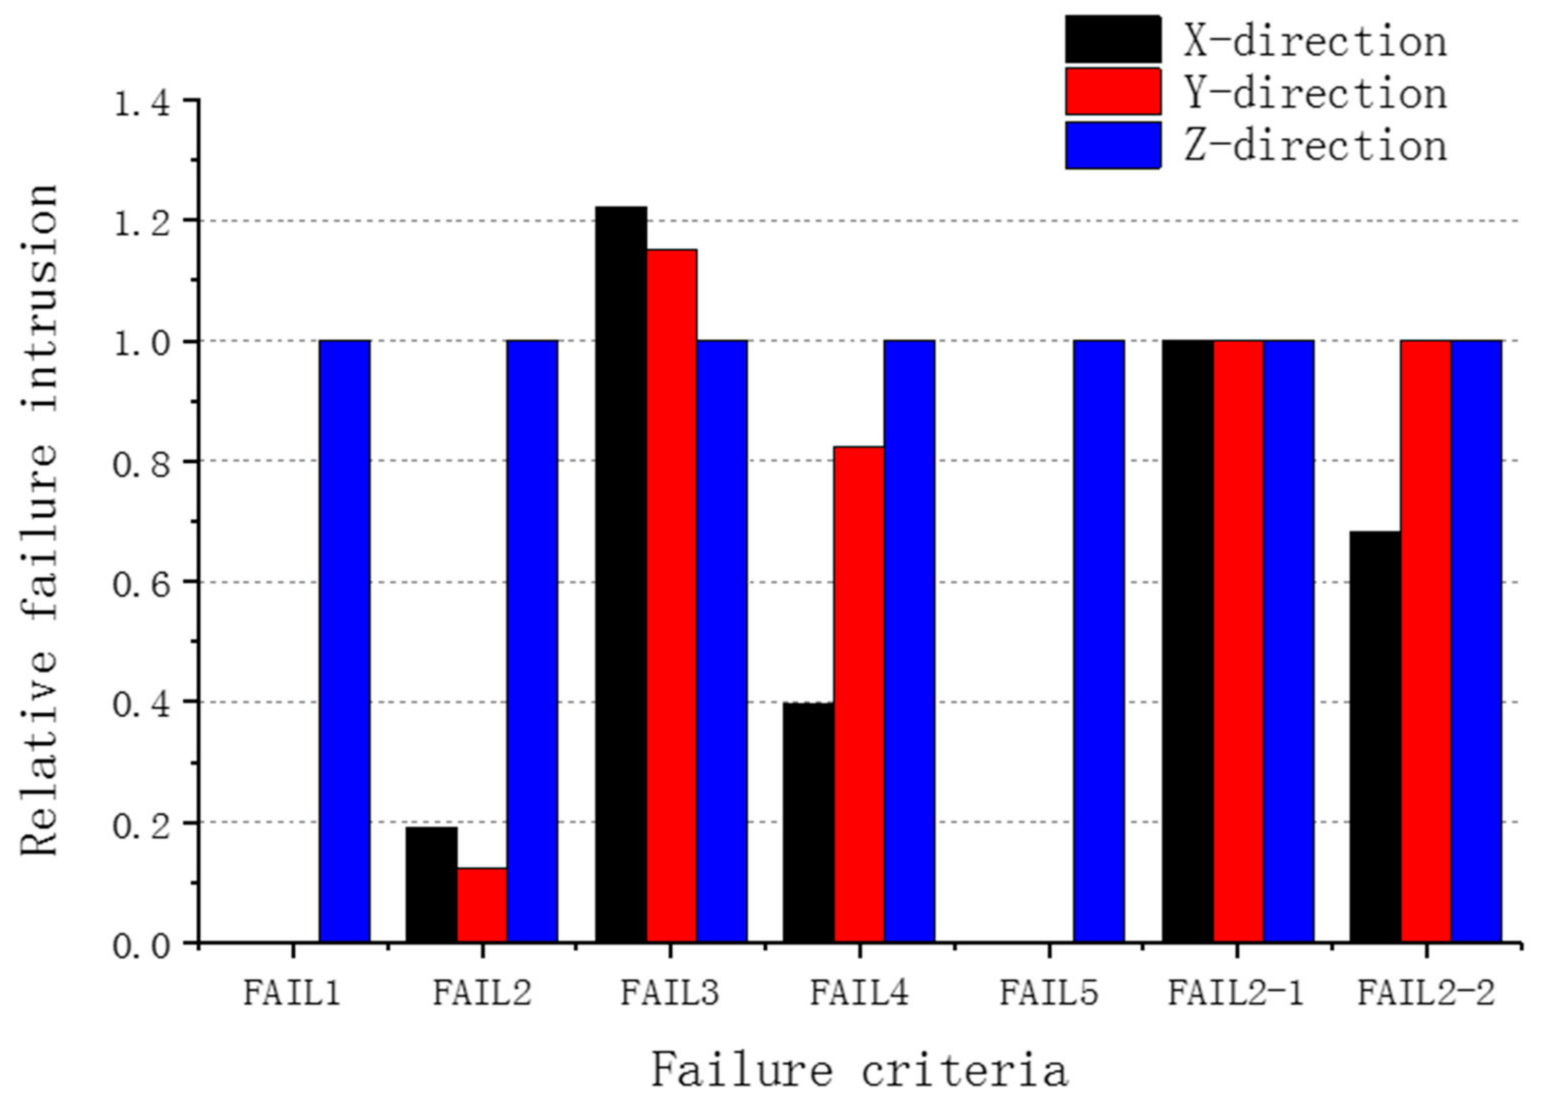
To give a quantitative comparison of the five single-parameter failure criteria mentioned in Section 4.1 and the two combined failure criteria in Section 5.3 and Section 5.4, the predicted failure intrusions of all seven criteria are normalized with the test results and shown in Figure 14. The relative failure intrusion is the ratio of predicted failure displacement in the simulations and the failure displacement in the real tests. The relative failure intrusion equal to zero (such as failure criterion 1 for X-direction and Y-direction impact) means that the jellyroll model does not reach the failure criterion during the simulation. A value of 1 means a perfect match. For five single-parameter failure criteria, the maximum shear failure criterion (failure criterion 3) can give a best prediction of all. However, with the combined failure criterion considering tension strain and compression strain, the model can give an almost perfect prediction of failure intrusions at different tests along three directions.

6. Conclusions

The aim of the study is to produce a homogenized FE model for the jellyroll in the prismatic battery cell that can capture the multidirectional failure behaviors. Based on the framework of a modified honeycomb material model, a user subroutine is implanted in Abaqus to fulfill the homogenized equivalence of the jellyroll. This model can correctly describe the anisotropic mechanical response as shown in the experiments, providing a reliable basis for further modeling of failure onsets along different directions.
To extend the current jellyroll model for failure simulation, five single-parameter failure criteria are examined at first. With the same calibration and validation process, all the five criteria with failure parameter values identified, from the Z direction, that the loading case failed to properly predict the failure onsets of jellyroll in the other two loading cases along different directions.
Analysis of the indentation process and deformation concentration mode under various cases suggests that introducing a certain combined criterion is promising to address the highly directional failure behavior for jellyroll structures. Two specific combined failure criteria are then proposed based on observation of the local strain evolution in different loading cases. Calibration and validation results indicate that both combined criteria are able to accurately predict the failure onsets in all the indentation tests along three different directions.
The homogenized FE model developed in the present paper achieves high computational efficiency and accuracy, and it comes up with effective combined failure criteria for predicting directional failure onsets of jellyroll. These features enable the extended model to meet the requirements in modeling batteries in large-scale structures and under complex loading conditions. On the other hand, we have to mention the limitations of the current model, as it still has the common shortcoming of the homogenized model category and the failure criterion is still an empirical definition. We cannot count on such a model to accurately predict details of the local damage or failure occurrence and evolution. In those aspects, detailed FE models and other characterization approaches like XCT image analysis have irreplaceable advantages.

Author Contributions

Conceptualization, Y.X.; Data curation, Y.G.; Formal analysis, L.Z. (Lingxiao Zhu); Funding acquisition, L.W. and L.Z. (Lei Zhang); Methodology, L.Z. (Lingxiao Zhu); Writing—original draft, L.Z. (Lingxiao Zhu); Writing—review & editing, L.Z. (Lingxiao Zhu), Y.X. and Y.L. All authors have read and agreed to the published version of the manuscript.

Funding

This study is supported by National Natural Science Foundation of China (Grant No. 51675294). A part of this study is also supported by Ford URP (University Research Program 001068-2019-7170R-H).

Institutional Review Board Statement

Not applicable.

Informed Consent Statement

Not applicable.

Data Availability Statement

Data available on request due to restrictions. The data presented in this study are available on request from the corresponding author. The data are not publicly available due to commercial cooperation.

Conflicts of Interest

The authors declare no conflict of interest.

References

  1. Sun, P.; Bisschop, R.; Niu, H.; Huang, X. A Review of Battery Fires in Electric Vehicles. Fire Technol. 2020, 56, 1361–1410. [Google Scholar] [CrossRef]
  2. Bulla, M.; Kolling, S.; Sahraei, E. An Experimental and Computational Study on the Orthotropic Failure of Separators for Lithium-Ion Batteries. Energies 2020, 13, 4399. [Google Scholar] [CrossRef]
  3. Zhu, J.; Zhang, X.; Sahraei, E.; Wierzbicki, T. Deformation and failure mechanisms of 18650 battery cells under axial compression. J. Power Sources 2016, 336, 332–340. [Google Scholar] [CrossRef]
  4. Zhang, C.; Xu, J.; Cao, L.; Wu, Z.; Santhanagopalan, S. Constitutive behavior and progressive mechanical failure of electrodes in lithium-ion batteries. J. Power Sources 2017, 357, 126–137. [Google Scholar] [CrossRef]
  5. Pan, Z.; Li, W.; Xia, Y. Experiments and 3D detailed modeling for a pouch battery cell under impact loading. J. Energy Storage 2020, 27, 101016. [Google Scholar] [CrossRef]
  6. Zhu, J.; Wierzbicki, T.; Li, W. A review of safety-focused mechanical modeling of commercial lithium-ion batteries. J. Power Sources 2018, 378, 153–168. [Google Scholar] [CrossRef]
  7. Liu, B.; Jia, Y.; Yuan, C.; Wang, L.; Gao, X.; Yin, S.; Xu, J. Safety issues and mechanisms of lithium-ion battery cell upon mechanical abusive loading: A review. Energy Storage Mater. 2020, 24, 85–112. [Google Scholar] [CrossRef]
  8. Sahraei, E.; Wierzbicki, T.; Hill, R.; Luo, M. Crash Safety of Lithium-Ion Batteries Towards Development of a Computational Model. In SAE Technical Paper Series; SAE International: Pittsburgh, PA, USA, 2010. [Google Scholar] [CrossRef]
  9. Sahraei, E.; Campbell, J.; Wierzbicki, T. Modeling and short circuit detection of 18650 Li-ion cells under mechanical abuse conditions. J. Power Sources 2012, 220, 360–372. [Google Scholar] [CrossRef]
  10. Sahraei, E.; Hill, R.; Wierzbicki, T. Calibration and finite element simulation of pouch lithium-ion batteries for mechanical integrity. J. Power Sources 2012, 201, 307–321. [Google Scholar] [CrossRef]
  11. Sahraei, E.; Meier, J.; Wierzbicki, T. Characterizing and modeling mechanical properties and onset of short circuit for three types of lithium-ion pouch cells. J. Power Sources 2014, 247, 503–516. [Google Scholar] [CrossRef]
  12. Xu, J.; Liu, B.; Wang, X.; Hu, D. Computational model of 18650 lithium-ion battery with coupled strain rate and SOC dependencies. Appl. Energy 2016, 172, 180–189. [Google Scholar] [CrossRef] [Green Version]
  13. Lian, J.; Wierzbicki, T.; Zhu, J.; Li, W. Prediction of shear crack formation of lithium-ion batteries under rod indentation: Comparison of seven failure criteria. Eng. Fract. Mech. 2019, 217, 106520. [Google Scholar] [CrossRef]
  14. Li, W.; Zhu, J. A Large Deformation and Fracture Model of Lithium-Ion Battery Cells Treated as a Homogenized Medium. J. Electrochem. Soc. 2020, 167, 120504. [Google Scholar] [CrossRef]
  15. Kotter, P.; Kisters, T.; Schleicher, A. Dynamic impact tests to characterize the crashworthiness of large-format lithium-ion cells. J. Energy Storage 2019, 26, 100948. [Google Scholar] [CrossRef]
  16. Zhu, L.; Ge, Y.; Wang, L.; Zhang, L.; Liu, Y.; Xia, Y. Mechanical Anisotropy and Strain-Rate Dependency of a Large Format Lithium-Ion Battery Cell: Experiments and Simulations. In SAE Technical Paper Series; SAE International: Pittsburgh, PA, USA, 2021; Volume 1, pp. 1–11. [Google Scholar] [CrossRef]
  17. Livermore Software Technology Corporation (LSTC). LS-DYNA® Keyword User’s Manual—Volume II—Material Models—R9.0. LS-DYNA® Keyword User’s Manual—Volume II—Material Models; Livermore Software Technology Corporation (LSTC): Livermore, CA, USA, 2016. [Google Scholar]
Figure 1. Setup of jellyroll experiments: (a) X-cylindrical indentation; (b) Y-hemispherical indentation; (c) Z-cylindrical indentation.
Energies 14 03444 g001
Figure 2. Test results: (a) X-cylindrical indentation and Y-hemispherical indentation; (b) Z-cylindrical indentation.
Energies 14 03444 g002
Figure 3. Deformation modes of indentation tests along different directions.
Energies 14 03444 g003
Figure 4. Jellyroll model and the coordinate system definition.
Energies 14 03444 g004
Figure 5. Models of three loading cases: (a) X direction; (b) Y direction; (c) Z direction.
Energies 14 03444 g005
Figure 6. Hardening curves of three major directions: (a) whole plot; (b) local enlarged plot.
Energies 14 03444 g006
Figure 7. Simulation results without failure criterion along three directions: (a) X direction; (b) Y direction; (c) Z direction.
Energies 14 03444 g007
Figure 8. Simulation results with single-parameter failure criteria calibrated by the test results along Z direction: (a) Z-direction; (b) Y-direction; (c) X-direction.
Energies 14 03444 g008
Figure 9. X component of strain during indentation simulation along Z direction.
Energies 14 03444 g009
Figure 10. Component of strain during indentation simulation along Y direction: (a) Y component; (b) XY component; (c) YZ component.
Energies 14 03444 g010
Figure 11. Component of strain during indentation simulation along X direction: (a) X component; (b) XY component; (c) XZ component. (Half of the jellyroll is shown in (b,c).
Energies 14 03444 g011
Figure 12. Simulation results with failure criterion considering tension strain and compression strain: (a) X direction; (b) Y direction; (c) Z direction.
Energies 14 03444 g012
Figure 13. Simulation results with failure criterion considering tension strain and shear strain: (a) X direction; (b) Y direction; (c) Z direction.
Energies 14 03444 g013
Figure 14. Comparison of prediction accuracy of seven failure criteria in simulations of loading cases along three directions.
Energies 14 03444 g014
Table 1. The material parameters of the homogenized model.
Parameter E Poisson s   ratio μ σ y V f E 11 U
Value18,000 MPa0.0118,000 MPa0.19000 MPa
Parameter E 22 U E 33 U G 12 U G 23 U G 13 U
Value9000 MPa9000 MPa4500 MPa4500 MPa4500 MPa
Table 2. Single-parameter failure criteria and their formulations considered in the study.
Serial NumberFailure CriterionCalibration Parameter by
X DirectionY DirectionZ Direction
FAIL1Von Mises stress52 MPa86 MPa128 MPa
FAIL2Maximum principal stress30.0 MPa10.1 MPa17.3 MPa
FAIL3Maximum shear stress60 MPa91 MPa132 MPa
FAIL4Volumetric strain0.810.820.26
FAIL5Maximum principal strain0.0620.0670.164
Table 3. Failure criterion considering tension strain and compression strain.
Failure CriterionStrain_XXStrain_XXStrain_YY
FAIL2-1Strain_XX > 0.043Strain_XX < −0.86Strain_YY < −1.3
Table 4. Failure criterion considering tension strain and compression strain.
Failure criterionStrain_XXStrain_XY
FAIL2-2Strain_XX > 0.043Abs(Strain_XY) > 0.04
Publisher’s Note: MDPI stays neutral with regard to jurisdictional claims in published maps and institutional affiliations.