Article

Wind Climate and Wind Power Resource Assessment Based on Gridded Scatterometer Data: A Thracian Sea Case Study

1
Laboratory of Ecological Engineering and Technology, Department of Environmental Engineering, Democritus University of Thrace, 67100 Xanthi, Greece
2
Department of Astronautics, Electrical and Energy Engineering (DIAEE), Sapienza University of Rome, 00184 Rome, Italy
3
Department of Planning, Design, and Technology of Architecture, Sapienza University of Rome, 00197 Rome, Italy
*
Author to whom correspondence should be addressed.
Energies 2021, 14(12), 3448; https://doi.org/10.3390/en14123448
Submission received: 18 May 2021 / Revised: 5 June 2021 / Accepted: 8 June 2021 / Published: 10 June 2021
(This article belongs to the Special Issue GIS and Remote Sensing for Renewable Energy Assessment and Maps)

Abstract

:
The present analysis utilized the 6-hourly data of wind speed (zonal and meridional) for the period between 2011 and 2019, as retrieved from the Copernicus Marine Environmental Service (CMEMS), covering the Thracian Sea (the northern part of the Aegean Sea). Data were estimated from the global wind fields derived from the Advanced Scatterometer (ASCAT) L2b scatterometer on-board Meteorological Operational (METOP) satellites, and then processed towards the equivalent neutral-stability 10 m winds with a spatial resolution of 0.25° × 0.25°. The analysis involved: (a) descriptive statistics on wind speed and direction data; (b) frequency distributions of daily-mean wind speeds per wind direction sector; (c) total wind energy content assessment per wind speed increment and per sector; (d) total annual wind energy production (in MWh/yr); and (e) wind power density, probability density function, and Weibull wind speed distribution, together with the relevant dimensionless shape and scale parameters. Our results show that the Lemnos Plateau has the highest total wind energy content (4455 kWh/m2/yr). At the same time, the area to the SW of the Dardanelles exhibits the highest wind energy capacity factor (~37.44%), producing 7546 MWh/yr. This indicates that this zone could harvest wind energy through wind turbines, having an efficiency in energy production of 37%. Lower capacity factors of 24–28% were computed at the nearshore Thracian Sea zone, producing between 3000 and 5600 MWh/yr.

1. Introduction

Through the European Green Deal, the European Union (EU) has set a target to reach total decarbonization and achieve energy efficiency for its members by the year 2050 [1]. To achieve this ambitious goal, the power production sector would follow the Clean Energy Transition pathway, with renewable energy sources at the epicenter of such conversion. In this gradually changing energy mix, the offshore wind industry is expected to play a significant role, experiencing a considerable increase in the coming several decades [2,3]. The EU plans to install in all European Sea at least 240 gigawatts (GW) of global offshore wind power capacity by 2050 [4]. Current developments illustrate the exponential growth in offshore wind installations (e.g., offshore wind grew from 1% of annual capacity additions in global wind installations in 2009 to over 10% in 2019) [3].
Technological progress, recent developments in floating technologies, and significant cost reductions, in conjunction with local, low level, and controllable environmental impacts, appear to be the main factors driving the transformation of offshore wind energy into a safe and commercially viable form of clean power generation [5]. In any case, the total offshore installations reached 29.1 GW by the end of 2019, representing only 5% of total global wind capacity and generating barely 0.3% of global electricity production. In the EU, approximately 10 million households are now being served by offshore wind energy. In the U.S., the first commercial Offshore Wind Farm (OWF) started its operation in December 2016. However, up to the present date development activity remains impressively high, and sixteen active commercial leases for offshore wind development have been procured [6]. In Southeast Asia, countries such as China, Japan, and Taiwan lead the market, with China surpassing 1 GW in annual offshore wind installation [3].
The above indicates the enormous potential for offshore wind capacity growth. On this account, a large amount of new OWFs will be designed, installed, and will become operational, especially in Europe where the European Commission (EC) forecasts that total offshore wind installations will range between 240 and 450 GW by 2050 [4].
Although all OWFs are concentrated in the North and the Irish Seas, a clear tendency from the private sector to harvest the Mediterranean’s wind power potential has also been observed. A 30 MW wind farm comprised of 10 monopole wind turbines is expected to be installed in the Apulia region, southern Italy, as the first Mediterranean offshore wind project to be implemented. Even though 1 GW of offshore wind power is equivalent to emissions of 3.5 MT CO2 (Carbon dioxide), several technological, administrative, legislative, environmental, socio-economic, and financial barriers exist in the development of OWF projects. Such barriers have been summarized by Soukissian et al. [7]. The Geographic Information System (GIS) mapping of offshore marine and maritime uses could assist the selection of proper locations for and placements of turbines [8].
The most crucial suitability selection criterion for wind farm siting (i.e., the wind resource availability [9]), in conjunction with the presence of a wide continental shelf ensuring relatively shallow depths and an appropriate distance from shore [10], could be met over the Thracian Sea in the Northern Aegean. Several investigators have assessed the wind power potential in the broader area, especially in Çanakkale [5] and Bozcaada [11], the Samothraki Island [12], and the whole Aegean Sea [13]. Most studies have utilized data from meteorological stations [5,11]. Bagiorgas et al. [13] used wind data from offshore buoys. Soukissian et al. [7] downscaled the European Centre for Medium-Range Weather Forecasts (ECMWF) reanalysis data, using a high-resolution meteorological model (15 year period, 0.10° × 0.10°) validated by offshore buoy data, while Majidi Nezhad et al. [12] utilized the ERA–Interim reanalysis dataset (40 year period, mean monthly data).
In this work, the gridded 6-hourly wind data collected from ASCAT L2b scatterometer on-board METOP satellites, combined with the ECMWF ERA–Interim atmospheric reanalysis, as provided by the Copernicus Marine Environmental Monitoring Service (CMEMS), were used to assess the offshore wind power potential over the whole Thracian Sea and the Lemnos Plateau. This is an area of significant interest for wind offshore energy development, especially along the NNE–SSW axis following the wind exiting from the Dardanelles Straits [14,15].
Scatterometer data have been widely used in literature for large-scale wind resource assessments, filling the gap in the absence of offshore meteorological stations while providing continuous, systematic, long-term, and relatively-accurate wind data. However, data reliability suffers from low pixel resolution, together with errors related to sensor malfunctioning, wind retrieval algorithm, rain contamination, land contamination, etc. [16]. Several global and regional wind resource assessment studies exist using scatterometer data, mostly using QuickSCAT (Pimenta et al. [17] for offshore SE Brazil; Mostafaeipour [18] for the Persian Gulf and Gulf of Oman; Karamanis et al. [19] for the Ionian Sea; and Fuverik et al. [20] for the whole Mediterranean Sea). To minimize errors induced by the above factors, recent studies have explored offshore wind resources utilizing multiplatform datasets such as QuickSCAT, rapidSCAT, METOP-A and METOP-B, OCEANSAT-2, and others [21].

2. Materials and Methods

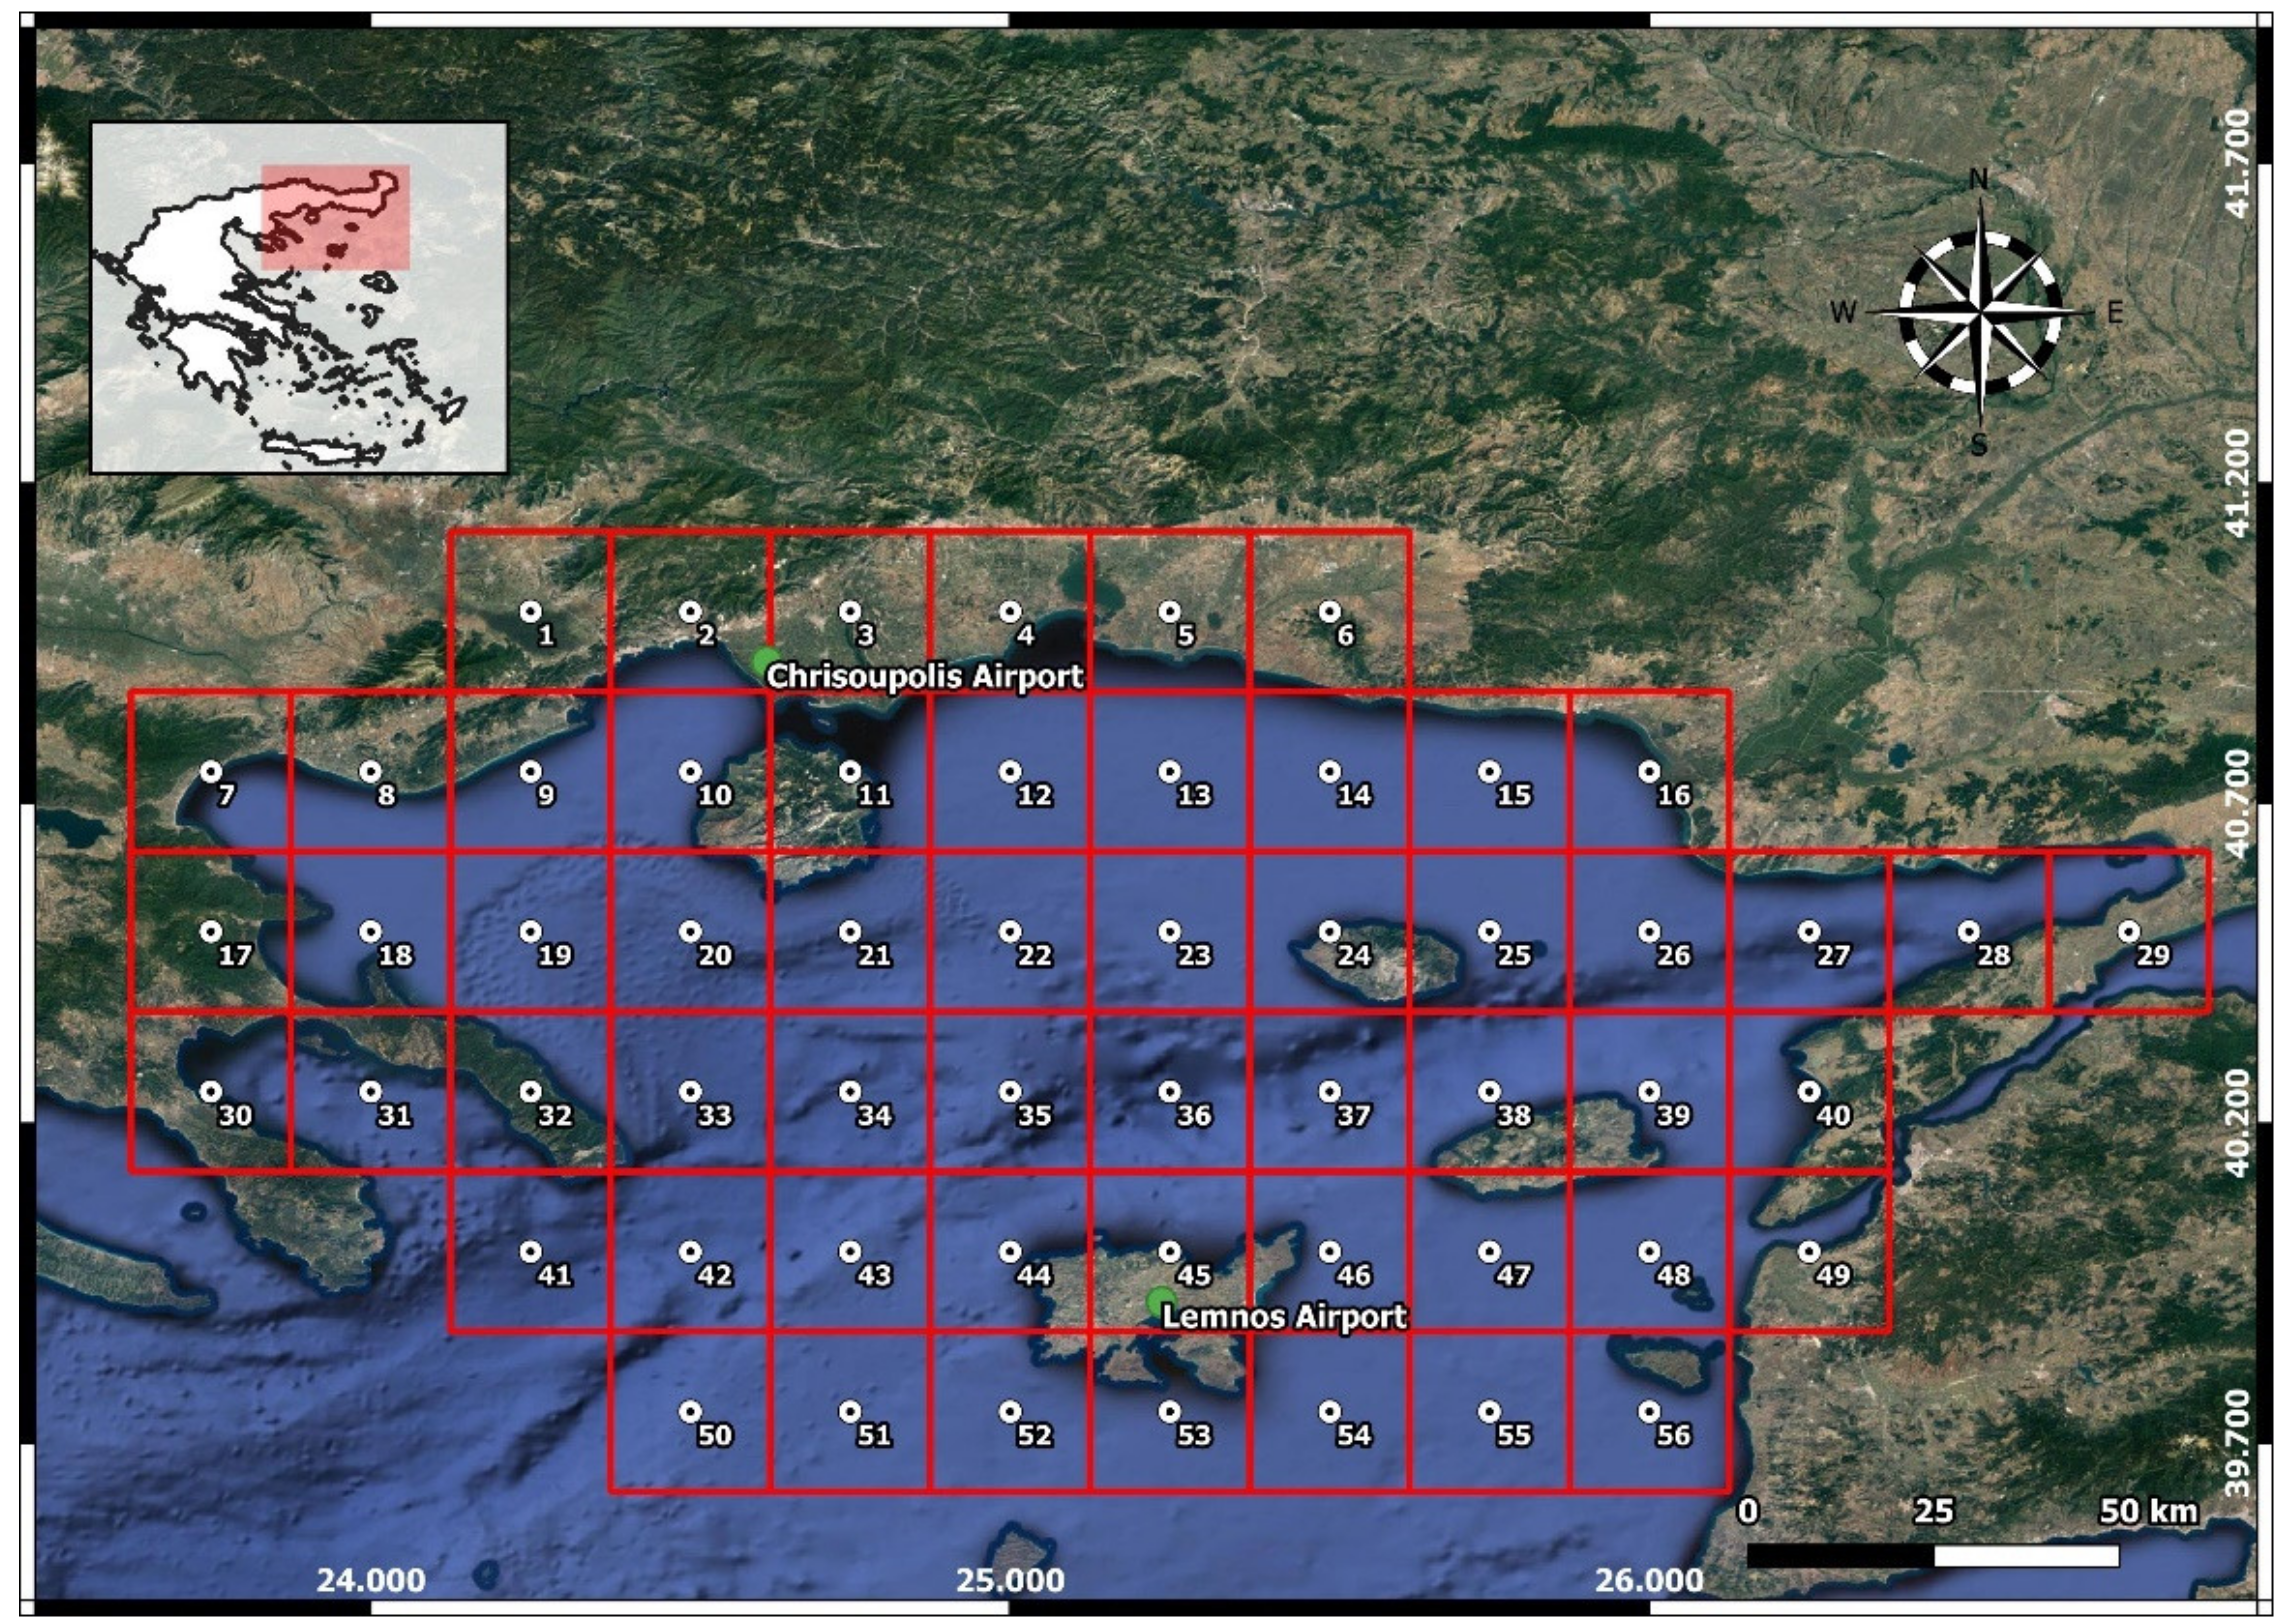
2.1. Study Area Description

The study area covers the Thracian Sea, the northern part of the Aegean Sea (from 39.7° N to 40.9° N and 23.7° E to 26.3° E), an area with complex bathymetry and hydrography (Figure 1). This area is characterized by abrupt topographic and bathymetric changes due to the extensive width of the continental shelf (40 km) and the North Aegean Trough, a NE–SW oriented deep trench separating the Thracian Sea shelf from Lemnos Plateau [22]. Coastal morphology consists of semi-enclosed gulfs, such as Saros, Alexandroupolis, Kavala, and Strymonikos, located along the northern coast.
This area is influenced by the outflow of the Black Sea Water, exiting from the Dardanelles Straits and the prevailing N–NE wind circulation, known as the Etesians [23]. The present analysis divided the study area into six main sub-areas based on their physiographic and meteorologic characteristics: the western Thracian Sea (stations 7–9, 17–19), central Thracian Sea (10–13, 20–23), eastern Thracian Sea (14–16, 24–29), the Lemnos Plateau (43–46, 52–54), the Dardanelles’ zone of influence (47–49, 55, 56), and the Siggitikos Gulf–Mt Athos (30–33, 41).

2.2. Wind Data Description

The 6-hourly data of wind speed (eastings and northings), measured 10 m above sea level with a spatial resolution of 0.25° × 0.25°, were retrieved from the Copernicus Marine Environmental Monitoring Service (CMEMS). The data product used was encoded as WIND_GLO_WIND_L4_REP_OBSERVATIONS_012_006 (http://marine.copernicus.eu/documents/PUM/CMEMS-WIND-PUM-012-006.pdf, accessed on 26 April 2021), referring to a set of time-series comprised of level 4 reprocessed hindcasted wind observations, assimilated on a global ocean model. Data were estimated from the global wind fields derived from ASCAT scatterometers on-board the METOP-A and METOP-B satellites, combined with ECMWF ERA–Interim atmospheric reanalysis.
The dataset consists of six meteorological variables: wind speed, zonal and meridional wind components, wind stress amplitudes, and the associated components. The present analysis covered the period from January 2011 to December 2019. The resulting fields were estimated on a daily and monthly basis, as equivalent neutral-stability 10 m winds having spatial resolutions of 0.25° in longitude and latitude over the study area (Figure 1).
In total, 56 grid points were analyzed, while in situ daily-mean wind data were retrieved for the above defined period from the World Meteorological Organization (WMO) stations located at the Lemnos Airport and the Chrisoupolis Airport (Hellenic Meteorological Service, Figure 1). These data were used to assess the consistency of the CMEMS remotely sensed wind dataset in the study area.

2.3. Qualitative Wind Data Assessment

A set of statistical parameters were used to test the quality of CMEMS scatterometer datasets. These include the difference between temporal means (defined as bias) and the Root Mean Square Difference (RMSD) between the in situ (considered as ground-truth) and the satellite data products, the scalar (r) and the regression coefficient slope (bS). A similar analysis was also performed by Bentamy et al. [24] between CMEMS and offshore wind data from buoys in the California, Canary, and Benguela zones. These statistical measures are estimated as:
B i a s = X Y ¯
R M S D = ( X Y ) 2 ¯
S T D = X Y X Y ¯ 2 ¯
ρ = X X ¯ Y Y ¯ ¯ S T D X S T D Y
b S = Y 2 ¯ X 2 ¯
where X is the wind speed measured by the meteorological station and Y the CMEMS wind speed.

2.4. Preliminary Data Processing

The 6-hourly wind data from 56 data points, located at the center of CMEMS grid (covering the whole Thracian Sea) were retrieved in the form of u- and v-wind speed time-series (in m/s) from 1 Janurary 2011 00:00 until 31 December 2019 21:00 (in total, 13,148 values per point). The power law was used to estimate the wind speed at wind turbine hub height (93 m) with the 10 m wind speed, as:
U h u b = U 10 Ζ h u b Z 10 a
where Uhub is the wind speed at the hub height of the wind turbine (m/s), U10 is the CMEMS scatterometer data at 10 m above sea level (m/s), Zhub is the hub height of the wind turbine (m), Z10 refers to 10 m above sea level, and α = 0.123 (as in Bagiorgas et al.) [13].
Using these wind data profiles, the mean daily and monthly values of wind speed and direction at the hub height were produced for each examined grid point. Descriptive statistical parameters on wind speed and direction data were computed as the dataset minimum, first quartile (Q1), median, mean, third quartile (Q3), and maximum values. Frequency distributions of daily-mean wind speeds were computed per wind directional sector, and relevant tables were produced. Based on these results, wind roses were developed indicating the frequency variability per wind speed increment and per wind direction sector. Mean-monthly wind speeds were computed on a year-to-year basis, and boxplots were produced.

2.5. Weibull Probability Function

Several probability density functions are available in the literature to be fitted on the distributions representing the wind speed frequency curve per directional sector for the prediction of randomly distributed wind speed data [25]. The Weibull probability density function depicts an acceptable accuracy level in numerous wind power studies worldwide, expressed mathematically as:
f ( W b ) = k A W b A k 1 e W b A k
where f(W) is the frequency of occurrence of wind speed W, A is the scale parameter (measure for the wind speed), and k is the shape parameter (description of the shape of the distribution) per directional bin. The Weibull distribution parameters were estimated by:
k = b = 1 n W b k   l n W b f W b b = 1 n W b k   f W b b = 1 n   l n W b f W b f W b 0 1
A = 1 f W b 0   b = 1 n W b k f W b 1 / k
where Wb is the mean wind speed per directional bin b, n is the number of bins, f(Wb) is the frequency for wind speed ranging within bin b, and f(Wb) ≥ 0 is the probability for wind speed equal to or exceeding zero. To estimate the Weibull distribution parameters k and A, an analysis was performed in R programming language (fitdistrplus package [26]) using the maximum likelihood estimation method per directional bin.

2.6. Wind Energy Content and Power Density

Using the estimated Weibull probability density function, the total wind energy content per directional bin was computed. The total wind energy content (in kWh/m2/yr) can be understood as the theoretic energy potential of a particular site. Therefore, it is a useful metric for the resource assessment of an area and for comparative purposes among areas, being independent of the characteristics of the wind turbine. The available wind energy content per wind speed increment and wind direction at each gridded point of the Thracian Sea was assessed using the R-package bReeze, by:
E ( W ) = 1 2 ρ a i r H b = 1 n W b 3 f W b
where ρair is the density of air at the sea level under a mean temperature of 15 °C and one atmospheric pressure (=1225 kg/m3), n is the total number of directional bins (=16), H is the number of hours of the desired period (=8760 per year), Wb is the wind speed per directional bin, and f(Wb) is the probability of that bin, estimated by the Weibull distribution described in the previous equation. [6].
Wind power density is an important factor when assessing the wind potential of a location. It designates the available amount of energy per unit of time and swept area of the blades at the selected location. It is this amount of energy that will be converted to electricity by the wind turbine. The estimation of wind power density per directional bin is achieved by fitting the Weibull distribution to the respective dataset, expressed mathematically as:
P ( W ) = 1 2 ρ a i r b = 1 n W b 3 f W b

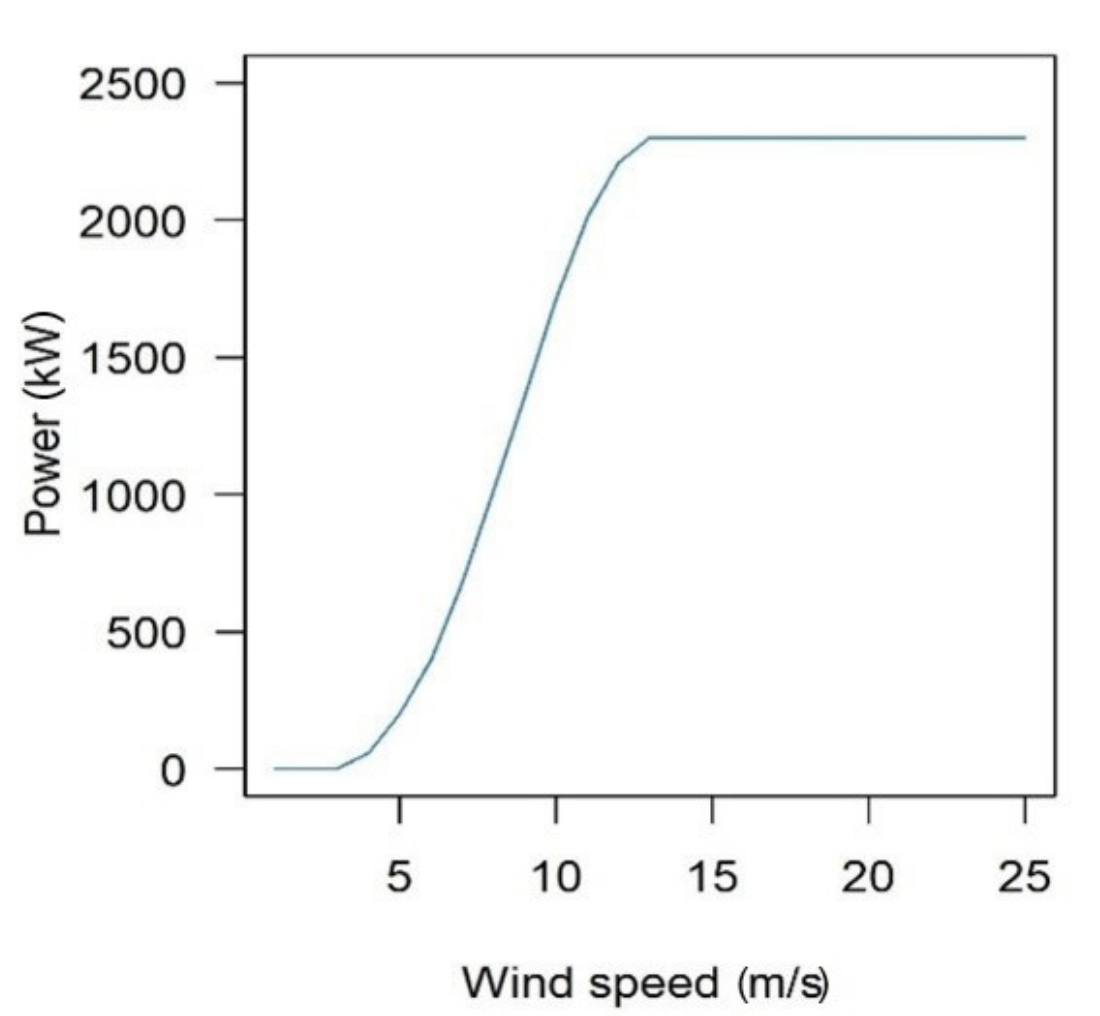
2.7. Annual Wind Energy Production

The estimation of the annual wind energy production is as follows:
A E P = A t u r b ρ ρ p c H b = 1 n f ( W b ) P W b
where Aturb is the average availability of the turbine, ρair is the density of air (=1225 kg/m3), ρpc is the specific air density for power curve definition, f(Wb) is the probability of the wind speed bin Wb, estimated by the Weibull distribution, and P(Wb) is the power output for that wind speed bin. Finally, H is the number of operational hours (= 8760 h).
The Capacity Factor (CF) represents the productive suitability of the wind turbine, i.e., an indicator to assess the field performance of the turbine. It is defined as the ratio between the average output power (Pout) of the wind turbine represented by the AEP and the theoretical maximum power output on annual basis. It is defined as:
C F = A E P P t h H
where Pth is the wind turbine’s theoretical power, defined as being proportional to the wind speed cubed for wind speeds lower than the rated wind speed and equal to the turbine rated power for higher wind speeds. In this work, the annual energy production and the capacity factor were assessed based on a Siemens SWT 2.3 MW wind turbine with a height of 93 m. This turbine was selected as a potential monopile system to be deployed at an offshore wind farm in NE Lemnos. The power curve for this turbine (consisting of wind speed and power pairs), starting at the cut-in wind speed of the turbine and ending with the cut-out wind speed, is shown in Figure 2.

3. Results

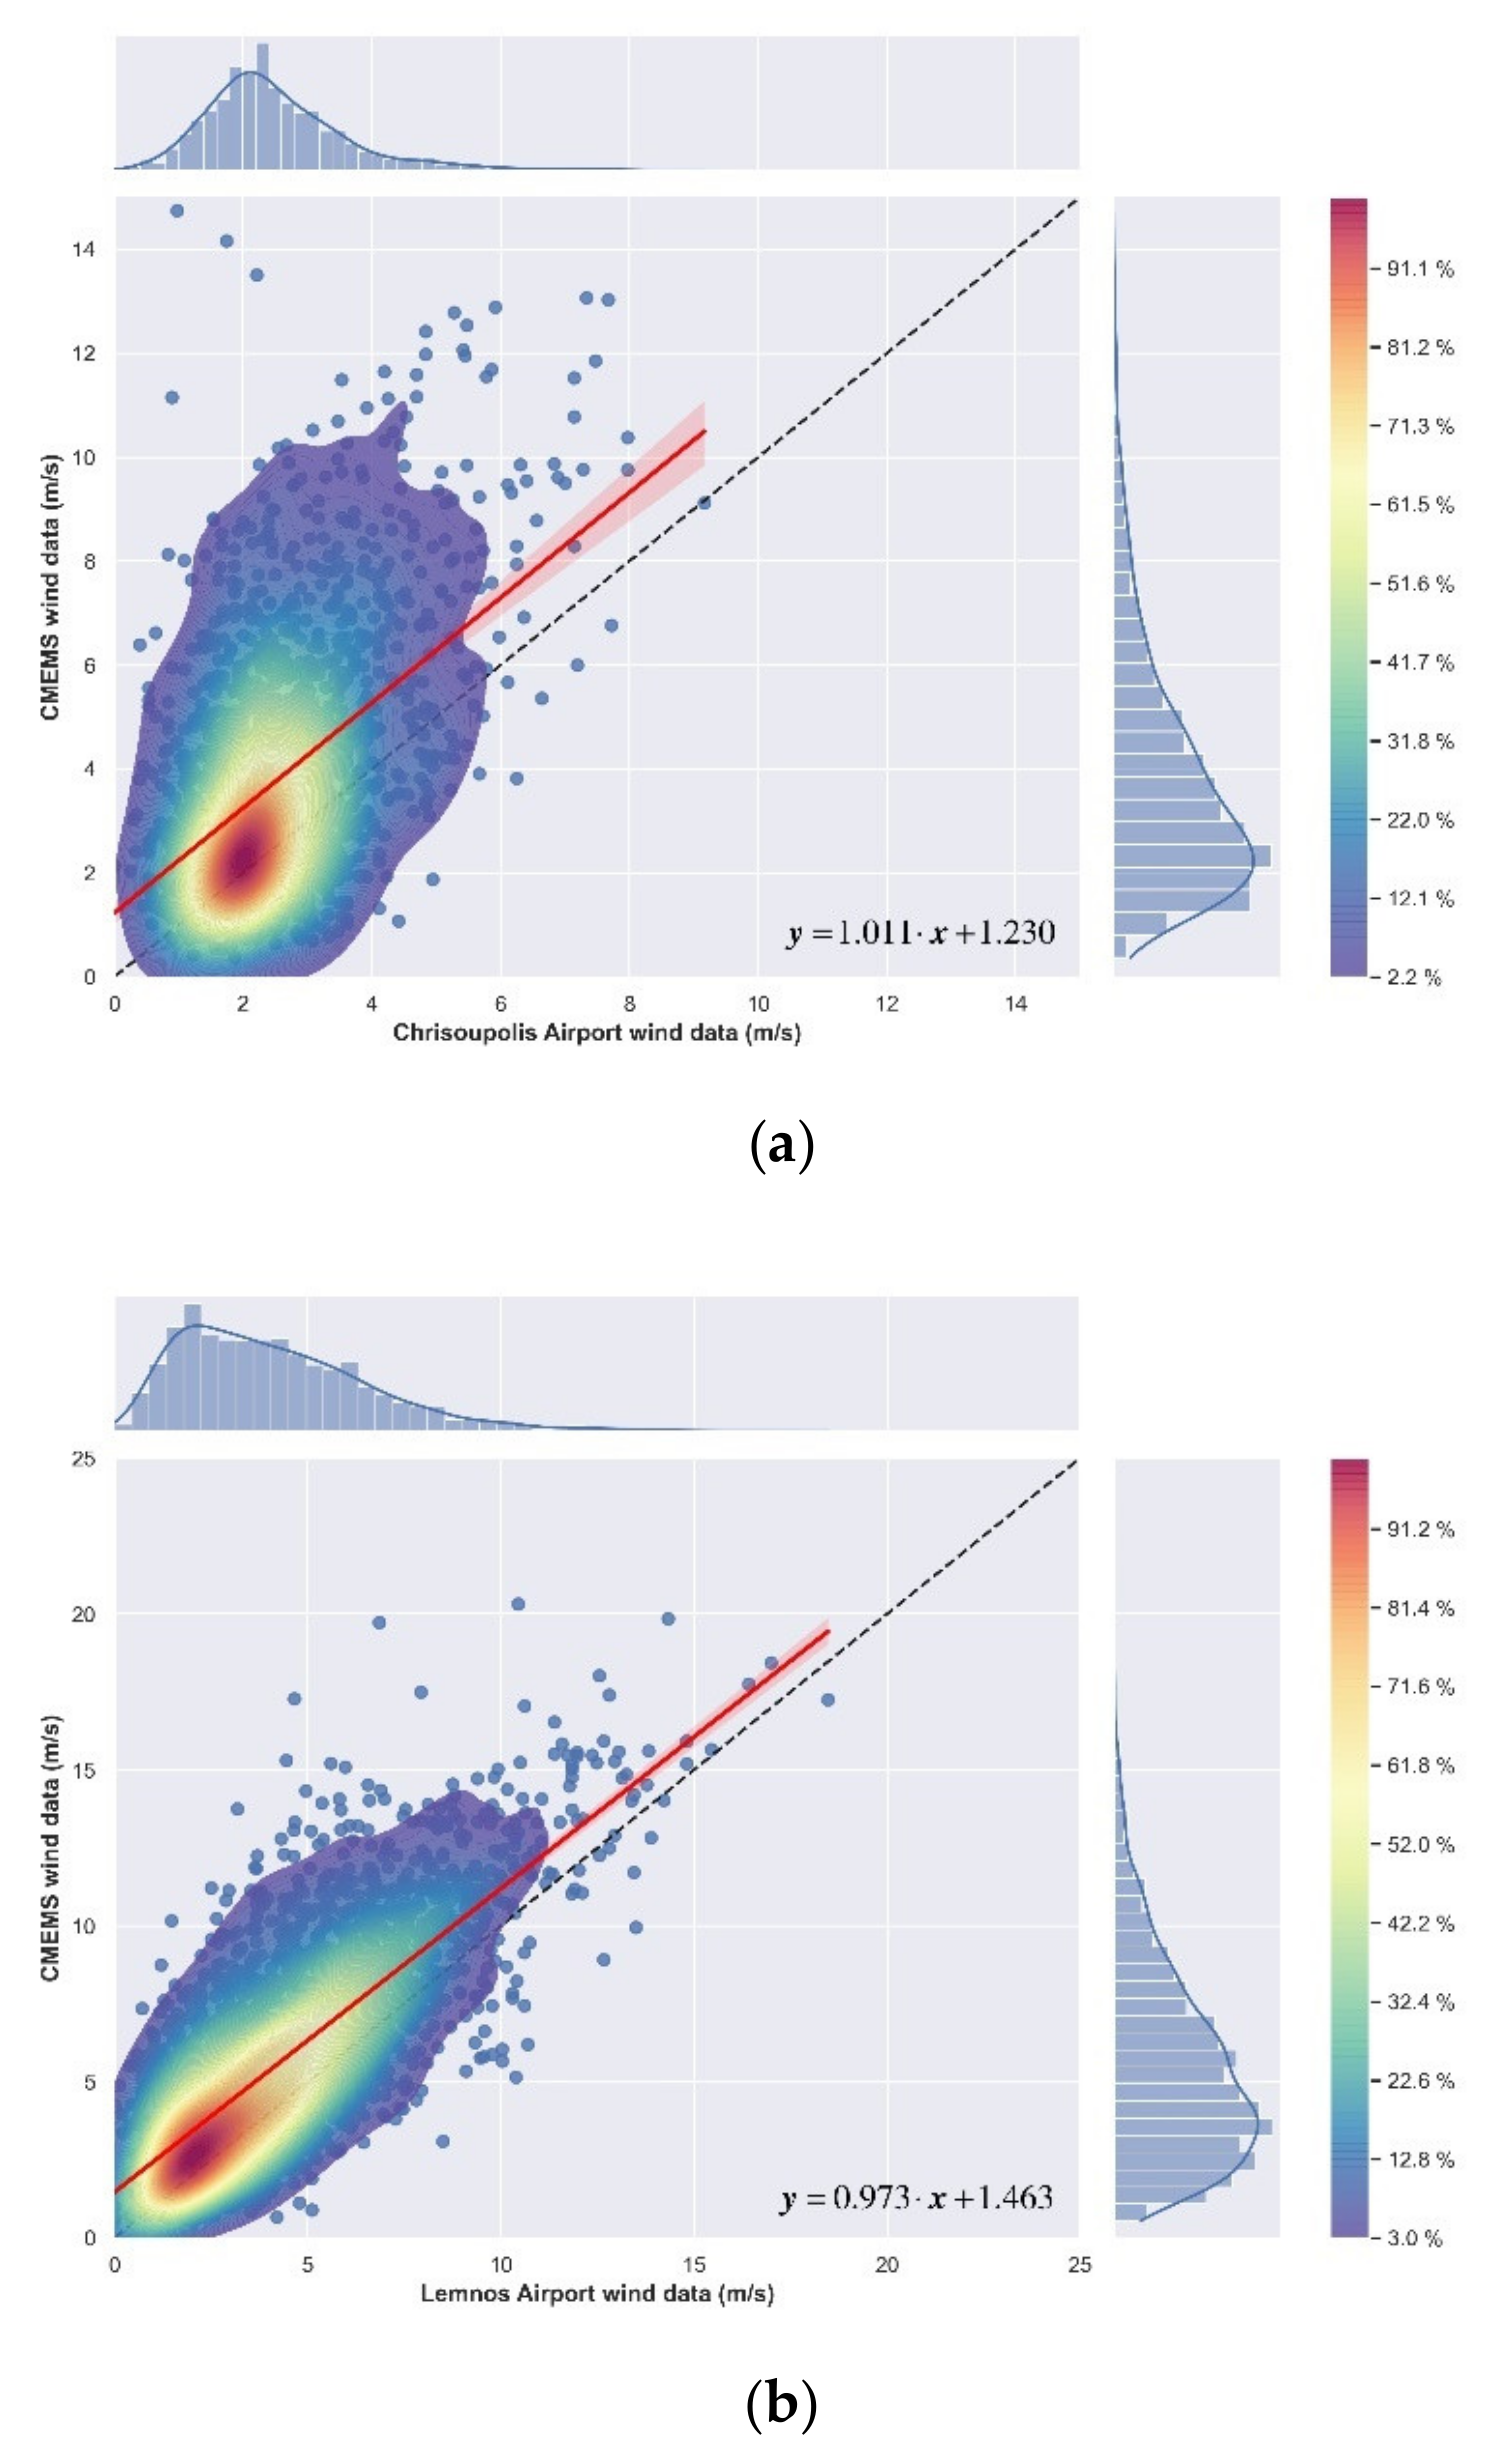
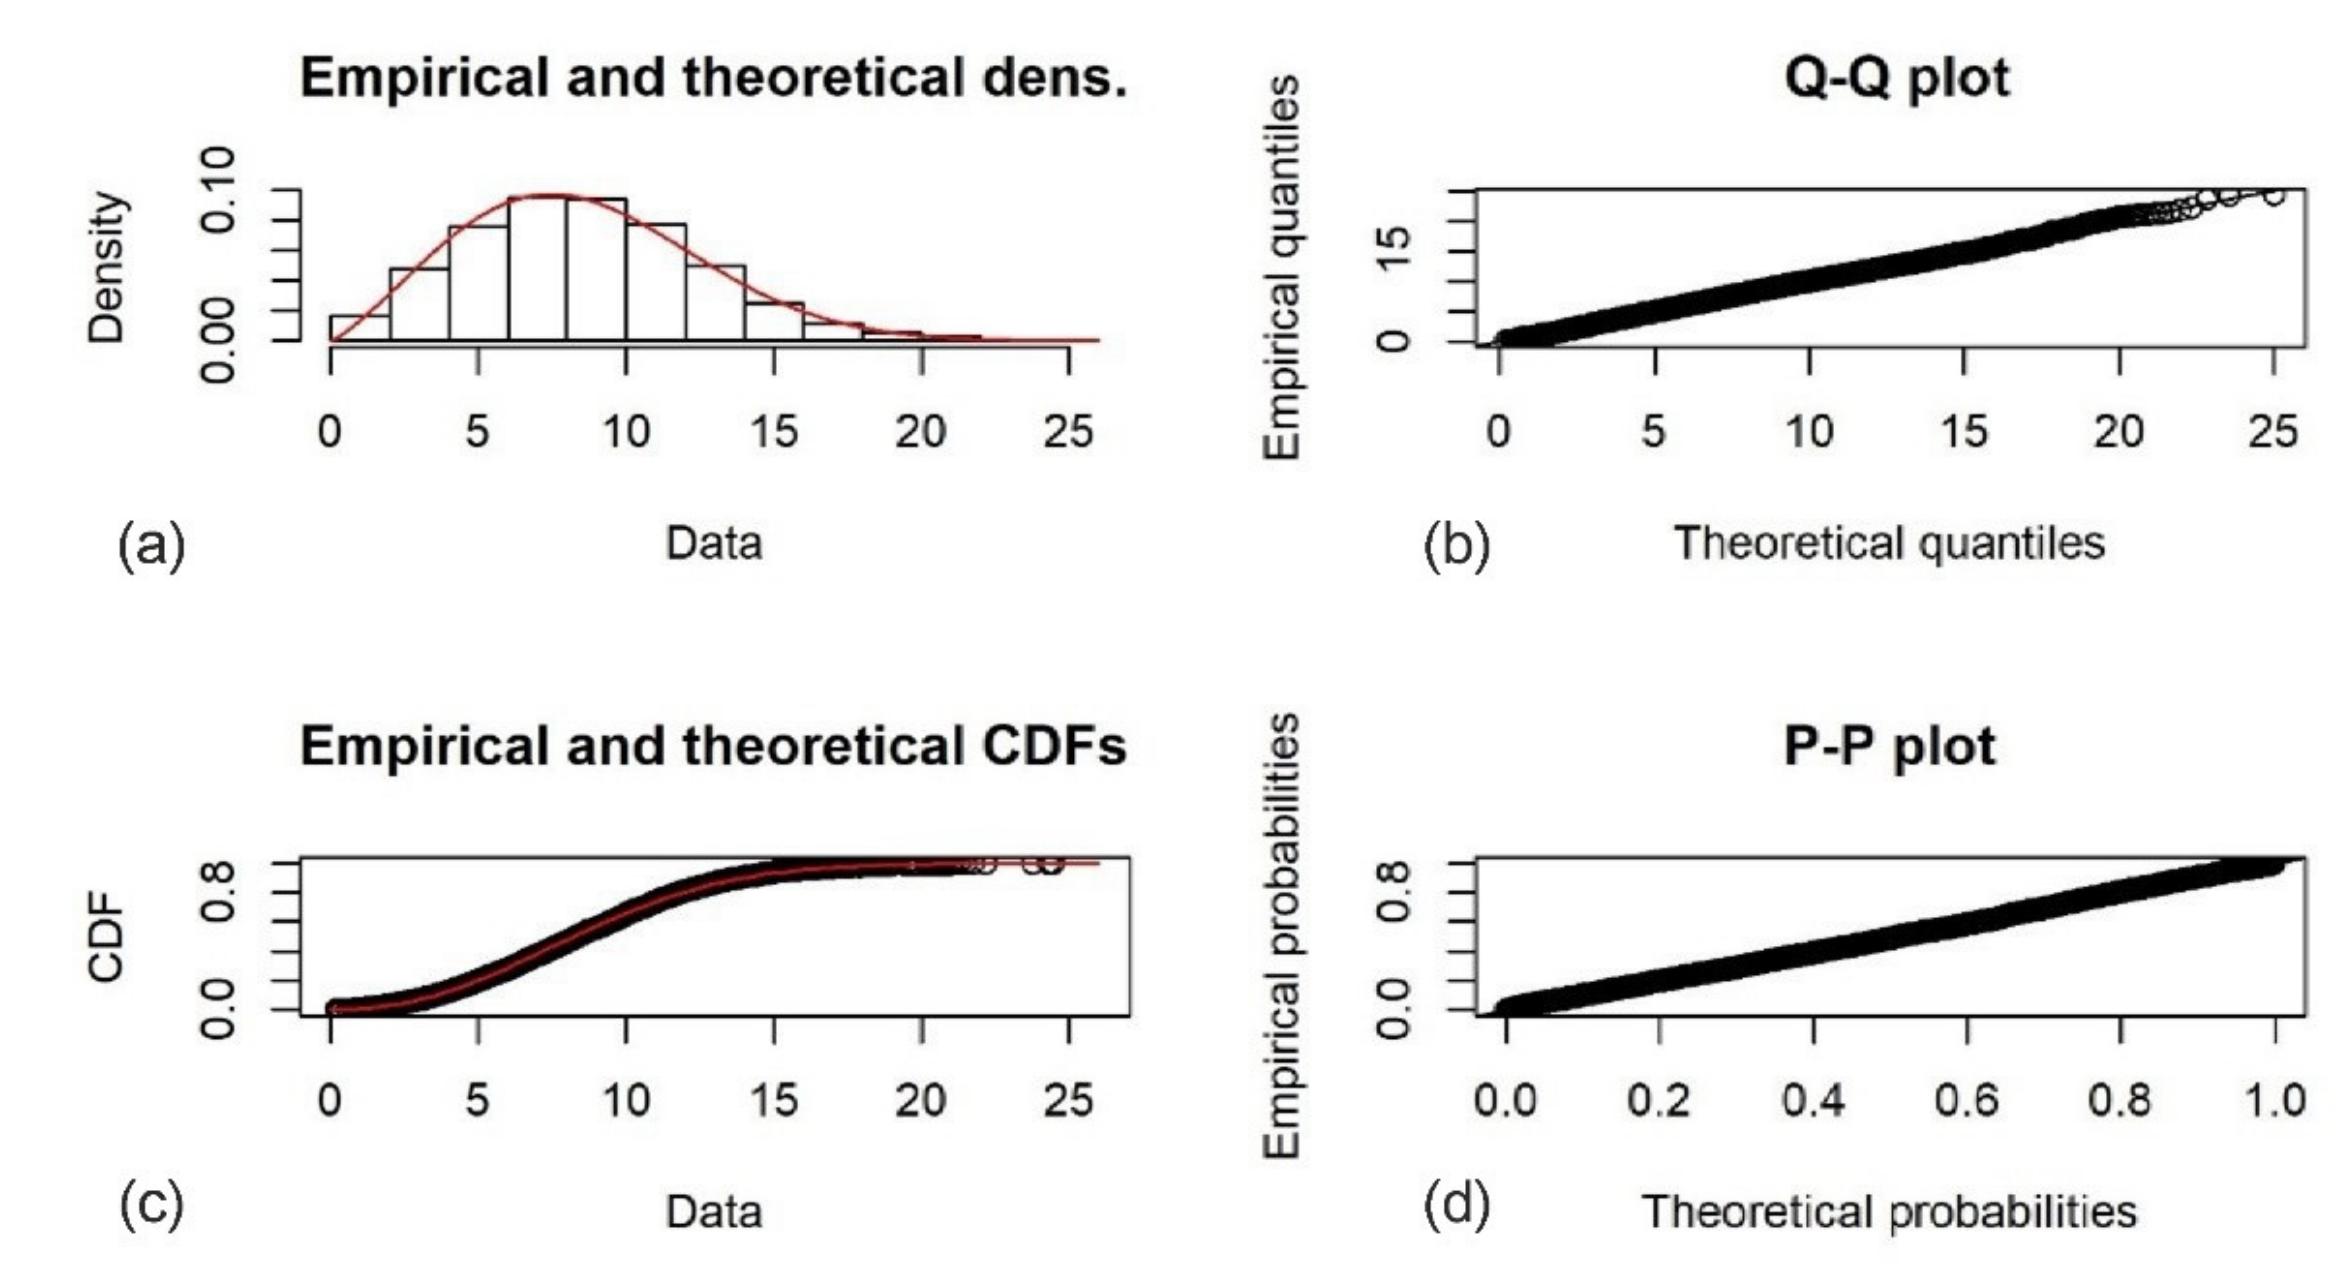
3.1. Assessment in Satellite Wind Analysis Accuracy

The intercomparison of the satellite-derived wind data products against “ground-truth” data collected from meteorological stations led to the assessment of regional accuracy in the satellite wind analysis. Unfortunately, offshore buoy data were not available. Thus, comparisons were made against land-based stations of low altitude and in proximity to the shore on a daily-mean basis. Figure 3a,b illustrate the scatter and fitted line plots between the 10 m wind speed retrieved from CMEMS (grid points 45 and 2) and the wind data collected from the Lemnos and Chrisoupolis meteorological stations, respectively.
These figures illustrate the rather good correlation with a slight overestimation of CMEMS wind speed data at the open Thracian Sea area (Lemnos: n = 3287; bias: −1.35; RMSD = 2.43; STD = 2.02; ρ = 0.76; bS = 1.31), and a moderate overestimation at the Thracian coastal zone (Chrisoupolis: n = 1825; bias: −1.25; RMSD = 2.33; STD = 1.97; ρ = 0.50; bS = 1.59), in relation to the in situ meteorological datasets. In Lemnos, agreement is higher at high wind speeds (15–20 m/s and >20 m/s, bias: −1.03; RMSD = 1.76; STD = 1.37; ρ = 0.78; bS = 1.02). Regression equations for both areas were defined, as:
CMEMS scatterometer data = 1.011 × Meteorological station data + 1.230
for the Chrisoupolis Airport, and
CMEMS scatterometer data = 0.973 × Meteorological station data + 1.463
for the Lemnos Airport.
Errors and biases are attributed to the coarse resolution of data product, exhibiting the tendency of satellite-derived ASCAT data to overestimate offshore winds [27]. Similar findings were also reported by Alvarez et al. [28], showing that similar satellite data, such as QuikSCAT, CCMP, and CFSR datasets, overestimated the wind (especially at high wind speeds >4 m/s).

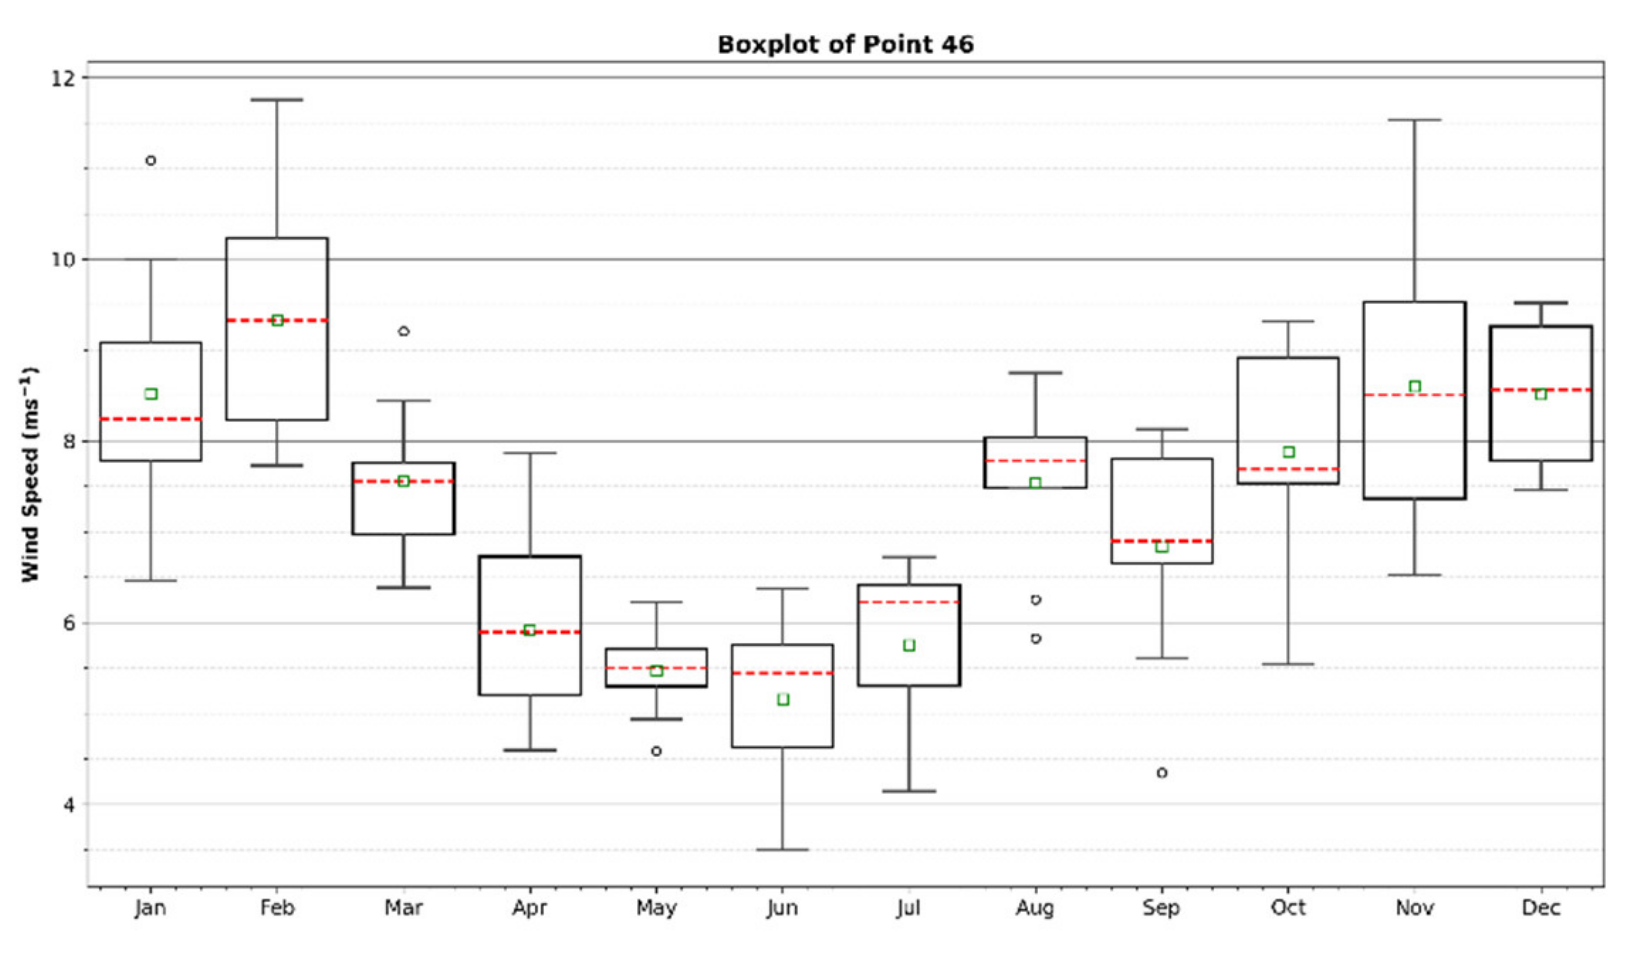
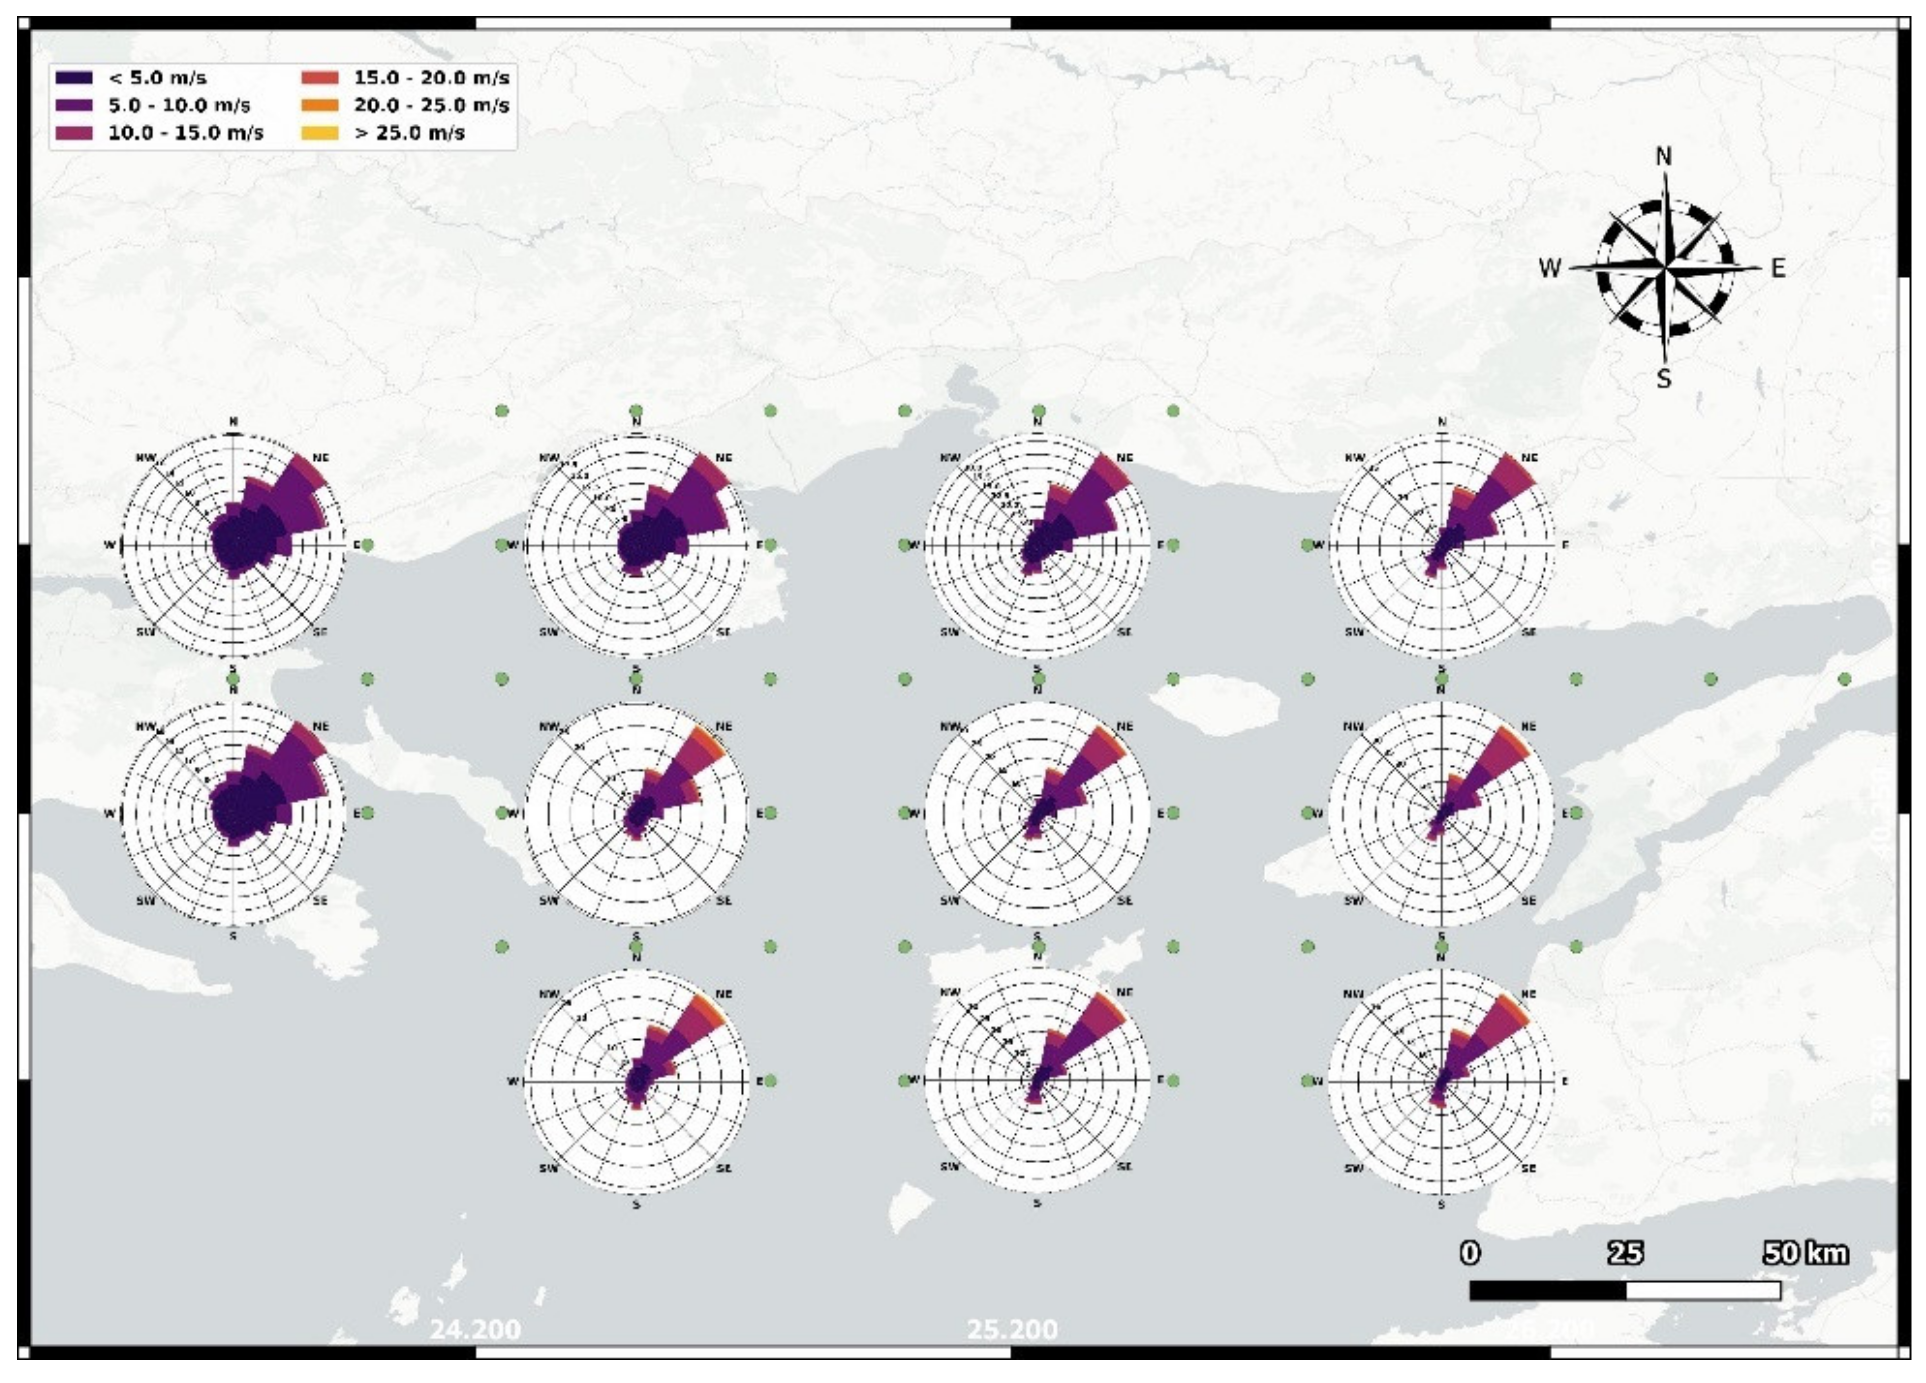
3.2. Descriptive Wind Statistics per Sub-Area

In order to be able to analyze the wind data at hub level (93 m) and to provide analytical descriptive statistics, data from grid points were spatially-aggregated according to the main physiographic units of the study area. Table 1 presents the summary values for these sub-areas. Results indicate that along the Thracian Sea continental shelf, a gradient in wind speed values exists with higher mean, median, and quartile values being exhibited towards the Eastern Thracian Sea. Furthermore, the highest offshore wind statistical parameters are shown in the Lemnos Plateau and the Dardanelles area. However, the maximum wind speed is lower than that in the West Thracian Sea. In all areas, data are positively skewed. Data are highly skewed in the west and central Thracian Sea and in Mt Athos (skewness >+5), characterized by increased maximum speeds under extreme events. Leptokurtic curves prevail over the Thracian Sea and Mt Athos area (kurtosis ~1.3), and mesokurtic curves prevail at the Lemnos Plateau and the Dardanelles.
An indicative time-series diagram illustrating the 6-hourly wind speed variability in the Lemnos Plateau (grid point 46) at the hub height is shown in Figure 4. Winds under extreme stormy conditions exceed the limit of 20 m/s, originating mainly from the Dardanelles and affecting the northern part of the Aegean Sea. Data exhibit seasonality showing higher winter values, with regular incidents exceeding 20 m/s. Mean monthly values indicate that the seasonal component oscillates with an amplitude of 6 m/s, and reveals a slightly upward trend (~0.008 m/s) over the years examined.
The wind speed exhibits intra-annual variability, with higher values in winter (especially in February) and significantly lower values in spring and summer (from April to July). A representative boxplot diagram of monthly-mean wind speed values at the hub level (93 m) at point 46 (the Lemnos Plateau) is shown in Figure 5.
The spatial variability of frequency distributions in daily-mean wind speeds, per wind directional sector, are shown in Figure 6. It is apparent that NE winds prevail in the study area, followed by ENE at the nearshore parts of the Thracian Sea and Mt Athos, and by NNE winds at the offshore Thracian Sea, the Lemnos Plateau, and the Dardanelles. Wind speeds and frequencies per directional bin are more dispersed in the West and Central Thracian Sea and Mt Athos area, with mean wind speeds of 5.6 m/s, 6.0 m/s, and 7.5 m/s (~30%, 36%, and 35%) from the NE and ENE directions, respectively.
Eastwards and offshore, wind speeds are significantly higher, of higher frequency, and appear confined along the NE direction, as in point 46 (the Lemnos Plateau) which has a mean NE wind speed of 9.5 m/s and 33% frequency of occurrence. This is attributed to the impact of orographic effects on the cyclonic synoptic circulation of surface wind field over the Black Sea and the funneling effect along the Turkish Straits. In parallel, these offshore points illustrate the influence of moderately strong S winds (~7.5 m/s, 8%).

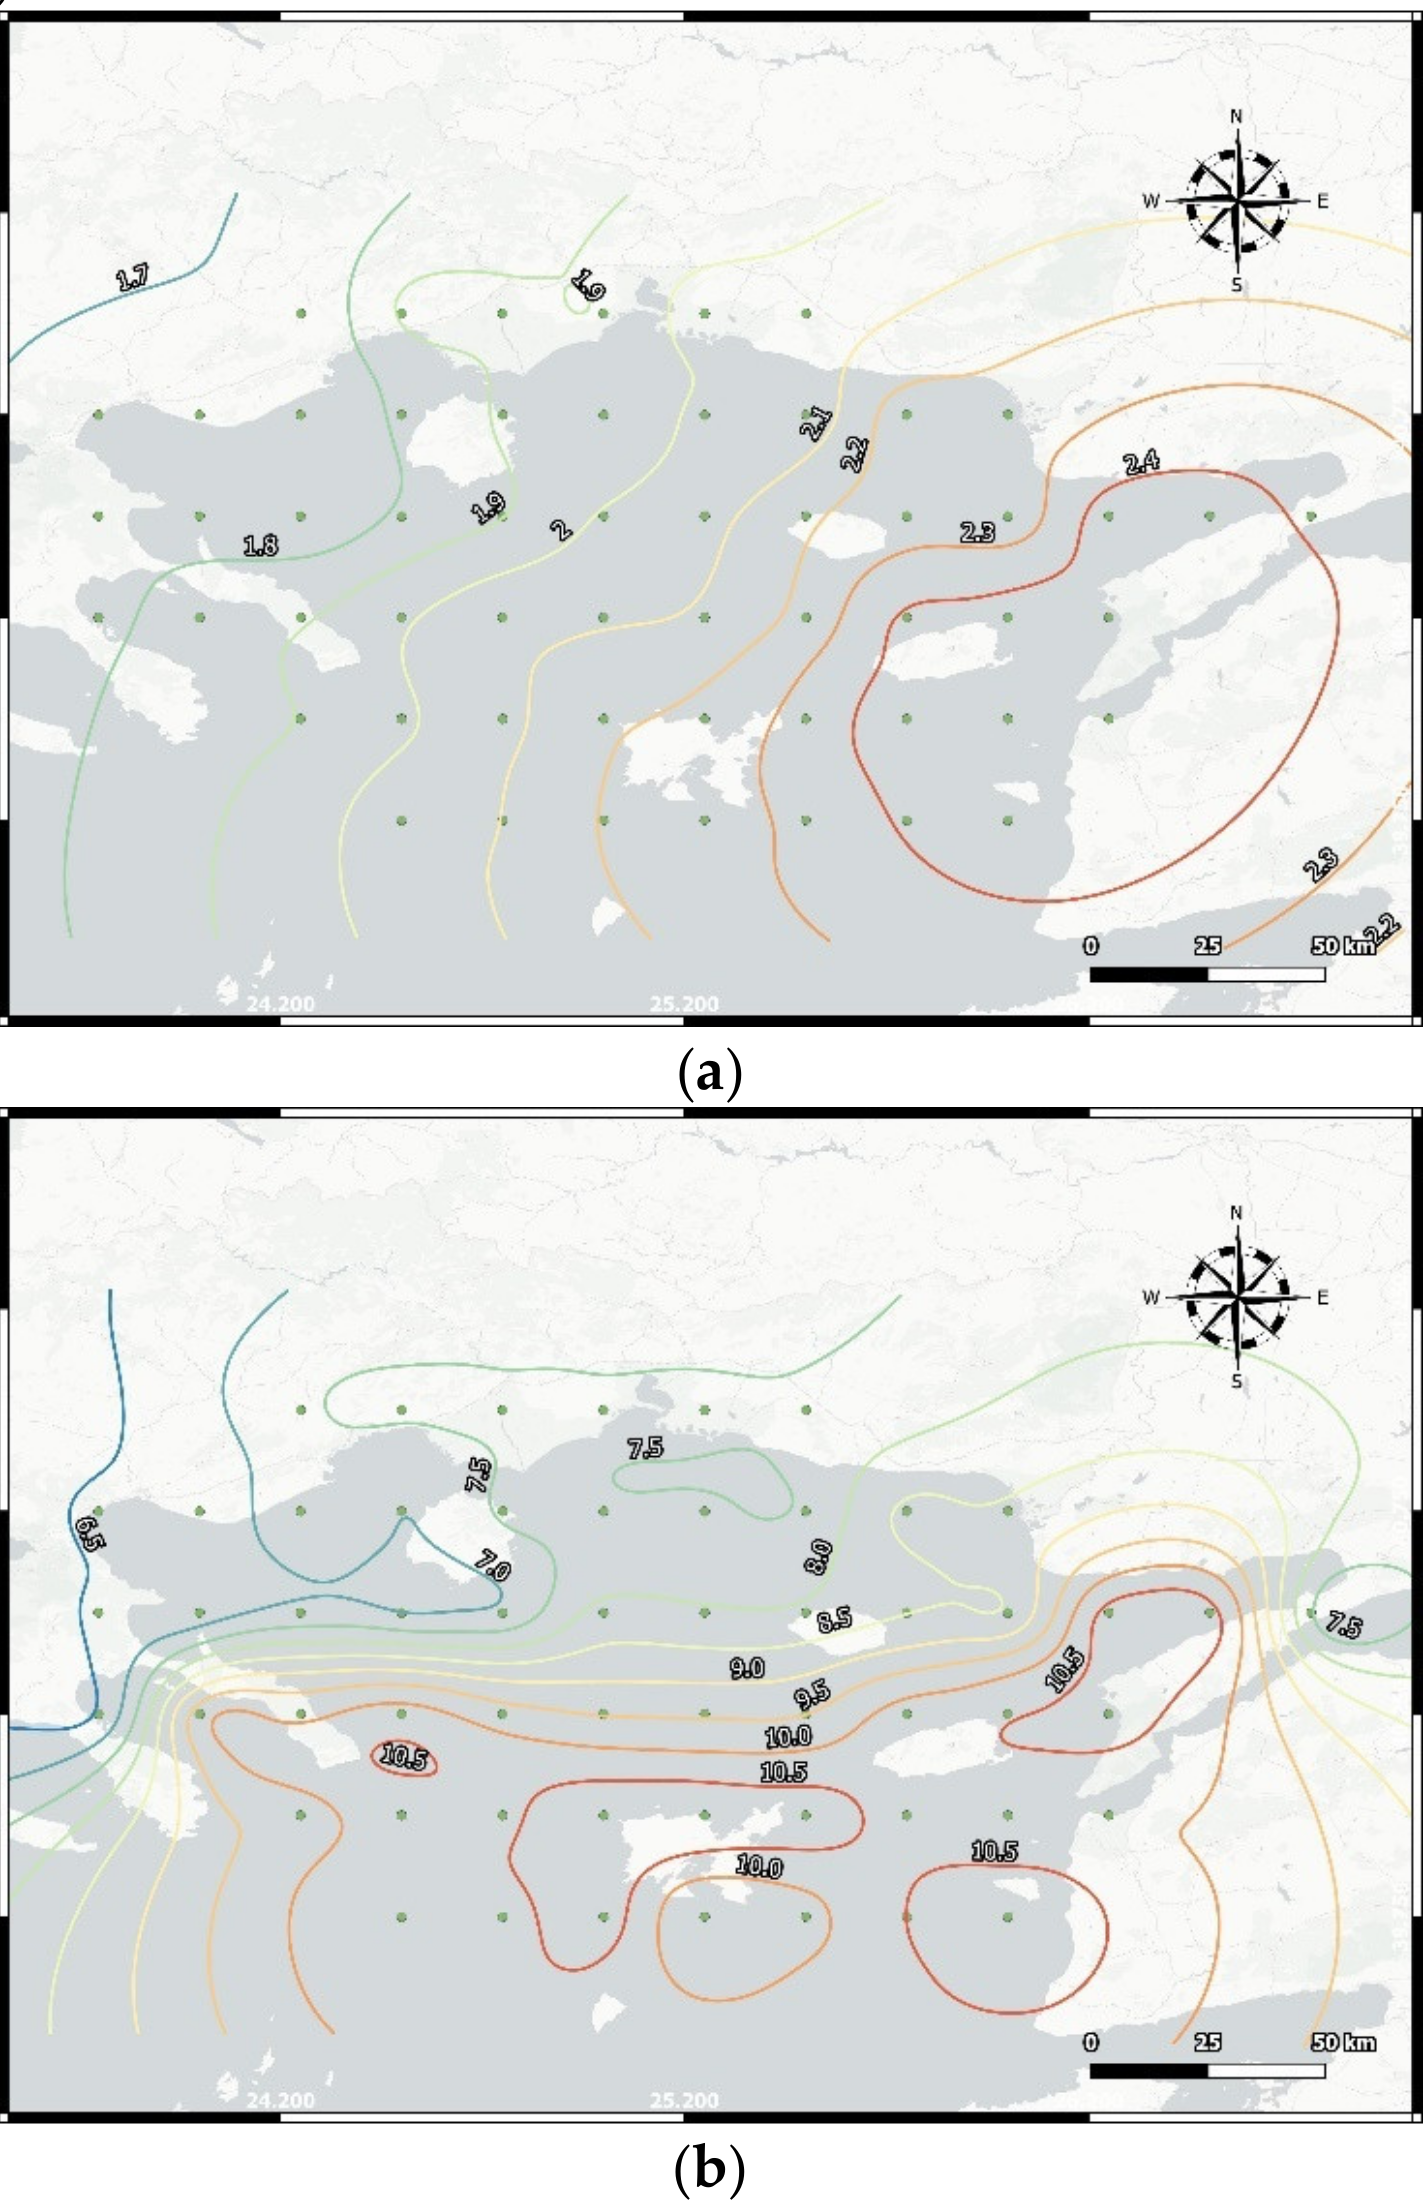
3.3. Spatial Variability in Weibull Fitting Function Parameters

To achieve a clear view of the available wind potential of an area, we may not rely only on the description of the instantaneous and mean wind speeds. The statistical parameters k and A of the fitted Weibull probability density function will provide a better understanding of wind dynamics. The probability of occurrence, and therefore the fraction of time for each wind speed range per directional sector, prevailing in the study area may be derived through this function. Table 2 presents the annual variation in Weibull parameters per directional bin for all study area sub-regions. For all bins, the Weibull shape parameter k varies between 1.40 in the West Thracian Sea and 1.73 in the Dardanelles region of influence, with a mean value of 1.61 throughout the gridded data at hub level (z = 93 m). At the nearshore Thracian Sea area, k-mean values range from 1.39 from the N direction to 1.63 from the WSW direction.
In terms of k-distribution over the various directional bins, higher values occur at the NE direction in the East Thracian Sea, the Lemnos Plateau, the Dardanelles, and the Mt Athos areas (ranging from 1.88 to 2.45), at the ENE direction in the central Thracian Sea (k = 2.00), and the E direction in the western Thracian part (k = 1.88). In parallel, the Weibull scale parameter (A) exhibits a gradual increase from the western nearshore zone (4.79 m/s) towards the east (6.77 m/s) and then offshore until the Lemnos Plateau (7.81 m/s) and the highly dynamic Dardanelles area (8.02 m/s). The NE direction displays the higher A-values in all sub-areas, except for the East Thracian Sea where the NNE direction prevails. The highest NE-bin A-value is seen at the Lemnos area (10.42 m/s), followed by the Dardanelles region (10.39 m/s).
The Weibull probability density function, fitted on the NE wind speed data at a specific grid point located at the Lemnos Plateau, together with the cumulative probability density function and the relevant Q-Q and P-P plots, are shown in Figure 7. Based on this analysis and the wind turbine power curve (Figure 2), it can be deduced that the probability of wind speed from the NE direction within the turbine operational (>5 m/s) window is 79.81%.
The iso-lines connecting points of equal k and A values, as extracted from the Weibull probability distribution for the NE wind direction, is shown in Figure 8. Based on Figure 8a, it is evident that k-values >2.4 occur in the Dardanelles area, and that k reduces gradually towards the WNW direction with a stable rate of 0.1 per 20 km. On the other hand, the spatial distribution of the scale parameter A seems more complex, with local peaks (>10.5 m/s) at Bozcaada Island and at the Saros Gulf and a general W-E isolines orientation indicating a sharp reduction in A towards the nearshore and onshore Thracian Sea grid points (Figure 8b).

3.4. Total Wind Energy Content

Using the parameters of the Weibull distribution per grid point and integrating spatially, Table 3 presents the wind energy content per directional sector, averaged over the main sub-areas of the study region. The analysis suggests that the highest wind energy content occurs in the Lemnos Plateau area (4455 kWh/m2/yr), followed by the Dardanelles (4398 kWh/m2/yr), Siggitikos/Mt Athos (3091 kWh/m2/yr), and East Thracian Sea (2964 kWh/m2/yr).
Table 3 indicates that the Lemnos Plateau and the Dardanelles region have a high wind energy content spread over three directional bins (NNE, NE, and ENE), representing an annual wind energy content of 3496 kWh/m2 and 3431 kWh/m2, respectively. This energy content is equivalent to the power density of 399 W/m2 and 391 W/m2, respectively. Approximately 22% of this sectorial energy content is being produced by winds in the 0-5 m/s range, 43% within the 5–10 m/s, 26% in the 10–15 m/s range, 7% in the 15–20 m/s, and only 2% by winds higher than 20 m/s. The contribution of the S sector in the total wind energy content of these two areas also seems quite considerable.

3.5. Annual Wind Energy Production

Considering the wind profile produced from z1 = 10 m (CMEMS data) to hub height (z2 = 93 m), the wind turbine power curve and dimensions and annual wind energy production (in MWh/yr) was estimated, following the previous Equation (10). The highest wind energy may be produced in the Dardanelles region, with a spatially-averaged AEP-value of 7546 MWh/yr. Approximately 75% of this energy (5684 MWh/yr) is concentrated along the NNE, NE, and ENE directional sectors, with the NE–AEP being the highest (48.8%). In parallel, most of the total AEP in Dardanelles is being produced from winds in the range of 10–15 m/s (46% or 3532 MWh/yr) and 5–10 m/s (37% or 2859 MWh/yr).
In the Lemnos Plateau, the spatially-averaged estimated AEP-value reached 7212 MWh/yr, mostly provided by the same directional bins (NNE, NE, and ENE), producing in total 5342 MWh/yr (i.e., 74% of total AEP). As previously discussed, most of the energy is produced by winds in the range of 10–15 m/s and 5–10 m/s, with values of 3261 MWh/yr and 2701 MWh/yr, respectively. The East Thracian Sea is another area of significant interest, as the spatially-mean AEP approximates 5620 MWh/yr, 75% of which is produced from the NNE, NE, and ENE sectors. Another interesting feature is the rising contribution of the S and SSW directions (5.7% and 7.9%, respectively). The Siggitikos Gulf and the area of Mt Athos exhibit AEP of the order of 5241 MWh/yr, while the Central Thracian and the West Thracian Sea have values of 3743 MWh/yr and 2939 MWh/yr, respectively.
Based on the above AEP-estimates, the capacity factor of turbine performance reached 37.44% in the Dardanelles, 35.80% in the Lemnos Plateau, 27.89% in the East Thracian Sea, and 26.02% in the Mt Athos area The capacity factor in the western and central Thracian Sea was assessed at 14.58% and 18.58%, respectively.

4. Discussion

Over the latest decade, there has been a growing interest in exploiting wind energy resources, particularly in offshore marine areas. This has been fueled by the recent trend towards economic decarbonization and the stable turn towards marine renewables, in association to cost reductions in turbine manufacturing, installation and maintenance, and the advancements in floating wind turbine technology which is now capable of even tripling the technical potential for offshore wind across the world [2,3]. Capital investments and rates of return in this sector are highly correlated to wind energy resource density and variability, indicating the need for long-term, high quality assessments of annual wind energy production [29].
Although the methodology for such assessments has been standardized, there still exist several bottlenecks related to the availability and reliability of long-term wind data at the wind turbine level over the open sea. For this purpose, several investigators have used wind data collected by on-site sensors (e.g., offshore buoys [13]), facing significant periods of sensors malfunction and gaps in operation (these buoys are usually sparse), and land-based meteorological stations (e.g., stations on islands and coastal zone) [5,30], which collect long time-series but are prone to localized orographic effects. On the other hand, data collected by satellites equipped with scatterometers may cover large marine areas, but as measurements are available at the regular intervals of satellite crossings the outputs of numerical models are utilized to fill in the spatio-temporal gaps. The final reanalysis product contains gridded wind data, but at rather coarse spatial resolution [31]. In parallel, scatterometers’ operation is limited by rain, ice, large spatial wind variability, and high wind speeds.
Carvalho et al. [27] compared ASCAT-A and B wind data to wind speeds from offshore buoys and reported that scatterometer data slightly underestimated the wind field (RMSE = 1.55; bias = 0.64; STDE = 1.40; R2 = 0.90) along the Atlantic coast of the Iberian Peninsula. Pickett et al. [32] working with the QuickSCAT satellite showed that the satellite–buoy wind differences nearshore were more significant than those offshore. Wang et al. [31] performed a similar analysis at the Central California Coast, reporting that ASCAT had the lowest error metrics compared to the QuickSCAT. Overall data products overestimated winds relative to the buoy at low wind speeds and underestimated at high wind speeds. These works indicate that different wind products performance varies considerably by study region, indicating the need for site-specific analyses.
In the present work, 6-hourly wind speed and direction data with 0.25° spatial resolution, obtained from CMEMS (blending ASCAT observations and the ERA Interim model results), were daily averaged and then compared to ground-truth data from land-based stations over the period between 2015 and 2019. The evaluation metrics illustrated slight to moderate overestimation at the Lemnos Plateau and the Central Thracian Sea, respectively. The Weibull parameters computed here appear in agreement with those reported by Aslan [5] and Bagiorgas et al. [13].
In terms of the wind power density, Bagiorgas et al. [33] reported a mean value of 600 W/m2 at the Athos offshore buoy, located in the Lenmos Plateau, at a heigh of 10 m from the sea surface water. Similarly, Bohran [34] calculated a mean energy content, ranging between 400 and 1410 W/m2, at a height of 30 m at Bozcaada (in the Dardanelles area). Aslan [5], using onshore wind stations, assessed the annual wind power content of the Bozcaada Island (in the Dardanelles region) at 460 W/m2. Soukissian et al. [7] estimated the wind power potential of the Lemnos area at 468 W/m2, and that of the Thracian Sea at 71.7 W/m2.
Our analysis suggested that at hub height (i.e., 93 m from sea level), the spatially-averaged wind power density reaches 513 W/m2 at the Lemnos Plateau and 507 W/m2 at the Dardanelles, which is comparable to the above findings. Based on international standards of wind density power classification, the wind energy potential at hub height of Lemnos and the Dardanelles is classified in wind class 5 (excellent); the wind power potential of the East Thracian Sea and Siggitikos Gulf/Mt Athos in wind class 3 (fair); the Central Thracian Sea in class 2 (marginal); and the West Thracian Sea in class 1 (poor). As shown in Table 3, winds from NNE, NE, and ENE directions contribute highly to this energy production.
Considering the characteristics of a Siemens SWT 2.3 MW wind turbine, we have assessed that a mean AEP of 5684 MWh/yr from the NNE, NE, and ENE sectors may be produced in the Dardanelles region. In the Lemnos Plateau, these directional bins may produce AEP of 5342 MWh/yr and ~ 5600 MWh/yr in the East Thracian Sea. The selected turbine achieves a capacity factor of 37.4% in the Dardanelles and 35.8% in the Lemnos Plateau. Konstantinidis et al. [15] estimated the capacity factor of Vestas V90-3 MW at 38.5% and RE power (Senvion) 5 M at 41% for the design of an OWF in the Lemnos area.

5. Conclusions

This work has examined the wind power potential of the Thracian Sea, a regional sea at the northern part of the Aegean, with significant interest in regards to the installation and operation of wind farms. CMEMS scatterometer wind data for the period between 2011 and 2019, blended with the numerical model reanalysis, were used for the assessment of wind energy content and the annual wind energy production. Although it was at a height of 10 m, the CMEMS wind data illustrated mild overestimation of the wind field compared to the Lemnos station data. The estimated Weibull parameters and the assessed wind power density were found comparable to that reported by previous investigators. Earlier wind power assessments in the area utilized limited offshore buoy data or data from nearshore, land-based stations. The basic differences in the present analysis, in relation to previous works focusing in the area, lie in the fact that our analysis is based on gridded data which covers extended offshore zones and quantifies the influence of each directional bin on final wind energy production.
The highest spatially-averaged wind energy content at hub height occurs in the Lemnos Plateau (4455 kWh/m2/yr), followed by the Dardanelles (4398 kWh/m2/yr), Siggitikos/Mt Athos (3091 kWh/m2/yr), and East Thracian Sea (2964 kWh/m2/yr). In these areas, most of the wind energy is produced by three directional bins (i.e., NNE, NE, ENE) and by wind magnitudes between 5–10 m/s. The spatially-averaged wind power density reaches 513 W/m2 at the Lemnos Plateau and 507 W/m2 at the Dardanelles, and the wind energy production for the selected wind turbine reaches 7212 MWh/yr and 7546 MWh/yr, respectively.

Author Contributions

Conceptualization, G.S.; methodology, G.S., N.K.; software, G.S., N.K.; validation, M.M.N. and D.A.G.; resources, N.K., M.Z. and K.Z.; data curation, N.K., M.Z. and K.Z.; writing—original draft preparation, G.S., N.K.; writing—review and editing, G.S., M.M.N. and D.A.G.; visualization, N.K.; supervision, G.S.; project administration, G.S.; funding acquisition, G.S. All authors have read and agreed to the published version of the manuscript.

Funding

This research was funded by European Union’s Horizon 2020 Research and Innovation Program (H2020-BG-12-2016-2), grant number No. 727277—ODYSSEA (Towards an integrated Mediterranean Sea Observing System). The article reflects only the authors’ view. The Commission is not responsible for any use that may be made of the information it contains.

Institutional Review Board Statement

Not applicable.

Informed Consent Statement

Not applicable.

Conflicts of Interest

The authors declare no conflict of interest.

References

  1. European Union. The European Green Deal. Communication from the Commission to the European Parliament, the European Council, the Council, the European Economic and Social Committee and the Committee of the Regions. COM (2019) 640 Final. 2019. Available online: https://ec.europa.eu/info/sites/info/files/european-green-deal-communication_en.pdf (accessed on 10 June 2021).
  2. International Renewable Energy Agency (IRENA). Future of Wind: Deployment, Investment, Technology, Grid Integration and Socio-Economic Aspects (A Global Energy Transformation Paper). Available online: https://www.irena.org/publications/2019/Oct/Future-of-wind (accessed on 10 June 2021).
  3. Global Wind Energy Council. Global Offshore Wind Report, 102p. 2020. Available online: https://gwec.net/wp-content/uploads/2020/12/GWEC-Global-Offshore-Wind-Report-2020.pdf (accessed on 10 June 2021).
  4. European Parliamentary Research Service. Offshore Wind Energy in Europe, by Alex Benjamin Wilson, 2020, PE 659.313, 12 p. Available online: https://www.europarl.europa.eu/RegData/etudes/BRIE/2020/659313/EPRS_BRI(2020)659313_EN.pdf (accessed on 10 June 2021).
  5. Aslan, A. Comparison based on the technical and economical analysis of wind energy potential at onshore, coastal, and offshore locations in Canakkale, Turkey. J. Renew. Sustain. Energy 2020, 12, 063306. [Google Scholar] [CrossRef]
  6. American Clean Power Association, U.S. Offshore Wind Industry. In Cleanpower.org. Retrieved from Website. 2021. Available online: https://cleanpower.org/wp-content/uploads/2021/02/ACP_FactSheet-Offshore_Final.pdf (accessed on 10 June 2021).
  7. Soukissian, T.; Papadopoulos, A.; Skrimizeas, P.; Karathanasi, F.; Axaopoulos, P.; Avgoustoglou, E.; Kyriakidou, H.; Tsalis, C.; Voudouri, A.; Gofa, F.; et al. Assessment of offshore wind power potential in the Aegean and Ionian Seas based on high-resolution hindcast model results. AIMS Energy 2017, 5, 268–289. [Google Scholar] [CrossRef]
  8. Saleous, N.; Issa, S.; Al Mazrouei, J. GIS-based wind farm site selection model offshore Abu Dhabi Eirate, UAE. In Proceedings of the International Archives of the Photogrammetry, Remote Sensing and Spatial Information Sciences (ISPRS) Congress, Prague, Czech Republic, 12–16 July 2016; B8. [Google Scholar] [CrossRef]
  9. Díaz, H.; Fonseca, R.B.; Guedes Soares, C. Site selection process for floating offshore wind farms in Madeira Islands. In Advances in Renewable Energies Offshore; Soares, G., Ed.; Taylor & Francis Group: London, UK, 2018; pp. 729–737. [Google Scholar]
  10. Latinopoulos, D.; Kechagia, K. A GIS-Based Multi Criteria Evaluation for Wind Farm Site Selection: A Regional Scale Application in Greece. Renew. Energy 2015, 78, 550–560. [Google Scholar] [CrossRef]
  11. Satir, M.; Murphy, F.; McDonnell, K. Feasibility study of an offshore wind farm in the Aegean Sea, Turkey. Renew. Sustain. Energy Rev. 2018, 81, 2552–2562. [Google Scholar] [CrossRef] [Green Version]
  12. Majidi Nezhad, M.; Neshat, M.; Groppi, D.; Marzialetti, P.; Heydari, A.; Sylaios, G.; Astiaso Garcia, D. A primary offshore wind farm site assessment using reanalysis data: A case study for Samothraki island. Renew. Energy 2021, 172, 667–679. [Google Scholar] [CrossRef]
  13. Bagiorgas, H.S.; Mihalakakou, G.; Rehman, S.; Al-Hadhrami, L.M. Wind power potential assessment for seven buoys data collection stations in Aegean Sea using Weibull distribution function. J. Renew. Sustain. Energy 2012, 4, 013119. [Google Scholar] [CrossRef] [Green Version]
  14. Zafeiratou, E.; Spataru, C.; Bleischwitz, R. Wind offshore energy in the Northern Aegean Sea islanding region. In Proceedings of the IEEE 16th International Conference on Environment and Electrical Engineering (EEEIC), Florence, Italy, 7–10 June 2016. [Google Scholar] [CrossRef]
  15. Konstantinidis, E.I.; Kompolias, D.G.; Botsaris, P.N. Viability analysis of an offshore wind farm in North Aegean Sea, Greece. J. Renew. Sustain. Energy 2014, 6, 023116. [Google Scholar] [CrossRef]
  16. Arun Kumar, S.V.V.; Nagababu, G.; Kumar, R. Comparative study of offshore winds and wind energy production derived from multiple scatterometers and met buoys. Energy 2019, 185, 599–611. [Google Scholar] [CrossRef]
  17. Pimenta, F.; Kempton, W.; Garvine, R. Combining meteorological stations and satellite data to evaluate the offshore wind power resource of Southeastern Brazil. Renew. Energy 2008, 33, 2375–2387. [Google Scholar] [CrossRef]
  18. Mostafaeipour, A. Feasibility study of offshore wind turbine installation in Iran compared with the world. Renew. Sustain. Energy Rev. 2010, 14, 1722–1743. [Google Scholar] [CrossRef]
  19. Karamanis, D.; Tsabaris, C.; Stamoulis, K.; Georgopoulos, D. Wind energy resources in the Ionian Sea. Renew. Energy 2011, 36, 815–822. [Google Scholar] [CrossRef]
  20. Fuverik, B.R.; Sempreviva, A.M.; Cavaleri, L.; Lefèvre, J.-M.; Transerici, C. Eight years of wind measurements from scatterometer for wind resource mapping in the Mediterranean Sea. Wind Energy 2011, 14, 355–372. [Google Scholar] [CrossRef] [Green Version]
  21. Young, I.R.; Kirezci, E.; Ribal, A. The Global Wind Resource Observed by Scatterometer. Remote Sens. 2020, 12, 2920. [Google Scholar] [CrossRef]
  22. Sylaios, G. Meteorological influences on the surface hydrographic patterns of the North Aegean Sea. Oceanologia 2011, 53, 57–80. [Google Scholar] [CrossRef] [Green Version]
  23. Sylaios, G.; Kamidis, N.; Anastasiou, S.; Tsihrintzis, V.A. Hydrodynamic response of Thassos Passage (N. Aegean Sea) to Nestos River discharge and meteorological forcing. Cont. Shelf Res. 2013, 59, 37–51. [Google Scholar] [CrossRef]
  24. Bentamy, A.; Grodsky, S.A.; Cambon, G.; Tandeo, P.; Capet, X.; Roy, C.; Herbette, S.; Grouazel, A. Twenty-Seven Years of Scatterometer Surface Wind Analysis over Eastern Boundary Upwelling Systems. Remote. Sens. 2021, 13, 940. [Google Scholar] [CrossRef]
  25. Kumar, M.; Samuel, C. Wind energy potential estimation with prediction of wind speed distribution. Int. J. Intell. Syst. Technol. Appl. 2018, 17, 19–41. [Google Scholar] [CrossRef]
  26. Delignette-Muller, M.L.; Dutang, C. Fitdistrplus: An R Package for Fitting Distributions. J. Stat. Softw. 2015, 64, 1–34. Available online: https://www.jstatsoft.org/article/view/v064i04 (accessed on 18 April 2021). [CrossRef] [Green Version]
  27. Carvalho, D.; Rocha, A.; Gómez-Gesteira, M.; Silva Santos, C. Offshore winds and wind energy production estimates derived from ASCAT, OSCAT, numerical weather prediction models and buoys—A comparative study for the Iberian Peninsula Atlantic coast. Renew. Energy 2017, 102, 433–444. [Google Scholar] [CrossRef]
  28. Alvarez, I.; Gomez-Gesteira, M.; de Castro, M.; Carvalho, D. Comparison of different wind products and buoy wind data with seasonality and interannual climate variability in the southern Bay of Biscay (2000–2009). Deep Res. Part. II Top. Stud. Oceanogr. 2014, 106, 38–48. [Google Scholar] [CrossRef]
  29. Pryor, S.C.; Shepherd, T.J.; Barthelmie, R.J. Interannual variability of wind climates and wind turbine annual energy production. Wind Energy Sci. 2018, 3, 651–665. [Google Scholar] [CrossRef] [Green Version]
  30. Fyrippis, I.; Axaopoulos, P.J.; Panayiotou, G. Wind energy potential assessment in Naxos Island, Greece. Appl. Energy 2010, 87, 577–586. [Google Scholar] [CrossRef]
  31. Wang, Y.-H.; Walter, R.K.; White, C.; Farr, H.; Ruttenberg, B.I. Assessment of surface wind datasets for estimating offshore wind energy along the Central California Coast. Renew. Energy 2019, 133, 343–353. [Google Scholar] [CrossRef]
  32. Pickett, M.H.; Tang, W.; Rosenfeld, L.K.; Wash, C.H. QuikSCAT satellite comparisons with nearshore buoy wind data off the U.S. West Coast. J. Atmos. Ocean. Technol. 2003, 20, 1869–1879. [Google Scholar] [CrossRef] [Green Version]
  33. Bagiorgas, H.S.; Mihalakakou, G.; Rehman, S.; Al-Hadhrami, L.M. Offshore wind speed and wind power characteristics for ten locations in Aegean and Ionian Seas. J. Earth Syst. Sci. 2012, 121, 975–987. [Google Scholar] [CrossRef] [Green Version]
  34. Borhan, Y. Mesoscale interactions on wind energy potential in the northern Aegean region: A case study. Renew. Sustain. Energy Rev. 1998, 2, 353–360. [Google Scholar] [CrossRef]
Figure 1. Study area map and CMEMS grid discretization.
Energies 14 03448 g001
Figure 2. Wind turbine power curve.
Energies 14 03448 g002
Figure 3. Density plots histograms of CMEMS wind speed data against wind data from on-site stations in (a) Chrisoupolis Airport and (b) Lemnos Airport. The dashed line represents the perfect match line, the red line the linear regression model fitted on the scattered data, and the light red area the 95% confidence interval.
Energies 14 03448 g003
Figure 4. 6-hourly time series (blue line) and mean-monthly time-series (red line) of wind speed at hub height in the Lemnos Plateau (grid point 46).
Energies 14 03448 g004
Figure 5. Boxplots for monthly wind speed values at hub height in the Lemnos Plateau (point 46).
Energies 14 03448 g005
Figure 6. Wind frequency roses at hub height over the study area.
Energies 14 03448 g006
Figure 7. Probability density model fitted on NE wind data at hub height (point 46, Lemnos Plateau) (a) data histogram and fitted Weibull function, (b) Q–Q plot, (c) Cumulative density function, and (d) P–P plot.
Energies 14 03448 g007
Figure 8. Spatial distribution of the Weibull probability density function parameters: (a) the shape parameter k and (b) the scale parameter A (in m/s) at the hub level over the study area.
Energies 14 03448 g008
Table 1. Descriptive wind statistics in (m/s) at hub height (93 m), per study sub-area.
Sub-AreaQ1MedianMeanQ3Max
West Thracian Sea 2.163.654.375.8646.88
Central Thracian Sea 2.454.144.906.6235.19
East Thracian Sea 3.175.326.058.2529.66
Lemnos Plateau 3.606.206.999.5732.72
Dardanelles’ Zone of Influence 3.826.487.159.8129.30
Siggitikos Gulf and Mt Athos 2.864.885.827.8931.73
Table 2. Weibull probability density function parameters, per directional bin, at hub height for all sub-areas.
Sub-Areas/
Directional Bins
West Thracian SeaCentral Thracian SeaEast Thracian SeaLemnos PlateauDardanellesSiggitikos/Mt Athos
kA (m/s)kA (m/s)kA (m/s)kA (m/s)kA (m/s)kA (m/s)
N1.384.711.454.671.355.081.425.031.475.051.465.41
NNE1.505.871.617.081.798.791.718.801.829.161.567.49
NE1.756.841.937.502.278.752.2310.422.4510.391.889.23
ENE1.745.702.006.002.176.571.877.612.027.251.777.58
E1.884.451.944.471.984.381.654.991.814.961.715.28
ESE1.213.421.653.491.763.541.574.361.704.481.504.29
SE1.503.321.283.241.603.811.464.751.554.561.514.23
SSE1.483.621.383.791.514.381.575.891.655.761.464.81
S1.274.531.355.401.566.701.678.131.758.421.406.13
SSW1.444.021.535.261.686.741.737.431.797.681.515.64
SW1.313.351.593.991.895.011.845.691.825.861.614.79
WSW1.613.631.763.741.604.141.604.951.524.571.624.75
W1.773.241.683.071.663.361.463.841.403.371.694.31
WNW1.513.421.603.201.523.171.433.551.383.411.594.31
NW1.453.871.403.331.343.311.313.951.193.411.404.68
NNW1.504.091.293.291.303.501.563.931.593.541.484.81
all1.404.791.485.421.646.771.637.811.738.021.476.44
Table 3. Total annual wind energy content (in kWh/m2) at hub level, per directional bin, for all sub-areas.
Sub-Areas/
Directional Bins
West Thracian SeaCentral Thracian SeaEast Thracian SeaLemnos PlateauDardanellesSiggitikos/Mt Athos
N826280735991
NNE214389775887973436
NE4356641256225622061308
ENE222238262353252556
E604730423296
ESE60159191445
SE183012272133
SSE232325725862
S69112183358395168
SSW278722723527289
SW422652566140
WSW141421292234
W98613721
WNW169510724
NW29148171140
NNW36371315947
all135417742964445543983091
Publisher’s Note: MDPI stays neutral with regard to jurisdictional claims in published maps and institutional affiliations.

