1. Introduction
Under the increasingly severe conditions regarding global resources and the environment, achieving greenhouse gas reduction targets requires an increased share of renewable energy sources in energy systems [
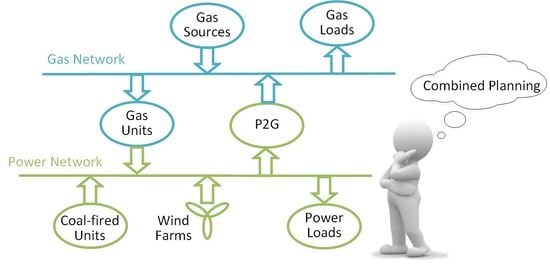
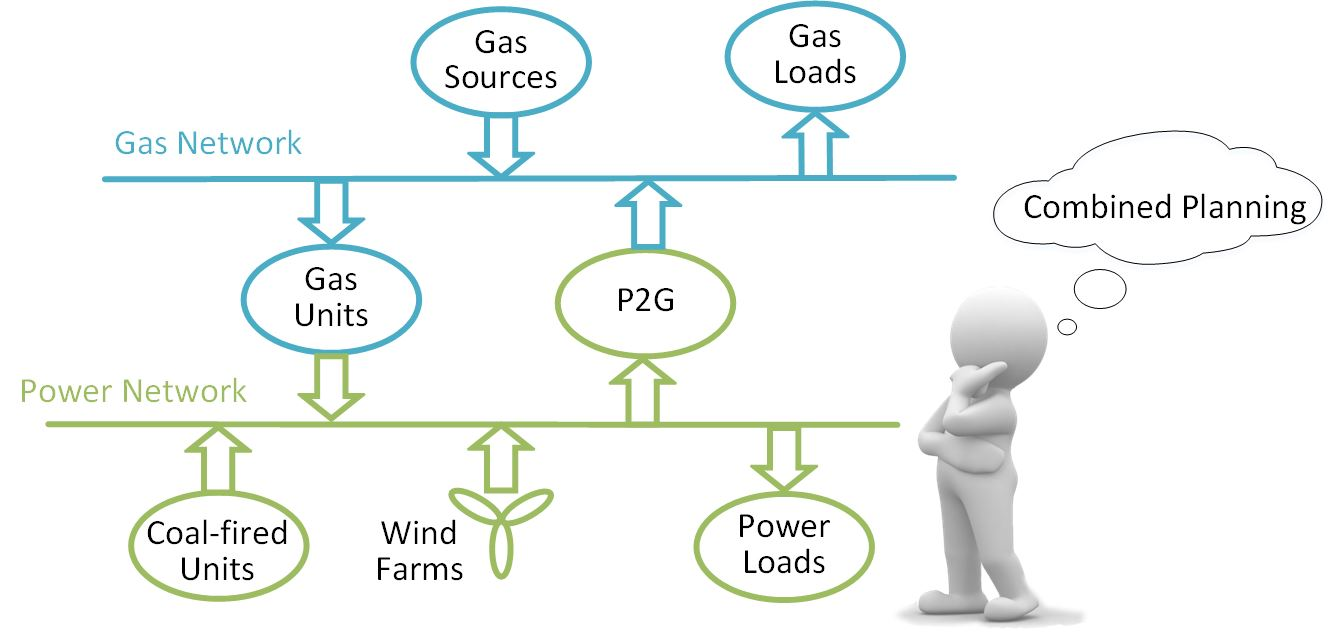
1]. The development of efficient and clean energy systems has become the core of energy policies across all countries. Electricity-natural gas coupling systems consisting of gas generation units and power-to-gas (P2G) facilities improve the interactions of different energy systems and facilitates renewable energy integration [
2,
3].
Power-to-gas (P2G) is the process whereby electricity is used to produce hydrogen (H
2) or synthetic natural gas (SNG). In the first type of P2G process, hydrogen is formed through the process of water electrolysis. Hydrogen can be used for fuel cell electric vehicles (FCEV) [
1], can supply the gas load, and can also increase the environmental performance of microturbines [
4]. As a second P2G process, the SNG gas methane is produced via the methanation of electrolytic hydrogen [
5]. With P2G, hydrogen or synthetic natural gas is produced via water electrolysis and can be flexibly stored or injected into the natural gas network [
6,
7].
Before the application of P2G, the linkage between the gas and electricity networks mainly occurred through a gas-fired generator. In some studies, gas-fired generators have been used as coupling components of electricity-gas systems to achieve combined dispatching in operation. One study [
8] investigated how the uncertainty in wind forecasts affects the operation of power systems, and in particular gas-fired generators. In [
9], an integrated approach to the operation of gas and electricity networks was investigated to improve the security of gas and electricity supply. In [
10], it was demonstrated that operating gas and electricity as a coupled system resulted in about 7% savings in operational costs. However, gas-fired generators only realize the unidirectional coupling of gas-electric systems. P2G technology can convert the original unidirectional coupling systems into bidirectional energy flow between gas and electricity systems.
With the development of P2G technology, dozens of P2G demonstration projects have been built in Europe. The Solar Fuel company in Germany uses wind power to produce methane, which is directly supplied to the natural gas load through the natural gas network. Greenpeace Energy and other electricity to gas companies have also started P2G projects. P2G commercial applications are beginning. Therefore, the idea of operation optimization with gas-fired generators and P2G stations has attracted more attention. In [
11], an integrated model was developed for the simulation of operational interdependences between the two networks by considering P2G. The work modeled P2G with power system requirements and integrated this with gas network modeling. In [
12], considering the different response times of gas and power systems, the transient gas flow and steady-state power flow were combined to formulate the dynamic optimal energy flow in integrated gas and power systems. In [
13], the value of flexibility technologies, such as P2G, was quantified in the operation of integrated gas and electricity systems in Great Britain 2030 energy scenarios for different renewable generation penetration levels. In [
14], the efficacy of three options were evaluated, namely flexible gas-fired plants, electricity storage, and a power-to-gas system, in order to compensate for the intermittency of wind generation. Another study [
15] showed that P2G was capable of reducing wind curtailment in high wind cases and of decreasing the overall costs of operating the gas and electricity network. In [
16], the authors proposed a two-layer optimal scheduling model for the power-gas coupling system, which considered the optimal operation of the natural gas system and used P2G to absorb the excess wind power. All of the above studies show that, although P2G technology has a high cost at present, it has high flexibility in absorbing wind power and improving system operation costs.
The above research has mainly focused on the optimization of the combined operation of an electricity-gas coupling system with gas-fired generators and the P2G technique. Planning is the basis of operation, and the planning scheme will affect the operation. A previous study [
17] established the source network coordination optimization programming model for an electricity-natural gas coupling system, which was decoupled into one upper level involving an investment optimization model and two lower levels involving safety and economic operation optimization models. The optimal solution satisfying the constraints was produced by iterations between the upper and lower levels of these models. Another study [
18] proposed a power flow calculation method suitable for radial natural gas networks and verified the computational efficiency of the proposed method in the combined planning of a large-scale electricity-natural gas coupling system. In [
19], the co-planning process was modeled as mixed-integer nonlinear programming, the objective of which was to maximize the net present value (NPV) of the social welfare of the combined gas and power infrastructure. In [
17,
18,
19], a reduction in wind curtailment was not considered. In [
20], a combined gas and electricity network expansion planning model was developed to minimize gas and electricity operational and network expansion costs. The model was used to analyze the gas and electricity infrastructure expansion requirements for Great Britain. The application scenario of a low-carbon energy system had a projected installed wind capacity of 15.5 GW by 2030. In [
21], flexibility options, such as battery storage, demand-side response, and gas-fired generators, were considered in a combined gas and electricity network expansion planning model, and the optimal investment approach was investigated.
In the above studies, the role of P2G stations is not fully considered in the planning of coupling systems. However, from the above literature review, it can be found that the P2G technique can affect the operation of electricity-natural gas systems. Therefore, this study further analyzed the effects of P2G station planning on the network structure of coupling systems. Compared with the small proportion of hydrogen injection, methane is less affected by this limitation. The P2G approach mentioned in the rest of this paper refers to the conversion of electricity to methane.
Based on the above background, the planning of the P2G station was considered in the planning model for the electricity-natural gas coupling system. The model considers the construction state and operation output of P2G plants, gas-fired generators, natural gas pipelines, and power transmission lines. The aim was to minimize the sum of annual investment costs and annual operation costs for the coupling system. The effect of wind curtailment was also considered in this study. The rest of this paper is structured as follows.
Section 2 discusses the principles of the electric–gas coupling system model. The models of coupling elements are also described in this section.
Section 3 outlines the planning model for the electricity-natural gas coupling system with the goal of minimizing the sum of the annual investment costs and the annual operation costs. The model takes the construction statuses of different types of units, power lines, and pipelines and the output power values of the gas unit and P2G plant station as the optimization variants. The immune algorithm is proposed to solve the optimization model.
Section 4 exemplifies the application of the model through case studies on an nine–node power system and a seven-node gas system.
Section 5 contains the concluding remarks. Details on the gas network analysis model are shown in
Appendix A.
3. Combined Optimization Planning Model for Electricity-Natural Gas Coupling System Considering P2G
The P2G co-planning model of the electricity-natural gas coupling system established in this work aimed to minimize the sum of the annual investment cost and operation cost:
where T is the investment recovery period, for which 15 years was selected in this study;
r is the interest rate;
is the total cost of investment;
is the annual operating cost.
3.1. Total Cost of Investment
The total cost of investment is shown as follows:
where
PS,
EL,
GL, and
TR are the sets of generators, transmission lines, gas transmission pipelines, and power-to-gas plants to be selected;
,
,
, and
are the investment costs of the generator
e, transmission line
l, gas transmission pipeline
p, and power-to-gas plant station
n, respectively;
,
,
, and
respectively represent the construction state variables of the generator
e, transmission line
l, gas transmission pipeline
p, and power-to-gas plant station
n, where “1” represents construction and “0” represents no construction.
3.2. Annual Operating Cost
Annual operating costs include fuel costs for coal-fired generating units, gas well output costs, wind farm output costs, and wind curtailment costs. Since the actual annual operation or maintenance cost of the P2G plant station is only about 5% of the fixed investment cost, the P2G operation cost is not considered for the time being. The model is shown as follows:
where
is the number of days per year;
AS,
WS, and
WD are the sets of coal-fired generating units, gas wells, and wind farms, respectively;
,
, and
represent the output of generator
a, gas well of gas source point
b, and wind farm
c at the time
t of a typical day;
,
, and
represent the unit output costs of generator
a, gas source point
b, and wind farm
c;
is the unit wind curtailment cost of the wind farm;
is the forecast output of the wind farm at time
t [
16].
After planning, the gas generator set is regarded as the gas load in the natural gas network. Its fuel cost is included in the gas well output cost. Since the natural gas system model established in this study does not consider the characteristics of compressor and pipe storage, and also since the P2G and gas unit provide and consume natural gas respectively in the natural gas system, the total output of the gas source is the sum of the natural gas load from all nodes:
where
is the natural gas flow rate consumed by the
eth unit in the gas generator set
PS at time
t in a typical day;
is the natural gas flow rate output by the
nth plant station in the P2G plant station set
TR at time
t in a typical day;
represents the sum of the flows of other natural gas load nodes at time
t in a typical day.
3.3. Model Constraints
The model constraints include generator output constraints, gas source output constraints, P2G plant output constraints, power flow balance constraints and safety constraints of electric–gas coupling system, and wind farm output constraints:
where
AL is the collection of all generating sets;
and
are the upper and lower limits of the output of the generator
a in set
AL;
and
are the upper and lower output limits of the gas well at the gas source point
b in the gas well set
WS;
and
are the upper and lower limits of voltage amplitude of node
i in the power system;
and
are the upper and lower limits of active power in transmission line
ij;
and
are the upper and lower limits of pressure of node
u in the natural gas system;
and
are the upper and lower limits of the pipeline flow of gas transmission pipeline
uv. The power flow balance constraints of the coupled system are shown in Equations (1)–(3), (10) and (11). In addition, the actual output of the wind farm at every moment is not greater than its predicted value. The difference between them is the curtailed electricity of the wind farm.
3.4. Solving Algorithm
In this study, the immune algorithm was used to solve the established model. The immune algorithm is an intelligent optimization algorithm that simulates the immune mechanism of biology and combines the evolutionary mechanism of genes [
26]. It has been widely used to solve all kinds of optimization problems, such as TSP [
27], the topology optimization problem, and the job shop scheduling problem [
28]. The algorithm can generate new individuals continuously through immune operation and a population refresh operator. By referring to the diversity preservation mechanism of the biological immune system, the algorithm introduces the calculation and evaluation method of antibody concentration to suppress the occurrence of repeated or similar individuals. Therefore, it can ensure the global search ability of the algorithm [
29]. In order to improve the solving speed of the model, a decoupled power flow calculation method was used to verify the security of the power network and natural gas network. For the natural gas network, the power flow calculation method of the radial gas network proposed in [
18] was adopted.
The solving process for the model is shown in
Figure 1. The model solving method in this paper can be divided into two stages. The planning optimization stage is the first stage. In this stage, the network structure satisfying all constraints of the model is generated randomly. The operating optimization stage is the second stage. In this stage, based on the network formed in the planning optimization stage, the optimal outputs for all units are solved by the immune algorithm. In the flowchart shown in
Figure 1, stage 1 represents the planning optimization stage, and stage 2 represents the operating optimization stage. In each iteration, the new total cost is calculated by summation of the optimization results from stage 1 and stage 2. Then, by comparing the new cost with the previous minimum cost, the optimal cost and the relevant data are retained. At the end of each iteration, a judgment is made on whether it meets the number of maximum iterations; then, the optimal result is output. The detailed calculation steps for the two stages are described below.
Stage 1 (planning optimization stage):
(1) Number of gas units and P2G plant stations of different types to be selected. Randomly generate the location and type of the new power supply and P2G plant station. For example, (G1, G2, P1, P2) = (2, 1, 1, 0) means that gas units #2 and #1 are added at the location of G1 and G2. P2G station #1 is added at P1, and there is no P2G station at P2;
(2) Randomly generate the planning natural gas pipelines and power lines that are connected between new coupling units in the system. Use the 0-1 variable to indicate whether a pipeline or line is built or not. For example, “1” means built and “0” means not built;
(3) Randomly generate other new lines of the power network and pipelines of the natural gas network, expressed as 0-1 variables. Calculate the decoupled power flow of the planning system. When checking the safety of the network, all loads are set as their maximum values, and the generator and P2G stations are set as the full load;
(4) Calculate the total investment cost using (13) and convert it to the equivalent annual value using (12).
Stage 2 (operating optimization stage):
(1) Randomly generate antibodies representing the unit’s output, whereby the range of outputs is from 0% to 100%. Carry out network security verification. Individuals meeting the verification threshold are put into the initial antibody group;
(2) Calculation of the antibody concentration, antibody affinity, and excitation degree values. The antibody concentration is an indicator of the diversity of the antibody population. A higher concentration means more closely related individuals, which is not conducive to global optimization. Therefore, it is necessary to suppress the individuals with a high concentration. Antibody affinity is the corresponding operating cost. The lower the cost means the higher the affinity. The excitation degree is the difference between affinity and concentration. The higher the excitation, the higher the selection rate;
(3) Sequence the antibodies by their excitation degrees. The first half of the antibody population is selected for immunization. Firstly, the selected antibodies are cloned and copied. Then, the copied antibodies are mutated in the replicating population to carry out local optimization. Finally, the mutation results are selected to inhibit the antibodies with low affinity and retain the mutation results with high affinity;
(4) Population refresh. The new antibodies that meet the constraints are generated randomly to replace the antibodies with a low excitation degree in the original population. The replaced antibodies are then combined with the antibodies after immunization operation to form a new population to continue the immune cycle operation;
(5) After decoding, the optimal values of the unit power and the annual operating costs are output.
4. Case Study
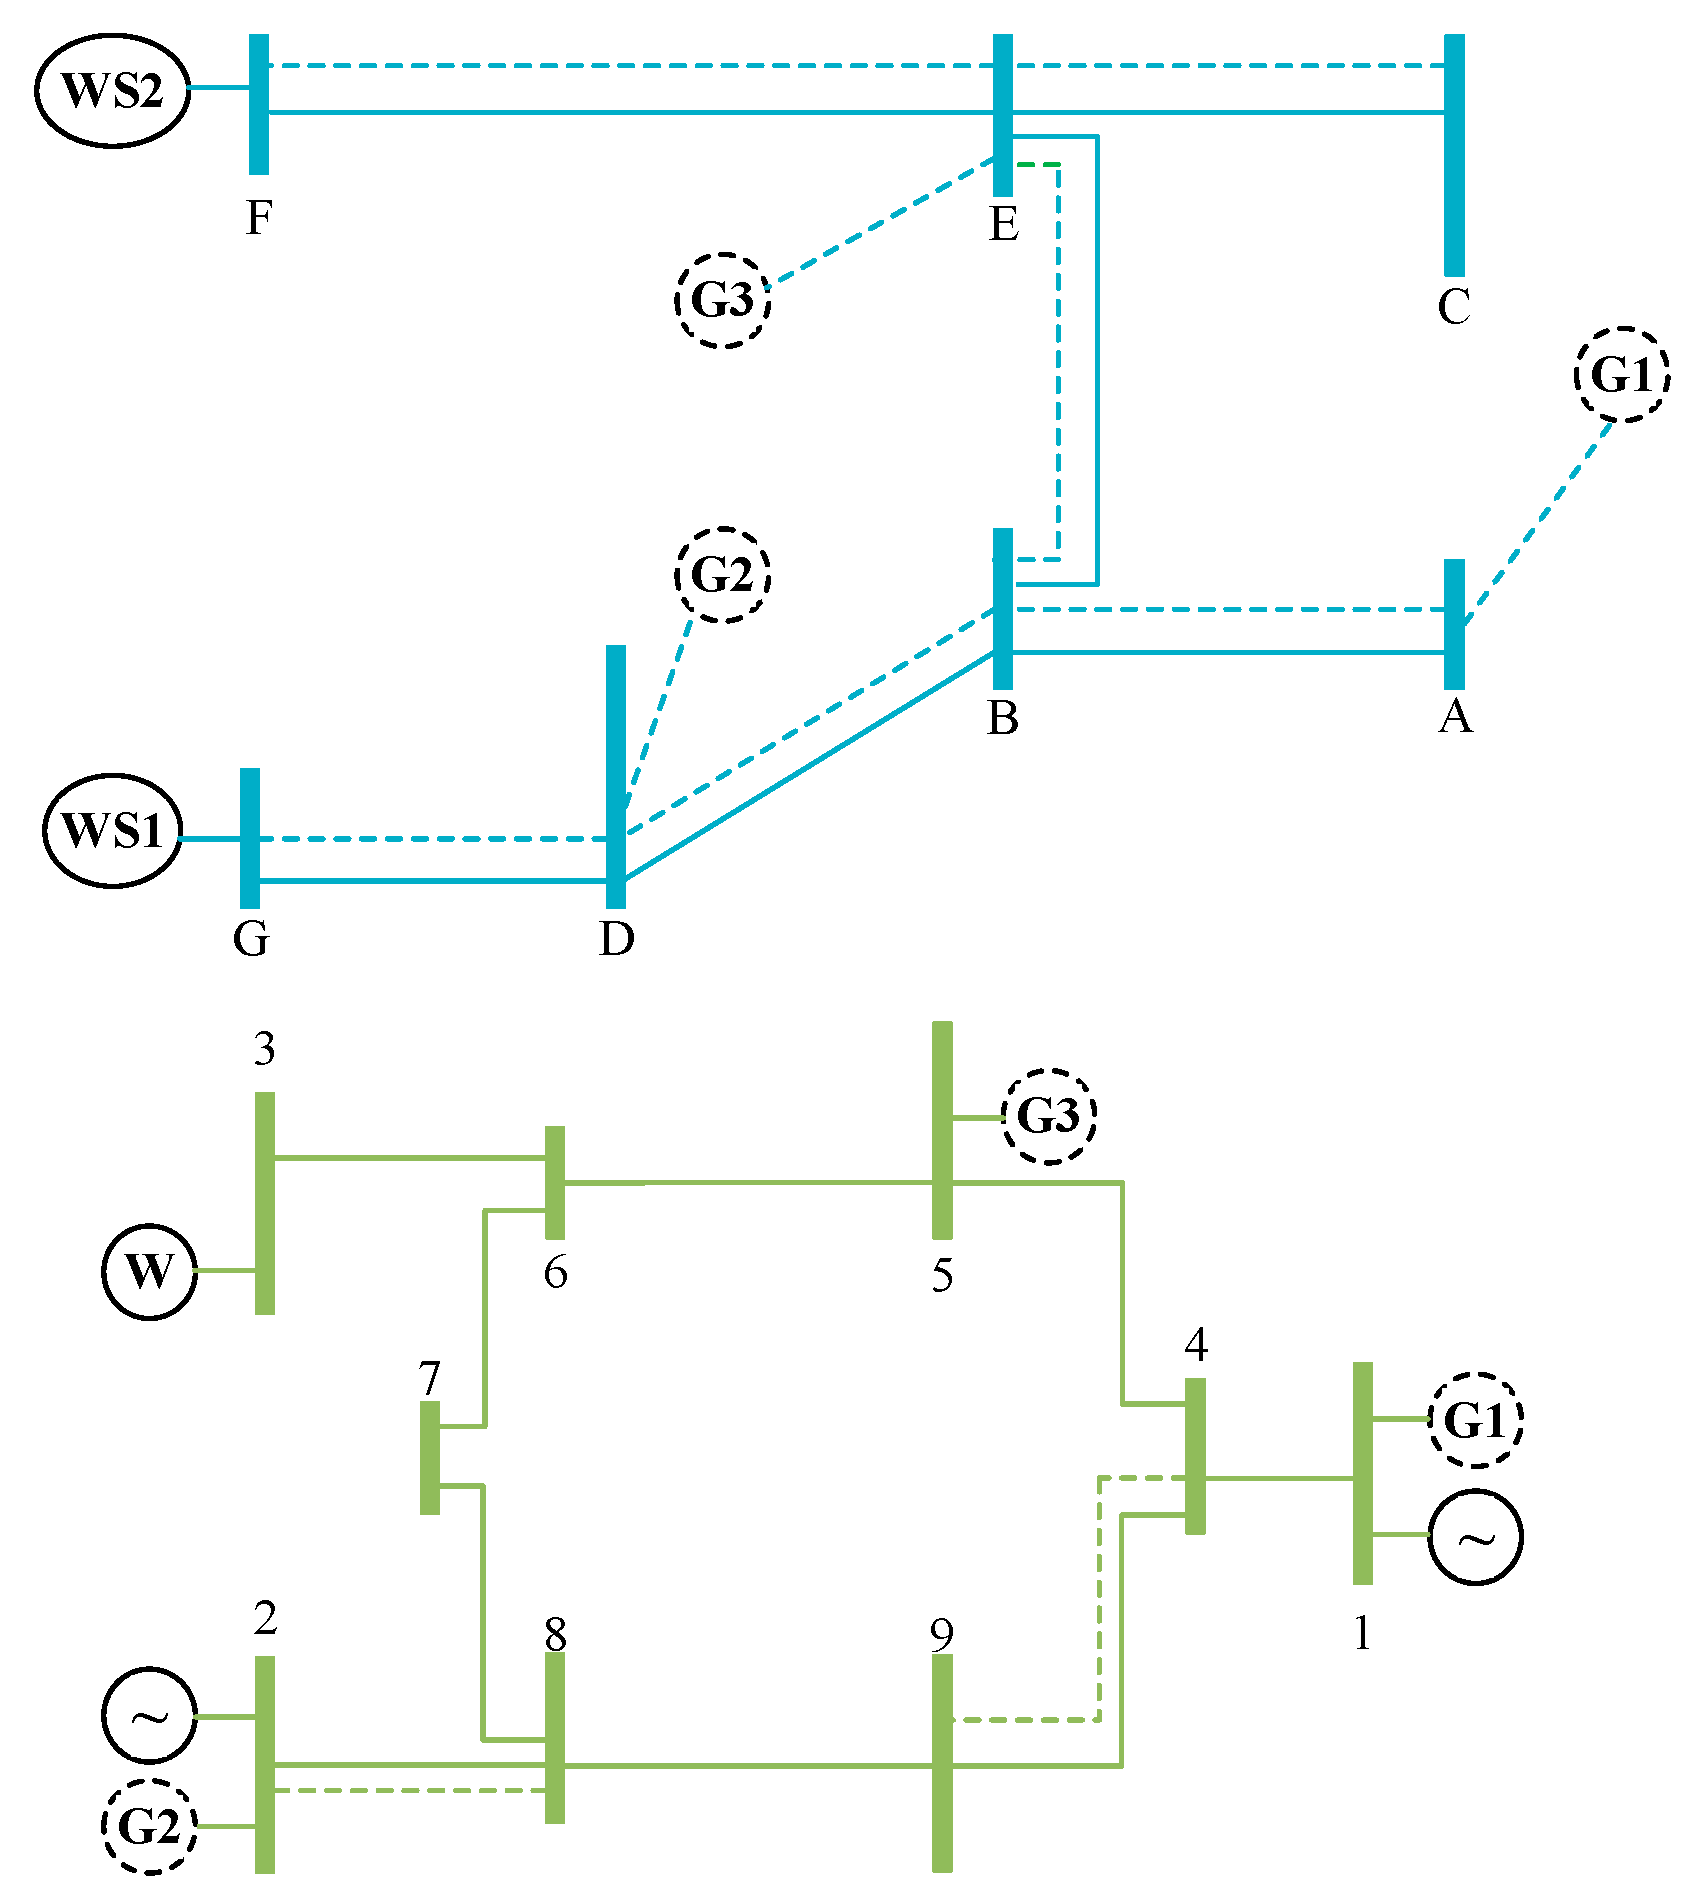
In this paper, an electricity-natural gas coupling system composed of a nine-node natural gas network and a nine-node MATPOWER power system was taken as an example, as shown in
Figure 2. MATPOWER is a package of MATLAB M-files for solving power flow and optimal power flow problems.
In
Figure 2, the network shown in blue is the gas network, and the network shown in green is the power network. A–E are nodes of the natural gas network, while 1–9 and 10 and 11 are existing nodes and candidate nodes in the power system network, respectively. WS1 and WS2 are natural gas sources. G1–G3 are gas units to be selected. P1 and P2 are P2G plant stations to be selected. There was one wind power plant in node three and two coal-fired units in node one and node two. The dotted lines represent the candidate pipelines, power lines, and units to be built, while the solid lines represent the existing devices that have been built. The two networks were bidirectionally coupled through the P2G plant station and the gas unit to be selected. The wind curtailment rate of the wind farm was 20%. All curtailed wind power could be absorbed after the P2G plant station was set. The typical daily load curve was drawn according to the natural gas load data in [
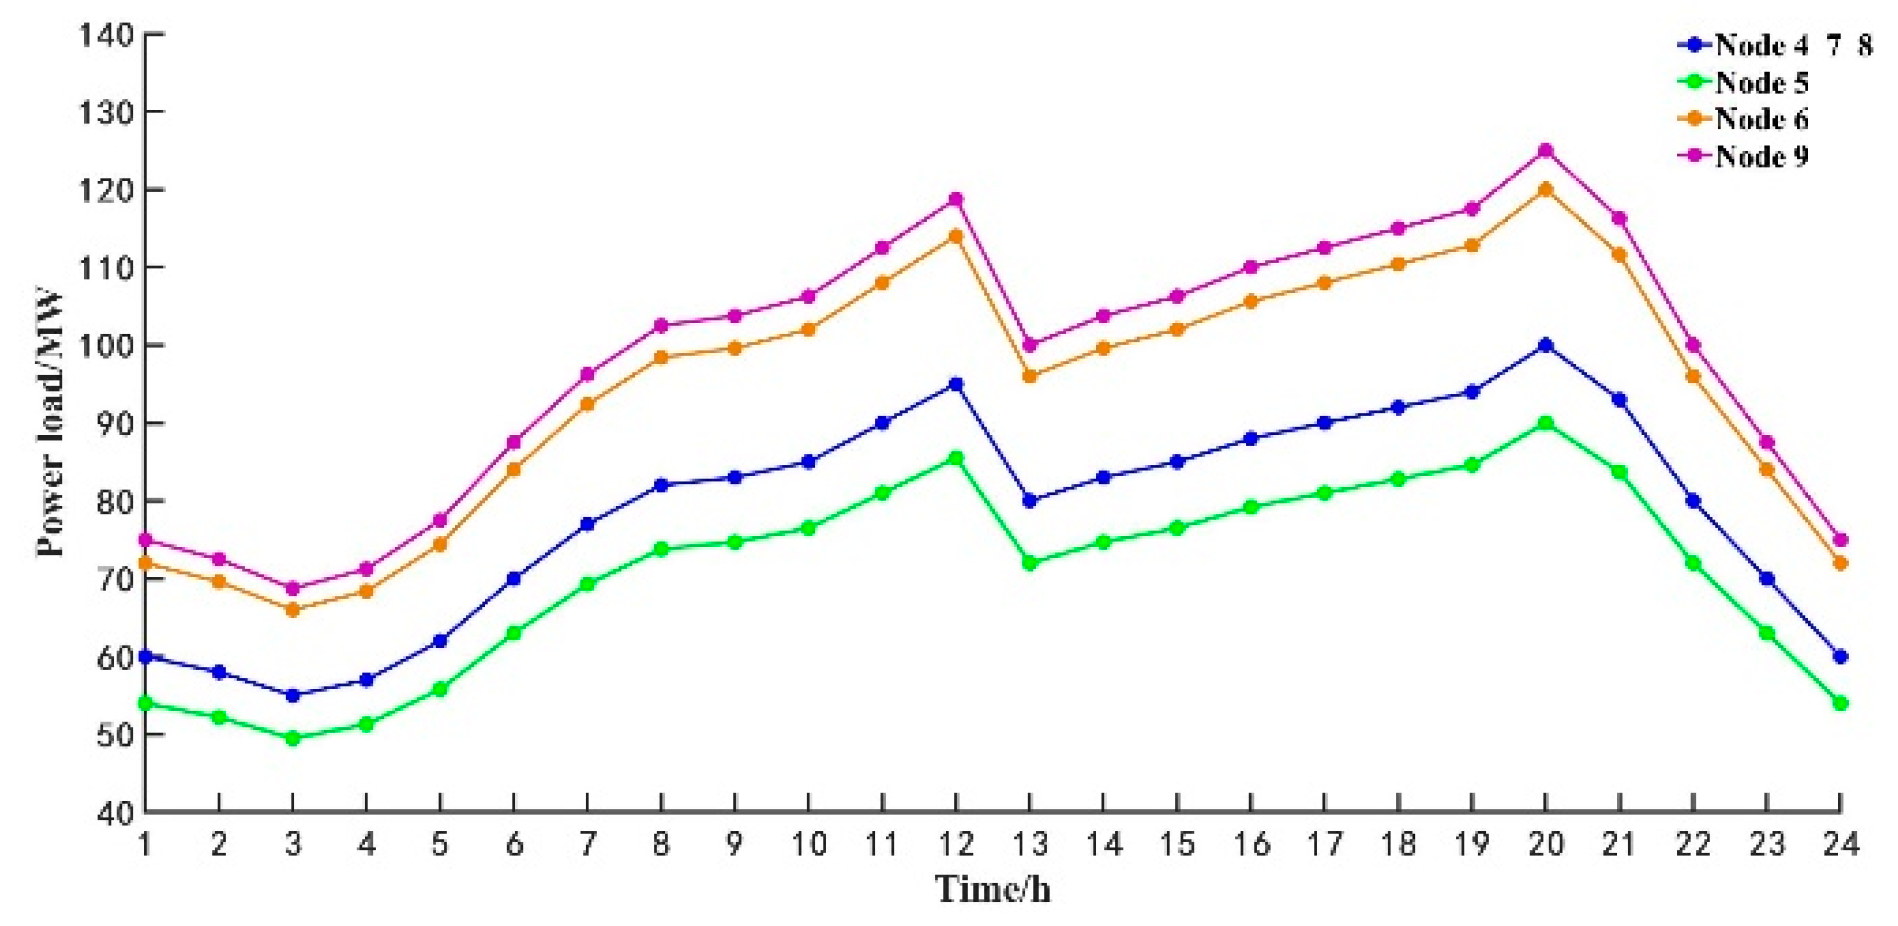
30]. The actual data curves of the daily power load, daily natural gas load, and daily wind power generation are shown in
Appendix A Figure A1,
Figure A2 and
Figure A3, respectively. Other parameters are shown in
Appendix A Table A1,
Table A2,
Table A3,
Table A4,
Table A5 and
Table A6. In order to verify the correctness of the model and analyze the economy of the P2G system in terms of planning and operation at the same time, this work set two scenarios to solve the model. Scenario 1: Excluding optimized planning of the P2G plant station, the wind energy consumption rate was 80%. Scenario 2: Including optimized planning of the P2G plant station, the wind energy consumption rate was 100%.
The parameters of the algorithm were selected according to the general range proposed in [
31,
32]. Within these ranges, the parameters in this study were determined by trying them many times. The optimal values of parameters that were most apt to solve the proposed combined planning model were selected. The maximum number of immune iterations of the immune algorithm was set at 100 times. The number of clones was set at 10, and the mutation probability was set as 0.7. The lower and upper limits of the outputs of all units were set as 0% and 100%, respectively. The optimal value was generally obtained after one immune cycle with 40 iterations. The algorithm had good convergence in the solution of the unit output optimization problem.
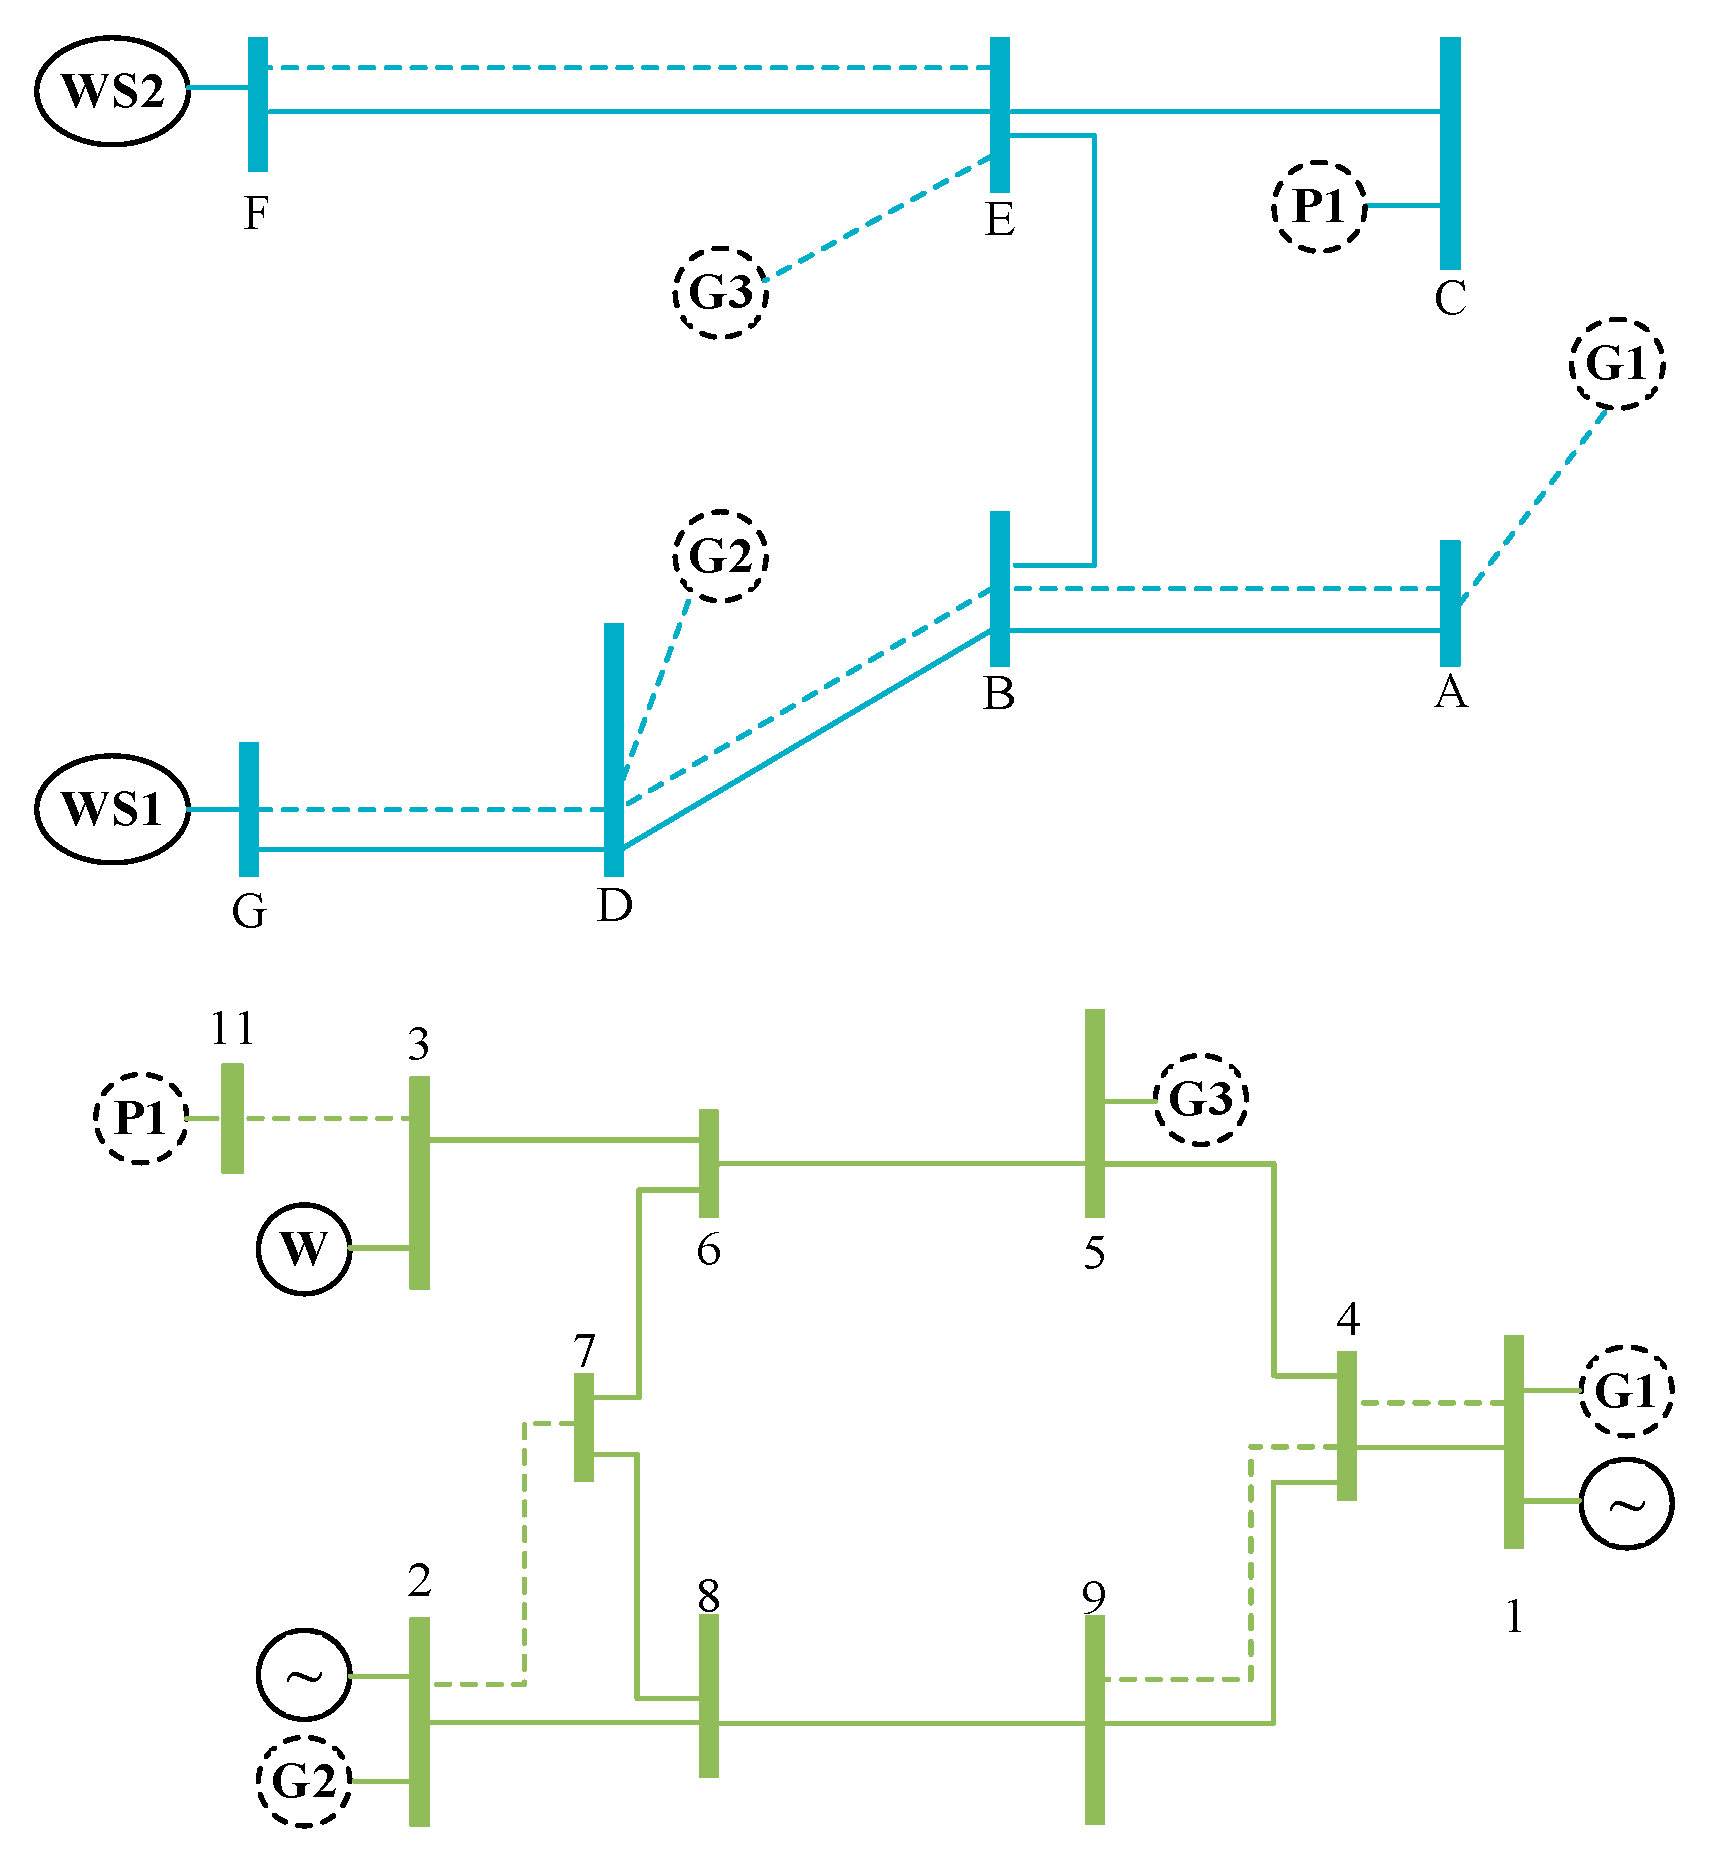
The planning grids obtained under the two scenarios are shown in
Figure 3 and
Figure 4, where the dotted lines represent the facilities to be built after the planning. In
Figure 4, the P2G plant station P1 was built in the natural gas system to meet part of the load in node C, so there was no need to expand original pipelines B–E and C–E. In
Figure 4, power lines 1–4 and 2–7 needed to be built instead of power lines 2–8 in
Figure 3.
The operation cost for each hour in a typical load day was calculated by the proposed immune evolution method. The convergence trends are very close. Therefore, in order to give a clear picture, only the immune evolution curves at 12:00 and 00:00 were selected and drawn in
Figure 5 to validate the convergence characteristics of the algorithm. It can be seen that the immune algorithm had good convergence characteristics in terms of unit output optimization. The correctness of the algorithm parameters was also validated.
In this study, the data for the power line, pipeline, and unit investment costs were taken from [
33]. The planning results and cost comparisons obtained under the two scenarios are shown in
Table 1 and
Table 2, respectively.
The annual investment cost is the total cost for the gas pipelines, power lines, gas units, and P2G plant stations, which was converted into an equivalent annual investment value. It can be seen from
Table 2 that the annual investment cost in scenario 2 with P2G was higher compared with the planning scheme in scenario 1 without P2G. Among these, the investment cost for the natural gas pipeline in scenario 2 was significantly reduced. The reason is that P2G served as a gas source in the natural gas system to meet part of the load in node C. After planning, the original pipelines B–E and C–E could still transport natural gas to meet the demands of the remaining load of node C, so there was no need for expansion. In scenario 2, P2, the candidate plant of P2G, was located far away from load nodes in the natural gas system, and its establishment did not affect the natural gas volume to be transported by other pipelines; therefore, it was not built. In addition to the pipeline investment costs, the investment costs for the power lines and units under scenario 2 were higher. This was because the P2G investment cost was higher, and the new P2G installation required greater spending. At the same time, the P2G factory station provided a larger electric load in the power system. Therefore, in order to meet the trend of the security constraints, more lines and generator capacity expansion were needed.
Compared with scenario 1, scenario 2 showed lower annual operating costs. This was because the construction of the P2G plant station absorbed the curtailed wind energy of the wind farm and reduced the output of the natural gas wells. At the same time, the bidirectional coupled system composed of the P2G and gas unit had a large space for output regulation. Therefore, the operation cost can be reduced by optimizing the output of the unit. A day representing the average daily load for future years is selected as the typical day [
34]. The hourly operating costs for typical days in the system under the two scenarios were compared as shown in
Figure 6. Detailed hourly unit output distribution values are listed in
Appendix A Table A7 and
Table A8.
As shown in
Figure 6, between 01:00 and 05:00, the P2G plant’s consumption of curtailed wind energy satisfied part of the natural gas load and reduced the output costs of the gas source. However, due to the low demand for the electric load and gas load, the output optimization of the P2G plant and gas unit has little impact on the operating cost. Therefore, there was little difference in the operating costs between the two scenarios. Between 06:00 to 00:00, scenario 2 showed lower operation costs. This is because in scenario 2, the P2G factory building could absorb the curtailed wind and the bidirectional coupling system consisting of the unit and gas have a larger output power distribution space. With the increase in the electric load and load requirements, the coordination and optimization of different units can effectively reduce the operation cost. It should be highlighted that there was no curtailed wind power in the wind farm between 09:00 and 19:00. During this period, the output of the P2G plant station reduces the gas output from the natural gas source, which was the main reason for the reduction in the operating costs.
In
Figure 6, 12:00 and 20:00 are two moments with peak daily operating costs in the typical day. The operating cost differences between the two scenarios are also the biggest at these two moments. As can be seen from the load curve, the peak values for the electric load and gas load demands in the whole day are at 20:00. The electric load at 12:00 is at its secondary peak value across the whole day. It can be seen that when the load demand was high, the coordinated optimization of the P2G plant station and gas unit output could effectively reduce the system operation costs, resulting in greater economic benefits.
It can be seen from the analysis that reasonable planning of the P2G location can effectively reduce the investment costs of the natural gas pipeline. P2G technology has developed rapidly in recent years, which could improve the interactivity of power and natural gas systems. However, under the existing technical conditions, the investment and construction costs for the P2G plant station were still high, meaning such systems are not yet economically feasible. With the gradual maturity of P2G technology, the decrease in investment cost, and the improvement of operation efficiency, the method proposed in this paper could improve the economic benefits from the planning and operation of electricity-gas coupling systems and help to absorb large-scale renewable energy.
5. Conclusions
In this study, the P2G approach was considered in an optimization planning model of an electricity-natural gas coupling system. The effects of P2G station planning on the network structure of the coupling system were deeply analyzed. The combined optimization model used the construction statuses of different types of units, power lines, and pipelines and the output power from the gas unit and P2G plant station as optimization variants. It aimed to minimize the sum of annual investment costs and annual operation costs for the system without wind curtailment. The immune algorithm was proposed to solve the power-gas coupling optimization planning problem, involving P2G and gas units.
Through case studies, it was found that the investment costs for P2G plant stations and the supporting expansion equipment were relatively high. However, the reasonable planning of a P2G location could effectively reduce the investment cost of the natural gas network pipeline. For the regions that need to spend a lot of money in building many natural gas network pipelines to satisfy the future gas load, investment in P2G plant stations could be taken as an optional solution. Additionally, in the power–natural gas coupling system composed of P2G and gas units, the operation costs of the system can be effectively reduced by adjusting the output distribution of the gas units and P2G plant station. When the load demand is high, the economic benefits brought about by output optimization are more significant.
The commercial application of P2G technology is only just beginning, meaning the optimal planning method proposed in this paper can be initially applied to small-scale, user-side regional energy supply systems, optimizing the allocation of units and improving the planning economy. The annual operating costs calculated in this paper do not consider the carbon capture costs of the P2G approach. With the development of a low-carbon economy, the carbon capture function of the P2G approach could provide a carbon emission option, which will further improve the operating costs in the future.


