Article

Viability Assessment of Small-Scale On-Grid Wind Energy Generator for Households in Malaysia

1
Institute of Sustainable Energy (ISE), Universiti Tenaga Nasional, Kajang 43000, Selangor, Malaysia
2
Mechanical Engineering Department, College of Engineering, Universiti Tenaga Nasional, Jalan IKRAM-UNITEN, Kajang 43000, Selangor, Malaysia
3
College of Graduate Studies, Universiti Tenaga Nasional, Kajang 43000, Selangor, Malaysia
*
Author to whom correspondence should be addressed.
Energies 2021, 14(12), 3391; https://doi.org/10.3390/en14123391
Submission received: 26 February 2021 / Revised: 28 April 2021 / Accepted: 26 May 2021 / Published: 9 June 2021
(This article belongs to the Special Issue Advanced Analytics in Renewable Energy)

Abstract

:
This study provides a techno-financial evaluation of two sites in Malaysia: Kudat, located on the coast of the northernmost part of Sabah, the state of East Malaysia with promising wind potential, and Putrajaya in the Klang Valley region with moderate wind potential at high elevations similar to the dominant cities in Malaysia. Three small-scale wind turbines were evaluated, taking into account a nominal electrical power generation below 100 kW. The research is focused on 220 residential households. The software used to perform the evaluation was Hybrid Optimization of Multiple Energy Resources (HOMER). The research novelty is the examination of the non-hybrid small-scale turbines at high elevations for regions with low wind speed, such as Malaysia. Regardless of the wind farms’ financial profit, this study used the net present cost (NPC) analysis in all cases. This research demonstrates the feasibility of small-scale wind turbines mounted at high elevations for generating sufficient energy. The results indicate that in both areas, the RX-20KH3 model is the best option, and the costs of the FH-5000 and RX-20KH3 farms are proportionate for a renewable project. Furthermore, with government support, the WES80 farm could be suitable.

1. Introduction

Due to the exhaustibility and limitations of conventional energy resources, renewable energy sources provide an alternative solution in supplying the essential energy needs while keeping the environment clean. Over the last years, renewable energy sources have grown considerably grown worldwide. Currently, they account for 14% of all energy production globally, and it has been predicted that by 2050, 85% of the total energy will be supplied by renewable energy sources [1]. From another perspective, the renewable energy demand has an annual increase of approximately 3.3% [2], making it the world’s most rapidly growing energy source.
In the Asia-Pacific region, renewable energy sources are also rapidly growing. Between 1995 and 2012, they grew from 590 to 794 million tons of oil equivalents (Mtoe), aided by developments in China, South Korea, and India [3]. In Malaysia, renewable sources supply only 625 MW, with 2% penetration to the total energy sources [4]. Malaysia has an ambitious goal of increasing the renewable energy share to 20% [5]. Moreover, the government plans to lower the intensity of greenhouse gas (GHG) emissions of GDP to 45% by 2030 relative to 2015 [5]. Furthermore, Malaysia’s renewable energy potential per capita is 4.73, which is the highest among the Association of Southeast Asian Nations (ASEAN) [6]. The government has also considered listing wind energy as one of the national energy sources and planned to build wind turbines, especially in Malaysia’s East coasts.
Generally, the wind speed in Malaysia is low compared with other countries (e.g., Denmark and Netherlands). However, some sites are known to have high wind speeds at a specific time of the year, precisely during monsoon. The highest wind speed is in the range of 6 to 12 m/s, indicating that there is a chance to generate wind energy [7]. The Malaysian government is optimistic about wind energy resources and has offered research grants to produce comprehensive research and more details, especially to evaluate the feasibility of wind energy in Malaysia [8].
Numerous studies have examined the feed-in-tariff (FiT) rates to evaluate the wind farms’ feasibility in Malaysia. To calculate the annual wind energy production in Kudat, Ibrahim and Albani [9] chose 22 kW-rated power wind turbines. The findings show the best location for wind turbine installation, with potential output ranging from 37.5 to 43.1 MWh/year and FiT rates ranging from 0.115 to 0.2 USD/kWh. Furthermore, Albani et al. [10] suggested a framework for determining the best FiT for wind energy generation in Malaysia. They selected Kudat as the focus of the case study, collected actual data at various elevations, and recorded an average wind speed of 5 m/s when the hub height exceeded 30 m. For small-scale turbines, the FiT was between 0.231 and 0.282 USD/kWh, whereas for utility-scale turbines, it was between 0.185 and 0.226 USD/kWh. By contrast, Akorede et al. [11] conducted a power factor study using various wind turbines. Mersing achieved a maximum capacity factor of 4.39% with wind turbines between 20 and 50 kW in capacity at a height of 36.6 m.
In a different direction, Izadyar et al. [12] compiled a list of potential locations to determine the best hybrid configuration renewable energy systems. Other researchers have adopted a techno-economic approach to evaluate the wind energy potentiality of various locations and determine the best hybrid system configurations [13,14,15,16]. For example, research in Terengganu looked at a hybrid system (solar–wind–grid) that was connected to the household grid. The PV connected to the grid system (2 kW) with an energy cost of 0.001 USD/kWh was found to be the most feasible configuration. The total electricity generated by wind turbines in other configurations was just 14% and 22% of the total electricity output for the solar–wind–grid and wind–grid systems, respectively. The solar–wind–grid configuration was found to be the highest, with an average wind speed of 3.43 m/s and a FiT rate of 0.5169 USD/kWh [17]. Moreover, by considering the cost of energy in hybrid settings, numerous studies evaluated the feasibility of energy system in different locations (see, e.g., in [18]).
In sum, the majority of the previous studies in Malaysia concentrated on wind potentiality and were often based on theoretical studies with contradictory conclusions. However, some of them provided valuable contributions and wind energy observations in Malaysia based on real data. In some research, it is noticeable that the annual average wind speed was used, which does not accurately represent the actual power production due to wind speed fluctuations. Moreover, many studies were conducted on small-scale wind farms in Malaysia using hybrid settings. However, there is a need to study non-hybrid settings for residential demand in rural areas. The non-hybrid approach has proved to be successful in other countries. For example, a study was conducted in Chile using small-scale wind turbines connected to the grid [19]. The attractive feature of the small-scale turbines is that they use the low wind speed as they operate with cut-in speed of ~2.5 m/s [20]. Moreover, their point of nominal capacity is less than 8 m/s to achieve an optimal performance, which is further discussed in Section 5.
This study aimed to assess the financial feasibility of the deployment of small-scale wind farms in Malaysia to evaluate the capabilities of these turbines to generate sufficient power at high elevations for residential demands.
The remainder of this paper is organized as follows. Section 2 describes wind speed data and electrical load profile. Section 3 discusses the economic model and project lifecycle. Section 4 introduces the case study by examining different aspects, such as wind speed profile, loads, and selected turbines. Section 5 presents the results, whereas Section 6 discusses the findings. Finally, the conclusion and future work recommendations are discussed in Section 7.

2. Wind Speed Data and Electrical Load Estimation

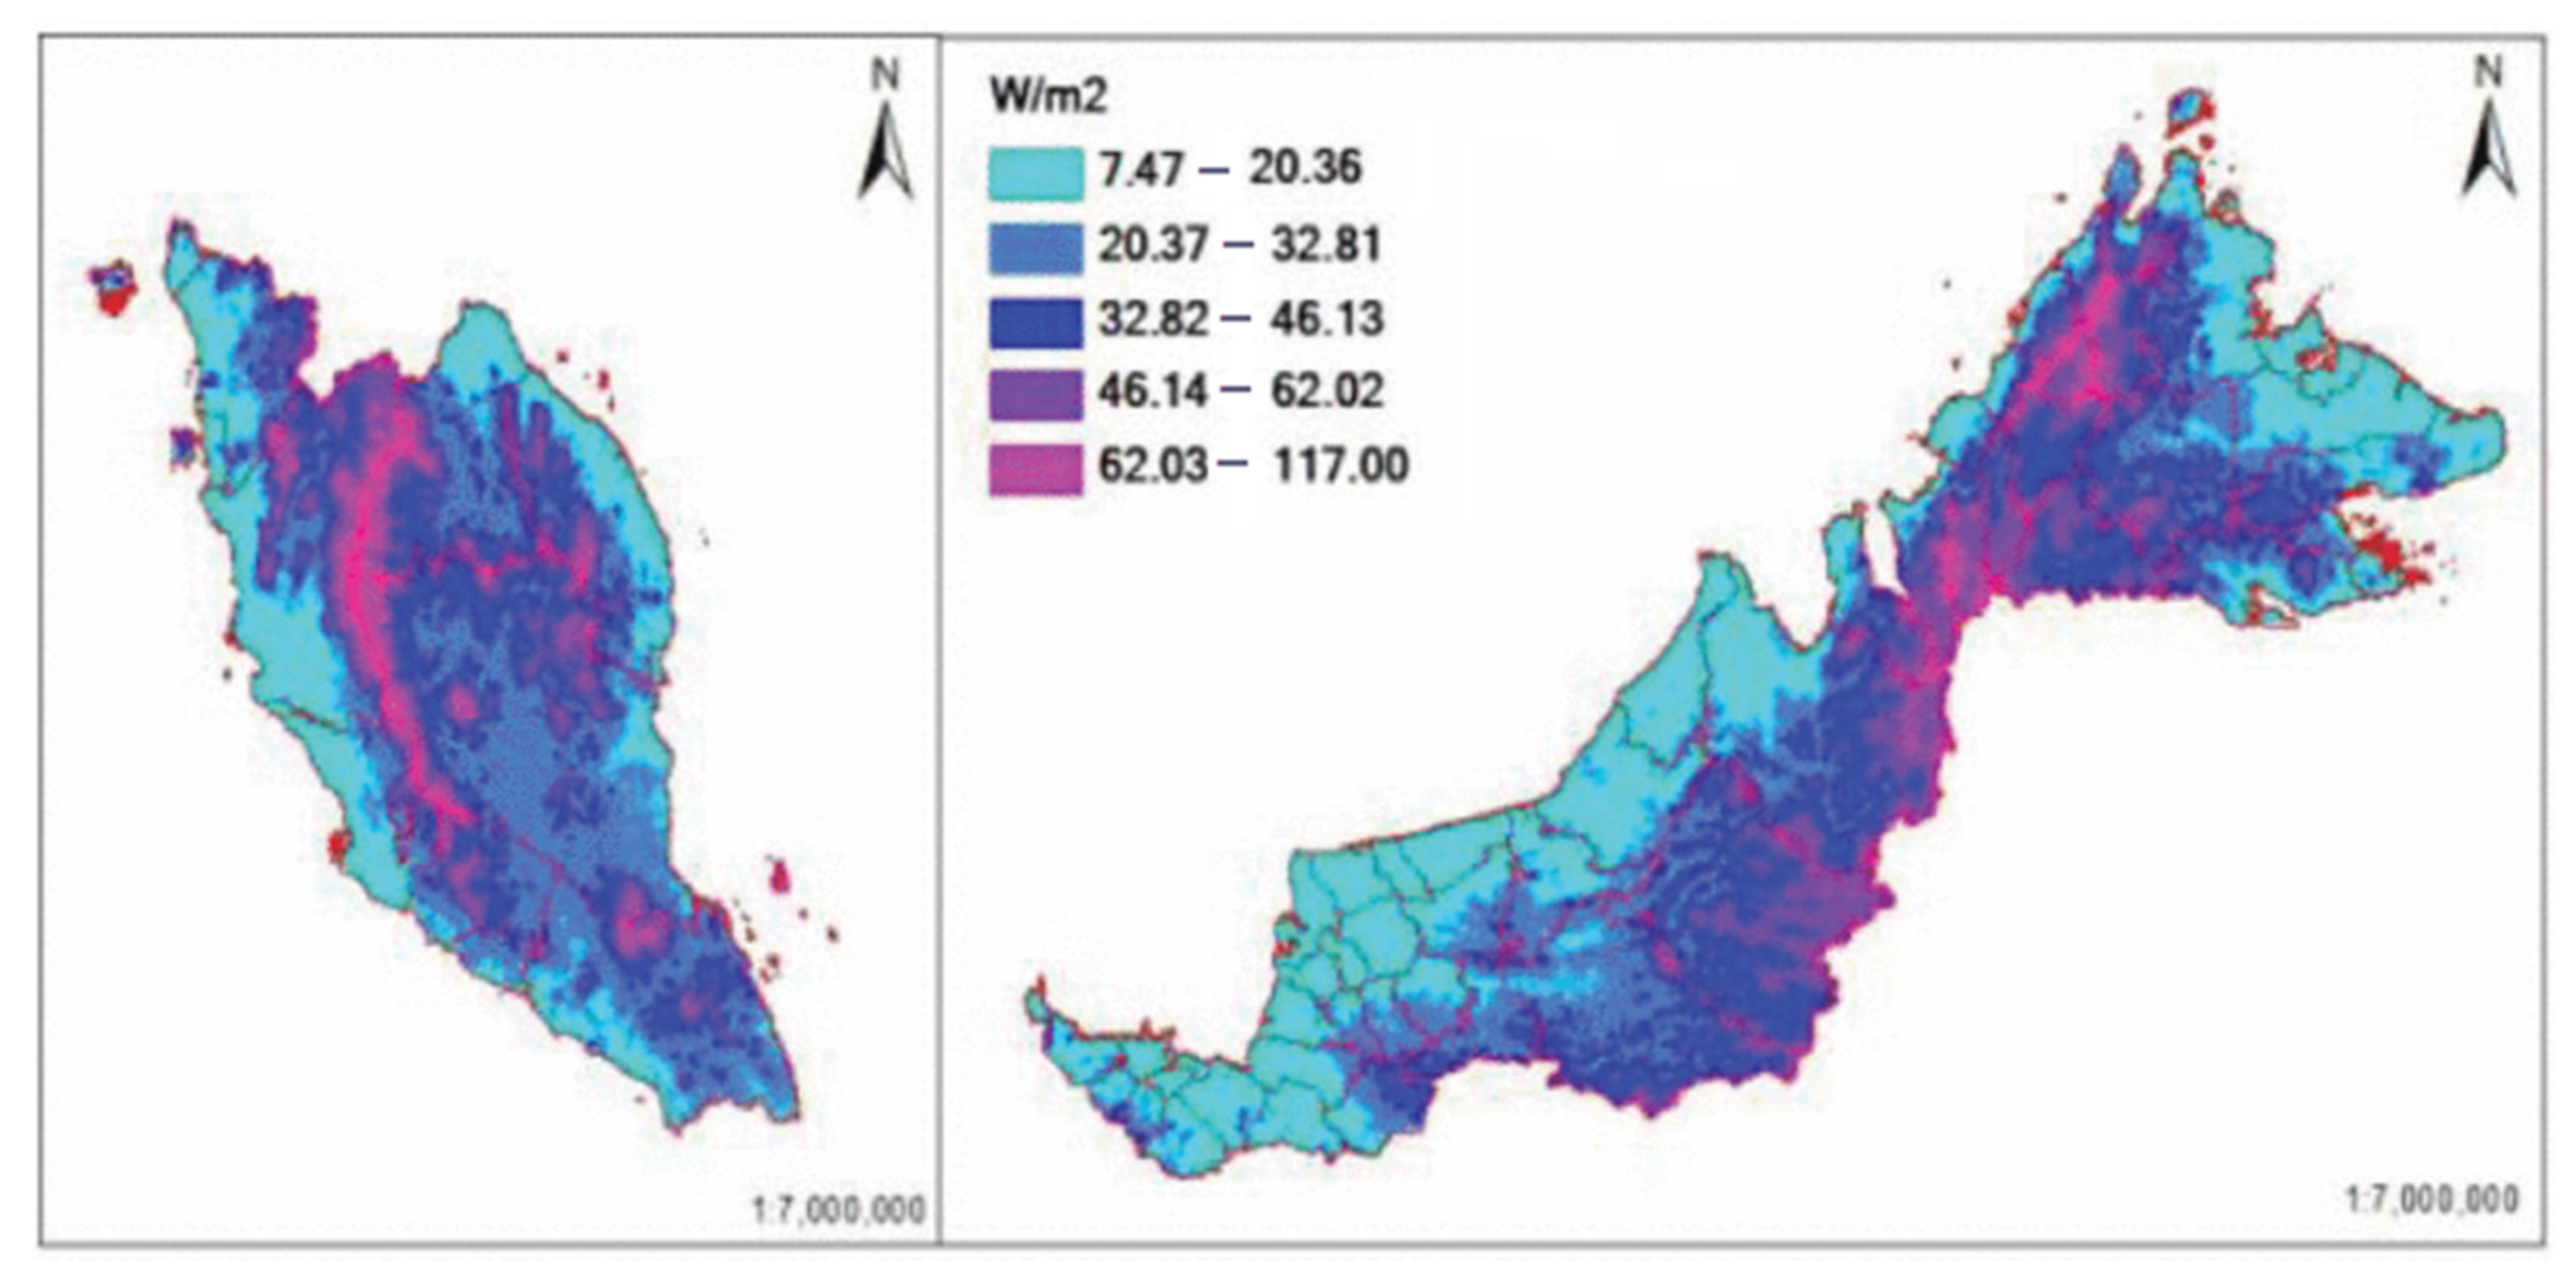
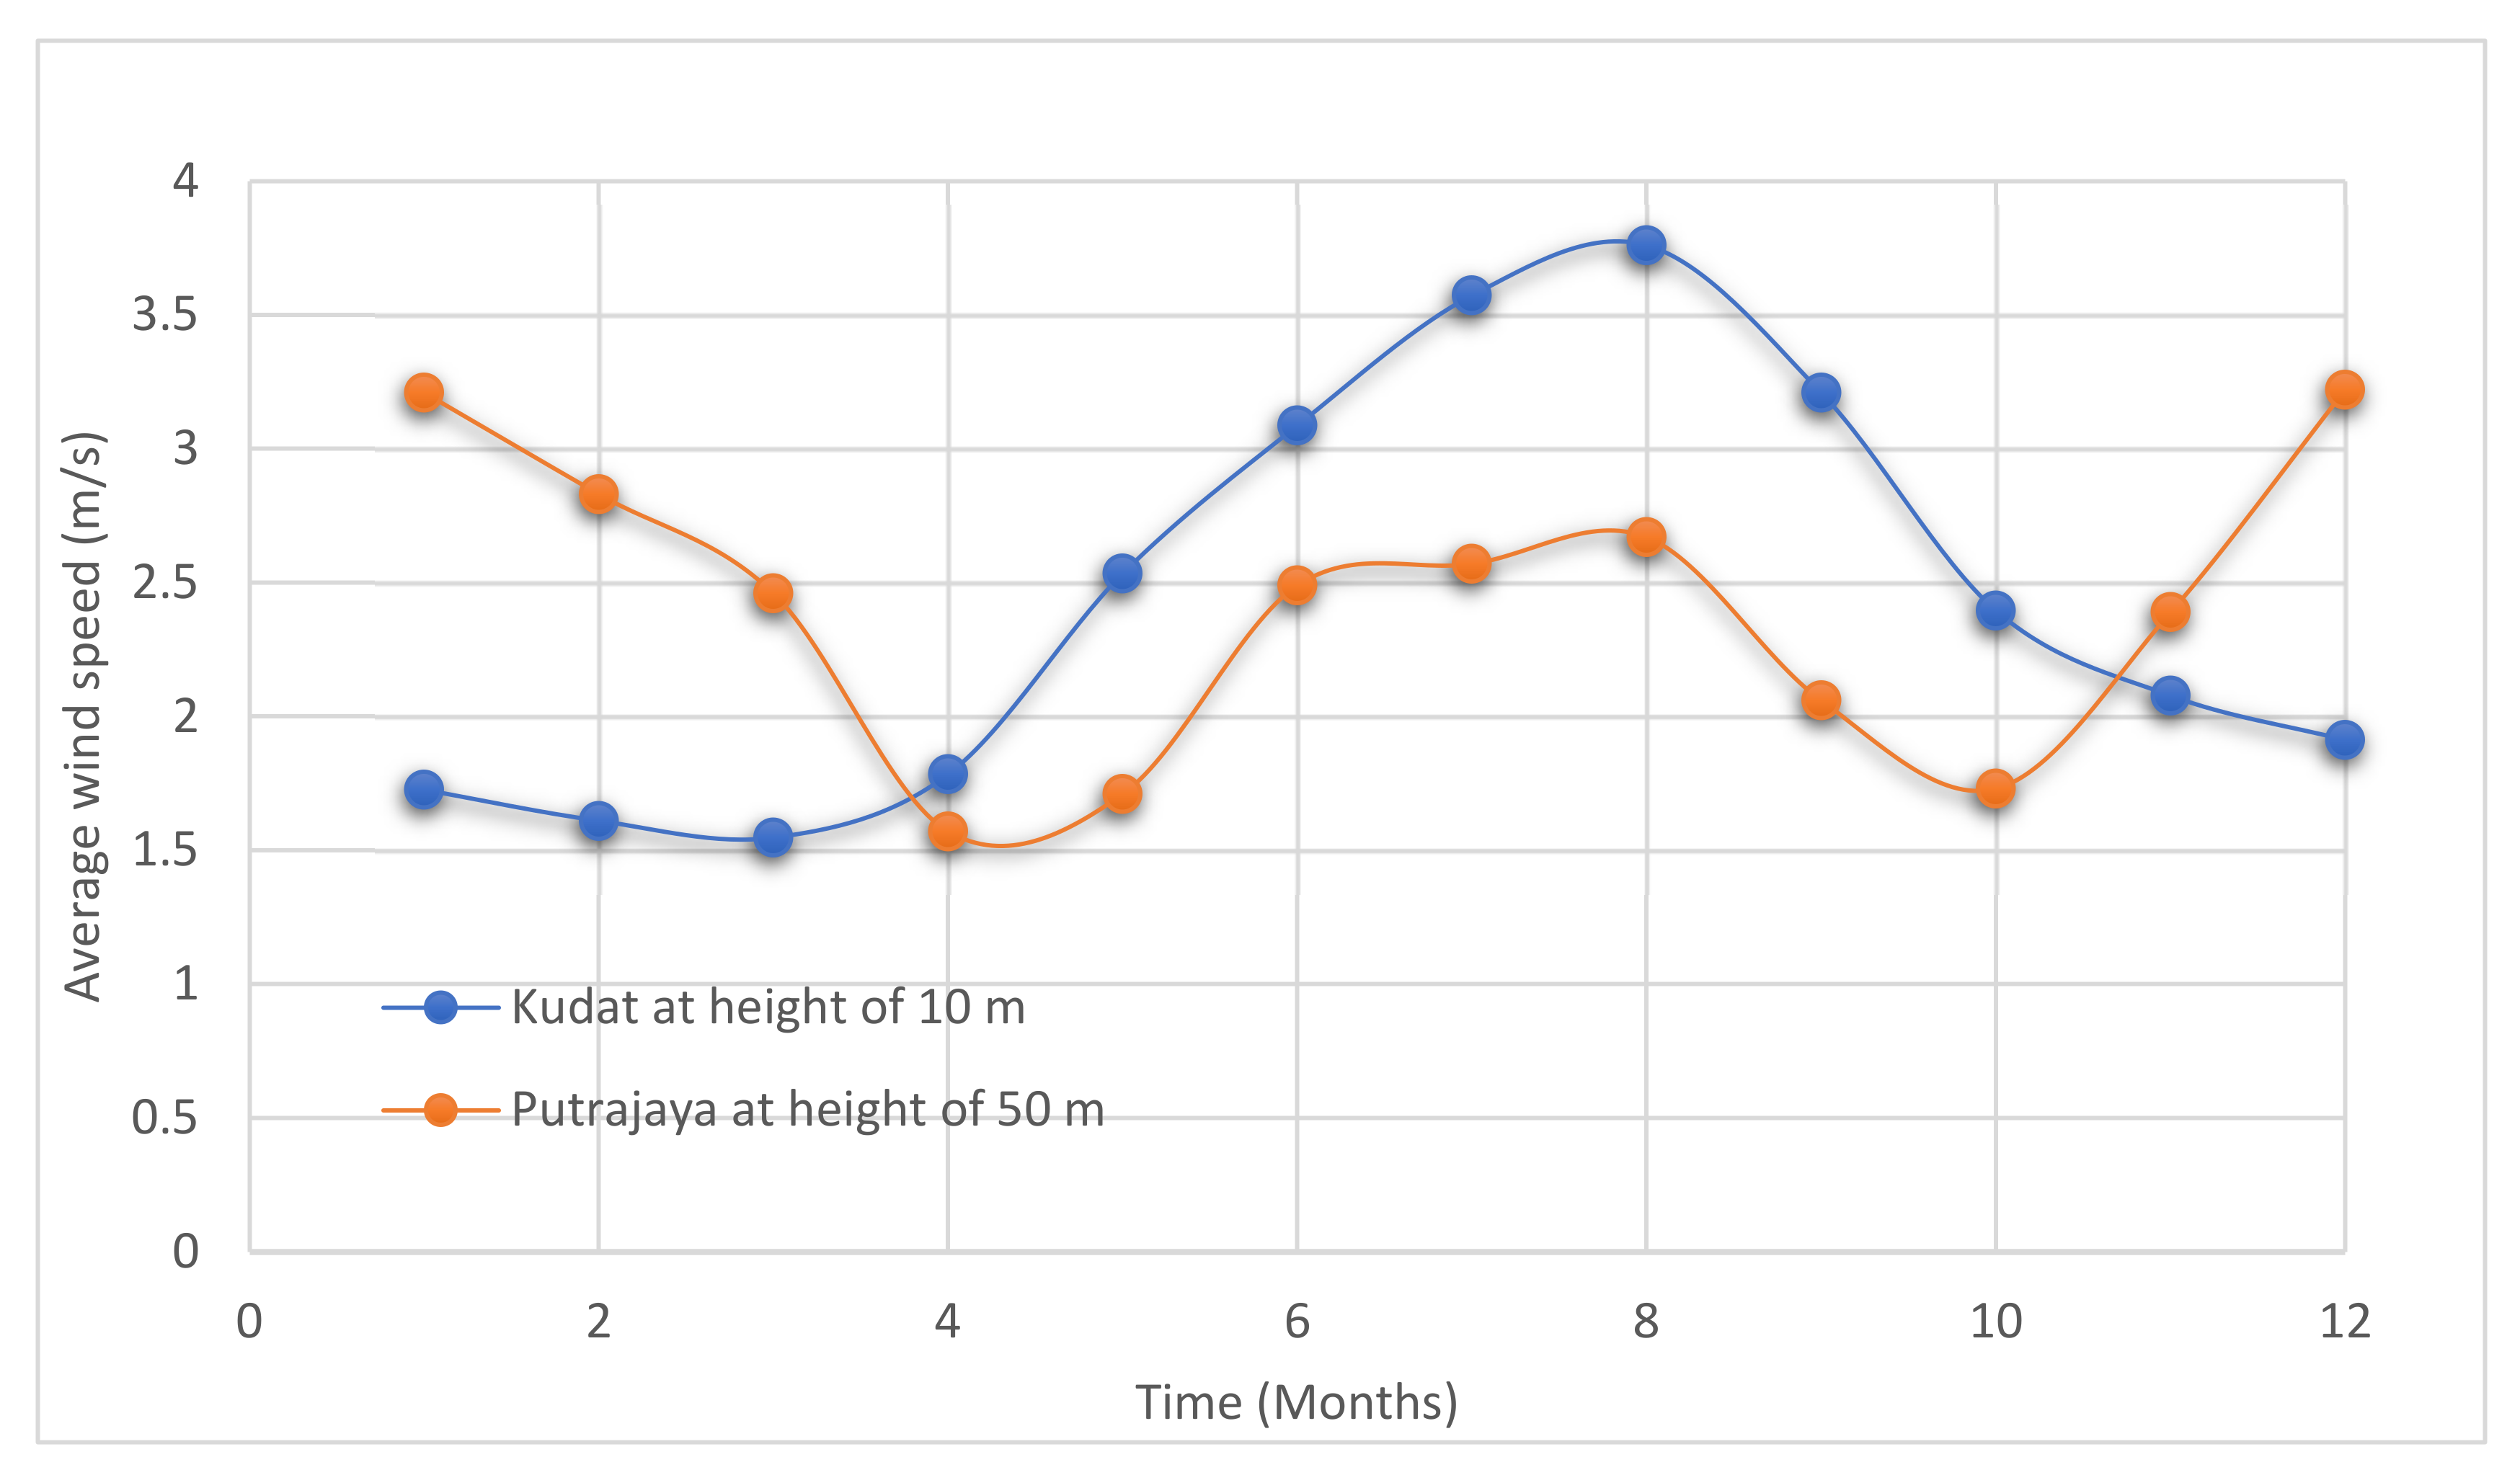
2.1. Wind Speed Data

In Malaysia, research on wind energy is still in its infancy, with the lack of wind energy viability being addressed in many sites [4]. Most previous studies utilized secondary meteorological data collected by weather stations mainly located in airports. These wind data were obtained from the Malaysian Meteorological Department (MMD), mainly used in airports for weather forecasting, not for energy purposes [4]. In this study, the wind data were obtained from the MMD and NASA surface metrology and solar energy dataset (SSE).
In the case of Kudat, the data were collected through observations performed daily for the year 2019 from the MMD station located inside the Kudat airport at a height of 10 m. By contrast, Putrajaya site’s data were obtained from SSE, a website for renewable energy resources sponsored by the NASA Applied Sciences Program in the Directorate of the Science Mission established by Power (Prediction of the Worldwide Energy Resources). It contains more than 200 parameters of satellite-acquired meteorology and solar energy, with a monthly average of 22 years of data and site-specific data tables [21]. More details about the wind speed profiles are explained in Section 4.

2.2. Electrical Load Profile

Electricity demand significantly impacts the design of hybrid energy systems [22]. Electricity consumption varies in different locations due to climate and social factors. The utilities in Malaysia do not provide precise information on the electricity consumption of households. For example, Tenaga Nasional Berhad (TNB) estimates the maximum power consumption based on the type of buildings [23].
Smart meters, wireless sensors, and advanced communication are some of the emerging technologies in the industry that can measure power consumption [24,25,26,27,28]. However, researchers made several attempts to measure the household power consumption in rural areas. Fahmi et al. [29] modeled the load profile of households in rural regions by considering only essential appliances (e.g., TV, ceiling fan, freezer, lights, and sockets). The amount of consumed electricity per day was found to be 2594 Wh in 16 h. In comparison with another study recently conducted in [30], the technology development and improved living quality were considered. More appliances were added (e.g., iron, water pump, refrigerator, fluorescent lamp, and exhaust fan), the duration of consumption was longer (24 h), and a large house with a total area of 660 sq ft was selected. They stated that the load profile was 8728.1 Wh/day. Considering all the previous cases, the most precise load profile estimation was selected, which was a monthly demand of 262 kWh/household, as this estimation is realistic and recent.

2.3. Software Tool for Feasibility Study

This study used the Hybrid Optimization of Multiple Energy Resources (HOMER) software, which is the most widely used in this field [31]. According to the available details, the software requires different inputs (e.g., power demand, available resources, and power generators). The estimation of emissions is provided as an optional choice. Finally, the model can be subjected to various constraints, such as limit of production and scheduled generation. HOMER was selected owing to its ability to demonstrate the best possible configuration under a set of conditions and evaluate their financial viability. Different conditions can be compared to see if the adjustment of any of the variables affects the incremental benefits. Another advantage of this software is the high resolution at which the input data can be processed. Meanwhile, it allows users to join electric load in 1 h increments, which results in a more refined performance. Another significant aspect of HOMER is that it generates a characteristic charge curve for demand based on the type of consumer being modeled. We can provide the model with an approximation of the estimated average monthly electrical consumption, as we discussed in Section 2.2. More information on this issue, as well as the component specifications, will be provided in Section 4. Several studies used HOMER to model the energy system, proving that it can be used for scientific purposes.

3. Economic Modeling and Project Lifecycle

In Malaysia, energy service companies (ESCOs) began in the 1990s, focusing on energy cost-saving technologies [32]. Murakoshi et al. found ESCO’s market in Malaysia to be robust and evolving [33]. ESCOs were mainly focused on the industrial domain rather than on the residents as the industry has the highest demand for energy [34]. Hwang et al. described ESCOs in Malaysia to be in their infancy due to the low energy price and rapid economic development [34].
In this study, the proposed ESCO is different. We adopted the concept introduced by Bertoldi et al., i.e., the energy service provider company (ESPC) supplies the energy to the end customer [35]. The duties of the ESPC include project evaluation, equipment acquisition and installment, and the infrastructure’s operation and management. The crucial criteria considered to analyze the economic viability in this study are the total annualized cost of the system ($/year), inflation rate (3%), discount rate (8%), and lifetime of the project (5 years).
In Malaysia, the new net energy metering (NEM) mechanism updated in 2019 offers the same tariff for buying and selling electricity for NEM participants [5]. The net metering scheme enables clients to inject the energy into the grid to reduce the consumption rate and sell extra energy [36].
In renewable energy projects, such as wind or solar energy, the life cycle assessment (LCA) method became popular. LCA was adopted to determine the environmental impacts of a project via its life cycle. Even though renewable energy projects are emerging, encouraged, and supported by governments, there is still a need to confirm their general impacts on the surrounding environment, precisely through their life cycles [37].
The flow chart of the wind turbine lifecycle is presented in Figure 1. The process includes the extraction of raw materials, manufacturing, construction, operation, maintenance, and decommissioning. In the manufacturing phase, the turbines’ essential components are developed, such as the foundation, tower, rotor, blades, nacelle, and cables. The machinery equipment consumes carbon-based fuels during transportation of the components, extraction of the materials, manufacturing, and construction activities. Moreover, during the operation and maintenance, fuels are required to transport the spare parts, and technicians use various lubricants. In addition, in the decommissioning phase, the activities require the operation of machinery and vehicles that consume more fuel [38]. Consequently, the development of wind energy projects is associated with energy that is called embodied and results indirectly in GHG emissions.
From the notion that reducing carbon emissions will significantly influence the project’s financial aspects, carbon credits are currently a well-known aspect that has relevance. As presented in Figure 2, the price of this commodity is 38 USD/ton CO2; compared with its cost between 2011 and 2018, it was shallow (it reached its minimum value in 2013, 3.54 USD/ton CO2) [39]. Then, today, it has relevant effects on the NPC of the project.

4. Case Study

This section discusses the wind potentiality of two locations. Figure 3 depicts the map of spatial analysis of wind speed in Malaysia, showing the average wind speed in different locations. The wind power per unit swept area is indicated by the colors of the spatial WPD, which ranged from cyan to purple. Light blue indicates the highest potential sites. Besides wind speed, we consider other factors, such as grid network connection, near to residential areas, and topology.
By considering the proposed factors, two sites were selected as promising scenarios of wind potential. The first is Kudat Town that is situated on the coast of the northernmost part of Sabah, the state of East Malaysia. Several studies have evaluated the positionality of wind energy in Kudat in terms of climate, topography, obstacles, and surface roughness of the land. They found that these cities have good potential for producing wind energy [4,8,9,41,42]. The second site is Putrajaya, Malaysia’s administrative capital located in the Klang Valley region and 25 km south of Kuala Lumpur. Figure 4 presents the map location of both sites. The wind energy in Putrajaya was previously evaluated in [43]. The Putrajaya site is not among the sites with high-intensity wind speed, but this site was chosen to study the feasibility of small-scale wind turbines at high elevations of the residential areas as recommended by [4].
The average wind speed profile of both locations is presented in Figure 5. As can be seen from the figure, Kudat has high wind speed during the monsoon season (May–September). Both sites can be classified as wind class 1, in which the wind speed values are less than 4.4 m/s. As stated in [44], the locations categorized as wind class 1 are unsuitable for wind energy projects, but in fact, the proposed wind turbines are small scale, and the hub heights of the turbines are between 30 and 100 m (m.a.g.l). Thus, these locations are suitable for small-scale wind farms [45].
In this study, only the residential type is proposed for the case study. To determine the number of households in a specific area, we refer to the work in [46], as they show the number of units per project, ranging from 42 to 570 units. We propose 220 units as the average number of households, representing a ground house in a specific area or building apartment. Figure 6 presents the average demand of power per day. To create a realistic electrical demand profile, seasonality and randomness should be considered [19]. In Malaysia, there are no seasonal changes in climate; the average temperatures during the year range from 25 °C to 32 °C. Therefore, there are no seasonality and randomness effects on the load profile.
The average tariff rate of electricity is 9.4 sen/kWh, which was approved by the Malaysian government in 2015 [47]. The NEM mechanism has been successfully implemented, as discussed earlier in the economic model. It has been adjusted to offer more attractive rates, where the selling and buying rates are the same.
To select suitable wind turbines for the proposed locations, we considered the turbines’ power capacity to categorize the wind farm as small. We selected three different sizes of the turbine by considering the nominal capacity to be less than 100 kW. The cut-in speed is 3 m/s, and their point of nominal capacity is less than 8 m/s to achieve optimal performance. Consequently, the selected models are as follows:
  • FH-5000, FLTXNY
  • RX-20KH3, R&X Energy
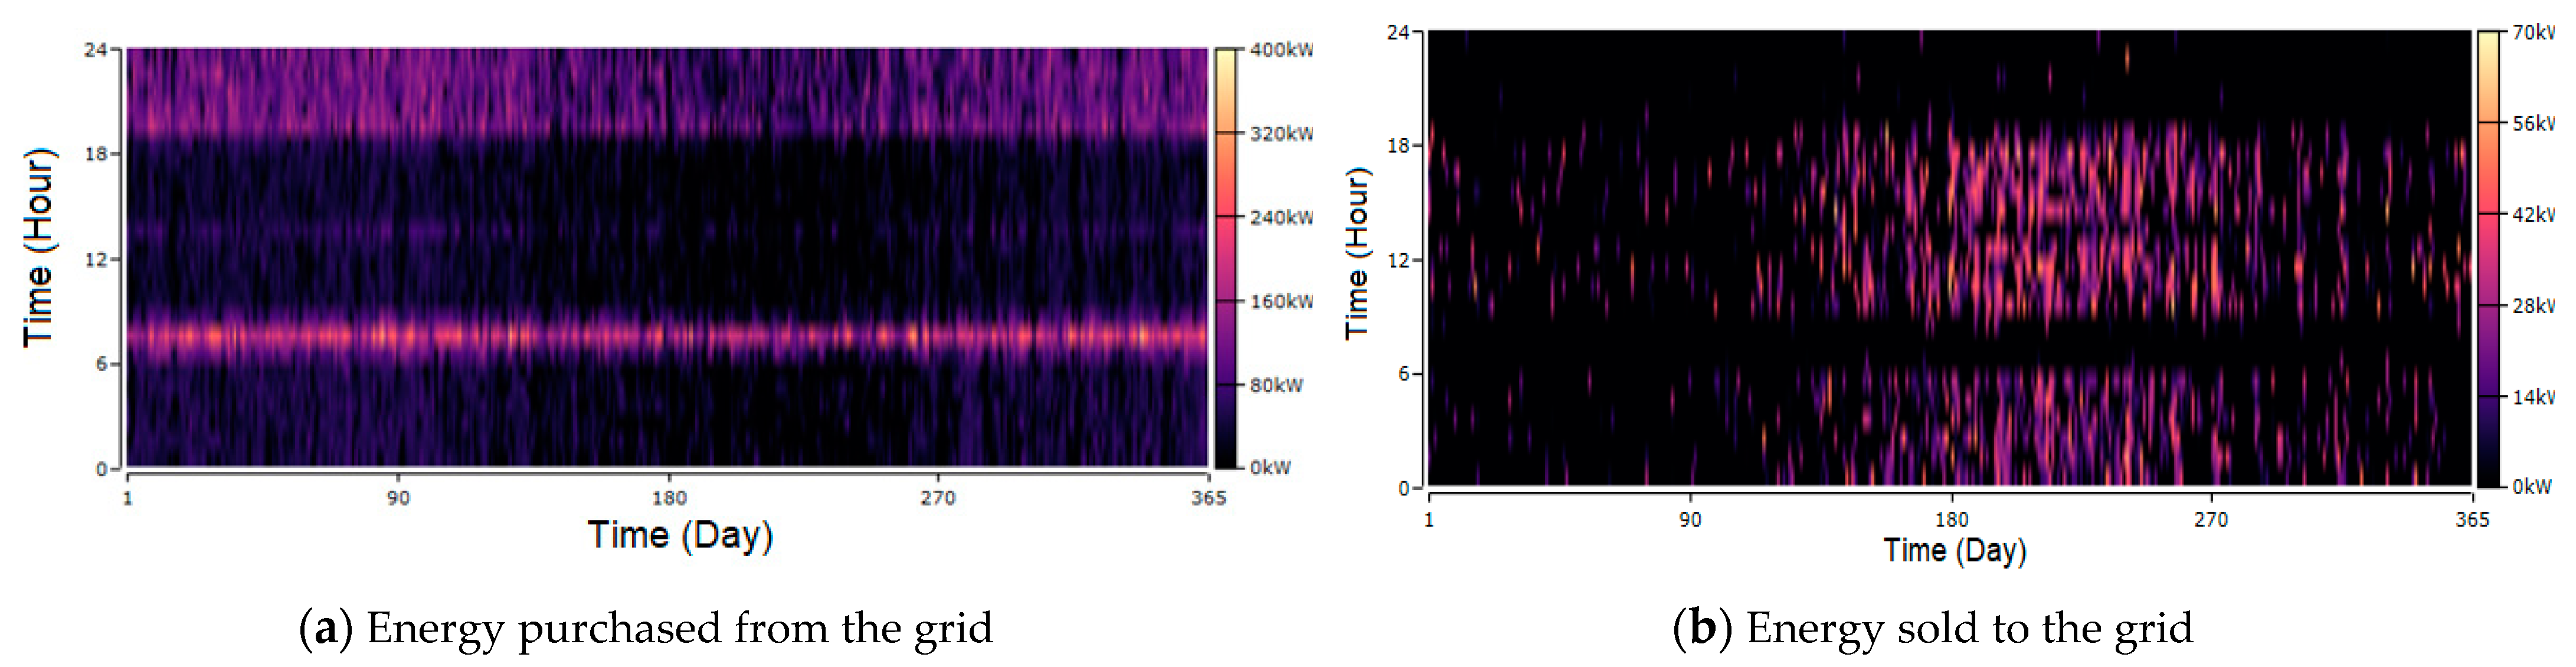
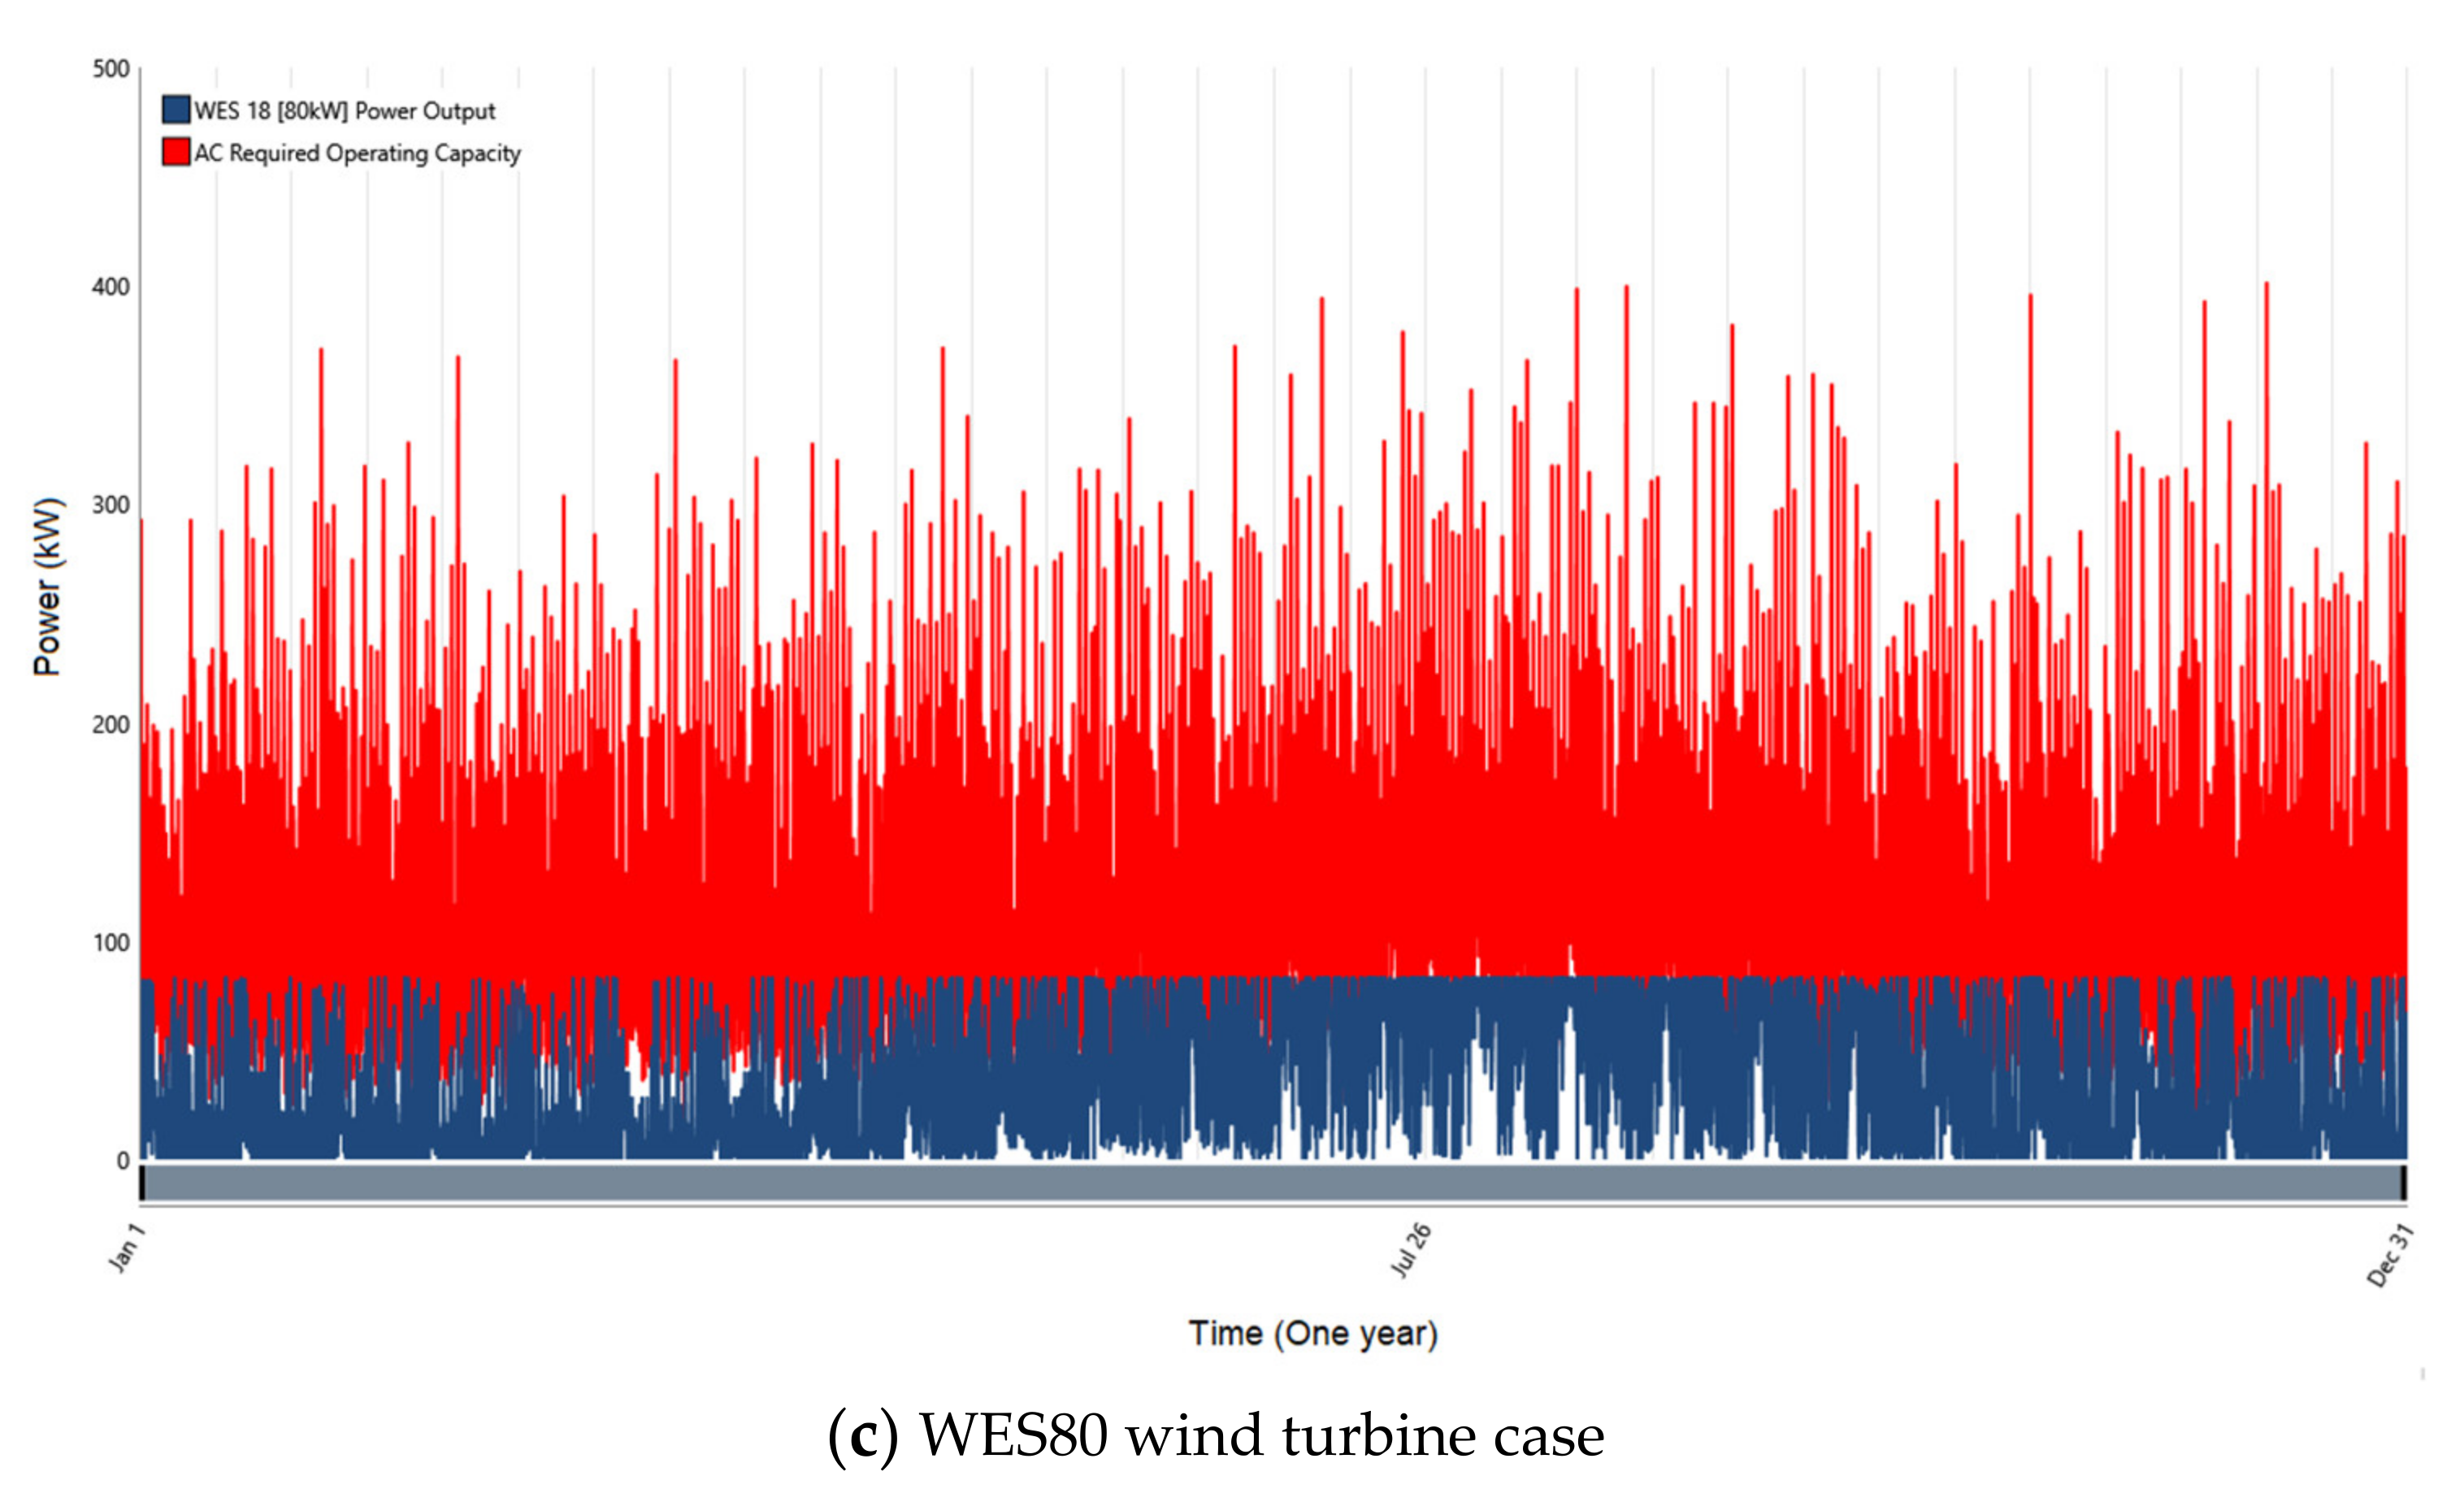
  • WES80, Wind Energy Solutions
Figure 7 presents the power curve of the selected wind farms based on the parameters acquired from the technical specifications offered by the manufacturers. The rated powers of FH-5000 and RX-20KH3 were 5 and 20 kW, respectively, which were measured at a speed of 10 m/s. For the turbine WES80, the rated power was 80 kW at a wind speed of 10 m/s.
As mentioned earlier, this study concentrates on small-scale farms (below 100 kW); thus, the wind farm with the FH-5000 model contains 18 units. In the model RX-20KH3, the farm is composed of four turbines, and for the model, WES80 constitutes only one turbine. A good wind speed (above 4 m/s) can be obtained at a height between 60 and 70 m in both locations. The vertical axis turbine proved its suitability in the high building owing to its shallow noise levels [48]. Therefore, the model FH-5000 can be installed at the high building’s rooftop at a height of 70 m, as presented in Figure 8. The height of the turbine’s hub for the model WES80 is at 70 m in Kudat and Putrajaya, being this height within the optimal range for wind turbines located in selected locations [8]. By contrast, the model RX-20KH3 is at a height of 30 m due to the mast specification that suits the turbine model, and the cost is less than that of the WES80 model.
To simply conclude the results of each model, only one turbine was considered for the implementation of the wind farm. Table 1 presents the financial details of each model, namely, estimation of the capital cost, operation, and maintenance cost (per year); replacement cost (cost of changing particular parts); and project lifetime. The cost of building the towers and other associated expenses was estimated by SS Karamunsing SDN BHD, a construction company specializing in the development of renewable sources, such as hydropower. The group of financial values presented in Table 1 reflects the power capacity associated with it, which allows the representation of various investment plans. From a financial standpoint, it is common to associate operating and maintenance costs with the investment made. For example, Kanyako and Janajreh [2] used a 2.5% estimate for small wind turbines (3.5 kW). Furthermore, other reports include a range for these figures: 1.5–3.0% of the overall investment [49]. According to this research, a value of 3% corresponds to the operation of an entire wind farm (not only the turbines). Then, this will be the value we used for the current project.

5. Results

5.1. Kudat Case

In the financial assessment of the wind farms in Kudat and Putrajaya, the RX-20KH3 turbine showed a significant result, but the WES80 turbine showed the worst financial result among the evaluated turbines, as presented in Table 2. The NPC of each case includes the estimated cost of power generated from the turbine plus power purchased from the grade minus the power sold to the grid. In comparison with the grid case where the load is totally connected to the national grid all the time, the bearing cost of the WES80 farm is ~50% of the grid cost in Kudat and 72% in Putrajaya, that of the FH-5000 farm is 90% of the grid cost, and the incurred cost of the WES80 farm is ~40% higher than the grid cost in Kudat and approximately 50% in Putrajaya.
The high demand for power at 6 to 8 am and from 6 to 11 pm impacts the purchased and sold energy, as presented in Figure 9, Figure 10 and Figure 11.The demand of the power supplied by the national grid is 423,460 kW/yr for the FH-5000 farm and 456,121 kW/yr for the WES80 farm, as presented in Figure 11a. Figure 12a, which both considered highly intensive compared with the RX-20KH3 farm scenario, in which the energy purchased from the national grid is 377,878 kW/yr.
The monthly average of power generation in all cases is presented in Figure 12. The RX-20KH3 farm achieved the highest production, with a monthly average of between 80 and 120 kW, as presented in Figure 13b, and power generation of 462,213 kW/yr, followed by the FH-5000 wind farm, with a power generation of 336,848 kW/yr and monthly average of around 80 kW, as presented in Figure 10c. By contrast, the WES80 farm had the lowest energy production, with a power generation of 281,696 kW/yr (Figure 12c). During the monsoon season in Kudat (May–September), the wind speed is higher than that in another season, influencing the power generation of the RX-20KH3 and WES80 farms but not affecting that of the FH-5000 farm due to the technical features of the turbine.
The electric power requirement for 1 year is presented in Figure 13. The penetration of wind energy varies across the models. In the FH-5000 model, the power requirement was covered by 44.3% from wind energy, and the WES80 model covered 38% of the load requirements. By contrast, the RX-20KH3 model exhibits the best performance by covering 55% of the demand requirements, having a high intensity during the monsoon season (May–September).

5.2. Putrajaya Case

The results in Putrajaya are different due to the wind speed variation. In the FH-5000 farm, the amount of the national grid’s purchasing power is 418,898 kW/yr, as presented in Figure 14a, demonstrating lower intensity compared with the other wind farms. The RX-20KH3 and WES80 farms consumed 461,300 and 528,476 kW/yr, respectively, as presented in Figure 15a and Figure 16a. Similar to Kudat, the high load of electricity at 6 to 8 am and from 6 to 11 pm impacts the purchasing and selling of energy, as presented in the figures below.
The FH-5000 wind farm produced the highest power generation of 333,556 kW/yr, followed by the RX-20KH3 farm, with a power generation of 311,617 kW/yr. By contrast, the WES80 farm had the lowest energy production, i.e., 180,240 kW/yr (see Figure 17). Unlike Kudat, the wind speed during the monsoon season in Putrajaya influences the power generation in all wind farms, including FH-5000.
The penetration of wind energy to the electric power demand for 1 year in Putrajaya is presented in Figure 18. The FH-5000 model penetrates the same amount as that in Kudat, i.e., 44.3%, and the RX-20KH3 model covered 40% of the load requirements. In contrast, the WES80 model exhibits the lowest renewable penetration by covering 26.3% of the demand requirements. Similar to the Kudat case, all the scenarios exhibit high intensity during the monsoon season.

6. Discussion

In the field of renewable energy projects, it is not difficult to find cases of non-viability. Overall, the results of power generation of wind turbines are in line with the other studies (see in [8]). The financial results obtained in this evaluation are not exceptional. For this purpose, the government and policy-makers also use multiple alternatives to fund these initiatives [50], namely, subsidies or soft loans. However, we analyze the financial results of the cases and use assumptions when needed.
The top choice is the model RX-20KH3, which provided the lowest NPC in the sites of Kudat and Putrajaya. Moreover, the NPC is lower than that of the base case, which makes this selection attractive for the investigation of renewable energy projects, which does not require government support. The second choice is the FH-5000 model in both sites, the NPC of which is almost the same in both locations and lower than that of the base case. For the WES80 model, the incurred cost is higher than that of the base case. It is important to define the actual cost incurred, which can be calculated as the distinction between the grid cost and the cost of the WES80 farm. Thus, the actual NPC is 82,222 USD in Kudat and 116,368 USD in Putrajaya. Given the total number of houses (220), the cost per family is prorated at 373 USD in Kudat and 528 USD in Putrajaya. Otherwise, based on the given number of individuals who will benefit from this initiative (~880), the governments could subside to support the implementation of a similar farm. There are precedents in Malaysia about subsidies for renewable energy projects, e.g., Green Income Tax Exemption—GITE (Services), Green Investment Tax Allowance—GITA (Project), and loans (lenders, home equity) [51]. The government’s soft loan, in monthly fees, is considered to be paid in 5 years. A monthly fee of ~7.3 USD/family is the cost of accessing and being part of this project. This result is promising and could be improved.

7. Conclusions

This study demonstrates the viability of small-scale wind turbines installed at high elevations to generate an adequate power level. Specifically, the evaluation of a wind farm has been conducted in two sites. To improve the assessment, three distinct wind turbine models were included in the implementation separately. Because wind speeds improve at higher hub heights and considering the high cost of implementing tall masts (i.e., up to 70 m), we proposed the installation of micro-scale vertical turbines (e.g., FH-5000) at the rooftop of tall buildings (e.g., 70 m and higher) and small-scale turbines (e.g., RX-20KH3) with the built-in mast (30 m), which is less costly. Moreover, a small-scale turbine (WES80) hub of 70 m with a strong mast designed for small- and medium-scale wind turbines was evaluated. The findings indicate that the RX-20KH3 model forms the best scenario in both locations, and the costs incurred by the FH-5000 and RX-20KH3 farms are proportionate for a renewable project. In addition, the WES80 farm can be suitable with assistance from the government.
This study’s limitation is that the obtained data are from the MMD stations implemented at locations with low wind speed dedicated for airports, not for energy purposes. The other dataset is from the NASA satellite, which can assume approximate results but not precise. Thus, further studies are recommended to collect the data from potential wind energy sites and from the rooftop of high buildings to confirm the findings of this study. Note that this study was only intended to take financial viability into account, and other economic and social factors have not been evaluated.

Author Contributions

Conceptualization, S.K.T., A.A.A., and G.A.; methodology, G.A.; software, G.A.; validation, C.W.L., A.A.A., and S.K.T.; formal analysis, Y.B.; investigation, M.K.; resources, A.A.A. and C.W.L.; data curation, G.A.; writing—original draft preparation, G.A. and Y.B.; writing—review and editing, A.A.A., C.W.L., and S.K.T.; visualization, G.A. and M.K.; supervision, A.A.A.; project administration, S.K.T.; funding acquisition, C.W.L. and S.K.T. All authors have read and agreed to the published version of the manuscript.

Funding

This research was funded by Universiti Tenaga Nasional (UNITEN).

Institutional Review Board Statement

Not applicable.

Informed Consent Statement

Not applicable.

Data Availability Statement

Not applicable.

Acknowledgments

The authors would like to acknowledge the Bold Research Grant provided by Universiti Tenaga Nasional (UNITEN), Project No. (RJ010517844/072) and publication support through J510050002-BOLDREFRESH2025-CENTRE OF EXCELLENCE from the iRMC of Universiti Tenaga Nasional.

Conflicts of Interest

The authors declare no conflict of interest. The funders had no role in the design of the study; in the collection, analyses, or interpretation of data; in the writing of the manuscript; or in the decision to publish the results.

References

  1. Gielen, D.; Boshell, F.; Saygin, D.; Bazilian, M.D.; Wagner, N.; Gorini, R. The role of renewable energy in the global energy transformation. Energy Strategy Rev. 2019, 24, 38–50. [Google Scholar] [CrossRef]
  2. IEA. Renewables Information: Overview. 2020. Available online: https://www.iea.org/reports/renewables-information-overview (accessed on 24 February 2021).
  3. Liu, X.; Zhang, S.; Bae, J. Renewable energy, trade, and economic growth in the Asia-Pacific region. Energy Sources Part B Econ. Plan. Policy 2018, 13, 96–102. [Google Scholar] [CrossRef]
  4. Noman, F.M.; Alkawsi, G.A.; Abbas, D.; Alkahtani, A.A.; Tiong, S.K.; Ekanayake, J. Comprehensive Review of Wind Energy in Malaysia: Past, Present, and Future Research Trends. IEEE Access 2020, 8, 124526–124543. [Google Scholar] [CrossRef]
  5. Abdullah, W.S.W.; Osman, M.; Kadir, A.; Abidin, M.Z.; Verayiah, R. The Potential and Status of Renewable Energy Development in Malaysia. Energies 2019, 12, 2437. [Google Scholar] [CrossRef] [Green Version]
  6. Haseeb, M.; Abidin, I.S.Z.; Hye, Q.M.A.; Hartani, N.H. The impact of renewable energy on economic well-being of Malaysia: Fresh evidence from auto regressive distributed lag bound testing approach. Int. J. Energy Econ. Policy 2019, 9, 269. [Google Scholar]
  7. Masseran, N.; Razali, A.M.; Ibrahim, K.; Wan Zin, W.Z. Evaluating the wind speed persistence for several wind stations in Peninsular Malaysia. Energy 2012, 37, 649–656. [Google Scholar] [CrossRef]
  8. Albani, A.; Ibrahim, M. Wind energy potential and power law indexes assessment for selected near-coastal sites in Malaysia. Energies 2017, 10, 307. [Google Scholar] [CrossRef] [Green Version]
  9. Ibrahim, M.Z.; Albani, A. The potential of wind energy in Malaysian renewable energy policy: Case study in Kudat, Sabah. Energy Environ. 2014, 25, 881–898. [Google Scholar] [CrossRef]
  10. Albani, A.; Ibrahim, M.Z.; Taib, C.M.I.C.; Azlina, A.A. The optimal generation cost-based tariff rates for onshore wind energy in Malaysia. Energies 2017, 10, 1114. [Google Scholar] [CrossRef] [Green Version]
  11. Akorede, M.F.; Mohd Rashid, M.I.; Sulaiman, M.H.; Mohamed, N.B.; Ab Ghani, S.B. Appraising the viability of wind energy conversion system in the Peninsular Malaysia. Energy Convers. Manag. 2013, 76, 801–810. [Google Scholar] [CrossRef] [Green Version]
  12. Izadyar, N.; Ong, H.C.; Chong, W.T.; Mojumder, J.C.; Leong, K.Y. Investigation of potential hybrid renewable energy at various rural areas in Malaysia. J. Clean. Prod. 2016, 139, 61–73. [Google Scholar] [CrossRef]
  13. Muda, W.M.W.; Salleh, N.A.S. Feasibility Study of Renewable Energy System for an Island in Terengganu. IOP Conf. Ser. Mater. Sci. Eng. 2018, 366, 012002. [Google Scholar] [CrossRef]
  14. Wahid, S.S.A.; Arief, Y.Z.; Mubarakah, N. Optimization of Hybrid Renewable Energy in Malaysia Remote Rural Area Using HOMER Software. In Proceedings of the 2019 3rd International Conference on Electrical, Telecommunication and Computer Engineering (ELTICOM), Medan, Indonesia, 16–17 September 2019; pp. 111–115. [Google Scholar]
  15. Shezan, S.A.; Julai, S.; Kibria, M.A.; Ullah, K.R.; Saidur, R.; Chong, W.T.; Akikur, R.K. Performance analysis of an off-grid wind-PV (photovoltaic)-diesel-battery hybrid energy system feasible for remote areas. J. Clean. Prod. 2016, 125, 121–132. [Google Scholar] [CrossRef]
  16. Hossain, M.; Mekhilef, S.; Olatomiwa, L. Performance evaluation of a stand-alone PV-wind-diesel-battery hybrid system feasible for a large resort center in South China Sea, Malaysia. Sustain. Cities Soc. 2017, 28, 358–366. [Google Scholar] [CrossRef]
  17. Muda, W.M.W.; Umar, R. Assessment of economic feasibility for grid-connected renewable energy system for a household application in terengganu. Int. J. Energy Prod. Manag. 2016, 1, 223–232. [Google Scholar] [CrossRef] [Green Version]
  18. Ngan, M.S.; Tan, C.W. Assessment of economic viability for PV/wind/diesel hybrid energy system in southern Peninsular Malaysia. Renew. Sustain. Energy Rev. 2012, 16, 634–647. [Google Scholar] [CrossRef]
  19. Becerra, M.; Moran, J.; Jerez, A.; Cepeda, F.; Valenzuela, M. Wind energy potential in Chile: Assessment of a small scale wind farm for residential clients. Energy Convers. Manag. 2017, 140, 71–90. [Google Scholar] [CrossRef]
  20. Basrawi, F.; Ismail, I.; Ibrahim, T.K.; Idris, D.M.N.D.; Anuar, S. A study on the power generation potential of mini wind turbine in east coast of Peninsular Malaysia. In AIP Conference Proceedings; AIP Publishing: College Park, MD, USA, 2017; Volume 1826, p. 20023. [Google Scholar]
  21. NASA. Surface Meteorology and Solar Energy. Sol. Energy. Available online: https://asdc.larc.nasa.gov/ (accessed on 7 December 2020).
  22. El Alimi, S.; Maatallah, T.; Nasrallah, S. Ben Break-even analysis and optimization of a stand-alone hybrid system with battery storage for residential load consumption—A case study. Renew. Sustain. Energy Rev. 2014, 37, 408–423. [Google Scholar] [CrossRef]
  23. Berhad, T.N. Electricity Supply Application Handbook; Distrib. Div. TNB: Kuala Lumpur, Malaysia, 2011. [Google Scholar]
  24. Alkawsi, G.A.; Ali, N.; Baashar, Y. An Empirical Study of the Acceptance of IoT-Based Smart Meter in Malaysia: The Effect of Electricity-Saving Knowledge and Environmental Awareness. IEEE Access 2020, 8, 42794–42804. [Google Scholar] [CrossRef]
  25. Alkawsi, G.A.; Ali, N.; Mustafa, A.S.; Baashar, Y.; Alhussian, H.; Alkahtani, A.; Tiong, S.K.; Ekanayake, J. A hybrid SEM-neural network method for identifying acceptance factors of the smart meters in Malaysia: Challenges perspective. Alexandria Eng. J. 2020, 60, 227–240. [Google Scholar] [CrossRef]
  26. Gamal Abdulnaser Alkawsi, N.B.A. A systematic review of individuals’ acceptance of IoT-based technologies. Int. J. Eng. Technol. 2018, 7, 136–142. [Google Scholar] [CrossRef]
  27. Alkawsi, G.A.; Ali, N.; Alghushami, A. Toward understanding individuals’acceptance of internet of things-based services: Developing an instrument to measure the acceptance of smart meters. J. Theor. Appl. Inf. Technol. 2018, 96, 4265. [Google Scholar]
  28. Alkawsi, G.; Ali, N.; Baashar, Y. The Moderating Role of Personal Innovativeness and Users Experience in Accepting the Smart Meter Technology. Appl. Sci. 2021, 11, 3297. [Google Scholar] [CrossRef]
  29. Fahmi, M.I.; Rajkumar, R.; Arelhi, R.; Isa, D. Solar PV System for Off-Grid Electrification in Rural Area; UM Power Energy Dedicated Advanced Centre (UMPEDAC): Kuala Lumpur, Malaysia, 2014. [Google Scholar]
  30. Fahmi, M.I.; Rajkumar, R.; Chong, L.W.; Isa, D.; Khan, M.S.A. Modern Load Profile for Standalone PV Rural Household in Malaysia; IEEE: Kuala Lumpur, Malaysia, 2018. [Google Scholar]
  31. Singh, R.K.; Ahmed, M.R. Blade design and performance testing of a small wind turbine rotor for low wind speed applications. Renew. Energy 2013, 50, 812–819. [Google Scholar] [CrossRef]
  32. Tariq, W.; Othman, M.L.; Wahab, N.I.A.; Ebrahim, M. A Review on ESCO’s Challenges and Project Management as a Solving Tool. Indones. J. Electr. Eng. Comput. Sci. 2018, 12, 269–274. [Google Scholar] [CrossRef]
  33. Murakoshi, C. Current state of ESCO activities in Asia: ESCO industry development programs and future tasks in Asian countries. Energy 2009, 2009, 311–322. [Google Scholar]
  34. Hwang, I.D.G.H.; Saar, C.C.; Chen, G.K. Energy Performance Contract (EPC) in Malaysia and Other Countries. Professional Services (IPM). Available online: https://ipm.my/energy-performance-contract-epc-in-malaysia-and-other-countries/#:~:text=EnergyPerformanceContract(EPC)inMalaysiaandOtherCountries,-23Mar%2C2019&text=TheconceptoftheEPC,isbornebytheESCO (accessed on 10 November 2020).
  35. Bertoldi, P.; Rezessy, S.; Vine, E. Energy service companies in European countries: Current status and a strategy to foster their development. Energy Policy 2006, 34, 1818–1832. [Google Scholar] [CrossRef]
  36. Christoforidis, G.C.; Panapakidis, I.P.; Papadopoulos, T.A.; Papagiannis, G.K.; Koumparou, I.; Hadjipanayi, M.; Georghiou, G.E. A model for the assessment of different net-metering policies. Energies 2016, 9, 262. [Google Scholar] [CrossRef]
  37. Góralczyk, M. Life-cycle assessment in the renewable energy sector. Appl. Energy 2003, 75, 205–211. [Google Scholar] [CrossRef]
  38. Guezuraga, B.; Zauner, R.; Pölz, W. Life cycle assessment of two different 2 MW class wind turbines. Renew. Energy 2012, 37, 37–44. [Google Scholar] [CrossRef]
  39. Energy Futures Prices. Available online: https://www.investing.com (accessed on 25 July 2020).
  40. Ibrahim, M.Z.; Hwang, Y.K.; Ismail, M.; Albani, A. Spatial analysis of wind potential for Malaysia. Int. J. Renew. Energy Res. 2015, 5, 201–209. [Google Scholar]
  41. Rosly, N.; Ohya, Y.; Uchida, T. Micro Sitting and Wind Energy Potential in Mersing, Malaysia using RIAM-Compact. In Proceedings of the Asian Conference on Sustainability, Energy and the Environment Proceedings, Osaka, Japan, 3–6 May 2012. [Google Scholar]
  42. Sanusi, N.; Zaharim, A.; Mat, S. Wind energy potential: A case study of Mersing, Malaysia. ARPN J. Eng. Appl. Sci. 2013, 11, 7712–7716. [Google Scholar]
  43. Masseran, N. Evaluating wind power density models and their statistical properties. Energy 2015, 84, 533–541. [Google Scholar] [CrossRef]
  44. Oh, K.-Y.; Kim, J.-Y.; Lee, J.-S.; Ryu, K.-W. Wind resource assessment around Korean Peninsula for feasibility study on 100 MW class offshore wind farm. Renew. Energy 2012, 42, 217–226. [Google Scholar] [CrossRef]
  45. Dallatu Abbas, U.; Tiong, S.K.; Alkahtani, A.A.; Chen, C.P.; Alkawsi, G.; Ekanayake, J. Power Curve Evaluation of Micro-Scale Turbines for Harvesting Wind Energy in Malaysia. Appl. Math. Inf. Sci. 2021, 15, 59–71. [Google Scholar]
  46. Kadir, M.R.A.; Lee, W.P.; Jaafar, M.S.; Sapuan, S.M.; Ali, A.A.A. Construction performance comparison between conventional and industrialised building systems in Malaysia. Struct. Surv. 2006, 24, 412–424. [Google Scholar] [CrossRef]
  47. Energy Commission. Briefing on Electricity Tariff Review in Peninsular Malaysia Incentive-Based Regulation Regulatory Period 2: 2018–2020; Rep. RP1 Plan. RP2; Energy Commission: Putrajaya, Malaysia, 2018.
  48. Balduzzi, F.; Bianchini, A.; Carnevale, E.A.; Ferrari, L.; Magnani, S. Feasibility analysis of a Darrieus vertical-axis wind turbine installation in the rooftop of a building. Appl. Energy 2012, 97, 921–929. [Google Scholar] [CrossRef]
  49. Sunderland, K.M.; Narayana, M.; Putrus, G.; Conlon, M.F.; McDonald, S. The cost of energy associated with micro wind generation: International case studies of rural and urban installations. Energy 2016, 109, 818–829. [Google Scholar] [CrossRef]
  50. Council, Small Wind Certification. Available online: https://smallwindcertification.org/ (accessed on 13 February 2021).
  51. Solarvest. Solar Panel Loans and Incentives for Homeowners in Malaysia. Available online: https://solarvest.my/2019/11/15/solar-panel-loans-incentives-homeowners-malaysia/ (accessed on 13 February 2021).
Figure 1. Wind turbine lifecycle.
Energies 14 03391 g001
Figure 2. Historical price of carbon emission [39].
Energies 14 03391 g002
Figure 3. Malaysian onshore wind power density map at 10 m height. Reprinted from ref. [40].
Energies 14 03391 g003
Figure 4. Map of Malaysia with the selected locations.
Energies 14 03391 g004
Figure 5. Average of wind speed profile in the selected sites.
Energies 14 03391 g005
Figure 6. Load curve scaled to 220 households.
Energies 14 03391 g006
Figure 7. Power curve of the selected wind turbines.
Energies 14 03391 g007
Figure 8. Roof mount towers.
Energies 14 03391 g008
Figure 9. Kudat, FH-5000 wind turbine case.
Energies 14 03391 g009
Figure 10. Kudat, RX-20KH3 wind turbine case.
Energies 14 03391 g010
Figure 11. Kudat, WES80 wind turbine case.
Energies 14 03391 g011
Figure 12. Monthly average of electric power generation in Kudat.
Energies 14 03391 g012
Figure 13. Yearly required power and wind farm penetration in Kudat.
Energies 14 03391 g013aEnergies 14 03391 g013b
Figure 14. Putrajaya, FH-5000 wind turbine case.
Energies 14 03391 g014
Figure 15. Putrajaya, RX-20KH3 wind turbine case.
Energies 14 03391 g015
Figure 16. Putrajaya, WES80 wind turbine case.
Energies 14 03391 g016
Figure 17. Monthly average of electric power generation in Kudat.
Energies 14 03391 g017
Figure 18. Yearly required power and wind farm penetration in Putrajaya.
Energies 14 03391 g018aEnergies 14 03391 g018b
Table 1. Financial details of selected wind turbines.
ModelFH-5000RX-20KH3WES80
Capital (USD)7237 17,073190,243
Operation & Maintenance (USD/Year)2175125707
Replacement (USD)521214,63448,780
Lifetime (Year)202020
Table 2. Net present cost for each evaluated case.
LocationKudatPutrajaya
Grid (USD)259,241259,241
FH-5000 (USD)225,973227,195
RX-20KH3 (USD)130,283186,166
WES80 (USD)341,463375,609
Publisher’s Note: MDPI stays neutral with regard to jurisdictional claims in published maps and institutional affiliations.

