
Comparison of Advanced Charge Strategies for Modular Cascaded Battery Chargers


Abstract
1. Introduction
2. Battery SoC and SoH Estimation Techniques
2.1. Battery Charge Related Parameters Definitions
- The Rated Capacity consists of the capacity at the rated voltage informed by the manufacturer.
- A fully charged battery has the maximal releasable capacity (), which can be different from the rated capacity. These differences can be due to deviations in the manufacturing scheme or due to degradation process.
2.2. State of Charge (SoC) Estimation
2.3. State of Health (SoH) Estimation
3. Control Strategies for Battery Chargers
- Level 1 (primary control): the primary control level ensures that each unit is charged and discharged accordingly to its particularities. Such control level must also perform the basic and specific functions, like current and voltage control loops, as well as automatic health evaluation.
- Level 2 (secondary control): the secondary level exploits the battery units through coordinated control. Such a control level must also ensure that the electrical levels in the bank are within the required values. It can be devised when considering communication-based functions, or can be implemented in a decentralized fashion using consensus protocol.
- Level 3 (tertiary control): this energy-production level controls the power flow between the modular units and the central charger, which, in turn, goes to the grid. If this control level is devised in a centralized controller, it can also gather external information, like energy price, local system operator signals, etc, in order to maximize the overall system performance.
3.1. Adapted SoC Strategy
3.2. SoH Strategy
4. Materials and Methods
4.1. Battery Lifetime Modeling
- is the number of equivalent cycles
- is the cycle depth of discharge
- is the discharge current
- is the charge current
- H,, and are constants determined experimentally by the mathworks team for a specific battery type and age.
4.2. Battery Bank Application
- location: the site is located in the School of Engineering at Federal University of Minas Gerais (UFMG);
- 19°52′10.81′′ S 43°57′42.01′′ W. Altitude 808 m;
- total peak power: 37.2 kW;
- nominal peak power: 36.0 kW;
- expected energy delivered to the grid: 53.847 kWh/year;
- total area: 439 m2, and area covered by PV modules = 257 m2;
- number of PV modules: 154; and,
- each PV module peak power: 245 W.
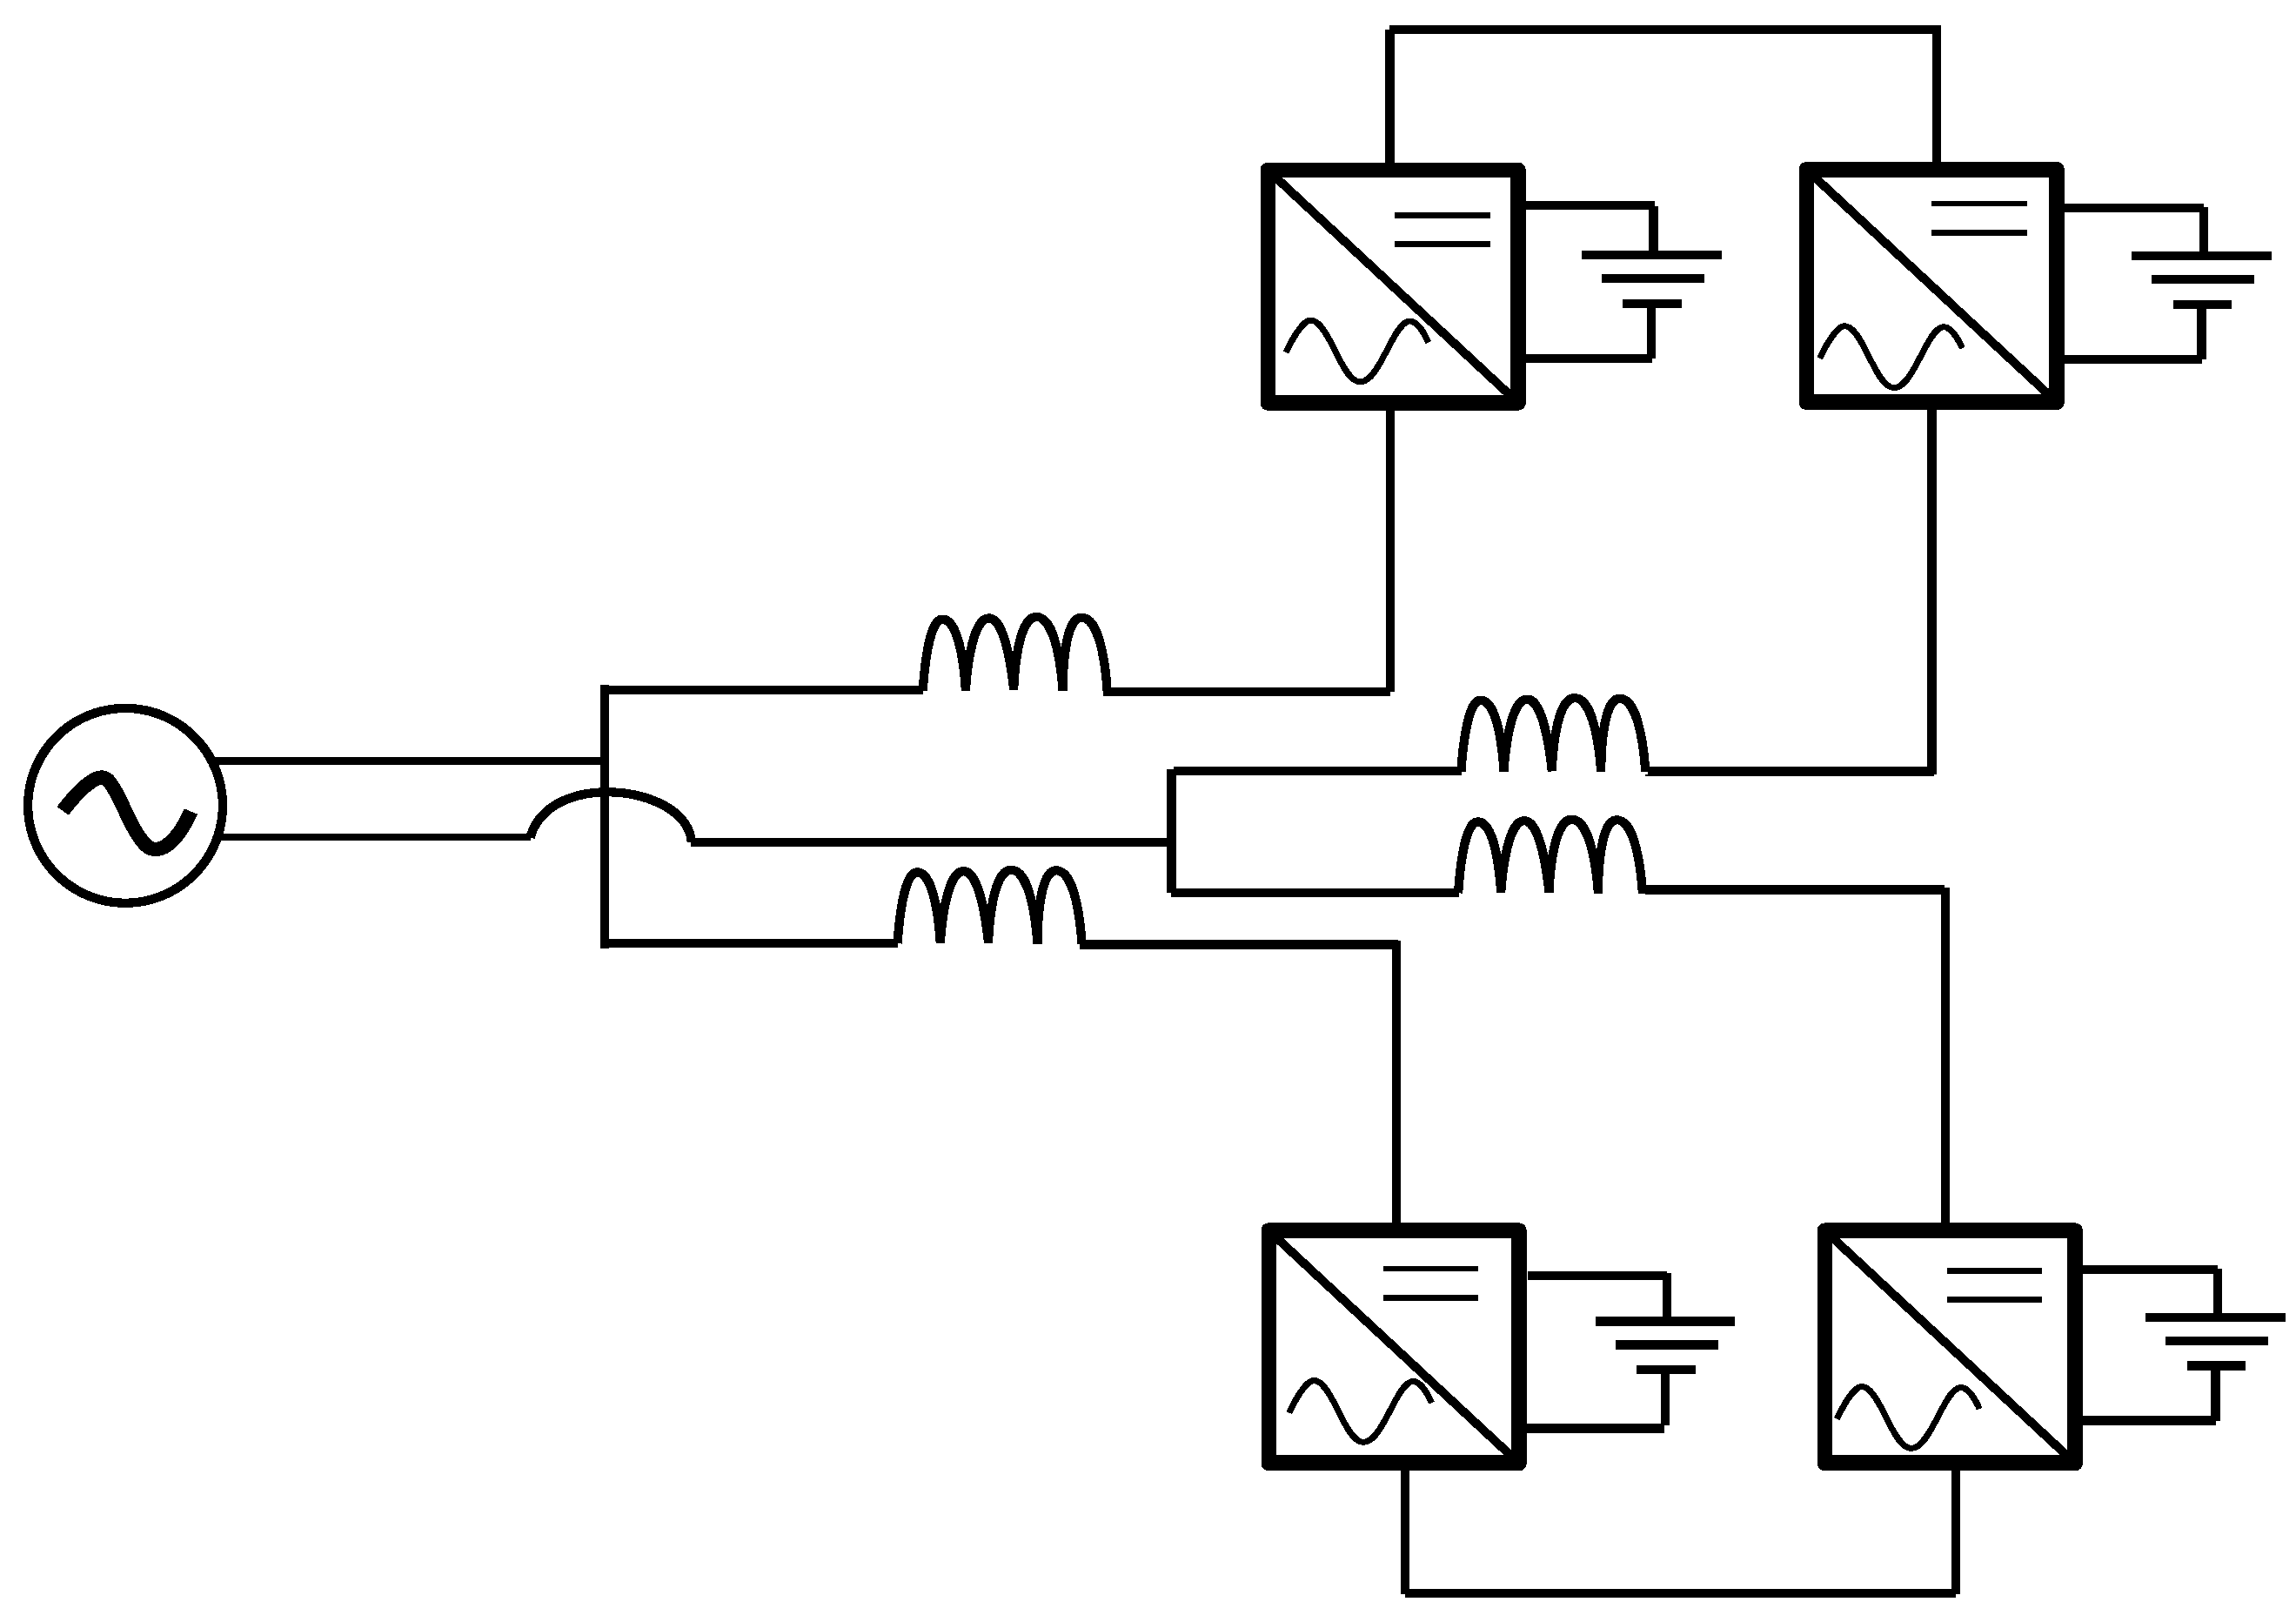
4.3. Modular Charger Model
5. Simulation Results
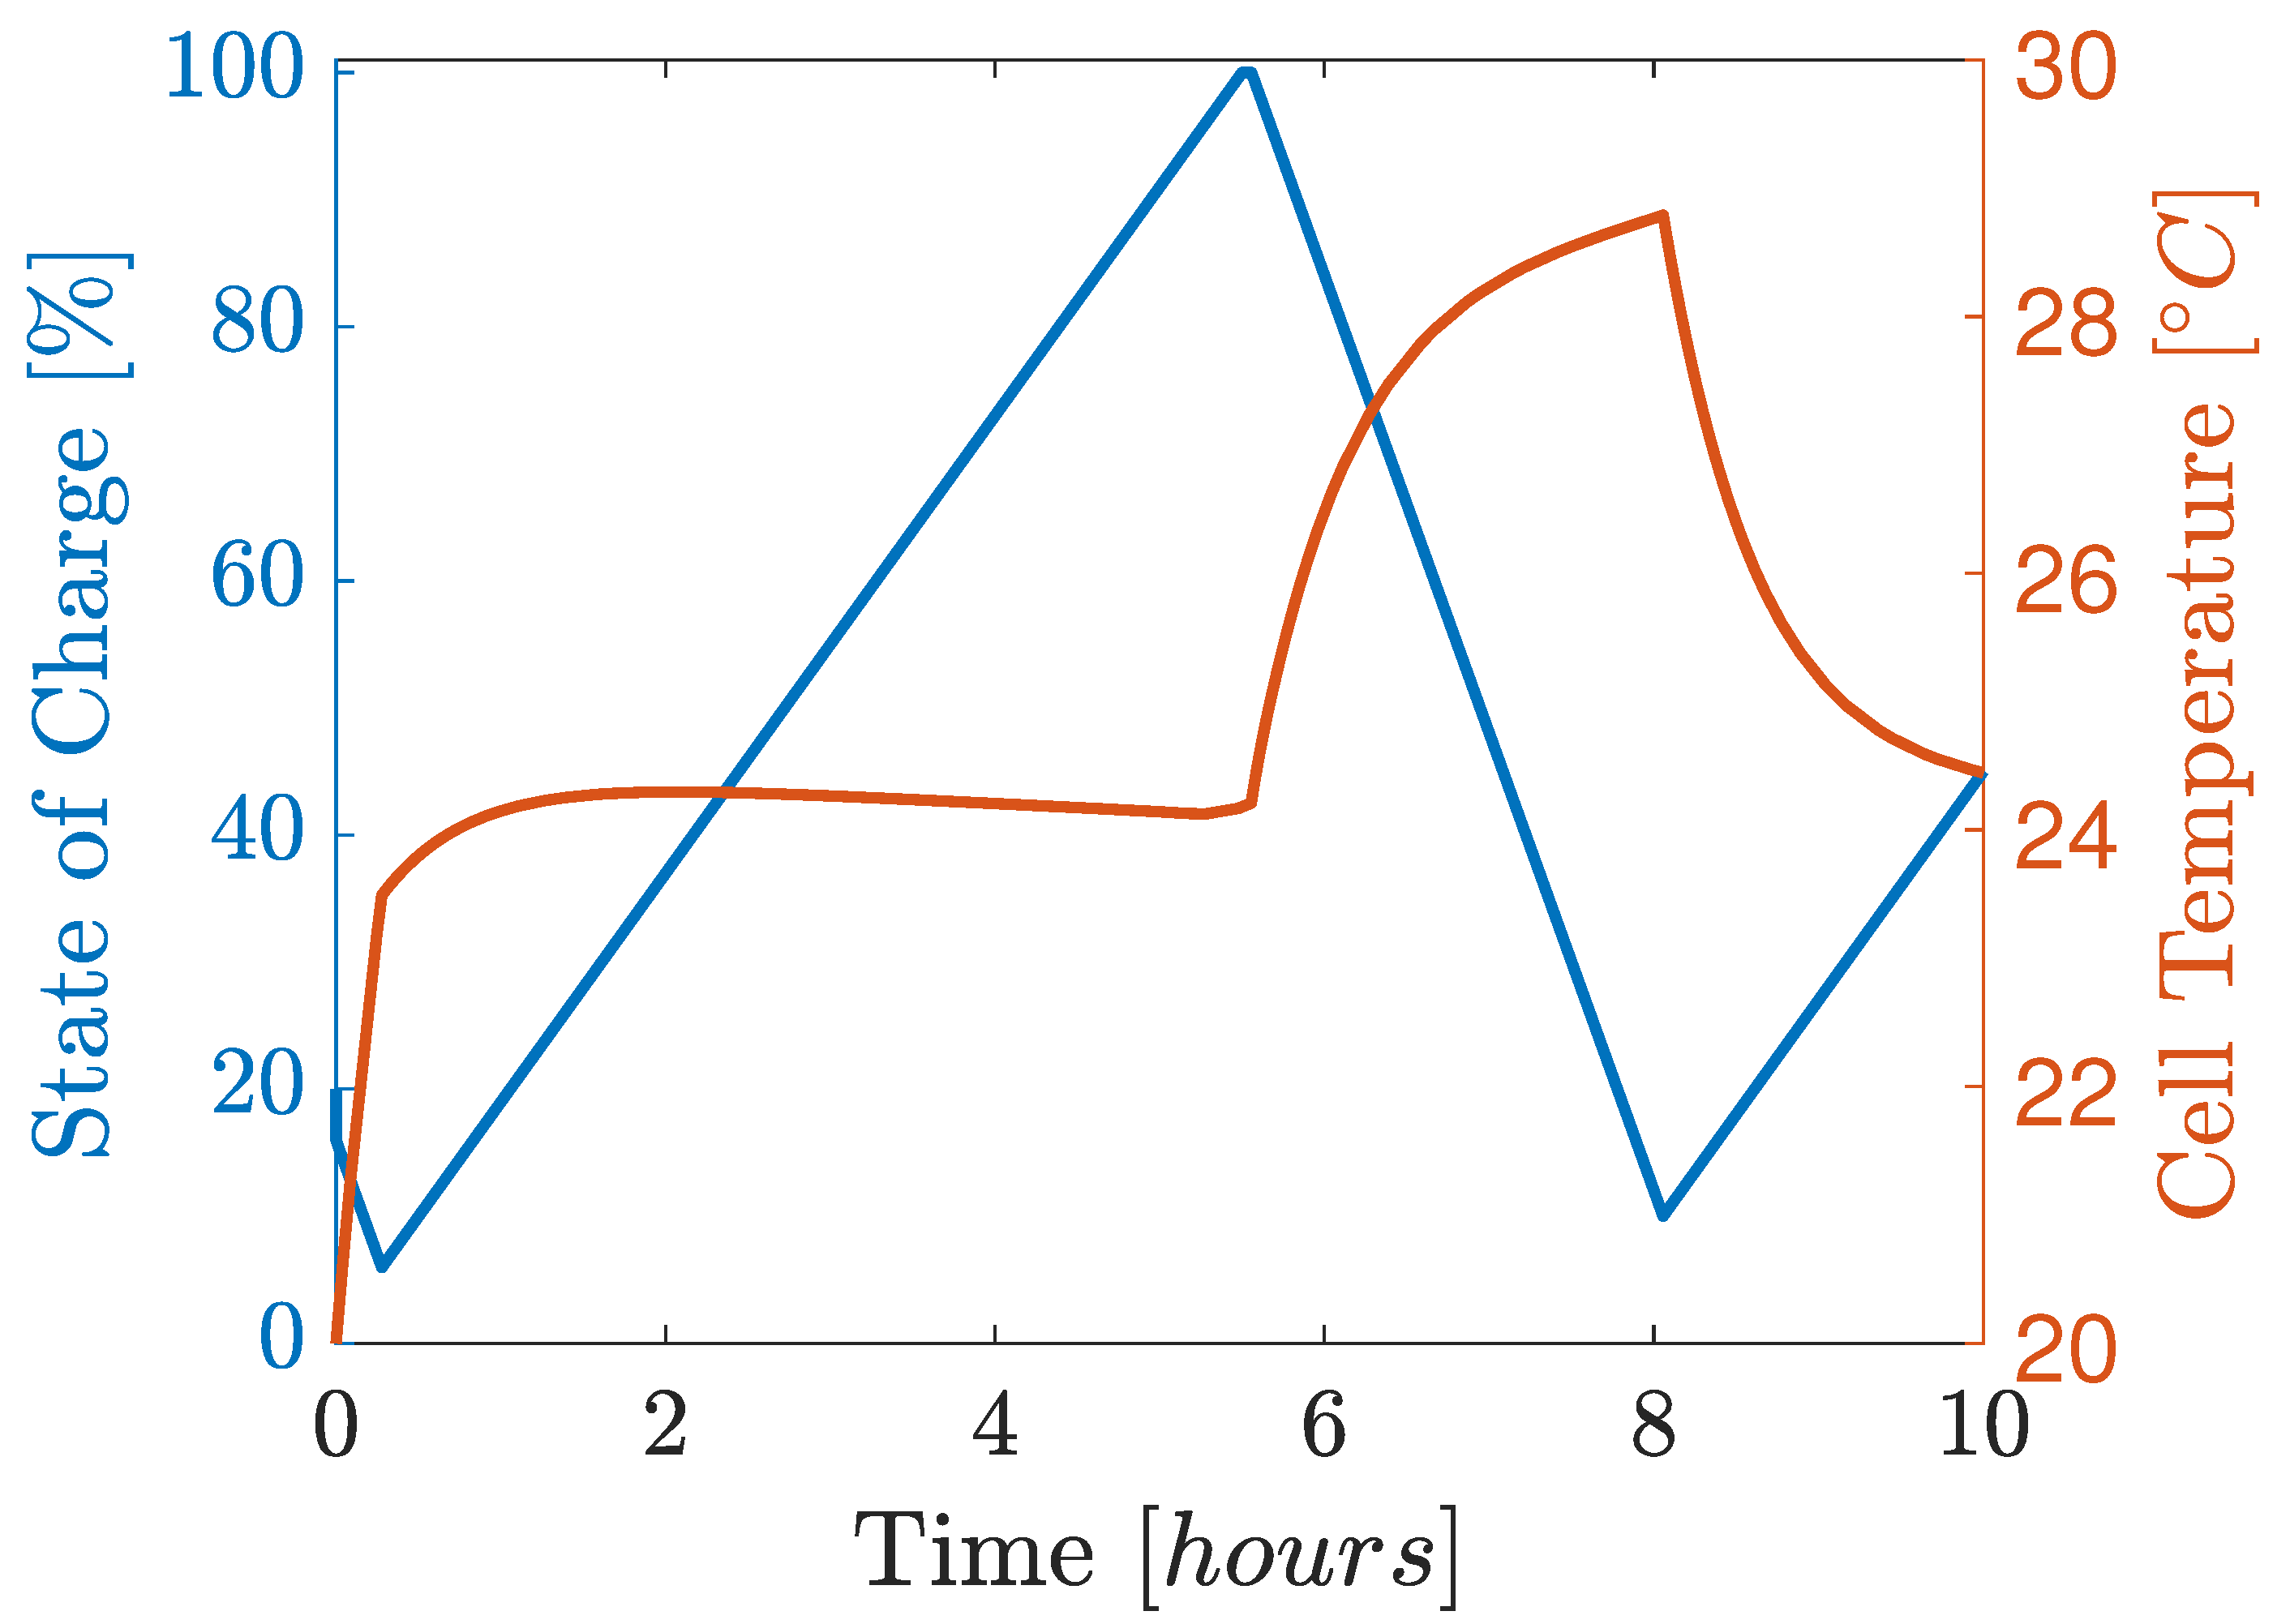
5.1. Charge/Discharge Profile
5.2. Effect on Gain k
5.3. Effect of the Estimation of SoH and SoC
5.3.1. Adapted SoC
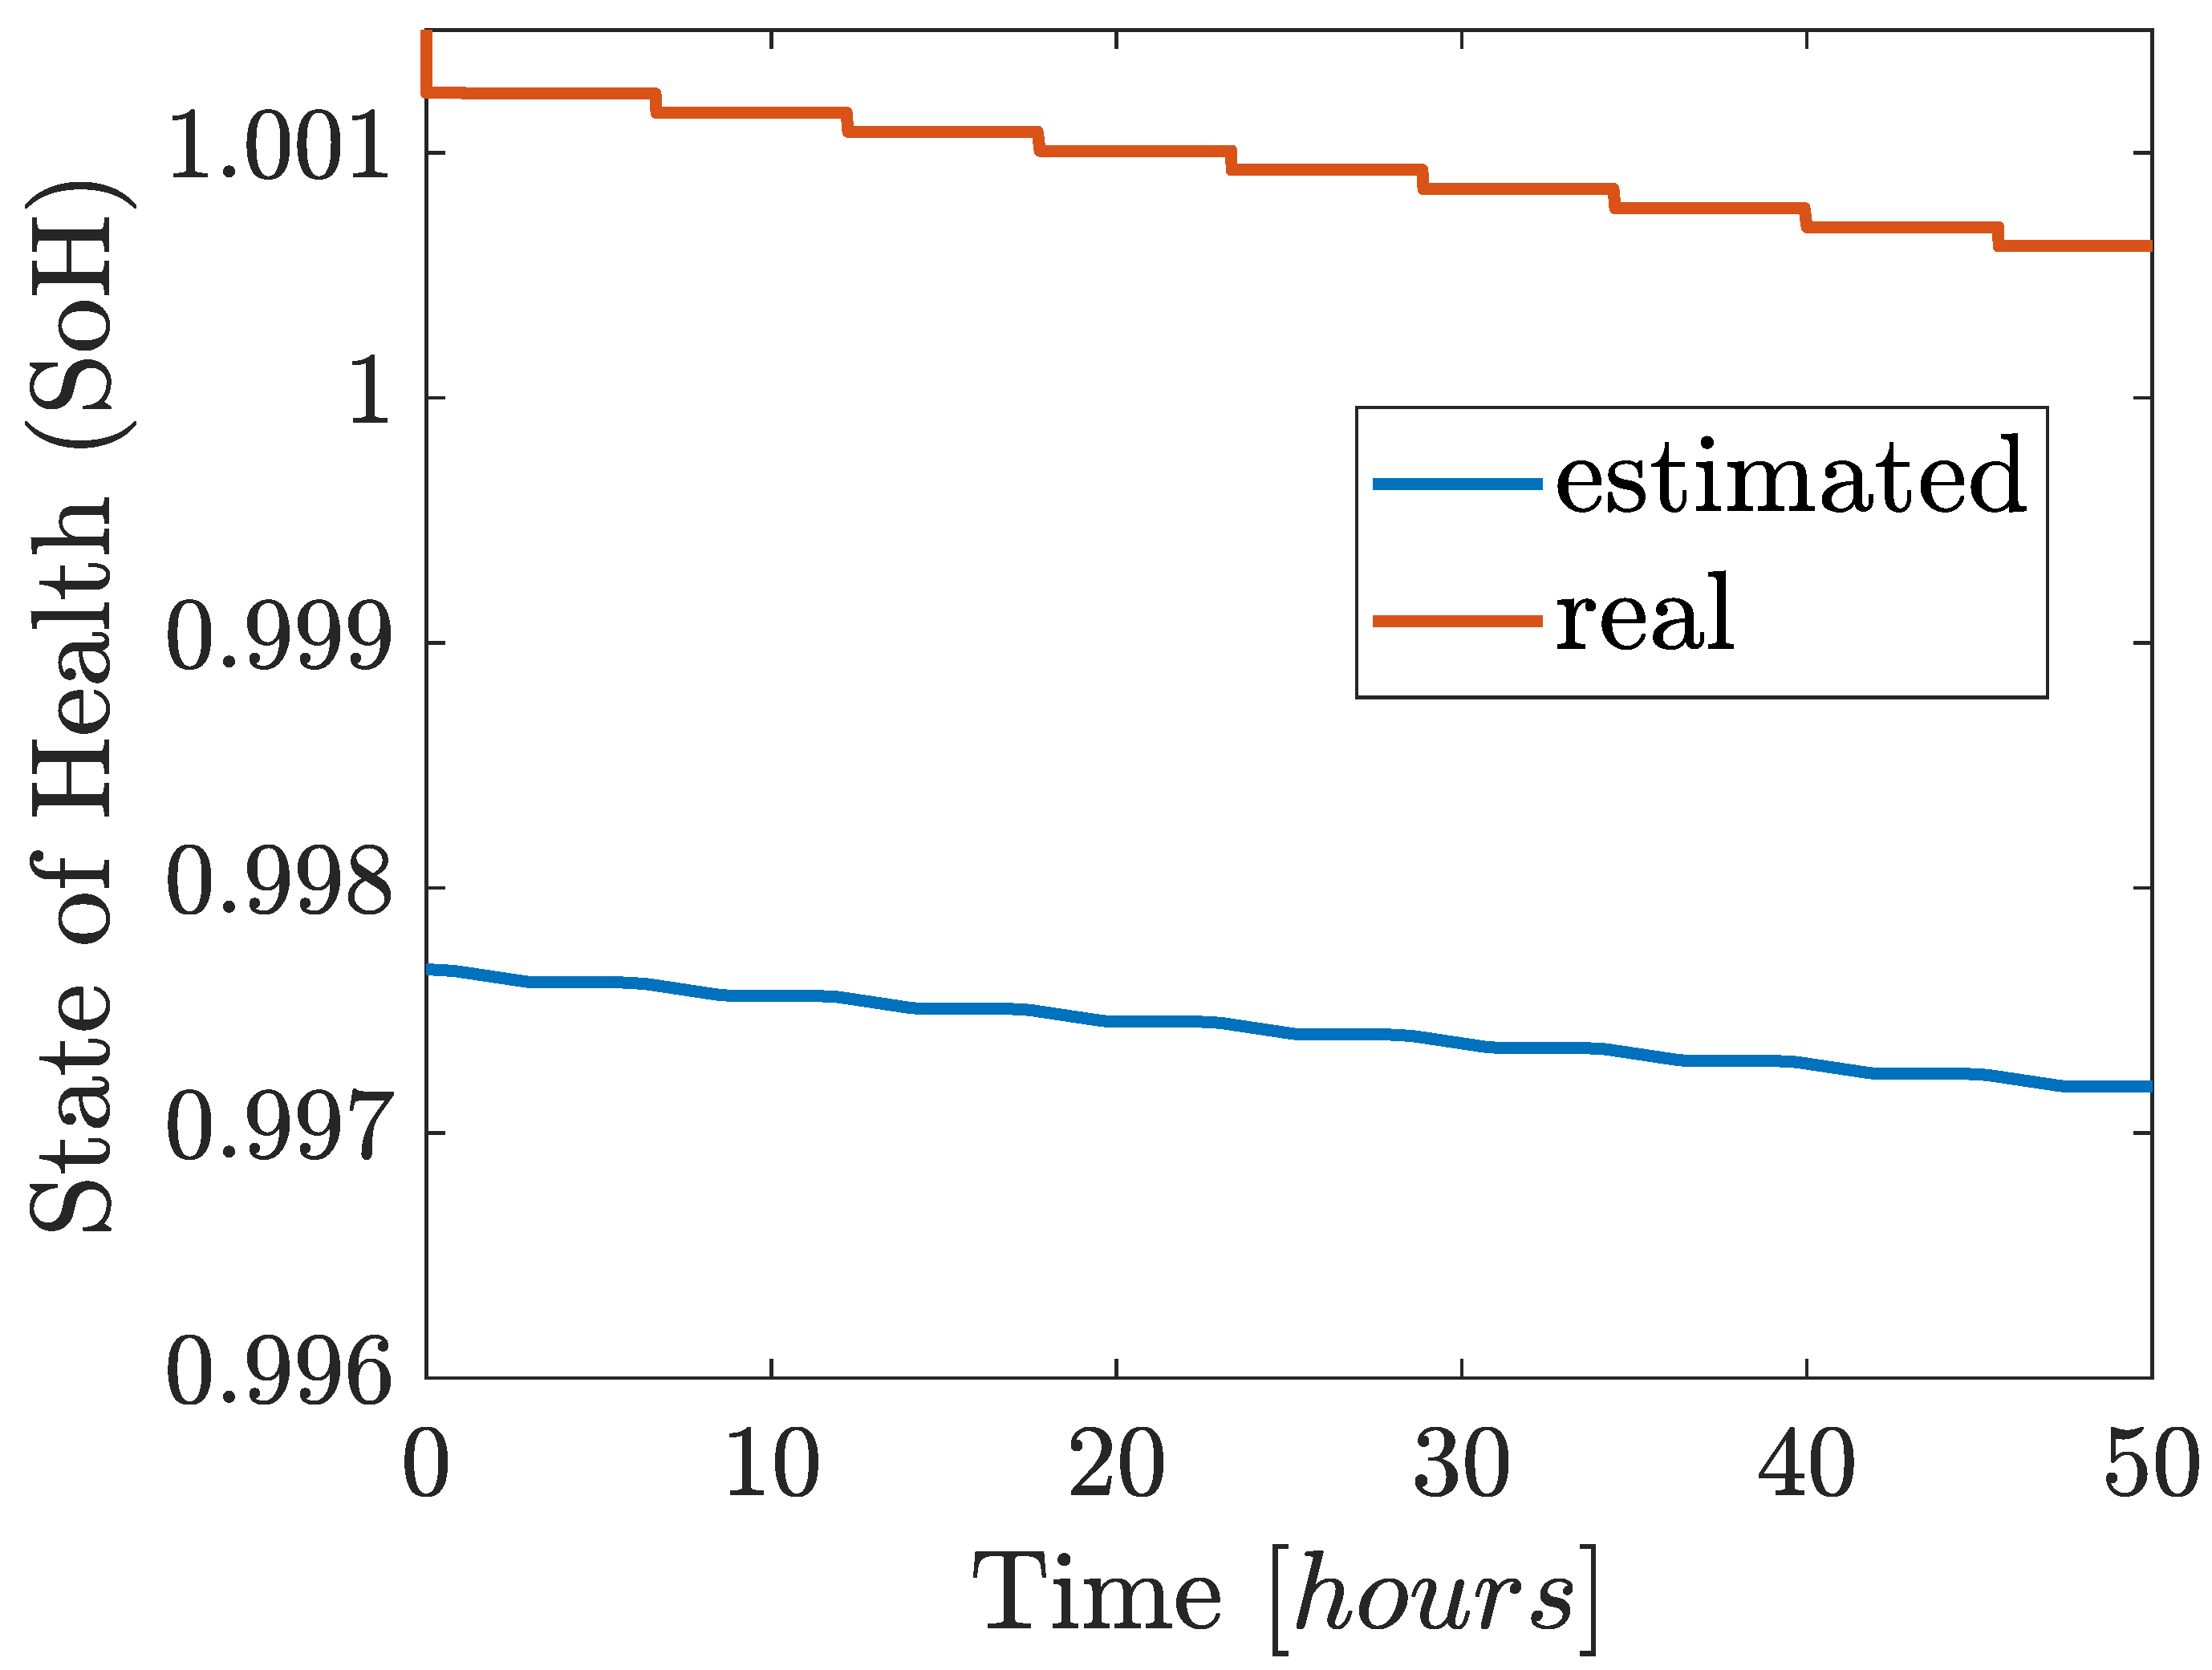
5.3.2. SoH
5.4. Lifetime Analysis
- New battery bank with batteries of the same technology.
- MidLife battery bank with batteries of the same technology.
- MidLife battery bank with one changed battery of different technology and new.
5.4.1. Case 1: New Bank
5.4.2. Case 2: Mid-Life Bank
5.4.3. Case 3: Mid-Life Bank with Different Technology
5.5. Discussion
5.5.1. Capacity Fade
5.5.2. Energy Throughput
6. Conclusions
Author Contributions
Funding
Conflicts of Interest
Abbreviations
| BESS | Battery Energy Storage System |
| DoD | Depth of Discharge |
| EV | Electric Vehicle |
| Li-ion | Lithium-ion battery |
| LiCoO2 | Lithium-ion Cobalt dioxide battery |
| LiNiO2 | Lithium-ion Nickel dioxide battery |
| MCC | Modular Cascaded Converter |
| MMC | Modular Multilevel Converter |
| PCS | Power Conditioning System |
| PV | Photovoltaic |
| SoA | Safe Operation Area |
| SoC | State of Charge |
| SoH | State of Health |
References
- International Energy Agency. World Energy Outlook 2018; Technical Report; IEA: Paris, France, 2018. [Google Scholar]
- Ferreira, H.L.; Garde, R.; Fulli, G.; Kling, W.; Lopes, J.P. Characterisation of electrical energy storage technologies. Energy 2013, 53, 288–298. [Google Scholar] [CrossRef]
- Liang, M.; Liu, Y.; Xiao, B.; Yang, S.; Wang, Z.; Han, H. An analytical model for the transverse permeability of gas diffusion layer with electrical double layer effects in proton exchange membrane fuel cells. Int. J. Hydrog. Energy 2018, 43, 17880–17888. [Google Scholar] [CrossRef]
- Divya, K.; Østergaar, J. Battery energy storage technology for power systems—An overview. Electr. Power Syst. Res. 2009, 79, 511–520. [Google Scholar] [CrossRef]
- Gao, Y.; Zhang, X.; Cheng, Q.; Guo, B.; Yang, J. Classification and review of the charging strategies for commercial lithium-ion batteries. IEEE Access 2019, 7, 43511–43524. [Google Scholar] [CrossRef]
- Zou, C.; Manzie, C.; Nešić, D. Model predictive control for lithium-ion battery optimal charging. IEEE/ASME Trans. Mechatronics 2018, 23, 947–957. [Google Scholar] [CrossRef]
- Narayanaswamy, S.; Kauer, M.; Steinhorst, S.; Lukasiewycz, M.; Chakraborty, S. Modular active charge balancing for scalable battery packs. IEEE Trans. Very Large Scale Integr. (VLSI) Syst. 2016, 25, 974–987. [Google Scholar] [CrossRef]
- Tashakor, N.; Farjah, E.; Ghanbari, T. A bidirectional battery charger with modular integrated charge equalization circuit. IEEE Trans. Power Electron. 2016, 32, 2133–2145. [Google Scholar] [CrossRef]
- Xiong, R.; Cao, J.; Yu, Q.; He, H.; Sun, F. Critical review on the battery state of charge estimation methods for electric vehicles. IEEE Access 2017, 6, 1832–1843. [Google Scholar] [CrossRef]
- Quraan, M.; Yeo, T.; Tricoli, P.; Korea, S. Design and Control of Modular Multilevel Converters for Battery Electric Vehicles. IEEE Trans. Power Electron. 2015, 8993, 507–517. [Google Scholar] [CrossRef]
- Mukherjee, N.; Strickland, D. Control of second-life hybrid battery energy storage system based on modular boost-multilevel buck converter. IEEE Trans. Ind. Electron. 2015, 62, 1034–1046. [Google Scholar] [CrossRef]
- Kalair, A.; Abas, N.; Saleem, M.S.; Kalair, A.R.; Khan, N. Role of energy storage systems in energy transition from fossil fuels to renewables. Energy Storage 2021, 3, e135. [Google Scholar] [CrossRef]
- Broussely, M.; Herreyre, S.; Biensan, P.; Kasztejna, P.; Nechev, K.; Staniewicz, R. Aging mechanism in Li ion cells and calendar life predictions. J. Power Sources 2001, 97, 13–21. [Google Scholar] [CrossRef]
- Choi, S.S.; Lim, H.S. Factors that affect cycle-life and possible degradation mechanisms of a Li-ion cell based on LiCoO2. J. Power Sources 2002, 111, 130–136. [Google Scholar] [CrossRef]
- Liang, X.; Song, E.; Jiang, F.; Ahuja, N.; Kumar, M. Design considerations for turbo rack with smart battery backup System(BBS). In Proceedings of the 2019 IEEE Applied Power Electronics Conference and Exposition (APEC), Anaheim, CA, USA, 17–21 March 2019. [Google Scholar] [CrossRef]
- Morello, R.; Schwarz, R.; Hoedemaekers, E.R.; Habenschaden, F.; DI Rienzo, R.; Roncella, R.; Saletti, R.; Rosca, B.; Steffenhagen, T.; Lorentz, V.R.; et al. Implementation and Test of a 48 v Smart Battery System with Integrated DC/DC Converter. In Proceedings of the 2019 IEEE 28th International Symposium on Industrial Electronics (ISIE), Vancouver, BC, Canada, 12–14 June 2019; Volume 2019, pp. 2440–2445. [Google Scholar] [CrossRef]
- Chen, Y.; Bocca, A.; Macii, A.; Macii, E.; Poncino, M. A Li-Ion Battery Charge Protocol with Optimal Aging-Quality of Service Trade-Off; Association for Computing Machinery: New York, NY, USA, 2016; pp. 40–45. [Google Scholar] [CrossRef]
- Chen, F.; Qiao, W.; Qu, L. A modular and reconfigurable battery system. In Proceedings of the 2017 IEEE Applied Power Electronics Conference and Exposition (APEC), Tampa, FL, USA, 26–30 March 2017. [Google Scholar] [CrossRef]
- Weng, C.; Feng, X.; Sun, J.; Peng, H. State-of-health monitoring of lithium-ion battery modules and packs via incremental capacity peak tracking. Appl. Energy 2016, 180, 360–368. [Google Scholar] [CrossRef]
- Doerffel, D.; Sharkh, S.A. A critical review of using the Peukert equation for determining the remaining capacity of lead-acid and lithium-ion batteries. J. Power Sources 2006, 155, 395–400. [Google Scholar] [CrossRef]
- Andrea, D. Battery Management Systems for Large Lithium Ion Battery Packs; Artech House: Norwood, MA, USA, 2010. [Google Scholar]
- Wei, Z.; He, H.; Pou, J.; Tsui, K.L.; Quan, Z.; Li, Y. Signal-Disturbance Interfacing Elimination for Unbiased Model Parameter Identification of Lithium-Ion Battery. IEEE Trans. Ind. Inform. 2020. [Google Scholar] [CrossRef]
- Berecibar, M.; Gandiaga, I.; Villarreal, I.; Omar, N.; Van Mierlo, J.; Van Den Bossche, P. Critical review of state of health estimation methods of Li-ion batteries for real applications. Renew. Sustain. Energy Rev. 2016, 56, 572–587. [Google Scholar] [CrossRef]
- IEEE Standard. IEEE Recommended Practice for Testing the Performance of Stand-Alone Photovoltaic Systems; Technical Report; IEEE: Piscataway, NJ, USA, 2004. [Google Scholar] [CrossRef]
- De Beer, B.; Rix, A.J.; Rix, A.J. Influences of Energy throughput on the Life of Various Battery Technologies. In Proceedings of the 6th South African Solar Energy Conference, Mpekweni Beach Resort, South Africa, 25–27 November 2019. [Google Scholar]
- Aksanli, B.; Rosing, T.; Pettis, E. Distributed battery control for peak power shaving in datacenters. In Proceedings of the 2013 International Green Computing Conference Proceedings, Arlington, VA, USA, 27–29 June 2013. [Google Scholar] [CrossRef]
- Ci, S.; Lin, N.; Wu, D. Reconfigurable Battery Techniques and Systems: A Survey. IEEE Access 2016, 4, 1175–1189. [Google Scholar] [CrossRef]
- Dubarry, M.; Baure, G.; Pastor-Fernández, C.; Yu, T.F.; Widanage, W.D.; Marco, J. Battery energy storage system modeling: A combined comprehensive approach. J. Energy Storage 2019, 21, 172–185. [Google Scholar] [CrossRef]
- Varela Barreras, J. Practical Methods in Li-ion Batteries for Simplified Modeling, Battery Electric Vehicle Design, Battery Management System Testing and Balancing System Control. Ph.D. Thesis, Aalborg University, Aalborg, Denmark, 2017. [Google Scholar]
- Rehman, M.M.U.; Zhang, F.; Evzelman, M.; Zane, R.; Smith, K.; Maksimovic, D. Advanced cell-level control for extending electric vehicle battery pack lifetime. In Proceedings of the 2016 IEEE Energy Conversion Congress and Exposition (ECCE), Milwaukee, WI, USA, 18–22 September 2016. [Google Scholar] [CrossRef]
- Li, Y.; Han, Y. A Module-Integrated Distributed Battery Energy Storage and Management System. IEEE Trans. Power Electron. 2016. [Google Scholar] [CrossRef]
- Kim, T.; Qiao, W.; Qu, L. A series-connected self-reconfigurable multicell battery capable of safe and effective charging/discharging and balancing operations. In Proceedings of the 2012 Twenty-Seventh Annual IEEE Applied Power Electronics Conference and Exposition (APEC), Orlando, FL, USA, 5–9 February 2012; pp. 2259–2264. [Google Scholar] [CrossRef]
- Frost, D.F.; Howey, D.A. Completely Decentralized Active Balancing Battery Management System. IEEE Trans. Power Electron. 2018, 33, 729–738. [Google Scholar] [CrossRef]
- Liu, C.; Gao, N.; Cai, X.; Li, R. Differentiation Power Control of Modules in Second-life Battery Energy Storage System Based on Cascaded H-bridge Converter. IEEE Trans. Power Electron. 2019. [Google Scholar] [CrossRef]
- Araujo, L.S.; Fernandes, N.T.D.; Brandao, D.I.; Cardoso Filho, B.J. SmartBattery: An Active-Battery Solution for Energy Storage System. In Proceedings of the 2019 IEEE 15th Brazilian Power Electronics Conference and 5th IEEE Southern Power Electronics Conference (COBEP/SPEC), Santos, Brazil, 1–4 December 2019. [Google Scholar]
- Bouchhima, N.; Gossen, M.; Schulte, S.; Birke, K.P. Lifetime of self-reconfigurable batteries compared with conventional batteries. J. Energy Storage 2018, 15, 400–407. [Google Scholar] [CrossRef]
- Chowdhury, S.; Bin Shaheed, M.N.; Sozer, Y. An integrated state of health (SOH) balancing method for lithium-ion battery cells. In Proceedings of the 2019 IEEE Energy Conversion Congress and Exposition (ECCE), Baltimore, MD, USA, 29 September–3 October 2019; pp. 5759–5763. [Google Scholar] [CrossRef]
- De Beer, B. Evaluate and Design Battery Support Services for the Electrical Grid. Master’s Thesis, Stellenbosch University, Stellenbosch, South Africa, 2017. [Google Scholar]
- Liang, M.; Fu, C.; Xiao, B.; Luo, L.; Wang, Z. A fractal study for the effective electrolyte diffusion through charged porous media. Int. J. Heat Mass Transf. 2019, 137, 365–371. [Google Scholar] [CrossRef]
- Braco, E.; Martin, I.S.; Sanchis, P.; Ursúa, A. Characterization and capacity dispersion of lithiumion second-life batteries from electric vehicles. In Proceedings of the 2019 IEEE International Conference on Environment and Electrical Engineering and 2019 IEEE Industrial and Commercial Power Systems Europe, Genova, Italy, 11–14 June 2019. [Google Scholar] [CrossRef]
- Timmermans, J.M.; Nikolian, A.; De Hoog, J.; Gopalakrishnan, R.; Goutam, S.; Omar, N.; Coosemans, T.; Van Mierlo, J.; Warnecke, A.; Sauer, D.U.; et al. Batteries 2020—Lithium-ion battery first and second life ageing, validated battery models, lifetime modelling and ageing assessment of thermal parameters. In Proceedings of the 2016 18th European Conference on Power Electronics and Applications (EPE’16 ECCE Europe), Karlsruhe, Germany, 5–9 September 2016. [Google Scholar] [CrossRef]
- Battery: Generic Battery Model Description. Available online: https://www.mathworks.com/help/physmod/sps/powersys/ref/battery.html (accessed on 17 September 2019).
- Hong, Y.; Wang, S.; Huang, Z. Efficient Energy Consumption Scheduling: Towards Effective Load Leveling. Energies 2017, 10, 105. [Google Scholar] [CrossRef]
- Ferreira, R.V.R.; Silva, S.S.M.; Brandao, D.D.I.; Antunes, H.H.M.; Fernandes, N.T.N. Assessment of energy storage viability for a PV power plant injecting during peak load time. In Proceedings of the 2017 IEEE 8th International Symposium on Power Electronics for Distributed Generation Systems (PEDG), Florianopolis, Brazil, 17–20 April 2017. [Google Scholar] [CrossRef]
- Blair, N.; Dobos, A.P.; Freeman, J.; Neises, T.; Wagner, M.; Ferguson, T.; Gilman, P.; Janzou, S. System Advisor Model, Sam 2014.1. 14: General Description; Technical Report; National Renewable Energy Lab.(NREL): Golden, CO, USA, 2014. [Google Scholar]
- Omar, N.; Monem, M.A.; Firouz, Y.; Salminen, J.; Smekens, J.; Hegazy, O.; Gaulous, H.; Mulder, G.; Van den Bossche, P.; Coosemans, T.; et al. Lithium iron phosphate based battery—Assessment of the aging parameters and development of cycle life model. Appl. Energy 2014, 113, 1575–1585. [Google Scholar] [CrossRef]


| Parameters | Values |
|---|---|
| Thermal resistance [°C/W] | 0.6 |
| Thermal time constant [s] | 2000 |
| Parameter | Battery 1 | Battery 2 | Battery 3 |
|---|---|---|---|
| Nominal voltage | 7.2 V | 7.2 V | 7.2 V |
| Rated capacity | 5.4 Ah | 5.4 Ah | 5.4 Ah |
| Remaining Capacity | 5.37 Ah | 5.35 Ah | 5.54 Ah |
| Initial SoC | 20% | 30% | 10% |
| Number of Cycles | 0 | 0 | 0 |
| Strategies | k |
|---|---|
| adapted SoC | 100 |
| SoH | 0.2 |
| Parameter | Battery 1 | Battery 2 | Battery 3 |
|---|---|---|---|
| Nominal voltage | 7.2 V | 7.2 V | 7.2 V |
| Rated capacity | 5.4 Ah | 5.4 Ah | 5.4 Ah |
| Remaining Capacity | 5.37 Ah | 5.35 Ah | 5.54 Ah |
| Initial SoC | 30% | 30% | 30% |
| Number of Cycles | 0 | 0 | 0 |
| Capacity [Ah] | Battery 1 | Battery 2 | Battery 3 |
|---|---|---|---|
| adapted SoC | 5.24 | 5.22 | 5.36 |
| SoH | 5.23 | 5.21 | 5.36 |
| Voltage [V] | Current [A] | Temperature [ºC] | |||||||
|---|---|---|---|---|---|---|---|---|---|
| min | avg | max | min | avg | max | min | avg | max | |
| adapted SoC | 7.11 | 7.4 | 7.63 | −1.2 | 0.171 | 2.47 | 20.0 | 25.8 | 29.5 |
| SoH | 7.11 | 7.41 | 7.63 | −0.9 | 0.0535 | 1.8 | 20.0 | 25.8 | 28.7 |
| gain | 0 | 1.001 | 0 | 0.75 | 0.31 | 0.73 | 0 | 0 | 0.973 |
| Voltage [V] | Current [A] | Temperature [ºC] | |||||||
|---|---|---|---|---|---|---|---|---|---|
| min | avg | max | min | avg | max | min | avg | max | |
| adapted SoC | 7.12 | 7.4 | 7.64 | −1.21 | 0.178 | 2.48 | 20.0 | 25.8 | 29.4 |
| SoH | 7.12 | 7.41 | 7.63 | −0.9 | 0.0553 | 1.8 | 20.0 | 25.8 | 28.7 |
| gain | 0 | 1.001 | 0.999 | 0.744 | 0.311 | 0.726 | 0 | 0 | 0.976 |
| Voltage [V] | Current [A] | Temperature [ºC] | |||||||
|---|---|---|---|---|---|---|---|---|---|
| min | avg | max | min | avg | max | min | avg | max | |
| adapted SoC | 7.09 | 7.39 | 7.63 | −1.24 | 0.226 | 2.55 | 20.0 | 25.7 | 29.3 |
| SoH | 7.1 | 7.39 | 7.62 | −0.9 | 0.0201 | 1.8 | 20.0 | 25.6 | 28.4 |
| gain | 1.001 | 0 | 0.999 | 0.726 | 0.089 | 0.706 | 0 | 0.996 | 0.969 |
| Parameter | Battery 1 | Battery 2 | Battery 3 |
|---|---|---|---|
| Nominal voltage | 7.2 V | 7.2 V | 7.2 V |
| Rated capacity | 5.4 Ah | 5.4 Ah | 5.4 Ah |
| Remaining Capacity | 5.04 Ah | 5.15 Ah | 5.2 Ah |
| Initial SoC | 30% | 30% | 30% |
| Number of Cycles | 750 | 750 | 750 |
| Voltage [V] | Current [A] | Temperature [ºC] | |||||||
|---|---|---|---|---|---|---|---|---|---|
| min | avg | max | min | avg | max | min | avg | max | |
| adapted SoC | 7.14 | 7.41 | 7.64 | −1.14 | 0.167 | 2.36 | 20.0 | 25.5 | 28.9 |
| SoH | 7.14 | 7.42 | 7.63 | −0.9 | 0.341 | 1.8 | 20.0 | 26.2 | 28.6 |
| gain | 0 | 1.001 | 0.999 | 0.789 | 2.042 | 0.763 | 0 | 1.027 | 0.990 |
| Voltage [V] | Current [A] | Temperature [ºC] | |||||||
|---|---|---|---|---|---|---|---|---|---|
| min | avg | max | min | avg | max | min | avg | max | |
| adapted SoC | 7.14 | 7.41 | 7.66 | −1.16 | 0.17 | 2.37 | 20.0 | 25.5 | 29.1 |
| SoH | 7.14 | 7.42 | 7.63 | −0.9 | 0.337 | 1.8 | 20.0 | 26.1 | 28.6 |
| gain | 0 | 1.001 | 0.996 | 0.776 | 1.982 | 0.759 | 0 | 1.023 | 0.983 |
| Voltage [V] | Current [A] | Temperature [ºC] | |||||||
|---|---|---|---|---|---|---|---|---|---|
| min | avg | max | min | avg | max | min | avg | max | |
| adapted SoC | 7.12 | 7.4 | 7.64 | −1.18 | 0.185 | 2.42 | 20.0 | 25.3 | 28.8 |
| SoH | 7.12 | 7.4 | 7.62 | −0.9 | 0.302 | 1.8 | 20.0 | 25.9 | 28.3 |
| gain | 0 | 0 | 0.997 | 0.763 | 1.632 | 0.744 | 0 | 1.024 | 0.983 |
| Capacity [Ah] | Battery 1 | Battery 2 | Battery 3 |
|---|---|---|---|
| adapted SoC | 4.99 | 4.98 | 5.03 |
| SoH | 4.97 | 4.96 | 5.0 |
| Parameter | Battery 1 | Battery 2 | Battery 3 |
|---|---|---|---|
| Nominal voltage | 7.2 V | 7.4 V | 7.2 V |
| Rated capacity | 5.4 Ah | 4.4 Ah | 5.4 Ah |
| Remaining Capacity | 5.20 Ah | 4.55 Ah | 5.18Ah |
| Initial SoC | 30% | 30% | 30% |
| Number of Cycles | 750 | 0 | 750 |
| Voltage [V] | Current [A] | Temperature [ºC] | |||||||
|---|---|---|---|---|---|---|---|---|---|
| min | avg | max | min | avg | max | min | avg | max | |
| adapted SoC | 7.14 | 7.41 | 7.65 | −1.16 | 0.191 | 2.39 | 20.0 | 25.5 | 29.0 |
| SoH | 7.14 | 7.42 | 7.63 | −0.9 | 0.259 | 1.8 | 20.0 | 26.1 | 28.6 |
| gain | 0 | 1.001 | 0.997 | 0.776 | 1.356 | 0.753 | 0 | 1.023 | 0.986 |
| Voltage [V] | Current [A] | Temperature [ºC] | |||||||
|---|---|---|---|---|---|---|---|---|---|
| min | avg | max | min | avg | max | min | avg | max | |
| adapted SoC | 7.29 | 7.59 | 7.85 | −1.04 | 0.15 | 2.14 | 20.0 | 25.5 | 28.9 |
| SoH | 7.3 | 7.58 | 7.82 | −0.731 | 0.152 | 1.46 | 20.0 | 25.4 | 27.8 |
| gain | 1.001 | 0.999 | 0.996 | 0.703 | 1.013 | 0.682 | 0 | 0.996 | 0.962 |
| Voltage [V] | Current [A] | Temperature [ºC] | |||||||
|---|---|---|---|---|---|---|---|---|---|
| min | avg | max | min | avg | max | min | avg | max | |
| adapted SoC | 7.12 | 7.4 | 7.65 | −1.16 | 0.184 | 2.4 | 20.0 | 25.3 | 28.8 |
| SoH | 7.13 | 7.41 | 7.62 | −0.9 | -0.017 | 1.8 | 20.0 | 25.5 | 28.2 |
| gain | 1.001 | 1.001 | 0.996 | 0.776 | −0.092 | 0.75 | 0 | 1.008 | 0.979 |
| Capacity [Ah] | Battery 1 | Battery 2 | Battery 3 |
|---|---|---|---|
| adapted SoC | 4.99 | 4.55 | 5.03 |
| SoH | 4.97 | 4.55 | 5.0 |
| Battery1 | Battery 2 | Battery 3 | |
|---|---|---|---|
| adapted SoC | 0.136 | 0.128 | 0.181 |
| SoH | 0.143 | 0.137 | 0.185 |
| Battery1 | Battery 2 | Battery 3 | |
|---|---|---|---|
| adapted SoC | 0.389 | 0.369 | 0.516 |
| SoH | 0.409 | 0.389 | 0.541 |
| Battery1 | Battery 2 | Battery 3 | |
|---|---|---|---|
| adapted SoC | 0.389 | 0.0787 | 0.516 |
| SoH | 0.409 | 0.0761 | 0.539 |
Publisher’s Note: MDPI stays neutral with regard to jurisdictional claims in published maps and institutional affiliations. |
© 2021 by the authors. Licensee MDPI, Basel, Switzerland. This article is an open access article distributed under the terms and conditions of the Creative Commons Attribution (CC BY) license (https://creativecommons.org/licenses/by/4.0/).
Share and Cite
Fernandes, N.T.D.; Rocha, A.; Brandao, D.; Filho, B.C. Comparison of Advanced Charge Strategies for Modular Cascaded Battery Chargers. Energies 2021, 14, 3361. https://doi.org/10.3390/en14123361
Fernandes NTD, Rocha A, Brandao D, Filho BC. Comparison of Advanced Charge Strategies for Modular Cascaded Battery Chargers. Energies. 2021; 14(12):3361. https://doi.org/10.3390/en14123361
Chicago/Turabian StyleFernandes, Nicolas T. D., Anderson Rocha, Danilo Brandao, and Braz C. Filho. 2021. "Comparison of Advanced Charge Strategies for Modular Cascaded Battery Chargers" Energies 14, no. 12: 3361. https://doi.org/10.3390/en14123361
APA StyleFernandes, N. T. D., Rocha, A., Brandao, D., & Filho, B. C. (2021). Comparison of Advanced Charge Strategies for Modular Cascaded Battery Chargers. Energies, 14(12), 3361. https://doi.org/10.3390/en14123361