1. Introduction
As the world economy continues to develop, the building industry continues to maintain a great expense of energy utilization and carbon dioxide emission. Consumers are central participants in this specific circumstance, as adaptability in demand is necessarily required to embrace the discontinuous nature of most renewable energy sources [
1]. The poor performance of existing buildings offers essential possibilities for energy retrofit. Integrating renewable solar systems into the building envelope and storage of thermal and electric energy can be the solution to this challenge. [
2]. The Energy Performance Buildings Directive (EPBD) promotes policies that will produce highly energy-efficient and decarbonized structures by 2050 [
3]. Starting 31 December 2020, all new buildings will have to be Nearly Zero Energy Buildings [
4]. Zero-energy buildings are required to produce equivalent energy from renewable technologies to balance their energy consumption [
5]. Designing passive measures and implementing highly efficient building systems are the first steps to accomplish Net Zero Energy objectives [
6]. The second step includes the integration of active surfaces for energy generation and management. Solar thermal collectors and photovoltaic panels are the most reliable ways to provide electrical and thermal energy from renewable sources [
7]. Therefore, the current and future architectural design philosophies must consider the floor, roof, wall, and any other surface space available to be able to place energy generation devices. The building’s energy footprint is a new concept to be considered at the design stage [
8]. In relation to the architectural building design, the possible renewable supply options are in the building’s physical footprint [
9,
10]. Architects and building designers have to face the challenges of designing buildings and their energy footprint and considering how this energy footprint will influence the habitats, cities, and landscapes of tomorrow [
11].
Photovoltaic panels placed on building roofs can generate enough electricity without causing greenhouse gases or occupying other building footprints. The integration of Photovoltaic (PV) systems in the building envelope can reduce the primary energy consumption and decrease the global warming potential by cutting down on CO
2 emissions [
12,
13]. Energy generated by PV panels can be used where it is consumed and can be used to power any building request, from lighting to electrical heating and cooling generators. The system can allow construction costs reduction if used to substitute traditional building materials [
14]. Some authors regard Building-integrated PV panels as an optimal solution for zero energy building design due to the ability to generate energy [
15,
16]. PV modules are available at the price of about 1.5 €/W. However, the price is lower in the European market, with the lowest price of about 0.75 €/W [
17]. A global annual growth rate of 40% is expected in the BIPV installed capacity from 2017 to 2021 [
18,
19]. Although policies for promoting BIPV deployment have begun over the last few years, there exist barriers to the massive use of this technology in the building industry [
20]. The lack of national programs or building codes covering the technical specifications of the devices and long pay-back periods for solar installations hinder the massive deployment of this technology [
21]. Financial boundaries continue to be the primary barrier to a renewably-powered community [
22]. Battery packages for energy storage are required in areas without access to electric grids, although integrating batteries shows a high energy product cost [
23,
24]. Extensive research has been conducted to assess the PV cells’ efficiency. The reported efficiency for the polycrystalline silicon PV and amorphous silicon PV cells usually used in BIPV is 25.7% and 10.2%, respectively [
25,
26].
Researchers commonly recognize the impacts of the envelope on the building energy balance. Many design features such as insulation, structural stiffness, and aesthetics pertain to fabrication, assembly, and deployment [
27]. The use of curtain wall systems enables effective daylighting in high-grade, institutional and commercial buildings [
28]. A stick Curtain Wall System comprises mullions, transoms, and glass panels placed on-site. [
29]. Unitized Curtain Walls are produced, constructed, and glazed in an off-site facility; these unitized units are transported to the construction site and attached to the building structure.
There are many current trends in energy efficiency for transparent building envelopes. These include, but are not limited to: addressing solar heat gain coefficient (SHGC) with coatings on glazing [
30], dynamic glazing solutions such as electrochromic glazing (EC) [
31], suspended particle device glazing (SPD) [
32], and polymer dispersed liquid crystal (PDLC) [
33]. In addition to this, one can improve the thermal resistance of the building envelope by using multi-layered glazing and reduce cooling demand with shading devices [
34,
35]. A fluid medium that can cool the glass itself can preheat the air before it enters the interior space [
36]. An alternative to circulating air is using a circulating water chamber which benefits from capturing solar energy and turning that potential energy load into a renewable energy source [
37]. This idea is known as Water Flow Glazing (WFG), a disruptive active façade technology that aims to compliment the HVAC system in a structure. Water-flow glazing (WFG) has been studied as a curtain wall component. Energy savings depend on the water layer’s absorption for energy management of the building envelope [
38,
39]. Building envelopes with high window-to-wall ratios significantly impact the built environment’s ecological footprint due to the high operational energy demand. WFG panels absorb heat which can be transported to a thermal storage unit [
40]. Some authors successfully tested this technology and showed saving potential between 52% and 72% compared with traditional double glazing and between 34% and 61% compared with triple glazing [
41]. Other authors have assessed the WFG life cycle showing that its cost payback time and energy payback time is less than three years [
42]. Some experimental facilities called ‘water houses’ have been built to evaluate their viability and compare the water-filled envelope with existing construction techniques [
43]. The present article continued this line of research, presenting a new Water-flow glazing unitized façade. This facade has been tested in a real-world facility built in Sofia, Bulgaria. The objective of this paper was to assess the energy performance and the economic feasibility of a WFG façade coupled with a PV array system and heat pump to improve the energy resilience of buildings while allowing for desirable architectural features. The first section describes the proposed system and presents the data about this research. The second section explains the performance indicators used to evaluate the system operation. This study includes an analysis to study the influence of variable input on technical performance and economic feasibility. This article further presents a model for expanding the enhancement of the PV energy source. It was reported that the potential of renewable energy for buildings and reduction in CO
2 potential can be influenced through different government policies and strategy measures.
The main novelties of this work comprise several goals. Firstly, to fulfill the demand of an office building for space heating and cooling using a PV-driven heat pump. Secondly, to compare Building Information Modeling (BIM) and Energy+ simulation with measured data from a real facility. Thirdly, dynamic simulations were performed to analyze the thermo-economic performances at different peak powers of PV by means of two different software tools. Finally, technical and economical parameters (including the tilt angle, peak power of PV, electricity price, and conversion factors for primary energy) have been taken into account and presented.
This paper is organized into five different sections.
Section 2 contains a description of the tested facility, weather data from the site, and a description of the water flow glazing system and PV array.
Section 3 presents actual data from the tested facility, calculates the heating and cooling loads, showcases the renewable energy production of WFG, and finally demonstrates simulation data from commercial software.
Section 4 takes into consideration the energy and economic analysis. Lastly,
Section 5 covers conclusions and limitations.
2. Materials and Methods
In this section, the authors intend to explain the testing facility, provide a quick overview of the water flow glazing envelope, the energy system employed in the testing facility, and finally, an overview of the PV array system. The testing facility was a structure built in Sofia, Bulgaria, that collected data over the timespan of one year. This structure was built using water flow glazing panels, a façade typology that contains a triple-glazed panel. The chamber located towards the exterior contained a traditional gas-filled chamber, while the interior chamber was filled with a circulating fluid medium. The energy system used in this prototype is a water-to-water heat pump that collected heat from the water flow glazing panels and stores it in a buffer tank below ground level. When needed, this heat recirculated into the building. Finally, a photovoltaic (PV) array provided the required electricity to the building and building peripherals, including heating, lighting, and computer systems.
2.1. Description of Testing Facility and Energy Management System
WFG modules were tested in an experimental facility built in Sofia, Bulgaria (42°39′1″ N, 23°23′26″ E, Elevation: 590 m a.s.l.). The building is a stand-alone construction with a square geometry, deployed in a single plan of outer dimensions 7 × 7 m, and a ceiling height of 2.7 m, with open office design and a central service core. Three of the facades are fully glazed, from floor to ceiling, except the north façade which is 100% opaque. The glass facades are composed of unitized WFG modules with dimensions of 2.7 × 1.3 m. Eastern, western and southern facades were triple glazing with a 16 mm argon cavity and a 24 mm water cavity. The unitized WFG panels were put together in a workshop and then served for on-site application with an aluminum enclosure that held the circulating device. A water pump, a plate heat exchanger, flow meters at the inlet and outlet, and temperature probes made up this circulating device. The design flow rate was 2 L/min m
2. The southern glazing showed high near-infrared and low-infrared FIR absorptions, making it an ideal solution for large glazing facades in severely cold climates. The goal for eastern and western glazing was to prevent heat from entering the internal area, especially in summer with high front reflectance and low infrared absorptance. Besides, the water flow absorbed solar infrared radiation increasing the water temperature within the window. The energy transported by the water is released in tanks so that thermal energy can be collected and utilized in radiant heating systems and domestic hot water. This renewable energy integrated into the water flow glazing panels might be enough to meet the heating loads in winter. However, it is necessary to study other renewable energy sources to address the electric loads over the year.
Figure 1 illustrates the prototype, the WFG panels and the building integrated PV array. Southern WFG showed a low Far-Infrared absorptance, high Near-Infrared absorptance, and high front Far-Infrared reflectance. Its ability to absorb heat made it the right solution for heating up water. The infrared absorptance was very low in eastern and western WFG, whereas the infrared front reflectance was high. This glazing would show the best performance for preventing heat from entering the indoor space, but it would not be relevant to heat water.
The space heating and cooling demand was met by the energy management system made of WFG panels, a cylindrical 370-L buffer tank with a 2 cm rigid insulation, and a water-to-water heat pump coupled to a building-integrated PV array. The tank’s internal diameter was 0.6 m and the height 1.55 m. It was placed underneath the prototype, with the top accessible from a crawl space, and connected to the water-to-water heat pump., The PV array satisfied the electricity demand formed by: (i) the electrical appliances installed in the building, (ii) the lighting equipment and (iii) the space heating and cooling by electric-driven heat pumps for (iv) the hydraulic auxiliary system for WFG panels. The PV capacities are calculated to maximize the self-consumed renewable energy. The PV array is sized to fulfill the electricity demand. When the PV output is lower than the demand, the remaining amount of electricity demand is withdrawn from the power grid. Moreover, if the PV plant output exceeds the demand, the excess output is delivered to the grid. Therefore, it is assumed that there is no electricity storage system.
Figure 2 shows the proposed layout that consisted of two main thermal loops. The water flow glazing loop is based on water heated by the WFG modules and supplied to the buffer tank. The second loop connects the buffer tank with the water-to-water heat pump. In summer, WFG panels absorbed solar radiation and released the heat in the buffer tank underneath the prototype. The heat pump distributes cold water through the WFG façade and interior panels. In winter, WFG façade panels absorbed solar radiation and heated up the buffer tank. Hot water is circulated through the interior WFG panels and released heat inside the building. The water-to-water heat pump worked as a backup system and was operating if the buffer tank temperature is not high enough to supply the required heating load.
2.2. Estimation of Solar Irradiances and Outdoor Temperature
To properly calculate the total irradiance that will be received on the test prototype, there needs to exist a breakdown of variables that will present the total irradiance when summed together. Firstly, the Global Horizontal Irradiance (Ghi) maintains the total irradiance received on horizontal surfaces. This variable is calculated by summing the horizontal components of diffuse and direct (beam) irradiance types. This beam irradiance is the most relevant variable to consider when calculating for technologies that rely on solar power. Secondly, the Diffuse Horizontal Irradiance (Dhi) is the horizontal component of irradiance that is scattered due to the presence of the atmosphere. In conjunction with beam irradiance, diffuse irradiance is a crucial component to consider when calculating the performance of the solar module. Thirdly and finally, the Direct Normal Irradiance (Dni) is the amount of solar irradiance delivered directly from the sun. The authors have estimated these crucial solar irradiance components (direct beam, diffuse, and reflected radiation) to show the importance of each type.
Figure 3 demonstrates solar irradiances received in January. Direct (Beam) Horizontal Irradiance (Ebh) is the horizontal type of Direct Normal Irradiance. In this figure it is understood that days one, two, and three are sunny days, while days five and six are cloudy. During sunny days both direct normal irradiance and diffuse radiation are present; Meanwhile, during the cloudy days only diffuse radiation is present. Outdoor temperatures during these days ranged from −5 °C to 7 °C.
Figure 4 demonstrates solar irradiances in the month of July, where Direct (Beam) Horizontal Irradiance (Ebh) is the horizontal component of Direct Normal Irradiance. During this month, it can be understood that the exterior temperature ranges from 15 °C to 30 °C.
2.3. Water Flow Glazing Thermal Properties
Previous articles have shown the equations that explain the spectral and thermal behavior of water flow glazing assuming steady conditions [
44,
45]. The variable
ṁ denotes the mass flow rate per unit of surface; this variable can be manipulated in order to change the thermal performance of the water flow glazing (WFG) system.
c is the variable that measures the heat capacity of the fluid medium. Meanwhile,
c, when multiplied by
ṁ (the mass flow rate), gives the capacity of the fluid medium to absorb heat. Equation (1) demonstrates the variable g-factor of a triple-glazed WFG panel.
where:
Ue = thermal transmittance between water chamber and exterior environment,
Ui = thermal transmittance between water chamber and interior,
Aw = Water absorptance,
A1, A2, A3 = Glazing panel absorptances of each respective pane in window assembly,
he, hi, hg, hw = Convective heat coefficients,
T = energy transmittance of glazing.
Ui,
Ue are obtained through the manipulation of the convective heat coefficient variables,
he, hi, hg, hw. Equations (2) and (3) are used to calculate the variable thermal transmittances of WFG. U is the glazing thermal transmittance;
Uw is the total thermal transmittance between the indoor environment and the water chamber.
Equation (4) illustrates the expression of
q, the heat flow through glazing with gas cavities. The heat flow depends on the difference between the indoor and outdoor temperatures
(θe −
θi), thermal transmittance,
U,
g-factor, and direct and diffuse solar radiation,
i0.
Equation (5) illustrates the heat flow,
q, in water flow glazing panels, where the fluid’s temperature and mass flow rate are transient, which affects the heat flow.
θIN is the variable that measures the inlet temperature of the fluid medium in the WFG assembly.
where
θIN is the inlet temperature of the fluid into the WFG system. Thermal transmittances and
g-factors of the water flow glazing change at different flow rate conditions. When the fluid is flowing at a rate of
ṁ > 2 L/m
2 min,
g and
U are denoted with the superscript
ON. When there is no flow (
ṁ = 0) the
g-factor and
U values, denoted with the superscript
OFF, depend only on the spectral properties of the glass.
2.4. Photovoltaic
Photovoltaic (PV) systems have many potentialities, thanks to their ability to produce electricity and the enormous recent cost reduction. In this project, a grid-connected PV arrangement supplied the grid when the building demand exceeded the produced energy. The viability of the private grid-connected PV system came after a techno-economic feasibility study that included the initial costs and the energy savings over the facility’s operating life cycle. The research was conducted using different PV simulation software and analyzing various techno-economic indicators. These indicators benchmarked the system production at a particular spot upon the system’s production under possible operational patterns. The inputs were based on actual energy consumption results over a year. The highest daily consumption and the minimum amount of peak solar hours are required to determine a photovoltaic array. The grid-connected systems stated in this article were integrated in the WFG southern modules and installed on the rooftop of the tested facility. The estimation of rooftop areas is the first step to fitting the design specifications. In terms of roof construction, the tested facility had a flat rooftop that facilitates the installation of a PV array. This PV system eliminated the expense of storage. The system was broken down into PV arrays, inverters, and transformers, as shown in
Figure 2. The excess electricity, exceeding consumption by the connected equipment, is supplied to the grid. The PV system monthly energy output has been calculated with the solar thermal power which is absorbed per unit area of a PV system, determined using Equation (6).
where
It is monthly average daily of total absorbed solar irradiance on a tilted surface,
Am is the area of a PV panel, and
Nm is the number of PV panels that made up the PV array. Equation (7) illustrates the AC energy production from a PV system.
where
ηe is the PV efficiency of the panel and
ηinv is the inverter’s efficiency. The monthly average hourly beam irradiance on a tilted surface (Wh/m
2) is given by Equation (8).
where
IBn is the average beam irradiance for normal incidence (Wh/m
2), and θ is the angle of incidence. Equation (9) shows the diffuse irradiance on a tilted surface (Wh/m
2).
where the monthly average hourly diffuse irradiance for normal incidence,
IDn (Wh/m
2), depends on the tilt angle,
β [
46].
Table 1 shows data from the energy management system, including the PV array, the Water Flow Glazing thermal and spectral properties, the buffer tank, the reference glazing, and the heat pump. WFG prototype was connected to a buffer tank and a water-to-water heat pump, whereas the reference glazing prototype was simulated with an air-to-water heat pump. It has been assumed that the former had a heat pump, with a Coefficient of Performance (COP) of 5.4 and an Energy Efficiency Ratio (EER) equivalent to 6.0. The latter heat pump’s coefficients were COP of 3.5 and EER of 4.0 [
47].
3. Results
This section reviewed several critical energy parameters, demonstrating both initial predictions and collected real-world data from the facility. The heating and cooling loads, both with and without WFG panels, was demonstrated. The amount of PV energy produced is also listed. Finally, heat gains from the internal water chamber were presented. The tested prototype had an opening schedule from 8:00 to 20:00, (Monday to Friday). During scheduled operating hours the considered internal loads were equipment loads: 7 W/m2, lighting loads: 10 W/m2, occupation loads: 5 W/m2. The heat balance was broken down in internal heat loads provided by the equipment in operation and occupancy of the building, the heat transmitted between outside and inside through the transparent and opaque envelope, solar gain through the glazing (considering the amount of direct and diffuse radiation which penetrates to the interior), and ventilation loads. Domestic hot water consumption has been considered zero.
3.1. Energy Plus Simulation Results
This section aimed to evaluate how the different technologies implemented in the facility are performing related to the construction of zero energy buildings, as set out in the 2010/31/UE directive, and using renewable solar energy. Subsequently, the electric type energy consumption is represented due to the lighting, the heat pump, and the operation of equipment, all of them monthly, in kWh. The consumption of domestic hot water has been considered zero. For performing the energy simulations, the EnergyPlus 8.4.1 (
https://energyplus.net accessed on 2 February 2021) software tool has been used to calculate the building’s energy consumption. For graphical interface, the Open Studio Application Suite (
https://energyplus.net/extras accessed on 2 February 2021), a tool able to support the whole building energy modeling when using Energy Plus.
Table 2 illustrates the estimated heating loads of the WFG prototype on a cloudy winter day. The number of occupants (
n) at each hour was used to calculate ventilation loads (Vent). Values for area and thermal transmittance of the roof, opaque walls, and water flow glazing were taken from
Table 1.
Table 3 shows the estimated cooling loads of the WFG prototype. Internal loads (
IL) were determined with the metabolic rate of an office, the number of people, and 20 W/m
2 for lighting. Solar radiation (
SR) was calculated using the g-factor from
Table 1 for WFG.
3.2. Operational Energy and Thermal Energy Production
Heating and cooling energy loads were calculated by using Equation (4) for the reference glazing and Equation (5) for WFG. The inputs were taken from real data over a year time. The thermal energy production was obtained from the prototype’s real data throughout the year. Equation (10) verified the absorbed energy per unit of area per day [
44]. The output of the equation is the water heat gain. The daily water heat gain efficiency is defined as the ratio of total water heat gain compared to the daily solar radiation. In this research, the daily water heat gain is accumulated if the inlet temperature is lower than the outlet temperature.
where:
Ue = thermal transmittance between water chamber and exterior environment,
Ui = thermal transmittance between water chamber and interior,
Avi0 = energy absorbed by the water, plus the energy transferred by convection due to the glass panels heat absorption,
θIN = inlet temperature in the water flow glazing
ṁc = capacity of the fluid medium to absorb heat.
Equation (11) defines
Av as the absorptance of triple glazing with a water chamber facing indoors [
44].
where:
Ue = thermal transmittance between water chamber and exterior environment,
Ui = thermal transmittance between water chamber and interior,
Aw = Water absorptance,
A1, A2, A3 = Glazing panel absorptances of each respective pane in window assembly,
he, hi, hg, hw = Convective heat coefficients.
In
Figure 5 and
Figure 6, the southern facing wall was responsible for the majority of water heat gain, while the walls in the eastern and western orientations provided much less. Two causes can explain this phenomenon. The first being the simple fact that in winter, the southern direction is the orientation that receives the most amount of direct solar radiation, while the walls in the eastern and western orientations receive much less. The second reason involves the selection of the glazing types used for each direction. In the eastern and western orientations, the glazing was selected to have a high near-infrared reflectance. This high reflectance, in turn, caused a low absorption of solar heat gains in near-infrared radiation. The authors were seeking out this effect because of two reasons. Reason one was because the solar irradiance in eastern and western orientations was predicted to be negligible. Therefore, it is not warranted to invest the same in these directions as in the Southern orientation. Reason two was to prevent overheating during summertime when the solar radiation is perpendicular to eastern and western facades. Meanwhile, in the southern orientation, the glazing was chosen to have a low reflectance and a high absorptance of near-infrared radiation. This absorptance causes a high heat gain leading to increasing temperatures in the fluid medium in the WFG panels. This heated water can then be used for other purposes.
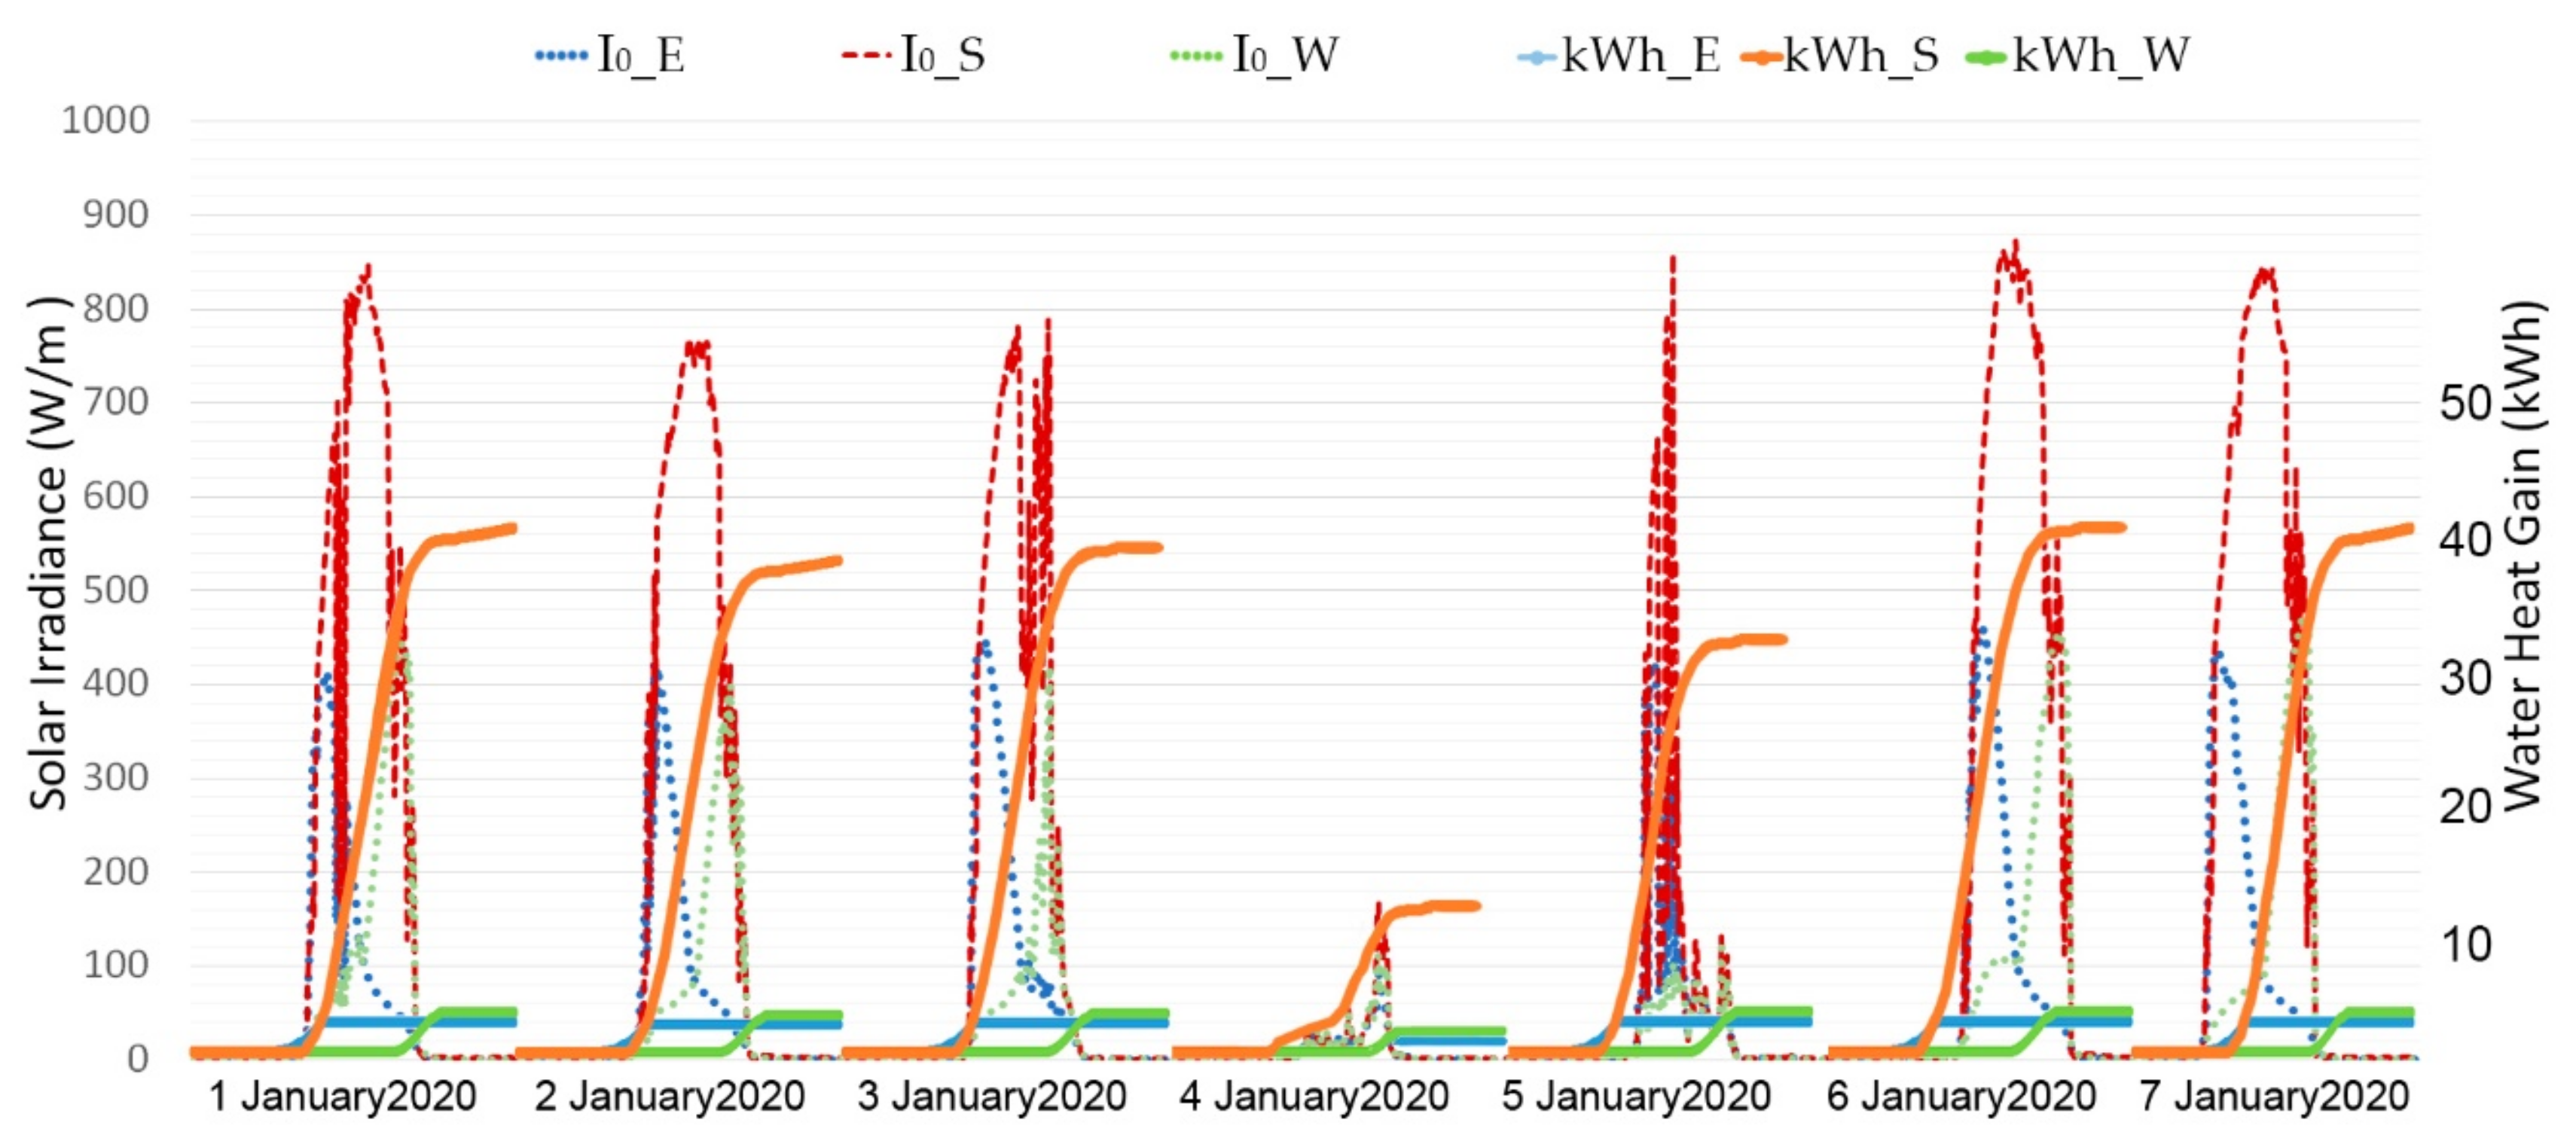
Figure 5 demonstrates the measured solar irradiance and the water heat gains during the selected winter period in three different orientations. Panels oriented in a southern direction had a daily energy absorption rate of 39 kWh on sunny winter days when the peak solar irradiance on the southern façade was 800 W/m
2. On cloudy winter days, the energy absorption rate in the eastern and western orientations was negligible. The higher gain in southern glazing can also be explained by the solar angle and the hours of sun on the southern facade. The angle and sun hours are lower on eastern and western facades, which results in less heat absorption.
Figure 6 shows the measured solar irradiance and the water heat gains over the first week of July. The average water heat gain in the southern WFG panels was 47 kWh per day, whereas the average water heat gain in the eastern and western WFG panels was 33 kWh per day. As expected, most of the heat on eastern and western facades was rejected, whereas the water heat gain was high on the southern facade. Solar radiation on eastern and western facades showed low values in winter. The peak solar radiation was slightly over 400 W/m
2, whereas in summer, the peak solar radiation was over 700 W/m
2. In addition, there were more sun hours in summer than in winter. The east-west gain is different depending on the day.
Figure 6 shows that on 2 July, solar heat gains are higher in the east than in the west because solar radiation showed high values. On 4 July,
Figure 6 shows that the solar radiation in the western facade was higher, so was the solar heat gain over that day.
The water-energy absorption can be used as renewable primary energy production.
Table 4 shows the total thermal energy production compared to the heating load needed to keep the indoor temperature at a comfortable range. A hydronic system made of indoor WFG panels delivered this energy inside the building. It can be seen in
Table 4 that in December and January, the heating loads are slightly above what the water heat gains can provide. During these months, another energy source will be required to provide thermal comfort conditions. Meanwhile, during the remainder of the year, especially during the summer months, the exact opposite occurs. The WFG panels absorb an excessive amount of solar heat.
An excess of water heat gains will lead to uncomfortable interior conditions for building occupants. Therefore, the heat gains should be applied to something that will be beneficial to building occupants in a way other than heating. Possible remedies could include domestic hot water for residential buildings, and seasonal heating storage by use of a buffer tank.
3.3. PV Production and Electric Loads
This subsection aimed to demonstrate that the remaining heating loads, cooling loads, artificial lighting, and power for building equipment were covered by energy produced from the PV array.
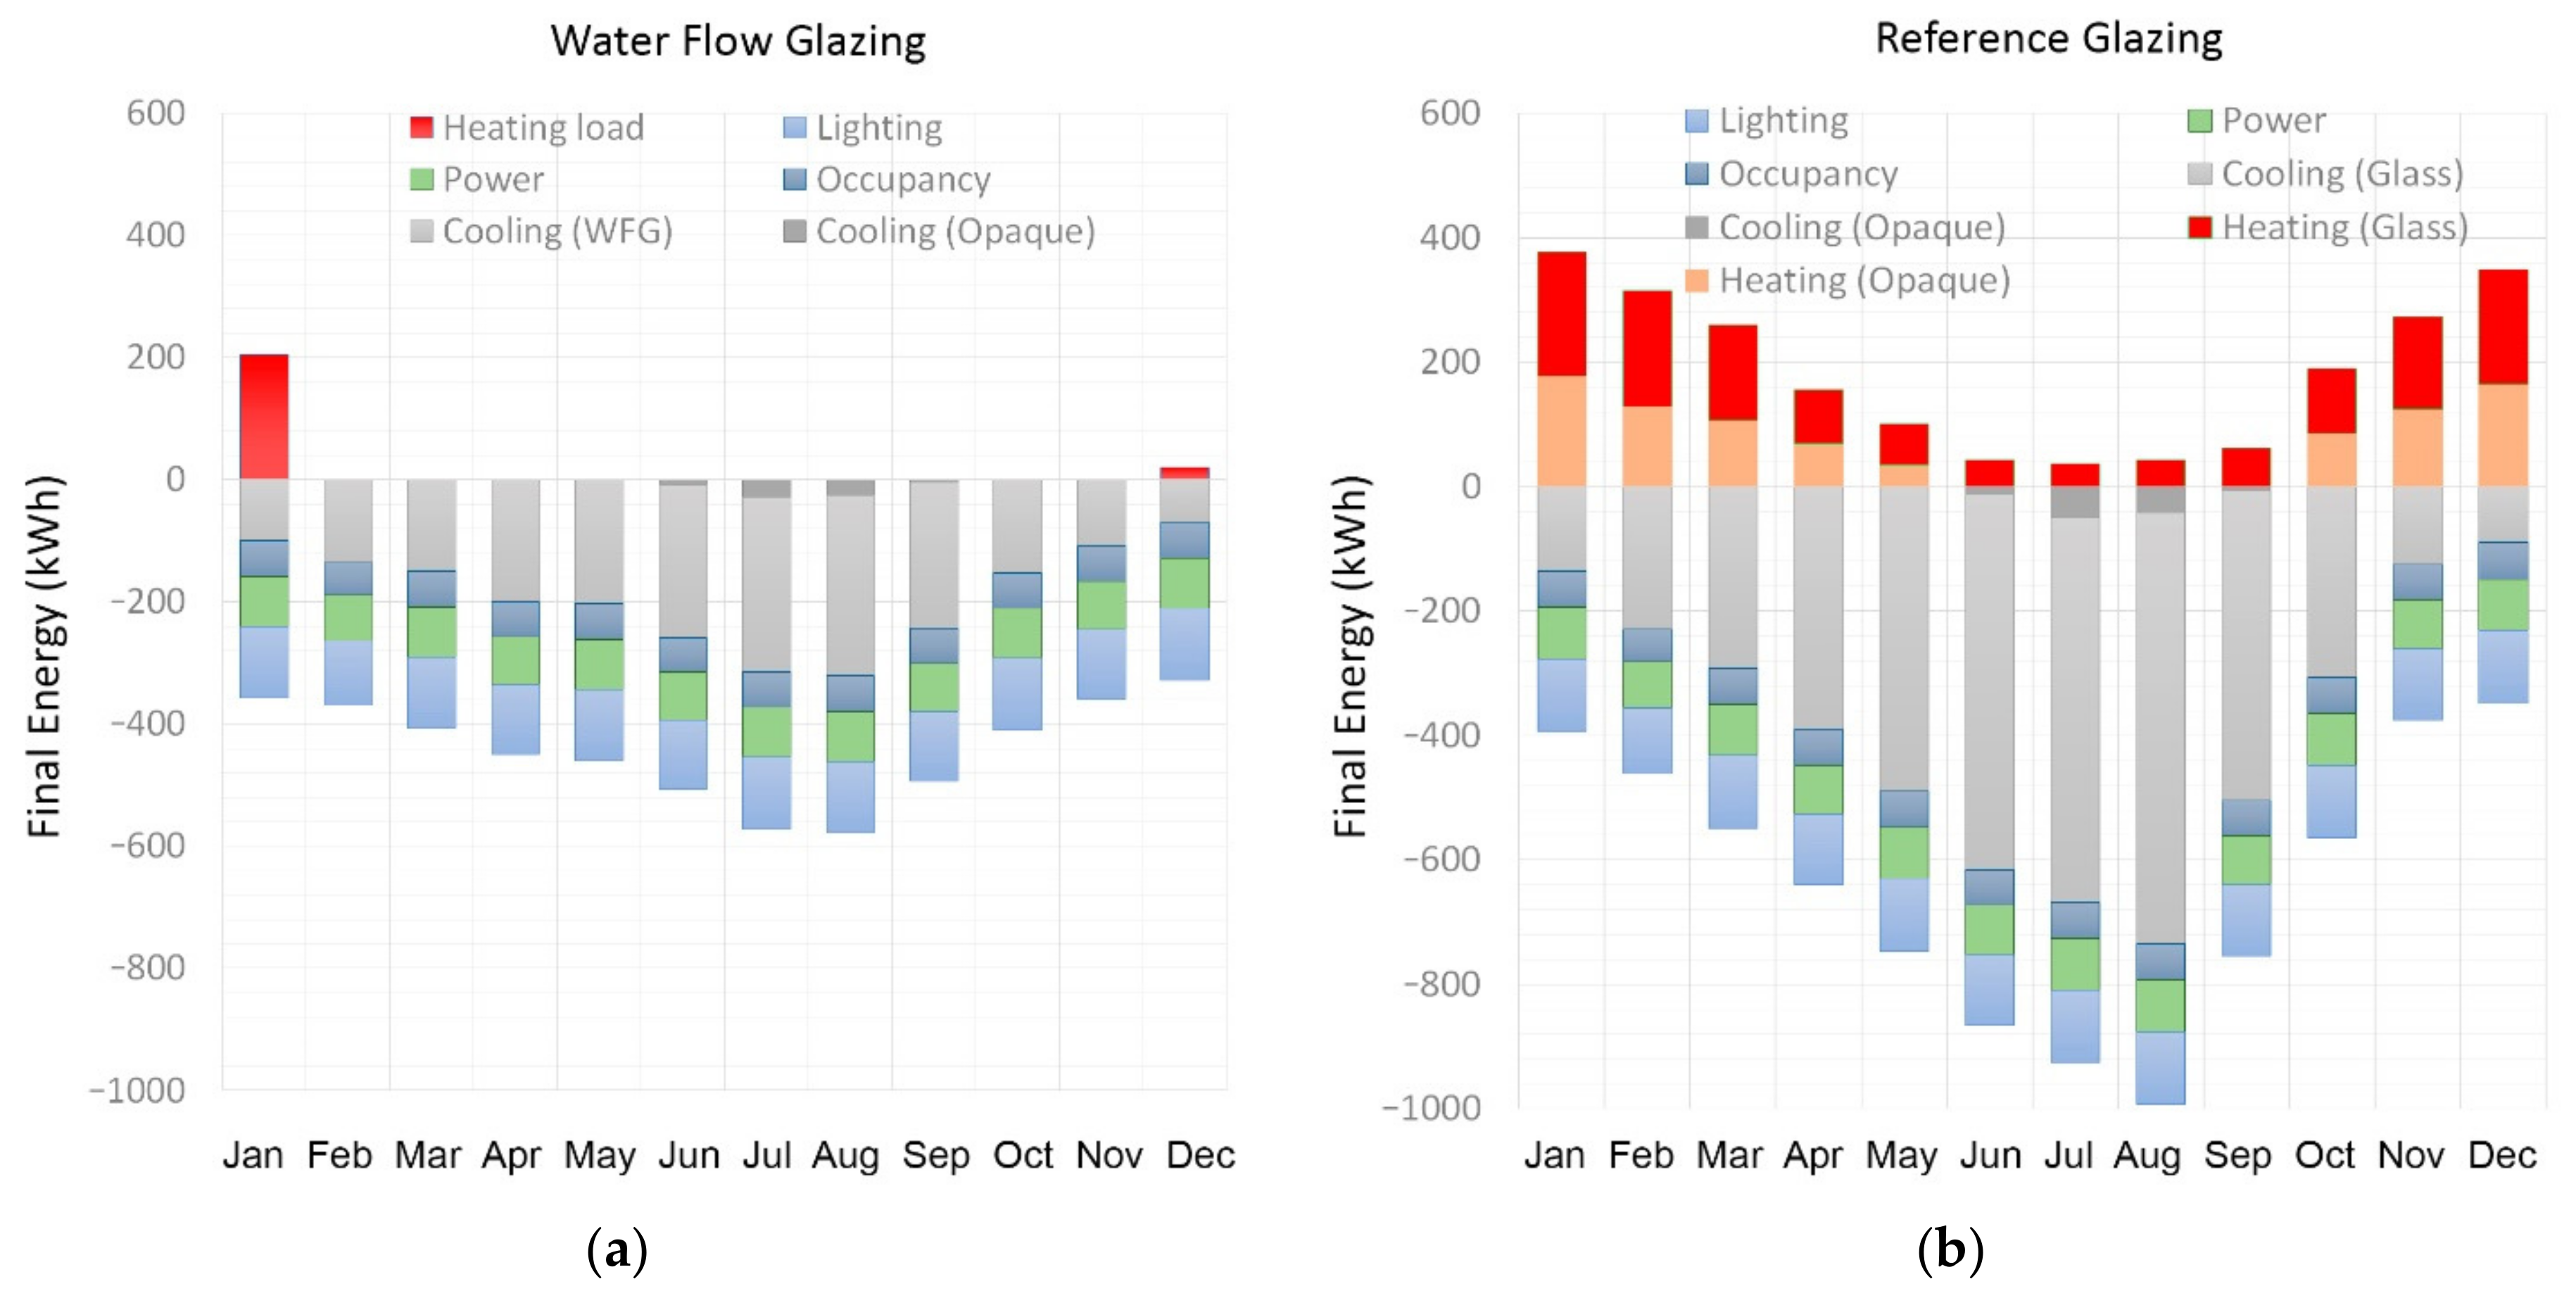
Figure 7 demonstrates the total loads per month, with lighting and power being considered the same in both prototypes. For the Water Flow Glazing structure, most of the heating loads were covered by heating the water in the WFG panels, heat storage in the buffer tank, and finally heat delivery by indoor WFG panels acting as traditional radiators. The coefficient of performance (COP) for the WFG water-to-water heat pump was 5.4, while the water-to-water heat pump’s energy efficiency ratio (EER) was 6. Meanwhile, with the traditional reference cabin, energy consumption was much higher as compared to the WFG facility. In the reference cabin, the COP of air-to-water heat pump was 3.5, whereas EER of air-to-water heat pump was 4. The significant reduction in electricity consumption becomes especially apparent when viewing the total electrical loads of the reference glazing, 1000 kWh, compared to 575 kWh in the WFG prototype during August.
The National Renewable Energy Laboratory PVWatts Calculator [
48] was used to estimate the power production of the building integrated PV panels installed on the roof and the south facade. The goal was to maximize Alternating Current (AC) energy production, reducing the energy supplied to and from the electrical grid.
Table 5 summarizes the two options that were apparent to the authors of this text. Option 1 was 8.3 m
2 of building integrated PV panels on the south façade. Additionally, there would exist an extra 15 m
2 of open-rack PV panels on the roof that would maintain a 60° tilt. Option 2 would be 15 m
2 open-rack PV panels with a 30° tilt, with an additional 15 m
2 of panels with a tilt of 60° on the roof. The AC production of each of these options is higher than the electric demand shown in
Figure 7. In January, the demand was 563 kWh, while the production was 276 kWh for option 1 and 245 kWh for option 2.
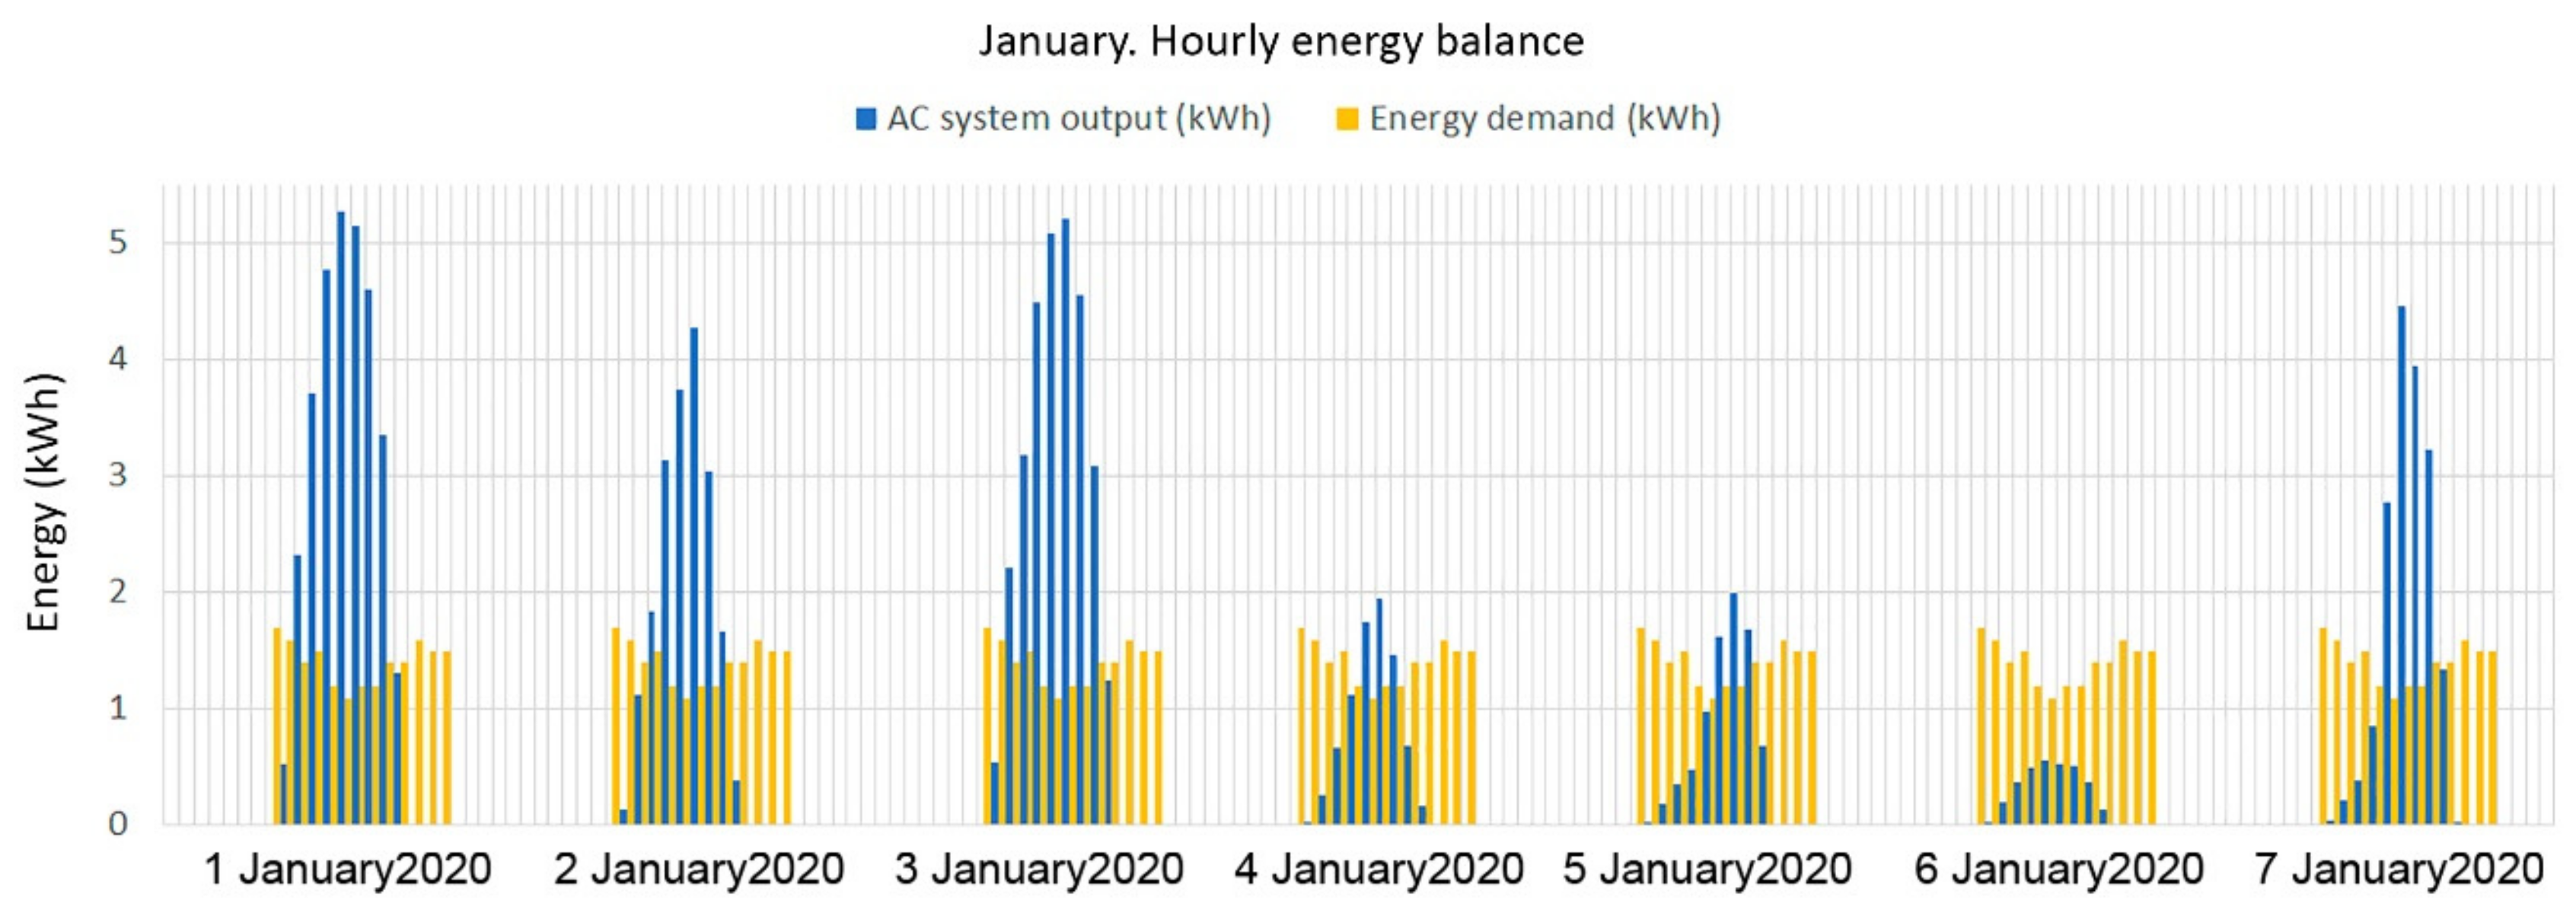
Figure 8 demonstrates the hourly energy balance during the seven days of January. The differences in solar radiation observed on different days were due to the impact of different factors on the PV system performance, such as temperature, wind, and the reduced sun hours in January. On sunny days the peak PV production surpassed 5 kW at noon, whereas the demand was almost steady at 1.3 kW every hour. Meanwhile, on cloudy days the system produced more than 1 kW every hour, with the demand continuing to be steady at 1.3 kW every hour.
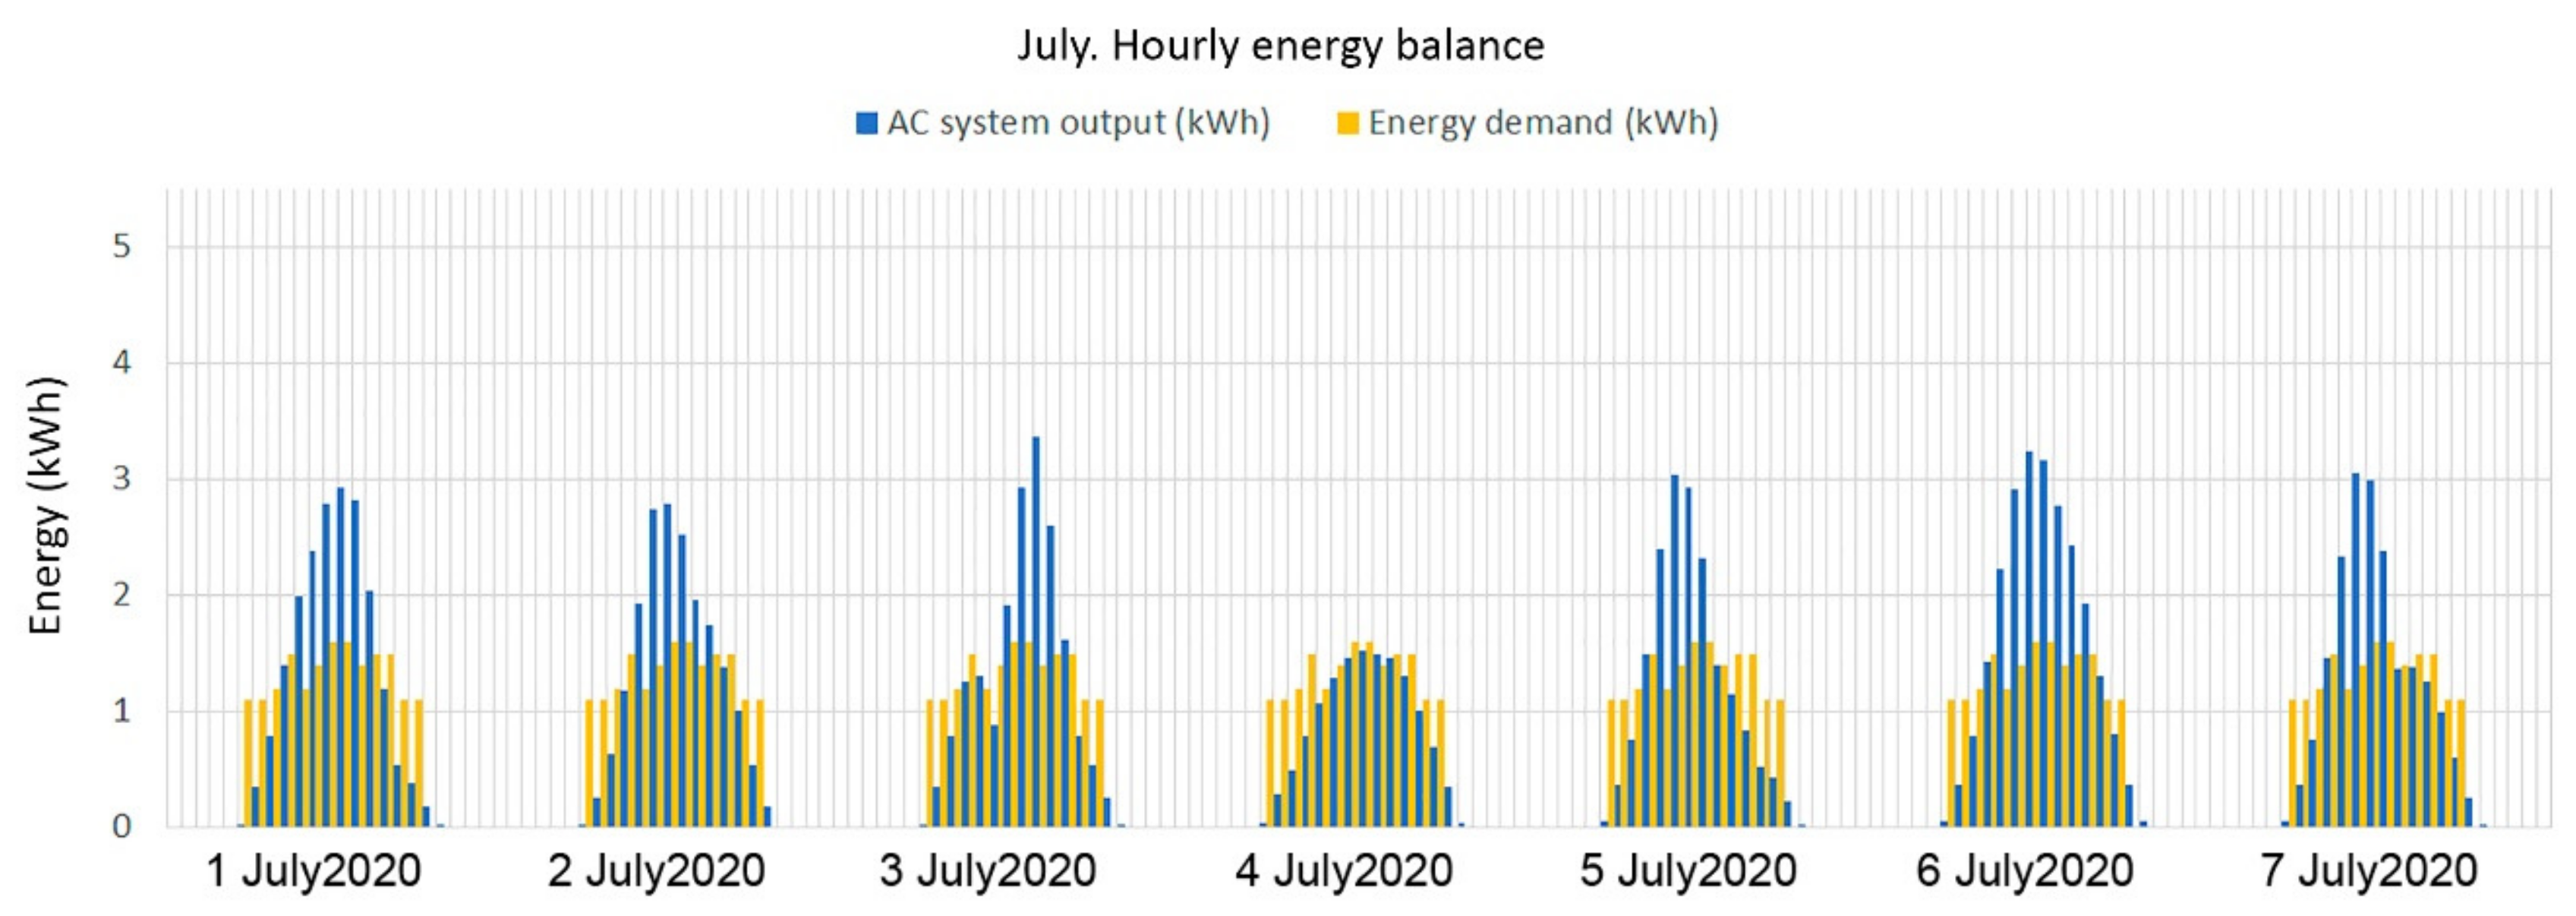
Figure 9 shows the hourly energy balance during seven days in July. The PV yield is almost the same throughout the entire period. Peak production during the central hours of the day surpassed the demand.
5. Conclusions
This paper aimed to develop a comprehensive comparative analysis from the operating energy, global warming potential, and economic point of view, of two different technologies. This study measured real data of a small office building located in Sofia, Bulgaria to understand the thermal behavior of a structure using WFG panels. This energy system also included a PV system connected to the grid to provide electric energy for heating, cooling, lighting and power supply. In addition to the water flow glazing panels and the PV array, the proposed building-energy system layout also includes radiant panels that delivered the necessary heating and cooling loads. Electrical heat pumps are also modelled for backup heating and for balancing the system cooling demands.
In order to validate the energy savings and the reduction on global warming potential, the water flow glazing facade has been compared with a high-performance triple glazing one. This analysis showed that the selected water flow glazing system coupled with a water-to-water heat pump improves the performance of highly efficient triple glazing. Coefficient of performance and energy efficiency ratio of water-to-water heat pumps are usually higher than air-to-water or air-to-air heat pumps. WFG system, as compared to the reference prototype, has demonstrated actual savings of 60% in non-renewable primary energy consumption with a 62% reduction of CO2 emission.
WFG panels can work as integrated solar thermal collectors. This article has shown that water heat gain throughout the year compensate for 86% of the prototype’s heating loads. To maximize water heat gains in the southern orientation, the water flow glazing was chosen to have a low reflectance and a high absorptance of near-infrared radiation. This absorptance causes a high heat gain leading to increasing temperatures in the fluid medium in the WFG panels. In southern and western elevations, a high reflectance panel has been selected to avoid overheating in summer.
The goal of zero-energy building was achieved first, by reducing the heating and cooling demand and second, by implementing a PV array.
Due to the high emission potential of some PV panel components such as Silicon and Lithium, manufacturing PV panels has also a global warming potential This article has compared the CO2 emissions of manufacturing the PV system with the emissions over the operating lifetime. It was found that in three years the reduction in CO2 emissions compensate for the initial manufacturing emissions of the PV array.
Two factors have been used to assess the economic aspects of a PV system, the Yield factor (YF) and the Levelized Cost of Energy (LCOE). This study has not included SELL and BUY.
Option 1 included integrated PV panels on a vertical façade. This option has shown a yield factor of 1247 (kWh/kWp), which was 21% more than option 2.
Levelized Cost of Energy (LCOE) has shown to be dependent on the discount rate. Option 1 has shown a better LCOE ranging from 4.35 €/kWh to 8.68 €/kWh with discount rates of 2% and 4% respectively.
Combining water flow glazing facades and building integrated PV panels can reduce the energy demand and produce renewable energy (thermal and electrical) within the building footprint. However, the proposed system has limitations and room for improvement. The primary disadvantage is the capital cost required for initial implementation. Seasonal thermal storage systems are necessary to use the excess heat produced by the WFG façade. Office buildings have low hot water consumption, and much thermal energy is wasted in summer. Increasing the volume of buffer tanks may lead to achieving seasonal storage, although it will increase the energy system’s cost. Building Integrated Photovoltaic panels (BIPV) are negatively affected by several factors in the outdoor environment, such as temperature variations and variable solar irradiation. More prototypes in various climate zones should be analyzed. Another future research line is the assessment of comfort. Traditional cooling systems focused on air movement have lacked comfort by blowing cold air instead of focusing on the mean radiant temperature through radiant elements such as floors, ceilings, and interior partitions. WFG can control the surface temperatures and provide an excellent thermal environment with indoor air temperatures outside the comfort range. Several difficulties and system misfunction must be discussed. WFG technology is hindered by a high initial expenditure that includes other required equipment. A storage tank is needed to avoid overheating in summer, and dimensioning this tank is of paramount importance to the correct performance of the system. WFG technology has to be implemented at the first stage of the design process to bring down the initial expense and payback period. The lack of reliable simulation tools for this technology might slow down the market adoption because of the many parameters that influence thermal performance in different orientations.


 ,
, 


