Article

Wind Turbine Tower Deformation Measurement Using Terrestrial Laser Scanning on a 3.4 MW Wind Turbine

Bremen Institute for Metrology, Automation and Quality Science, University of Bremen, 28359 Bremen, Germany
*
Author to whom correspondence should be addressed.
Energies 2021, 14(11), 3255; https://doi.org/10.3390/en14113255
Submission received: 24 April 2021 / Revised: 21 May 2021 / Accepted: 26 May 2021 / Published: 2 June 2021
(This article belongs to the Special Issue Dynamic Testing and Monitoring of Wind Turbines)

Abstract

:
Wind turbine plants have grown in size in recent years, making an efficient structural health monitoring of all of their structures ever more important. Wind turbine towers deform elastically under the loads applied to them by wind and inertial forces acting on the rotating rotor blades. In order to properly analyze these deformations, an earthbound system is desirable that can measure the tower’s movement in two directions from a large measurement working distance of over 150 m and a single location. To achieve this, a terrestrial laser scanner (TLS) in line-scanning mode with horizontal alignment was applied to measure the tower cross-section and to determine its axial (in the line-of-sight) and lateral (transverse to the line-of-sight) position with the help of a least-squares fit. As a result, the proposed measurement approach allowed for analyzing the tower’s deformation. The method was validated on a 3.4 MW wind turbine with a hub height of 128 m by comparing the measurement results to a reference video measurement, which recorded the nacelle movement from below and determined the nacelle movement with the help of point-tracking software. The measurements were compared in the time and frequency domain for different operating conditions, such as low/strong wind and start-up/braking of the turbine. There was a high correlation between the signals from the laser-based and the reference measurement in the time domain, and the same peak of the dominant tower oscillation was determined in the frequency domain. The proposed method was therefore an effective tool for the in-process structural health monitoring of tall wind turbine towers.

1. Introduction

Wind turbines must endure enormous loads, and their towers in particular are subject to periodic forces induced by the rotor motion and wind loads. The size of wind turbine plants has increased in recent years, which has not only increased the energy yield, but also the dynamic loads and deformations in the structure. Furthermore, the size of wind turbine plants has increased in recent years, which increases the energy yield, but also leads to greater dynamic loads on the structures [1]. Therefore, the measurement of the structural loads and, in particular, the dynamic tower deformations is even more relevant for the assessment and prediction of the condition and integrity of the plant (structural health monitoring) [2]. In addition, measurements of the actual tower deformation of real operating wind turbines are necessary to validate the respective wind turbine simulation models.
The largest deformation of the tower can be expected in the main flow direction. However, the wind load direction changes constantly due to varying wind conditions, while access to wind farms is often limited. As a result, a single sensitivity direction along the line-of-sight is not sufficient to evaluate the tower’s deformation. To fully characterize the tower movements of tall wind turbine towers with an earthbound device, a measurement approach is desired that allows the measurement of the movement in the axial (in the line-of-sight) and lateral (transverse to the line-of-sight) directions from a single observation direction. In addition, an approach is needed that does not modify the tower and can be used at measurement distances of more than 150 m.
One widely used method to measure the tower’s deformations is the use of strain gauges and accelerometers installed inside the wind turbine tower [3]. However, they can only provide information about the tower movement at discrete locations. Furthermore, these sensors need to be installed inside the tower at the desired height, which is not always possible due to limited plant accessibility and requires great effort.
Therefore, several attempts have been made to monitor the tower’s deformations in a contactless manner from larger distances using optical methods. Laser-Doppler vibrometry [4,5] achieves this by pointing a laser beam at the tower and measuring the frequency and phase change of the returned signal triggered by the target’s vibrations. However, the installation of reflective markers on the plant and, thus, a modification of the tower are needed. Furthermore, the tower’s movement can only be studied in the measurement direction. Another investigated optical method is photogrammetry [6,7], where the three-dimensional coordinates of the tower are determined from multiple two-dimensional images taken from different positions and orientations. By using edge or pattern detection, this method can be applied without a modification of the tower; however, multiple measurement accesses are needed to measure the two-dimensional motion of the tower.
Terrestrial laser scanning (TLS) is a known technique to monitor the deformation of large-scale objects from a single access point, without the need for reflective markers, from a measurement distance of over 150 m. TLS has been used to study the deformation of, for example, bridges, dams, and towers [8,9]. Schill and Eichhorn [10], Mitka et al. [11], as well as Artese and Nico [12] applied TLS to study the deformation of a wind turbine tower. They used laser scanners in line-scanning mode, scanning vertically along the tower axis. However, the tower’s deformations and the respective bending modes and eigenfrequencies of the tower were measured only in the axial direction. In addition, both studies were carried out on relatively small towers with a height of less than 70 m. A TLS-based measurement approach to acquire the two-dimensional tower deformation in the axial and lateral directions, as well as the application of TLS on taller wind turbine towers has not been reported yet.
For this reason, an enhanced TLS-based measurement approach was proposed to evaluate the tower deformations in the axial and lateral directions from a single observation direction. This was achieved by scanning the tower horizontally and extracting the minimum position of a least-squares curve fit for each scan of the tower cross-section. Note that the axial and lateral movement of the tower is currently only measured at one height of the tower at a time, while the principle of the measurement approach can be straightforwardly adopted for the scanning at multiple height positions with an appropriately designed scanning unit of the TLS sensor. To demonstrate the TLS measurement capabilities in particular for wind turbine towers taller than 100 m, a respective in-field experiment on a real wind turbine with a hub height of 128 m was performed using horizontal, as well as vertical scanning, and the tower’s contour line was investigated.
First, the measurement principle and the experimental setup are explained in Section 2 and Section 3, respectively. The TLS measurements with horizontal and vertical scanning were performed on a real wind turbine in operation with a hub height of 128 m. As a reference, the nacelle’s two-dimensional movements were measured with a video observation of the nacelle by placing the camera at the bottom of the plant facing upwards and using point-tracking software. In order to validate the TLS-based measurement results, they are compared with the reference data in Section 4. In addition, the measured contour line of the tall wind turbine tower is presented, and the respective measurement capabilities are discussed. A summary of the findings and an outlook then follows in Section 5.

2. Measurement Principle and Methodology

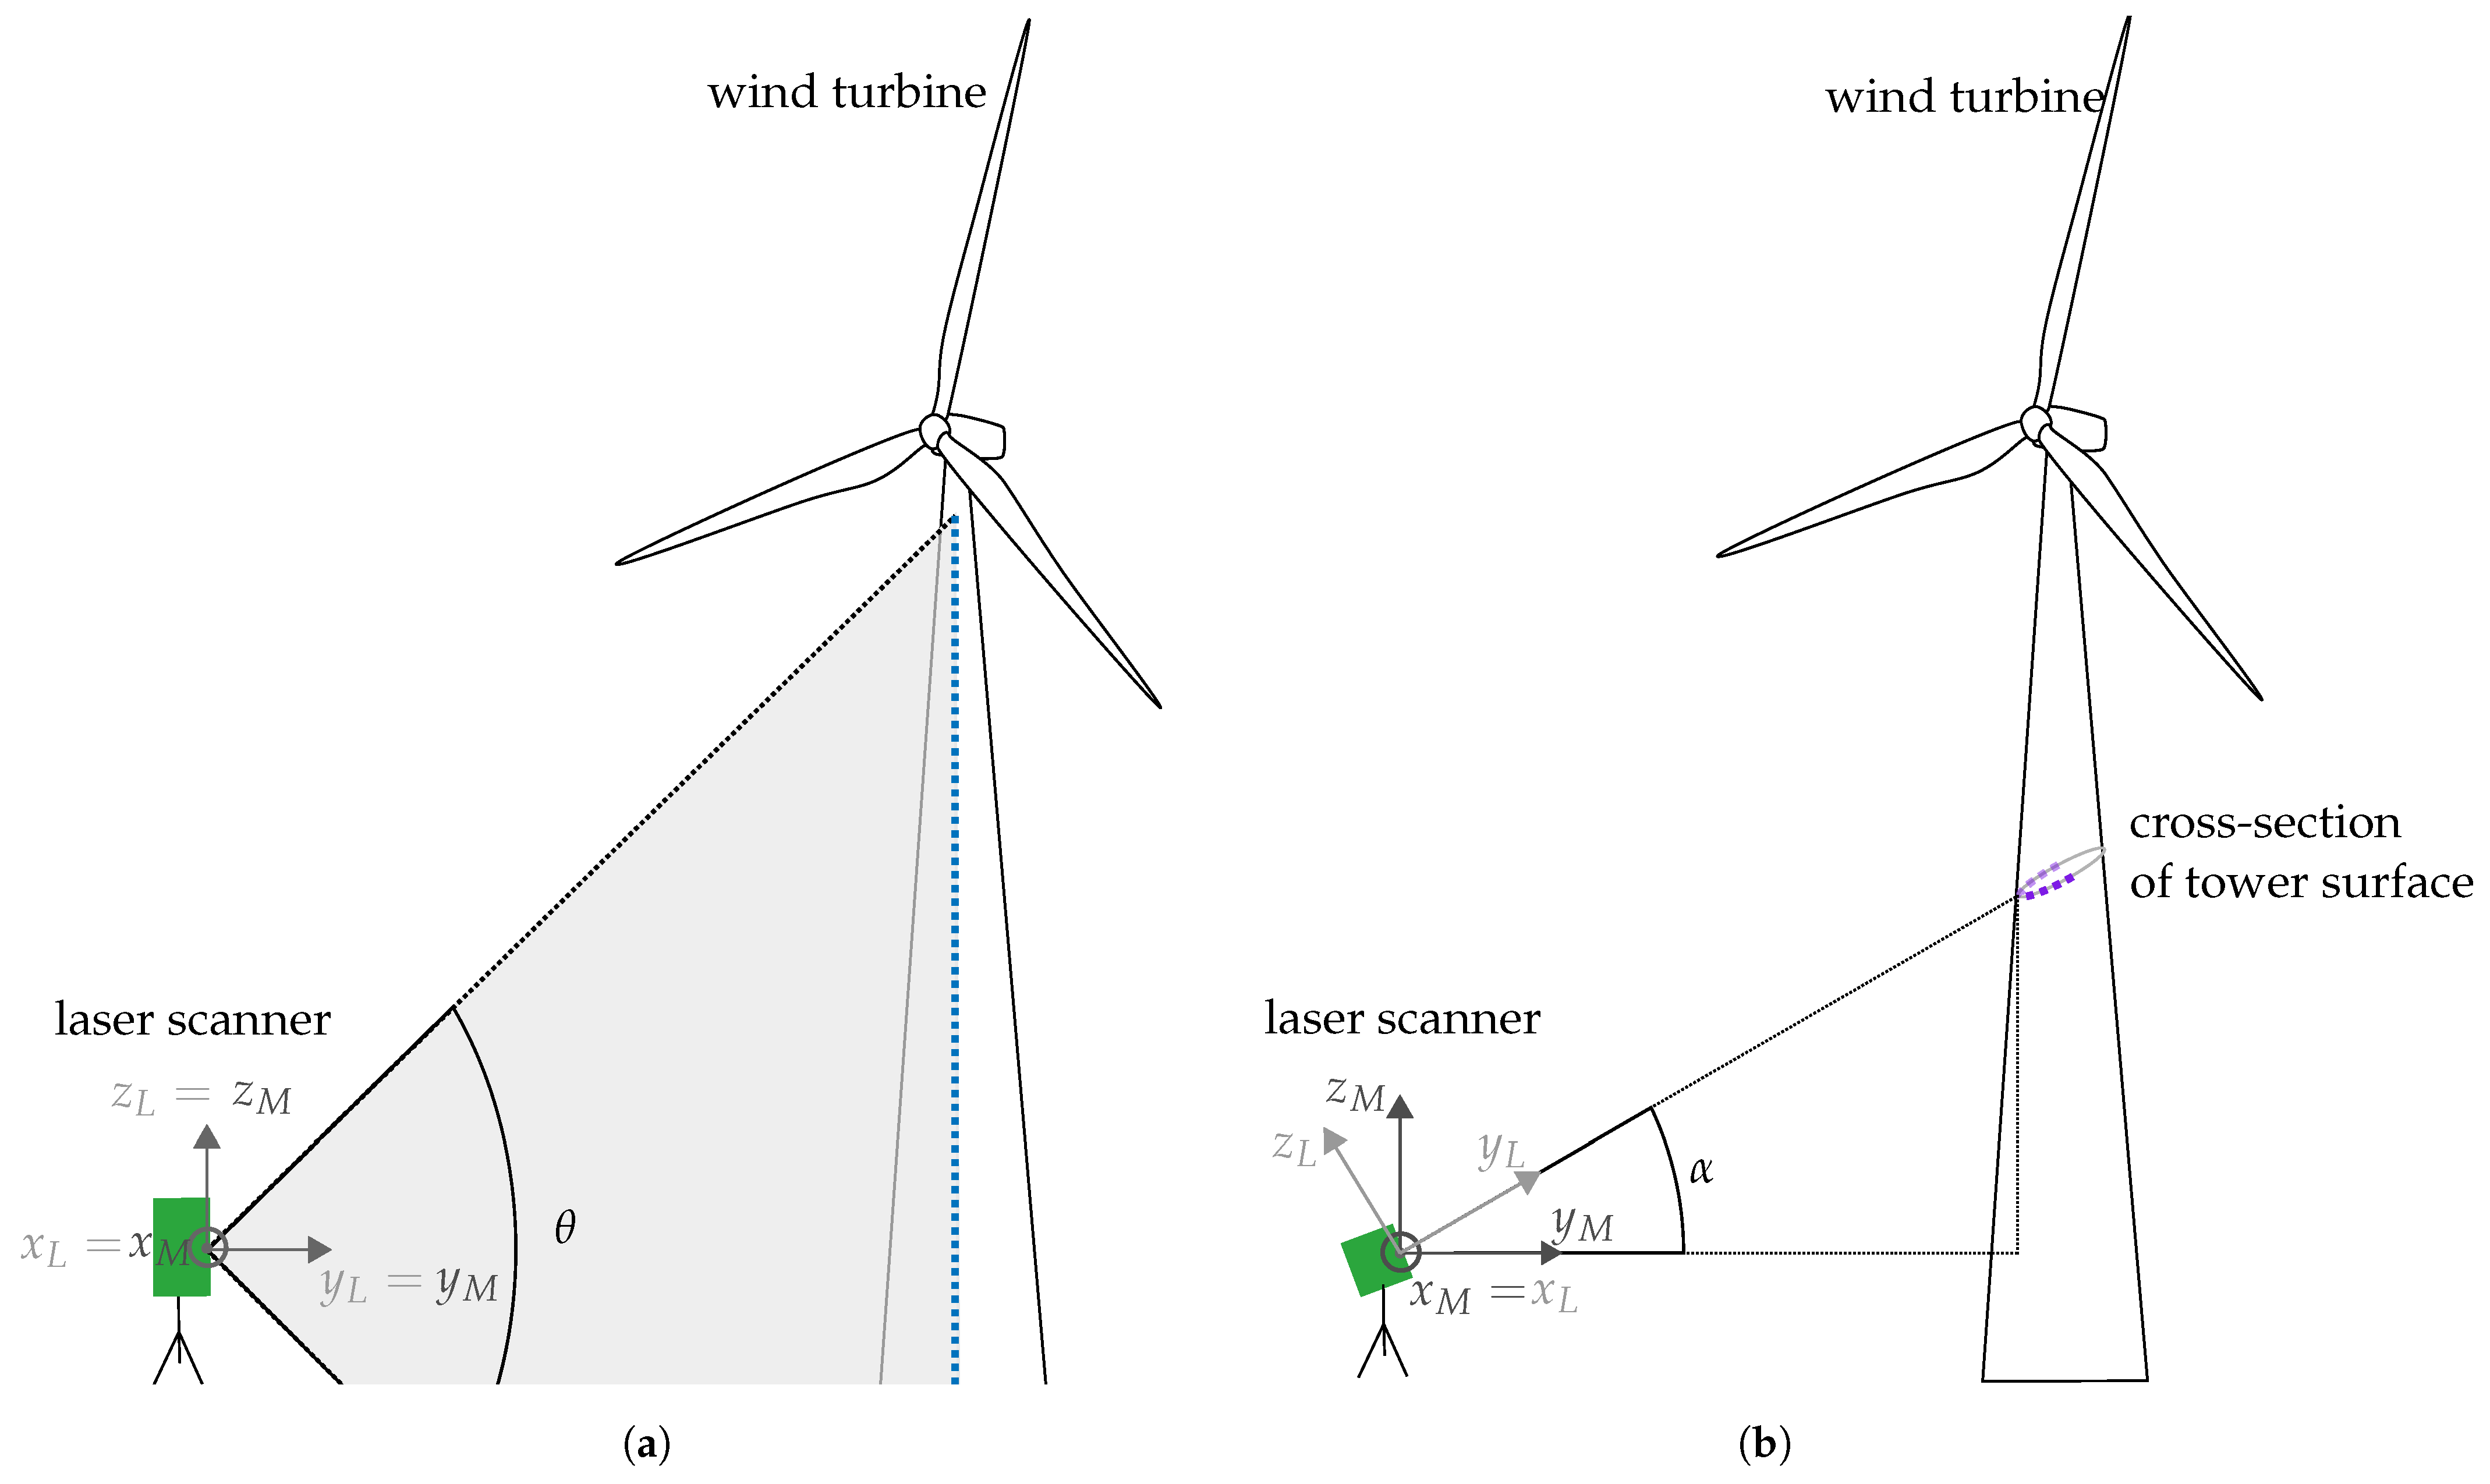
2.1. Measurement Principle of the Laser Scanner
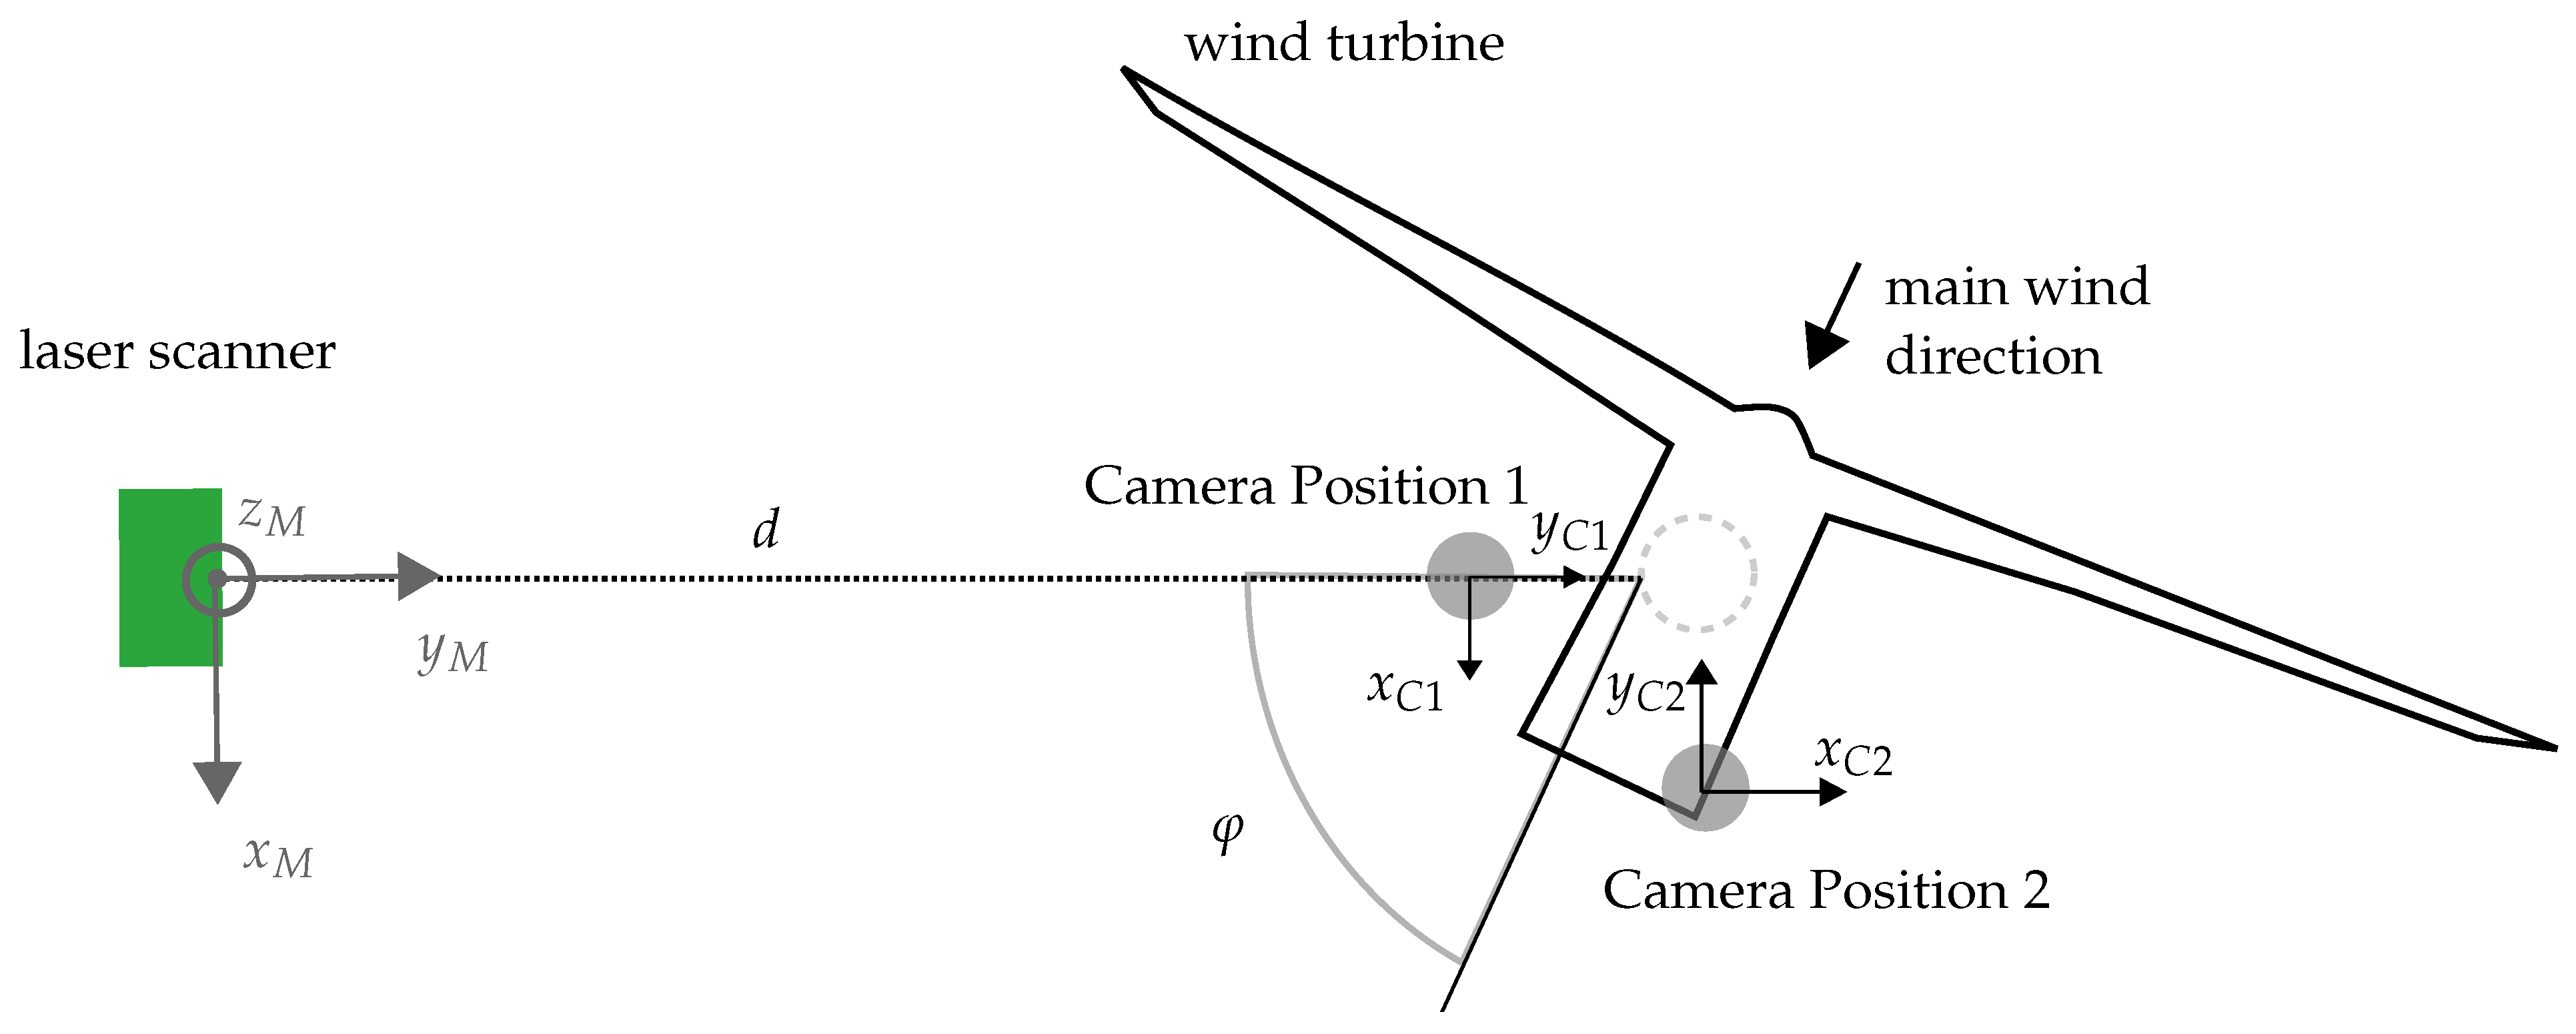
Terrestrial laser scanning (TLS) measures a distance s with the time-of-flight (ToF) principle: Pulsed laser spots are emitted, and the time t it takes for the light to reach the target and return to the laser scanner is measured. With the speed c of light, the distance s can then be calculated from the following equation:
s = c · t 2 .
Terrestrial laser scanners in line-scanning mode have a rotating mirror that scans the emitted laser beam over a set scan angle θ with N incremental steps. With the measured distances s ( n ) , n = 1 , . . . , N , and the known angular step width Δ θ = θ / N , the measured tower surface points were first obtained in polar coordinates and were then transformed to two-dimensional Cartesian coordinates.

2.2. Methodology

The tower movement was analyzed with a horizontal and a vertical alignment of the laser scanner with regard to the tower axis. A sketch of both measurement arrangements is shown in Figure 1.

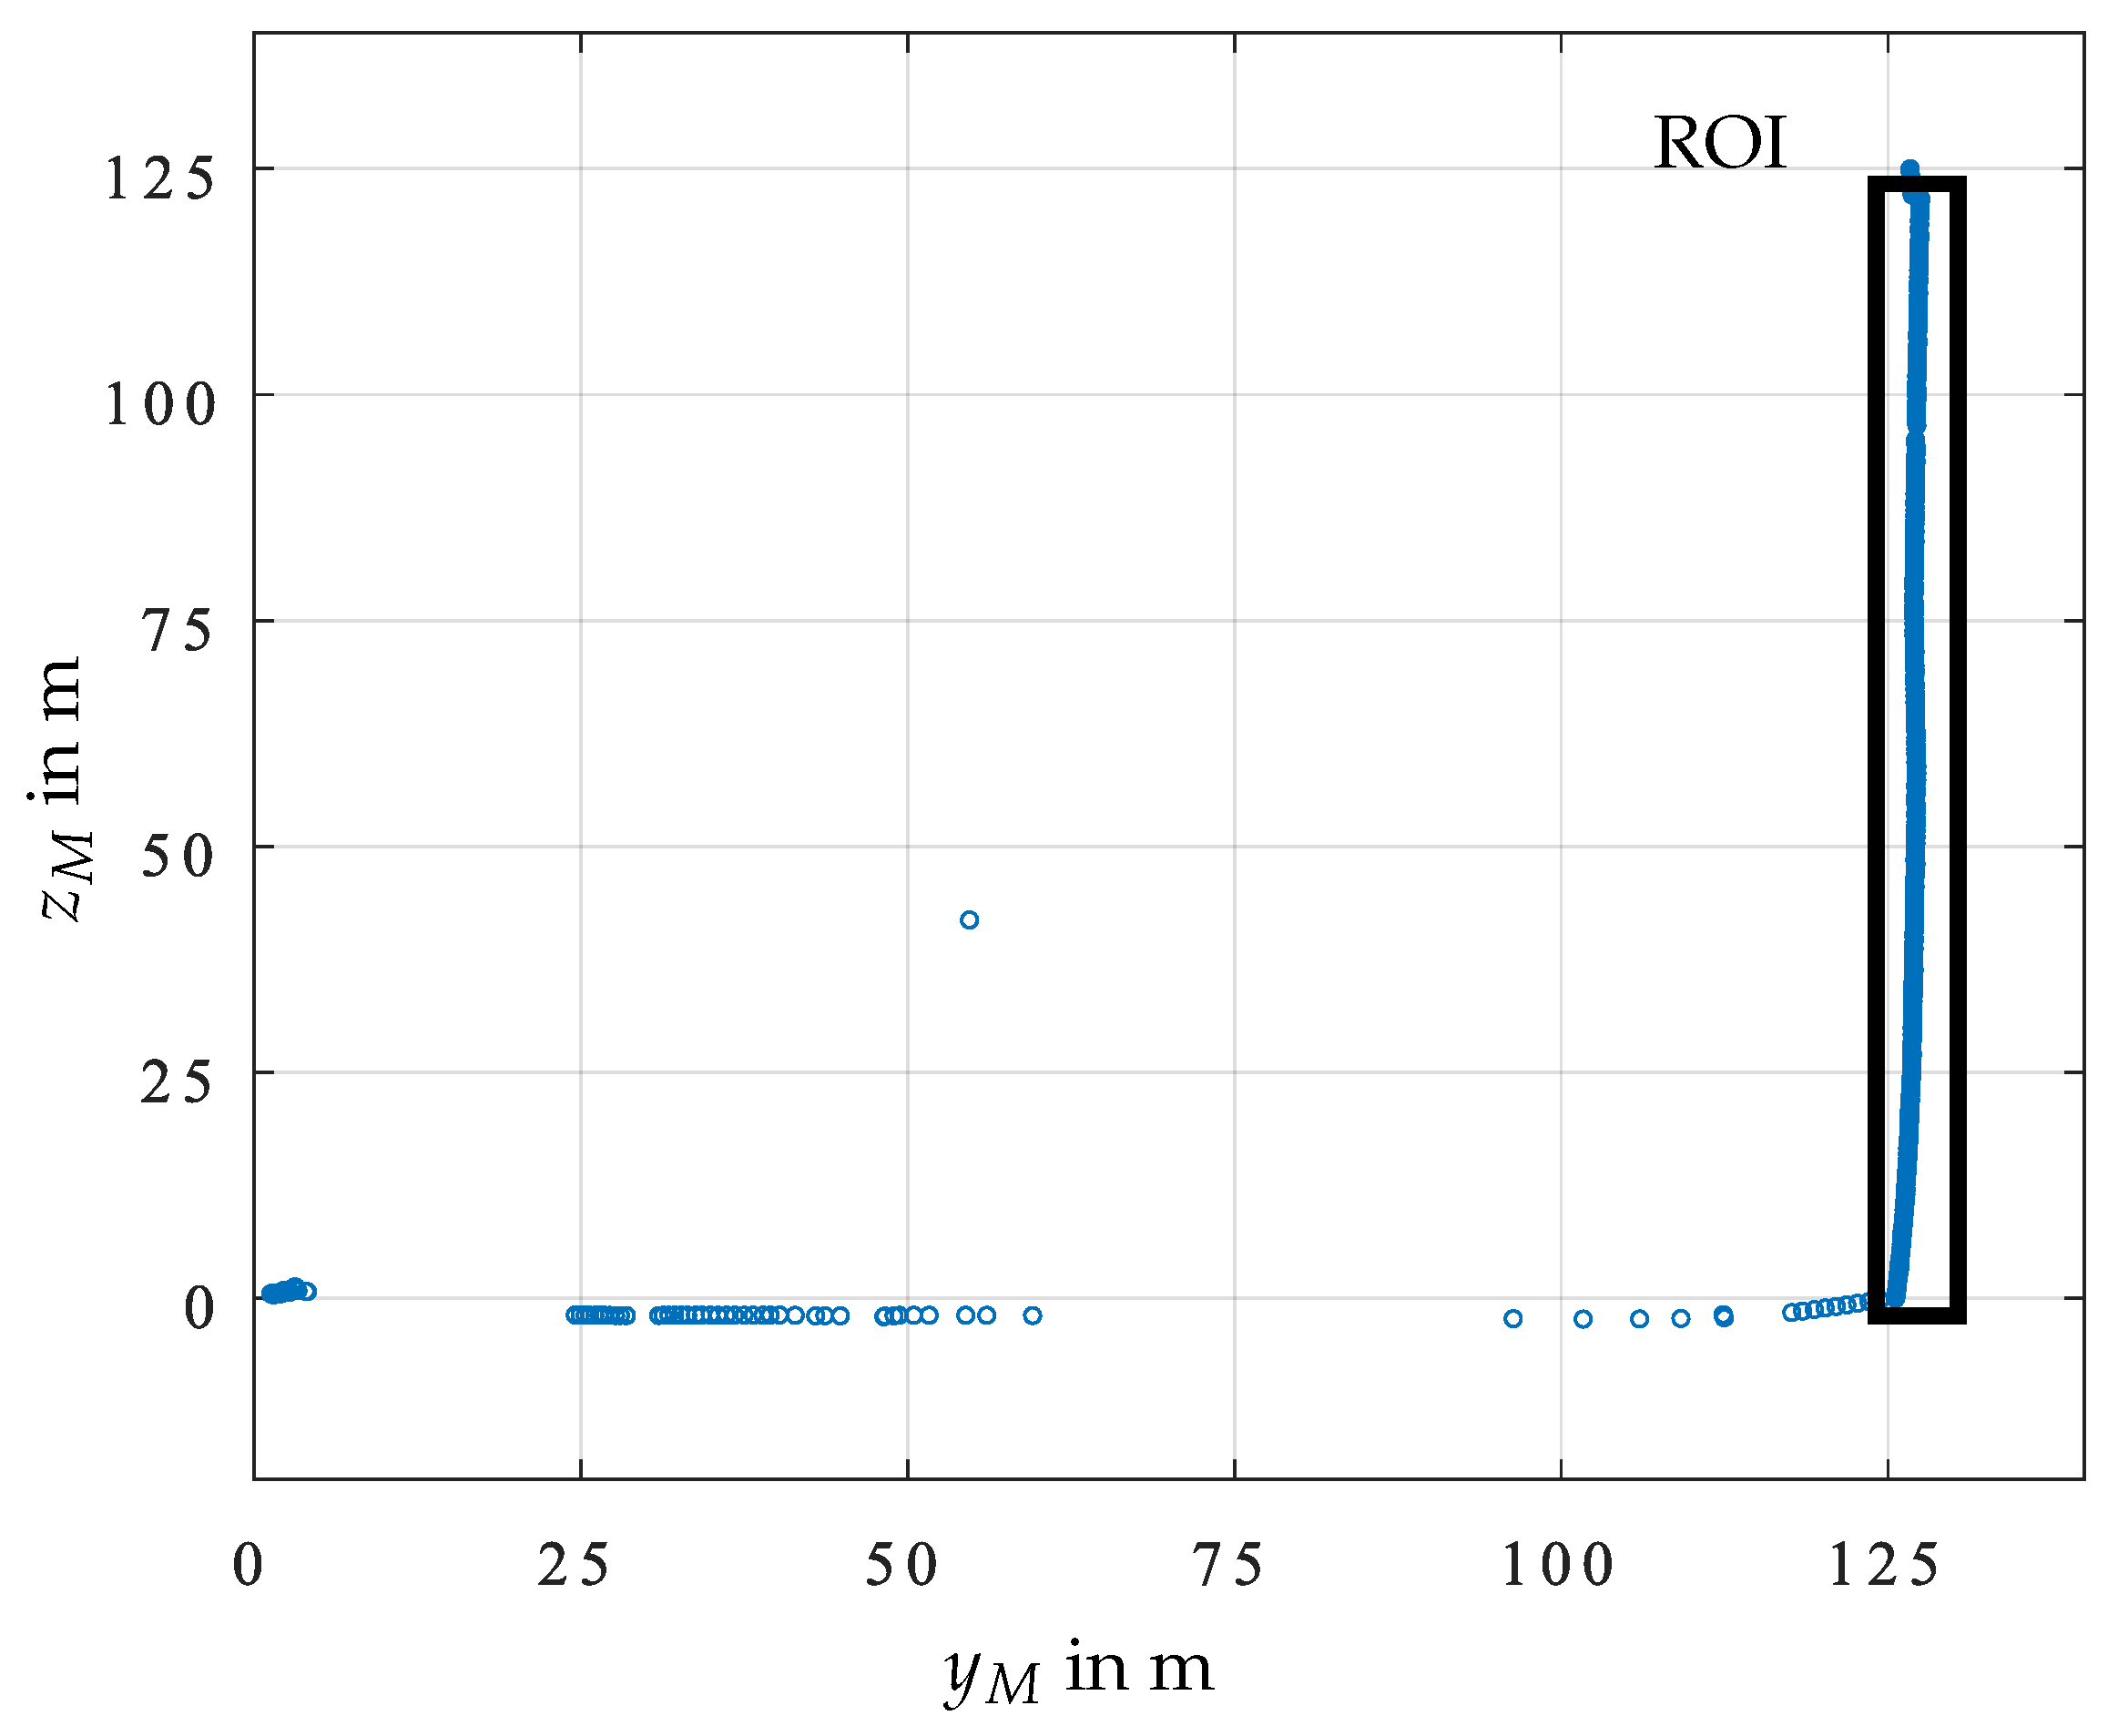
2.2.1. Vertical Laser Alignment

To determine the vertical contour line of the tower’s surface, from now on described as the tower’s contour line, a measurement was taken by aligning the laser scanner vertically with regard to the tower. This allowed describing the tower at all heights. A side view of this setup is shown in Figure 1a with the fixed scan angle θ . The laser coordinate system ( x L , y L , z L ) , in which the data were collected, was identical to the measurement coordinate system ( x M , y M , z M ) . The scan was performed in the y L z L plane and x L = x M = 0 . The points corresponding to the tower surface were extracted from all recorded measurement points by manually defining a region of interest (ROI); see Figure 2.

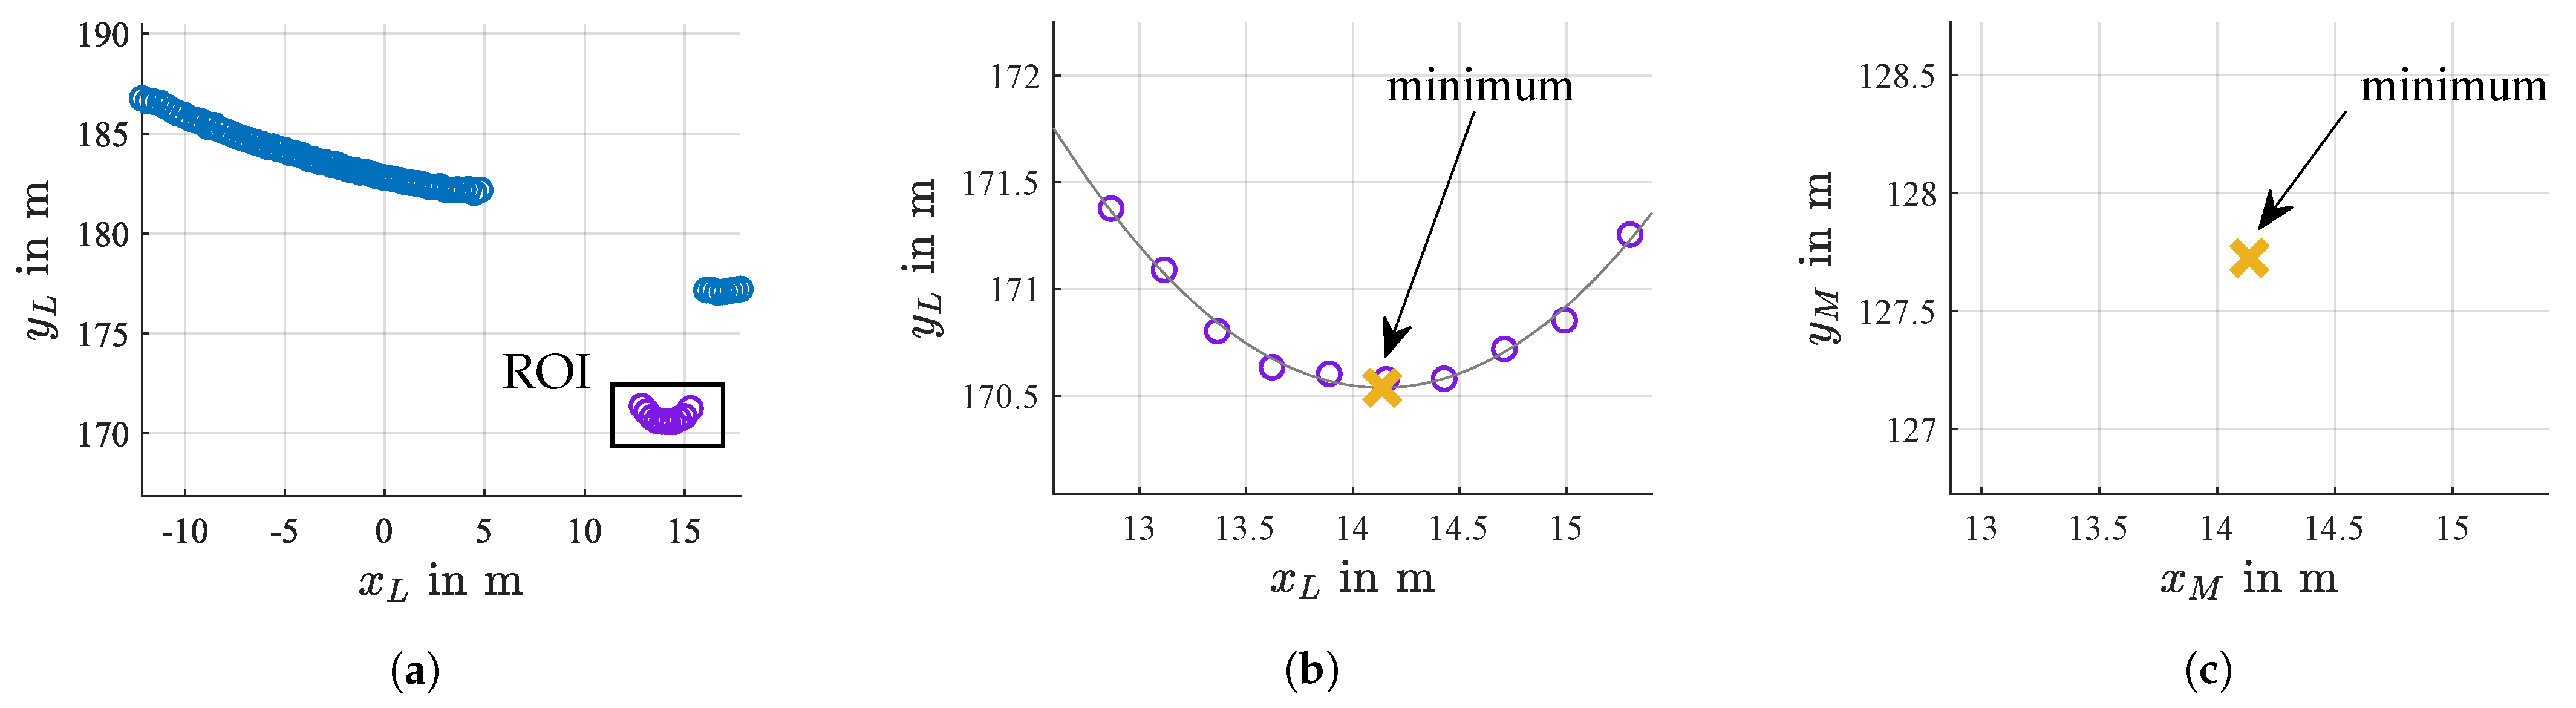
2.2.2. Horizontal Laser Alignment

In order to analyze the tower movement in the axial direction (in the direction of measurement, y M ) and the lateral direction (transverse to the direction of measurement, x M ), the laser scanner in line-scanning mode was aligned horizontally with regard to the tower. In Figure 1b, a sketch of the setup is shown, with the laser scanner tilted upwards with the inclination angle α . The data points were collected in the laser coordinate system ( x L , y L , z L ) , with z L = 0 . Figure 3 shows the process of extracting a representative tower surface point from the data set and its transformation to the coordinate system ( x M , y M ) :
For each scanned line, the cross-section of the tower at one tower height was measured, and the points corresponding to the tower surface were extracted using a manually set region of interest (Figure 3a). Wind turbine towers are truncated cones, and the cross-section of a cone is an ellipse. However, due to the low amount of data points, fitting an ellipse led to large deviations from the actual shape [13]. Since an ellipse and a parabola are both conic sections with different eccentricities, the curve close to a vertex of an ellipse can be approximated with a parabola. The deviation further away from the vertex can be neglected here because the focus was on finding a representative point for each data set and not fitting the shape perfectly.
Therefore, for each scanned line, a second-degree polynomial was fit through the data points using the method of least-squares, and the parabola minimum ( x L , min , y L , min ) was determined (Figure 3b). The minimum was the point of the scanned tower cross-section that was closest to the laser scanner, which was subsequently used to analyze the tower movement. For this application, the varying measurement location due to a bending of the tower in the line-of-sight direction (<1 m) can be neglected. In order to analyze the tower movement in the measurement coordinate system (Figure 3c), the minimum position that was obtained in the laser coordinate system was transformed to the measurement coordinate system as follows:
x M , min = x L , min ,
y M , min = y L , min · cos α .
The z M -coordinate was not used for the tower movement analysis during the horizontal laser alignment.
A sequence of the resulting minimum position over time was obtained by repeated scans, which finally enabled the study of the dynamic tower motion at the desired tower height in the time and frequency domain.

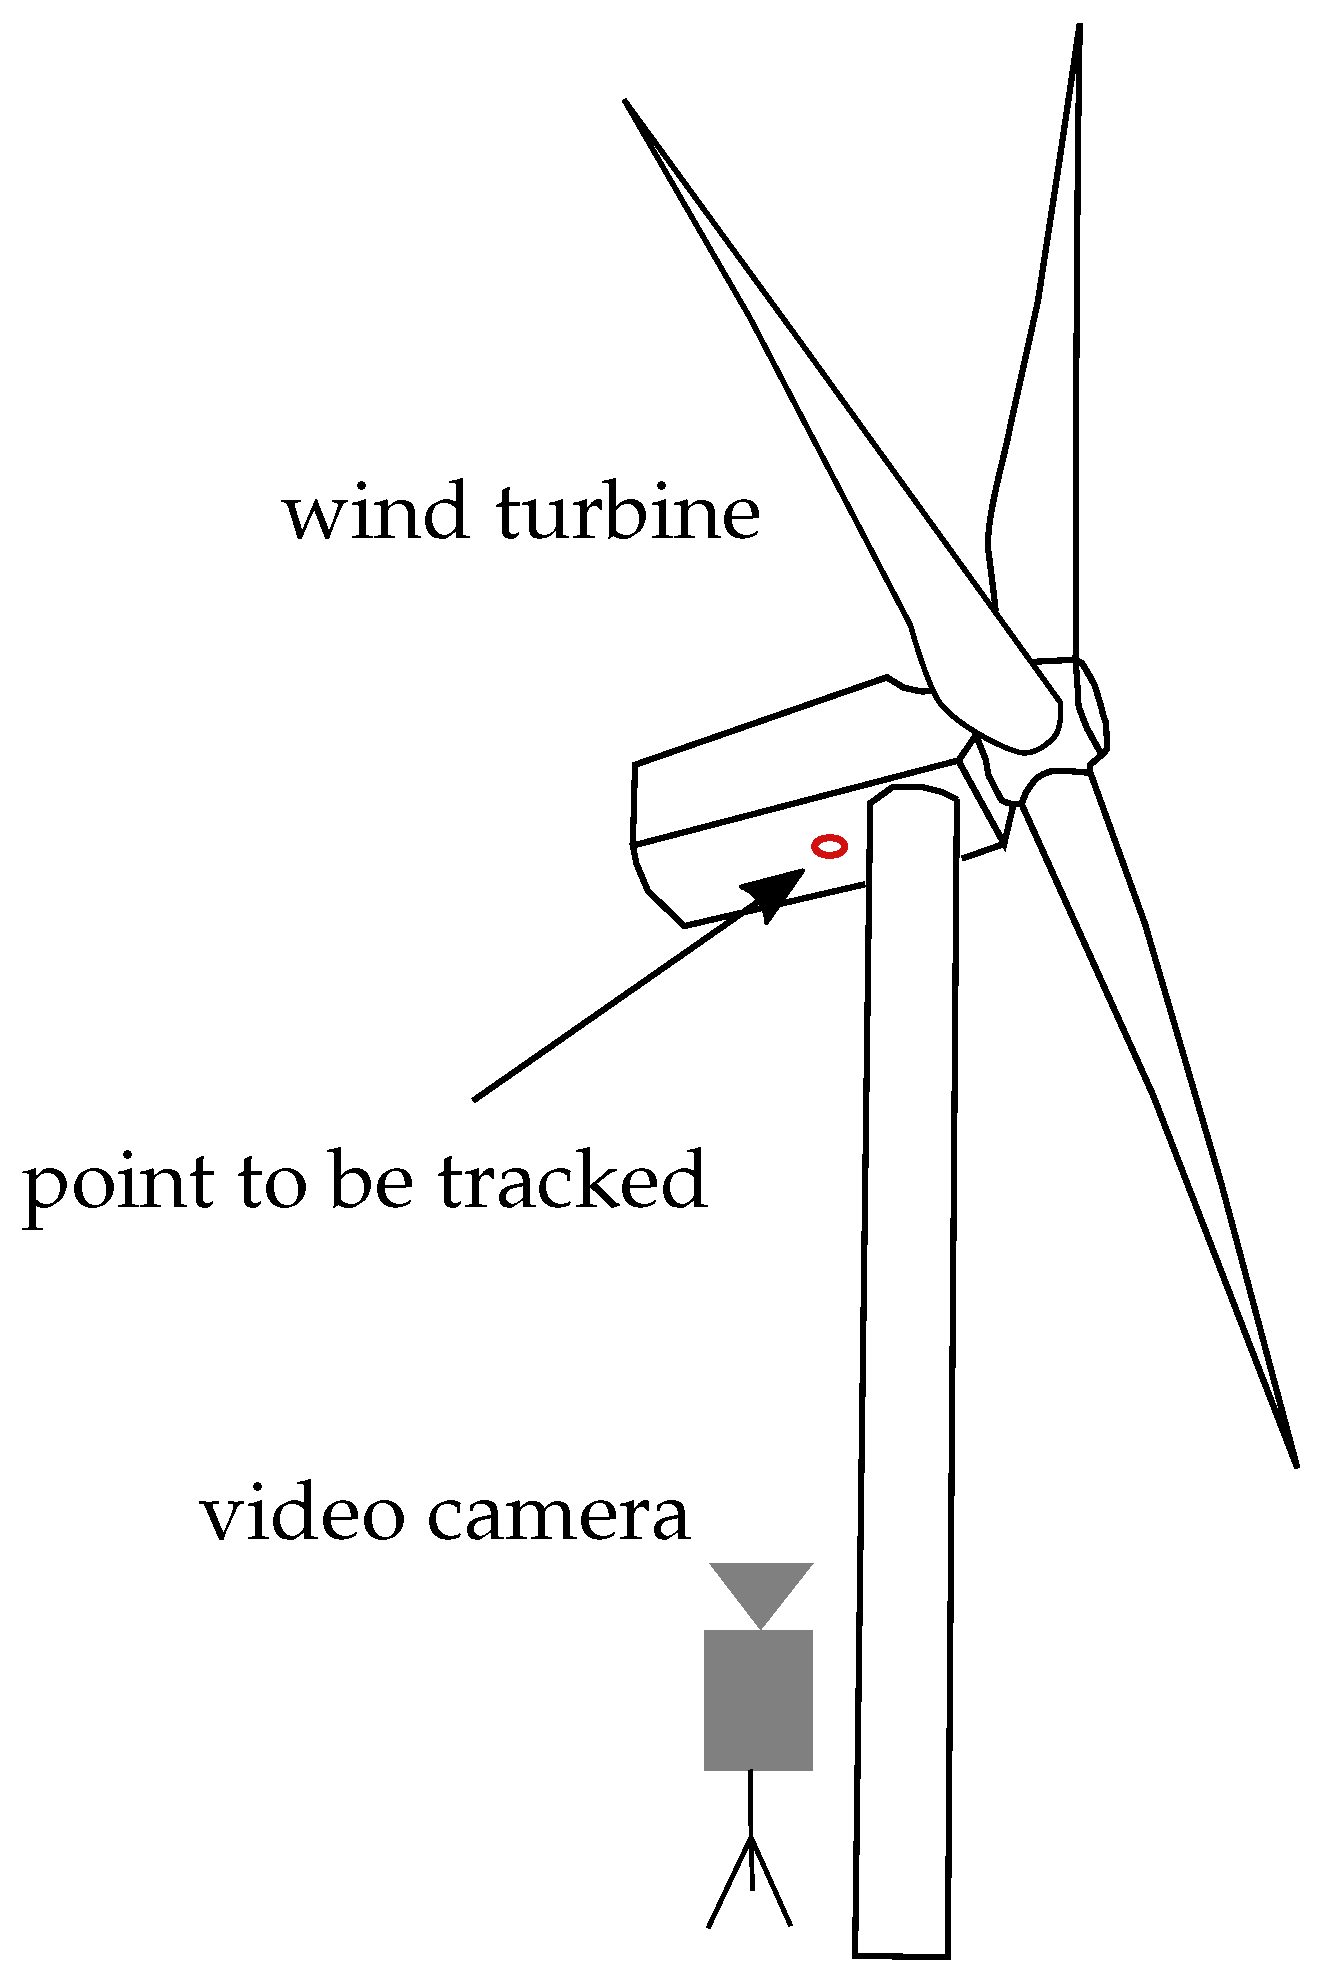
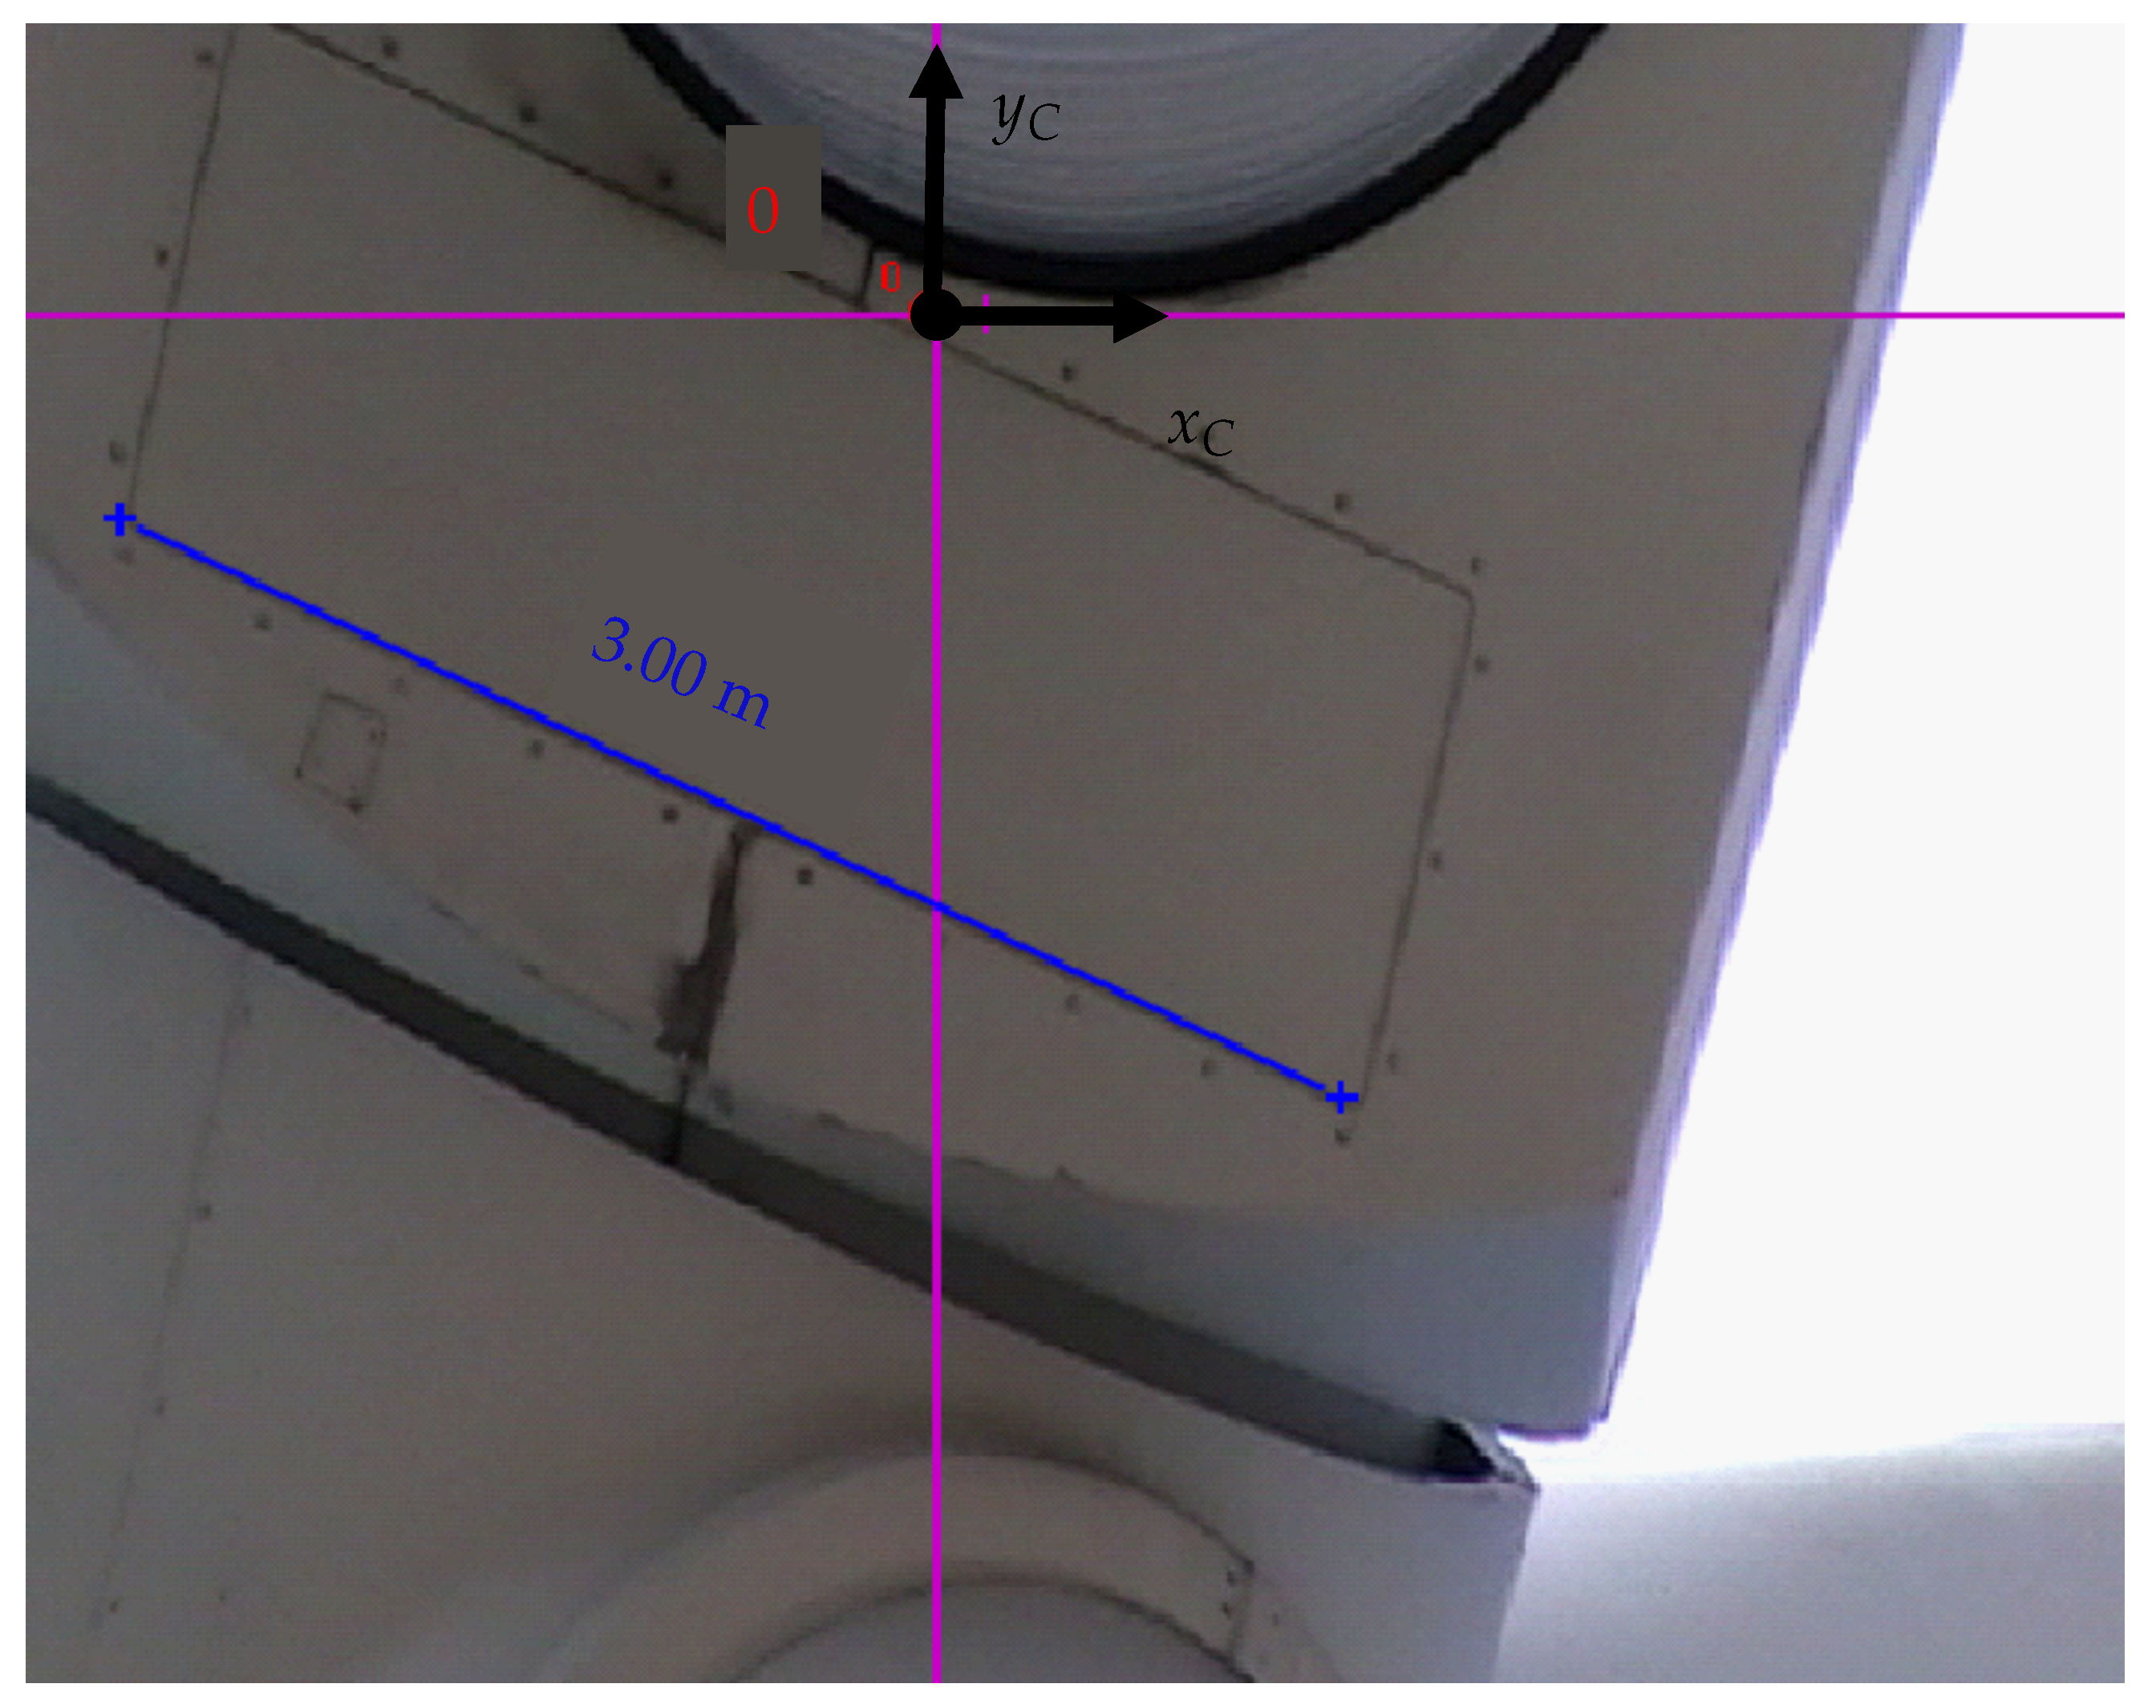
2.2.3. Reference Measurement for Tower Movement Using a Video Camera

As a reference measurement system for the analysis of the tower motion, a video camera was chosen, which was placed at the bottom of the wind turbine, recording the nacelle movement from below; see Figure 4. A point with a characteristic feature close to the tower on the nacelle was chosen (see Figure 5) and tracked over time using point-tracking algorithms.
A top-view of the measurement arrangement with the co-alignment of the video and the laser system for the horizontal laser alignment is shown in Figure 6. The laser scanner was placed at a distance d from the plant. Depending on the main wind direction during the measurement, there was a misalignment between the laser scanning direction and the fore-aft oscillations of the nacelle, which was described as the measurement angle φ . The camera was placed in one of two camera positions depending on the measurement angle φ to ensure that the camera had a full view of the nacelle. The nacelle positions were collected in the ( x C , y C ) coordinate system and then transformed to the laser coordinate system ( x M , y M ) . A time window without yawing was chosen.

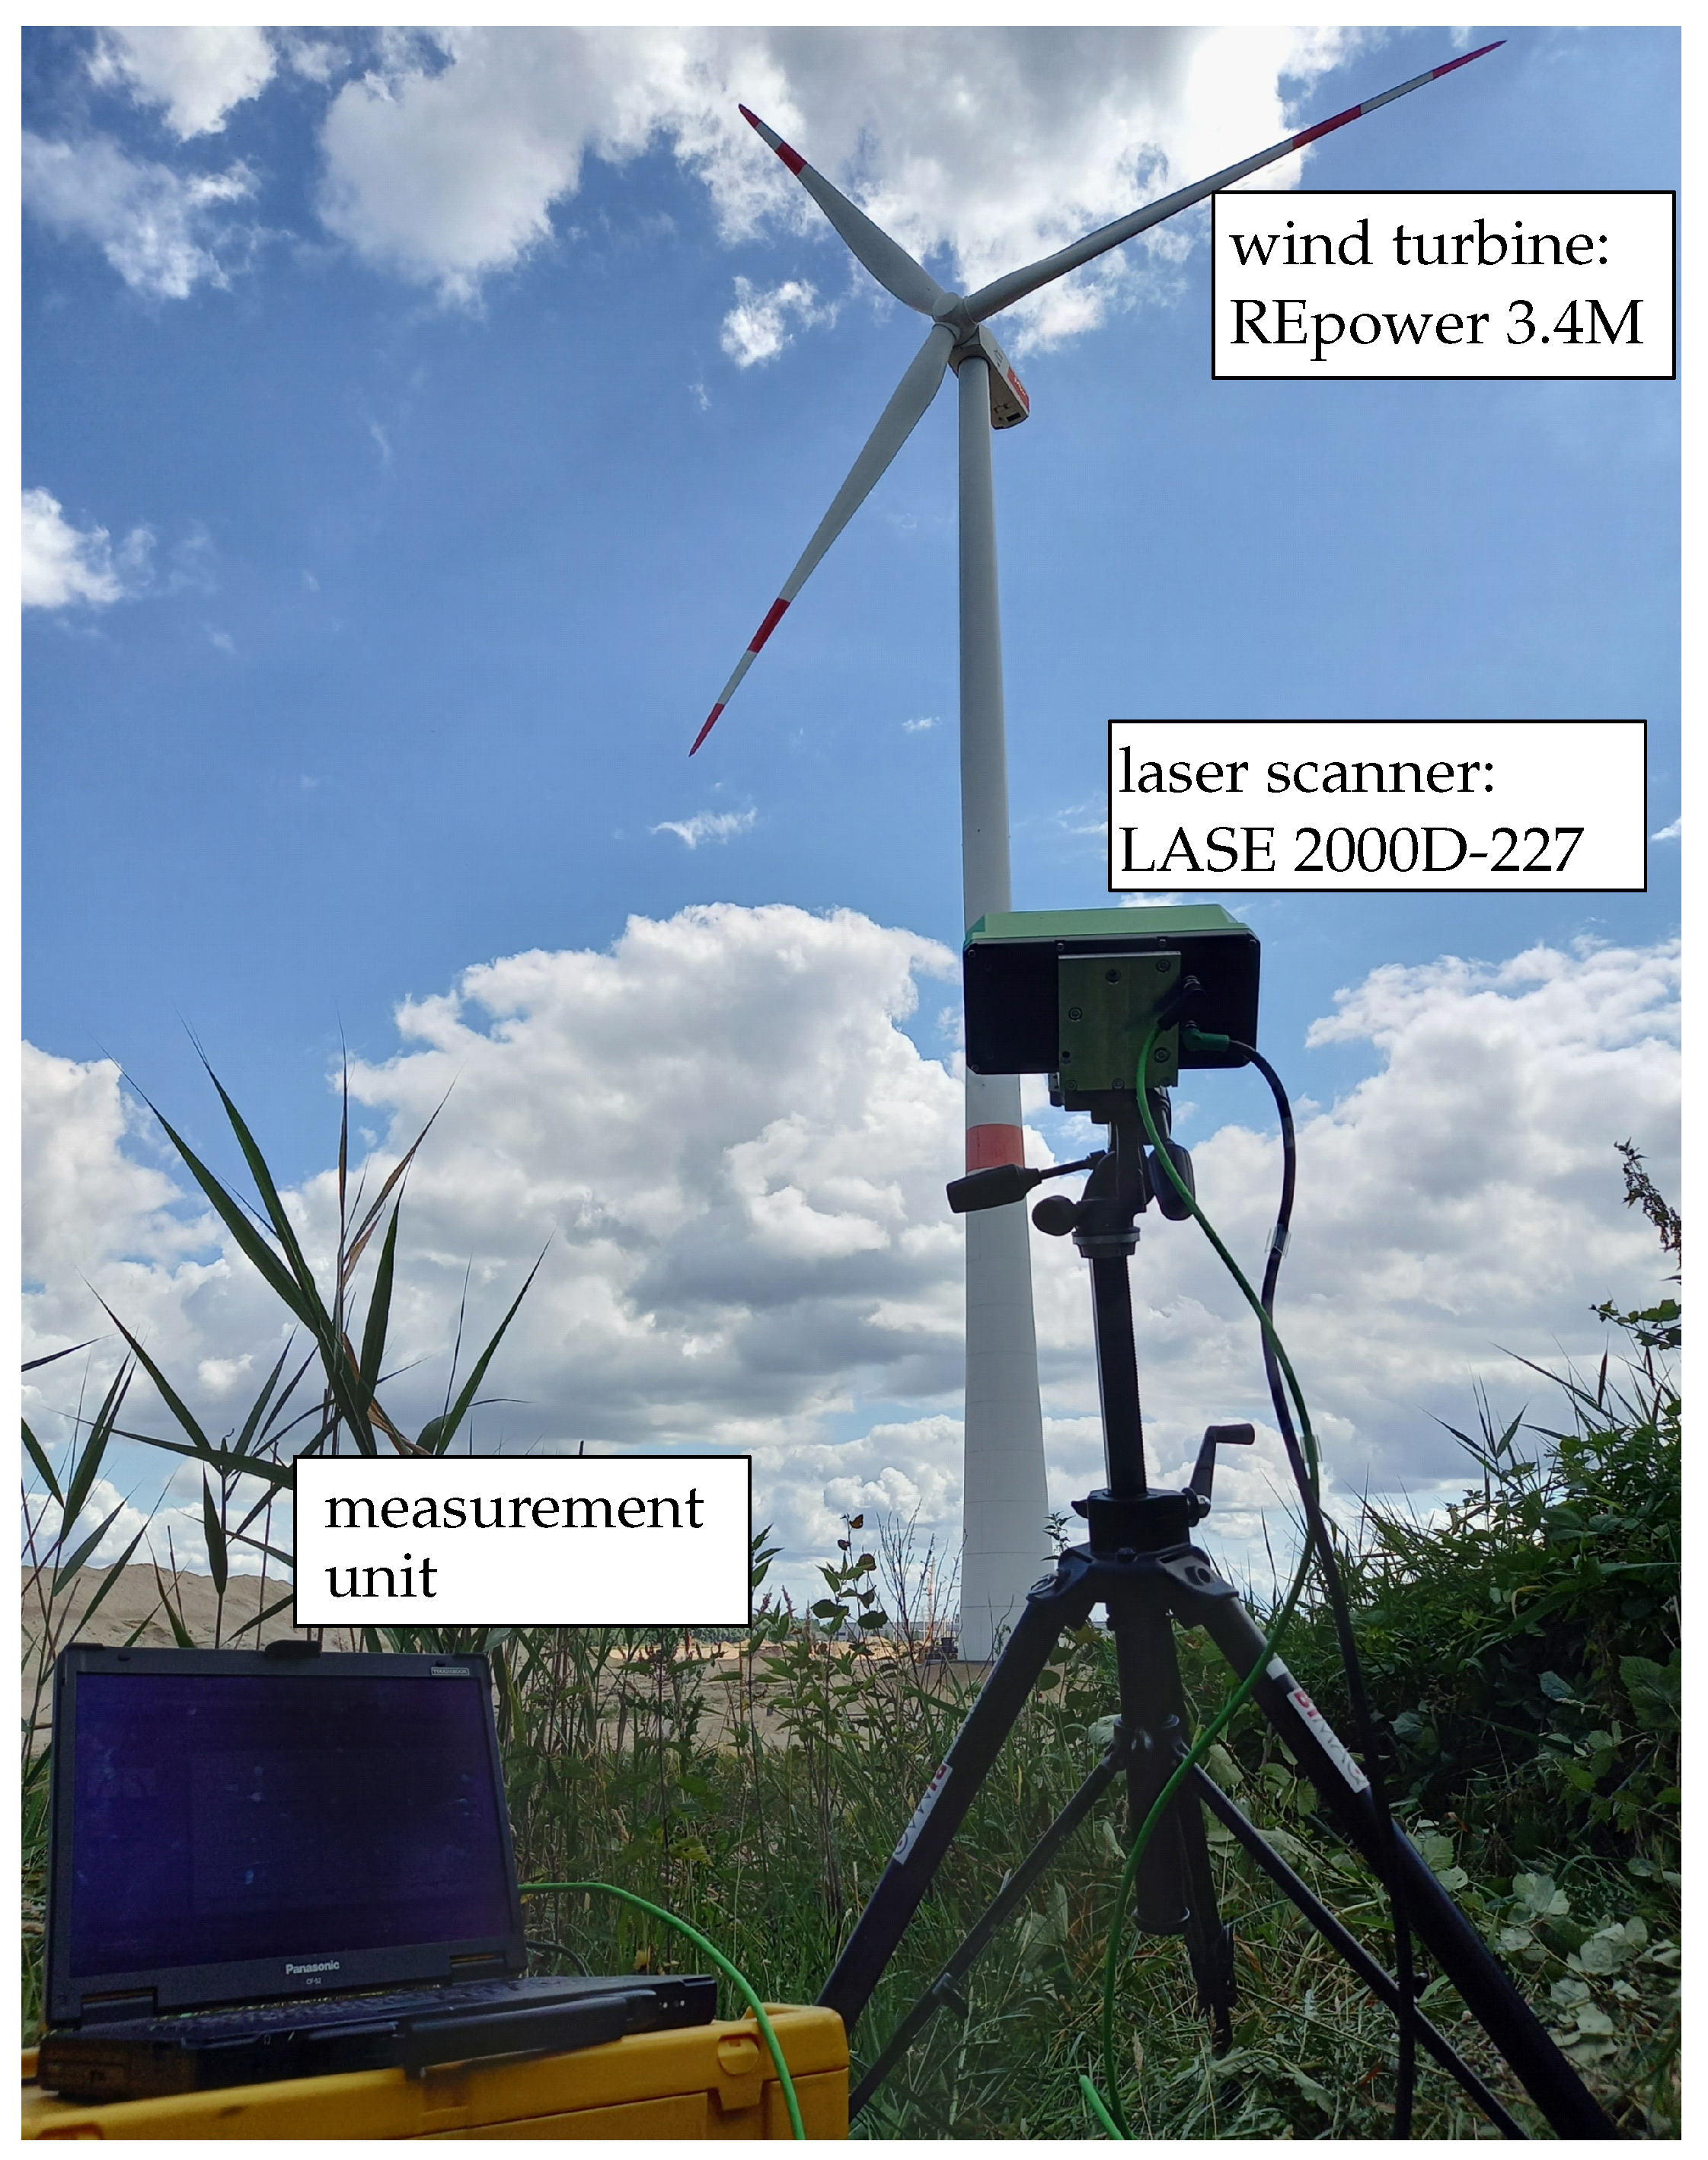
3. Experimental Setup

3.1. Measurement Object

To validate the proposed method, a wind turbine with a tall hub height was chosen. The tower deformation measurements were carried out on a 3.4 MW wind turbine of the type REpower 3.4M located in Bremen, Germany. It had a hub height of 128 m. The tower was a conical hybrid tower, with the lower part of the tower (57 m) made out of concrete and the top part made out of steel. The cut-in wind speed was 3.5 m s−1 and the cut-out wind speed 25 m s−1. Some of the wind turbine characteristics are summarized in Table 1.

3.2. Measurement System and Setup

The laser scanner used in this study was the LASE 2000D-227 from the company LASE GmbH, which uses a laser in the infrared range. It produces 1000 measurement points over the scan angle of θ = 90°, which leads to an angular step of Δ θ of 0.09°. The scan frequency is 20 Hz, which can be increased to 40 Hz by halving the number of points. For this study, a scan frequency of 20 Hz was chosen. According to the manufacturer, the uncertainty is 5 mm, although it is actually likely higher for larger distances. The relevant characteristics are summarized in Table 2.
A photo of the experimental setup of the horizontal alignment is shown in Figure 7, with the wind turbine, the laser scanner, and measurement computer.
The video camera had a frame rate of 25 Hz with a resolution of 704 pixels × 576 pixels. The video was analyzed using the open-source software Tracker [14,15]. In the first frame, the origin was defined, and the measurement was calibrated using the distance between two panels; see the blue line in Figure 5. Note that there was no manufacturer information of the dimensions available, and there was limited access to the turbine. Therefore, this was an estimation of the dimension. This led to a resolution of 1 pixel = 6 mm. However, the uncertainty of the nacelle movement measurement was also dependent on fluctuating light conditions, possible contamination of the lens during a measurement, and imprecise calibration. A screw on the nacelle close to the tower was chosen as a point to be tracked; see Figure 5. Using a point-tracking algorithm, the defined point was tracked through all frames.

3.3. Measurement Conditions

3.3.1. Vertical Scanner Alignment

The measurements to determine the tower’s contour line with vertical scanner alignment were taken on 16 November 2020 with an average wind speed of 8.50 m s−1. The laser scanner was placed 127 m from the turbine, with the main measurement direction transverse to the main wind direction ( φ ≈ 270°). The measurement conditions are summarized in Table 3.

3.3.2. Horizontal Scanner Alignment

In order to validate the novel TLS-method that allows to measure the tower’s movement from a single access point in axial and lateral direction and to characterize the tower’s movement of a tall wind turbine, different operating conditions are chosen, i.e., low wind speed, high wind speed, and start-up and braking. The measurements are taken with varying φ caused by the main wind direction. To achieve a comparable measurement to the nacelle movement obtained from the video camera, the laser scanner is directed towards the top end of the tower and the inclination angle α is measured (see Figure 1b and Figure 6). Note that the laser scanner is manually pointed towards the top end of the tower, leading to slightly different measurement angles for similar measurement distances. A summary of the measurement conditions is shown in Table 4.
The measurements for high and low wind speed were taken transverse to the line-of-sight, with φ ≈ 110° and φ ≈ 230°, respectively; therefore, the greatest tower movements were expected in the x M -direction. The laser scanner for these two measurement conditions was placed at 127 m from the tower with a measurement distance to the top of the tower of over 170 m.
The measurement for the braking condition was taken with the nacelle in alignment with the line-of-sight of the laser scanner ( φ ≈ 180°), with the rotor blades partially blocking the field-of-view of the tower. The largest movement was therefore expected in the y M -direction. The laser scanner was placed at 155 m from the tower with a measurement distance to the top of the tower over 192 m. The average wind speed was not recorded for that measurement, since the tower’s movement was caused by a forced start-up and braking and not the wind force.
Each measurement took place for 10 min. A time window without yawing of the nacelle was chosen so that the laser and video measurements were comparable. All measurements were normalized by subtracting the median of all scans, and a rolling median filter with a window width of 10 scans (i.e., 0.5 s) over time was applied. The time series of the tower positions were analyzed in the time and frequency domain.

4. Results

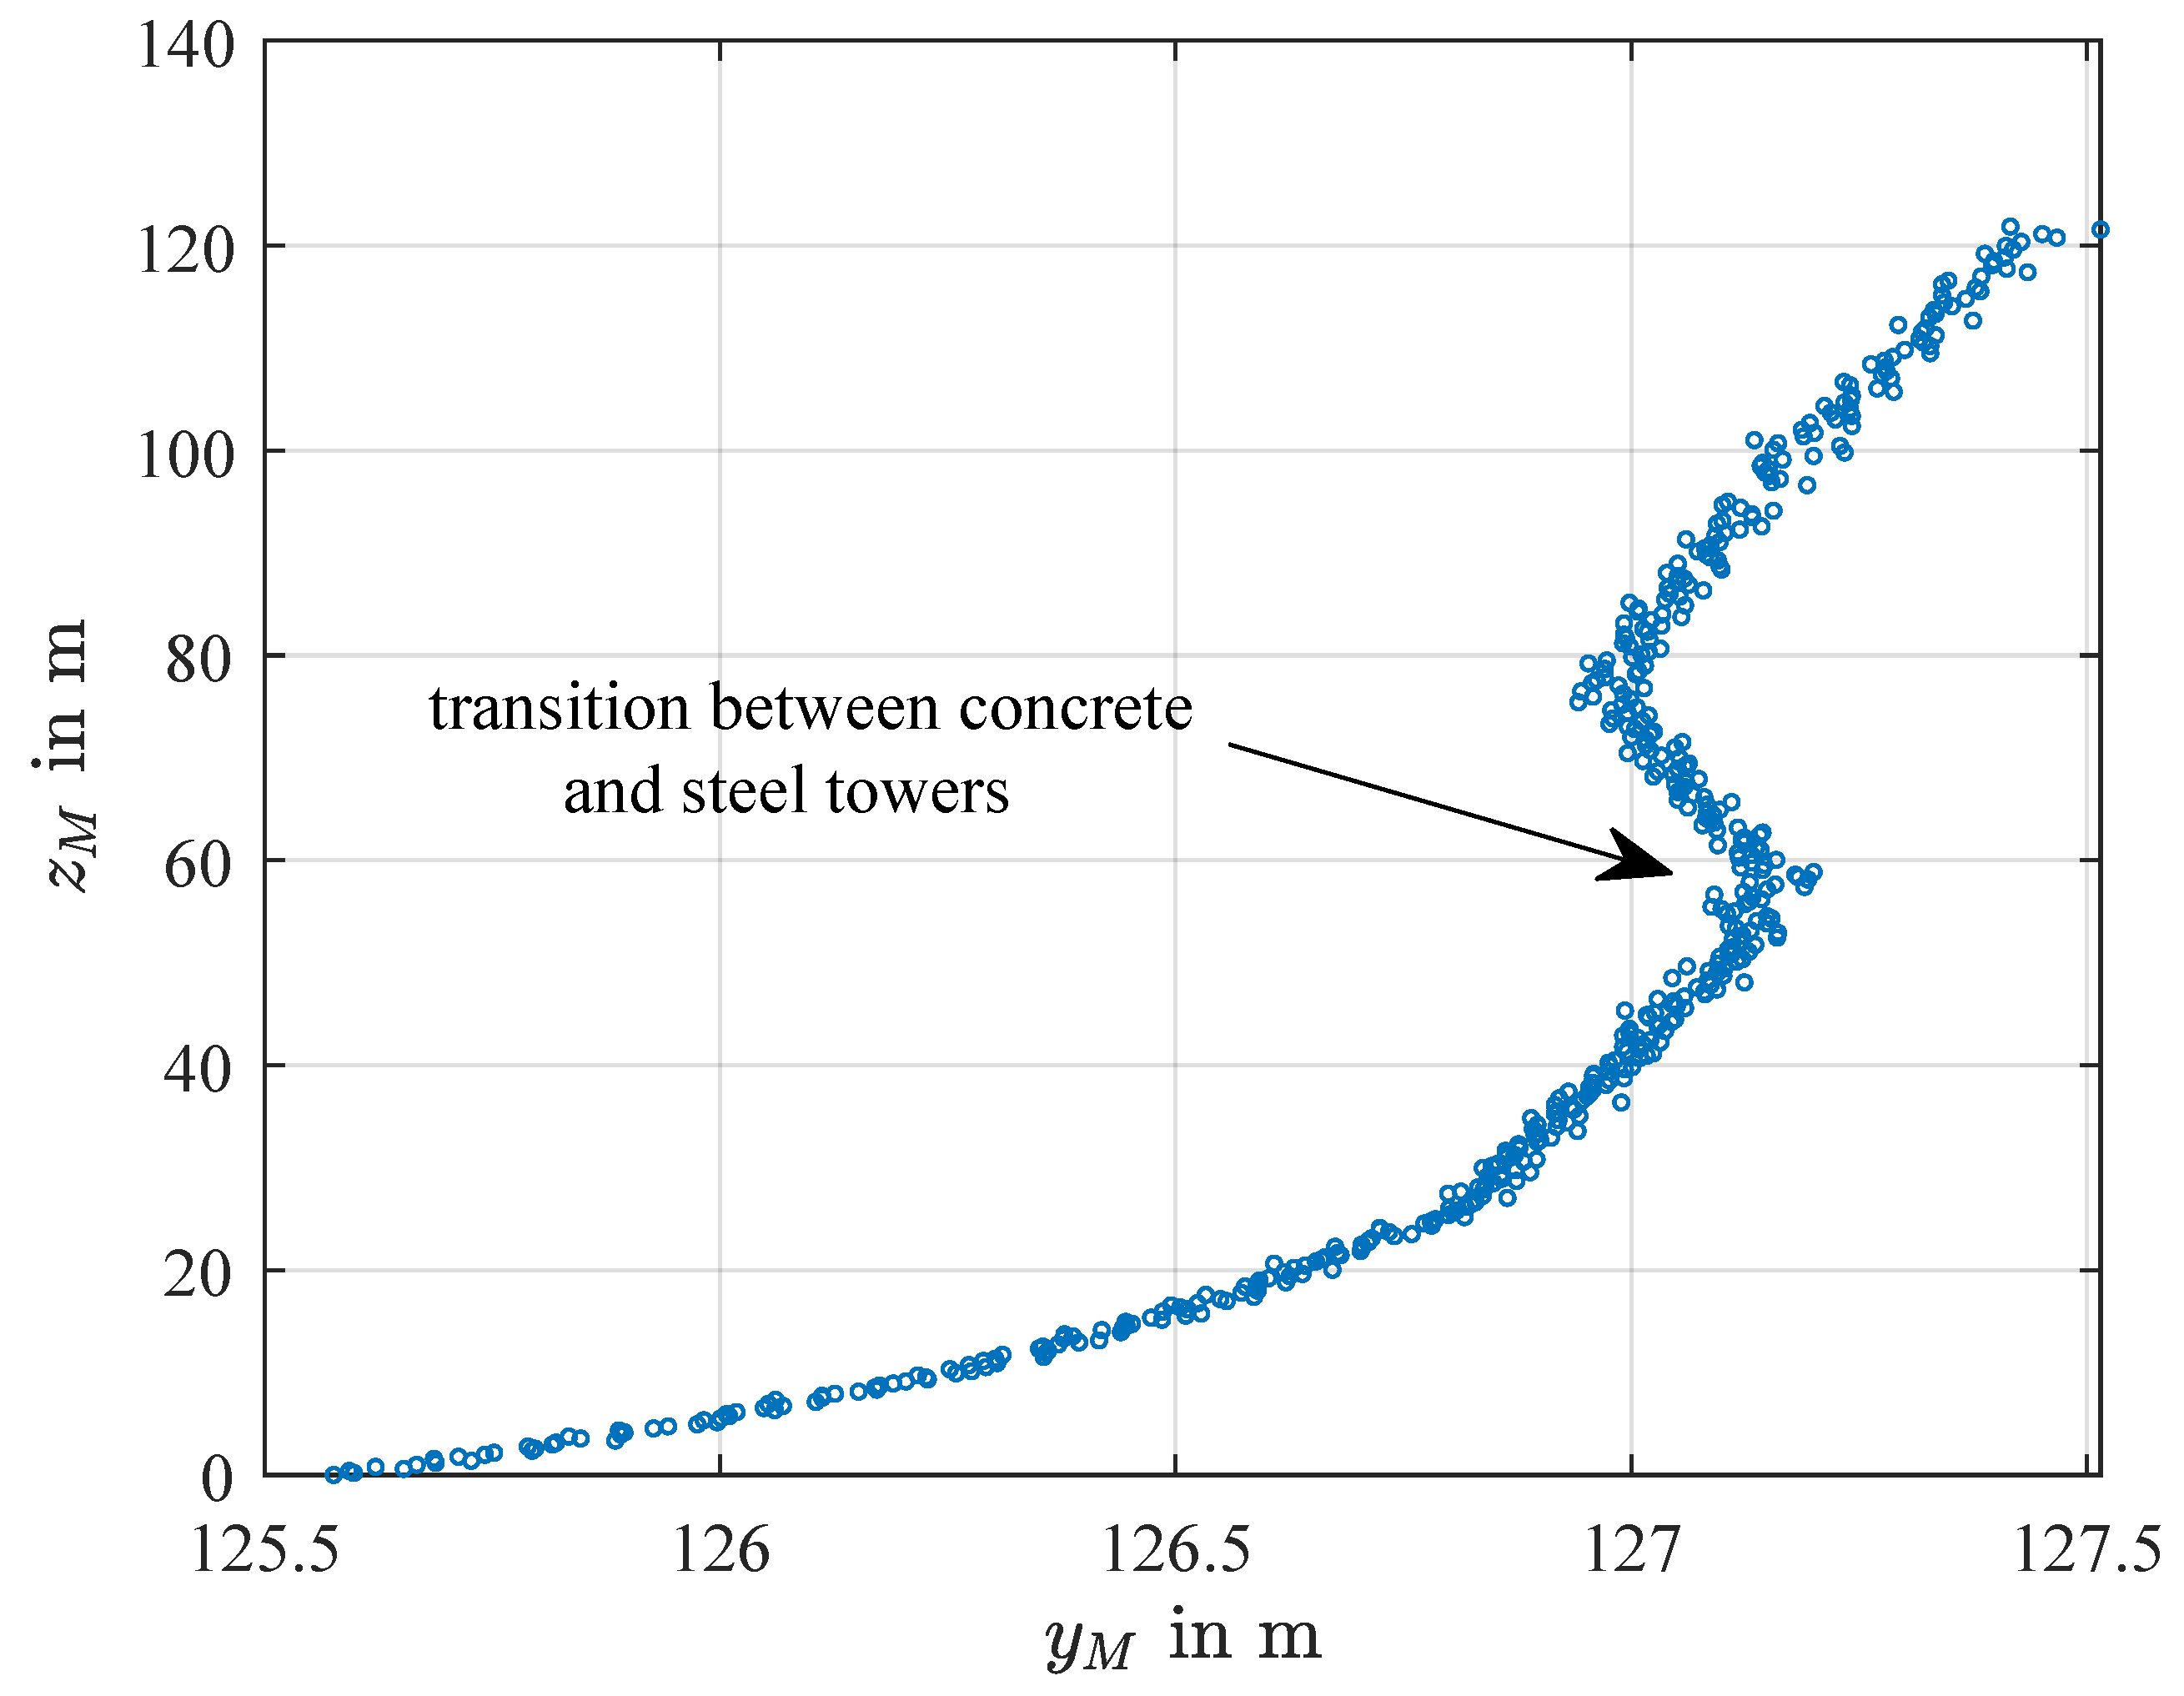
4.1. Vertical Scanner Alignment: Contour Line

The result of a single vertical scan of the tower for the measurement conditions summarized in Table 3 is shown in Figure 8. Note that the contour line of the tower surface included the tower’s deflection due to the wind force.
The transition between the concrete and the steel towers was visible at a height of around 57 m. The second sharp bend can be explained by the tower’s geometry: the steel tower increased slightly in diameter before thinning out. Since a hybrid tower was used in this study, which has a more complex geometry compared to the regular steel towers, the method of fitting a third-degree polynomial through the data as described in [12] cannot be used here. By fitting other curves through the data points, a measurement of the tower’s deformation in the axial direction would be possible; however, this study was focused on presenting the contour line. Without knowledge of the tower’s geometry, the bending line cannot be determined from the contour line. However, the proposed TLS method was capable of measuring the contour line of tall wind turbine towers.

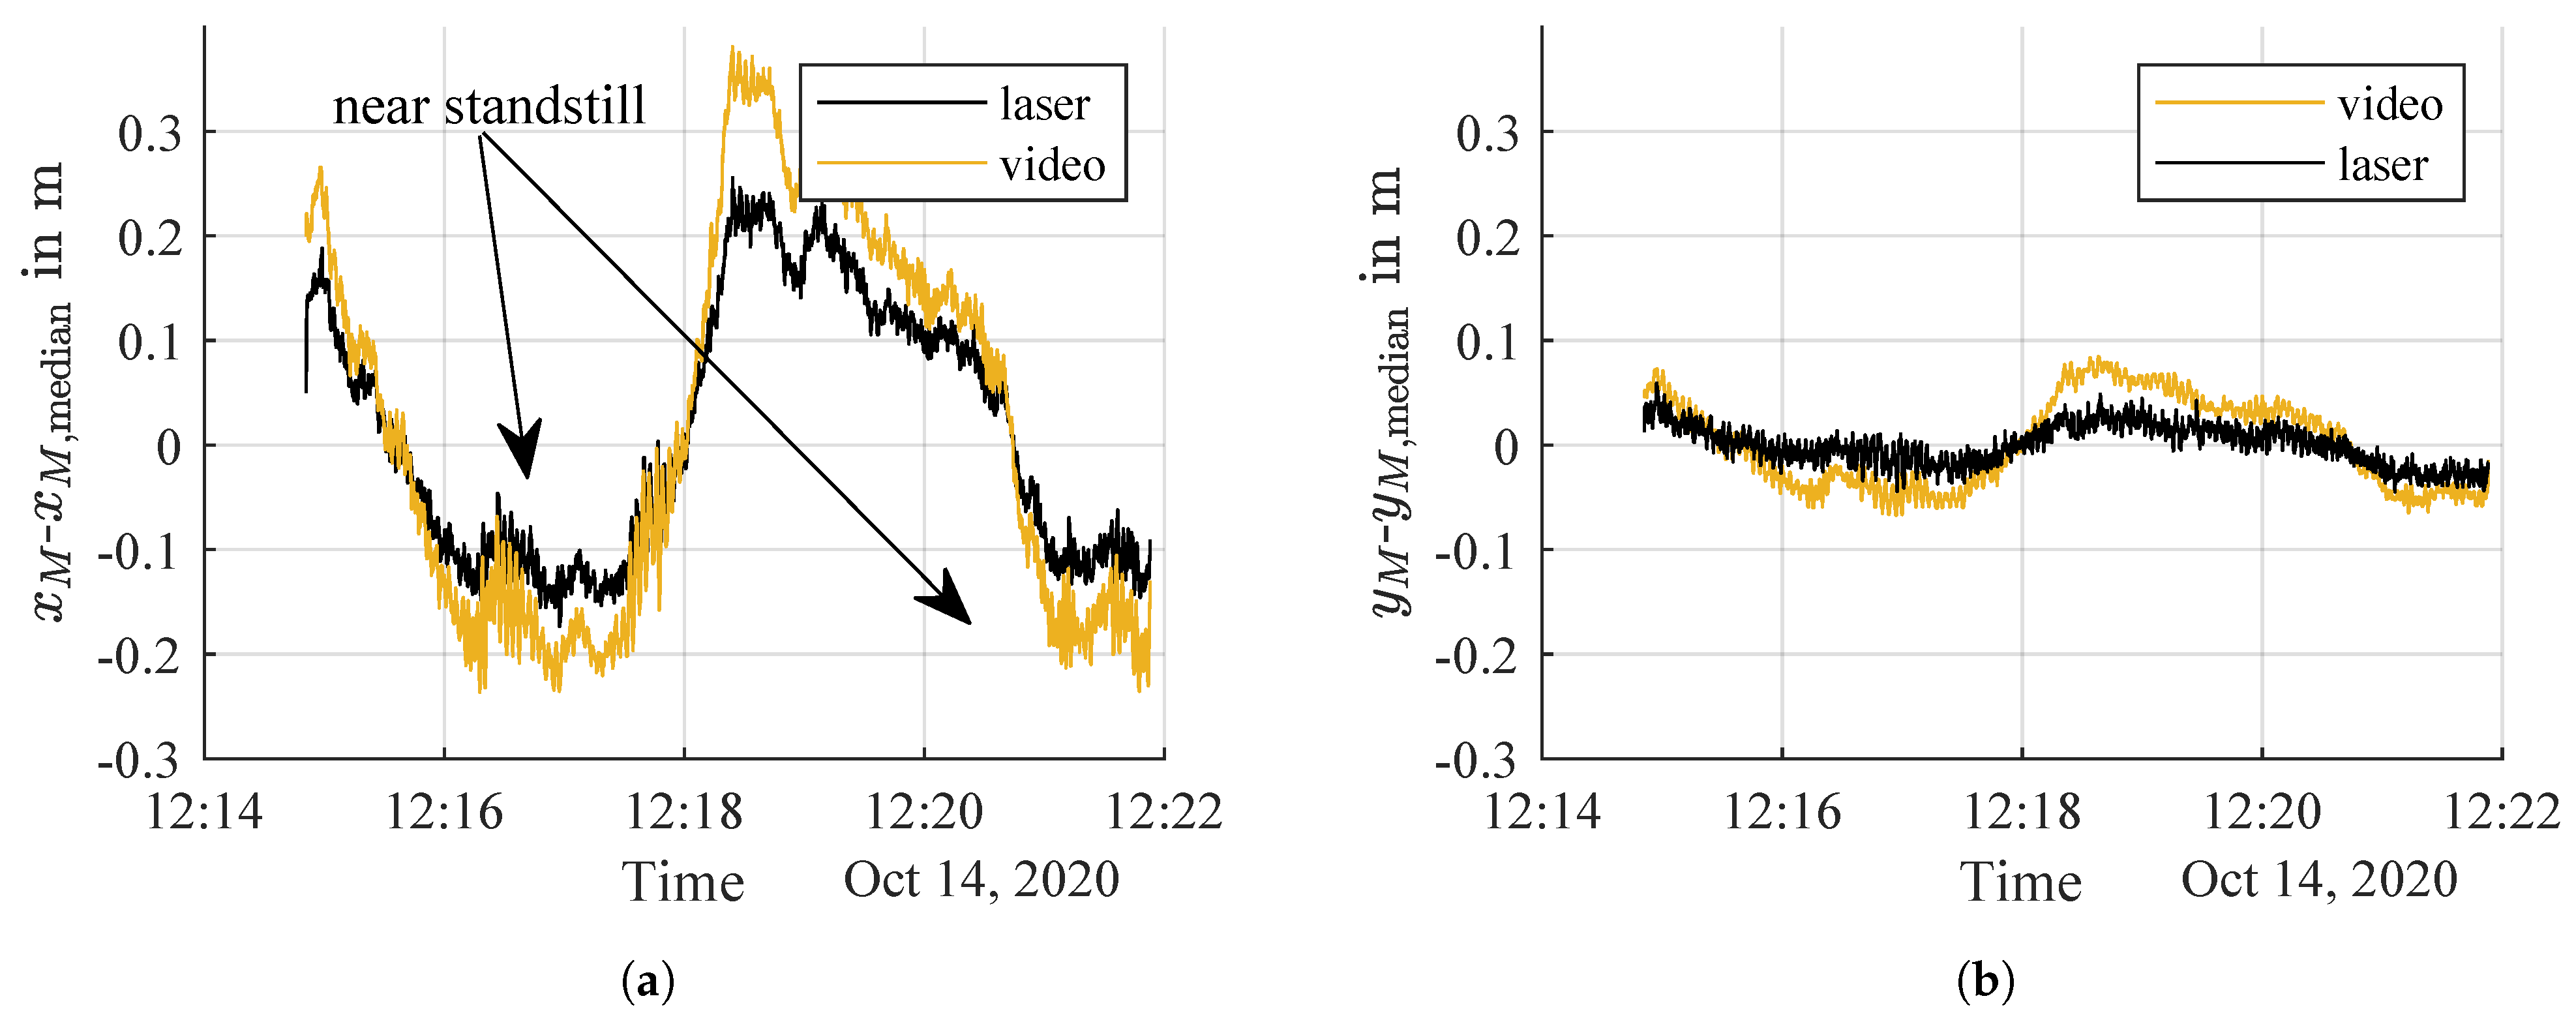
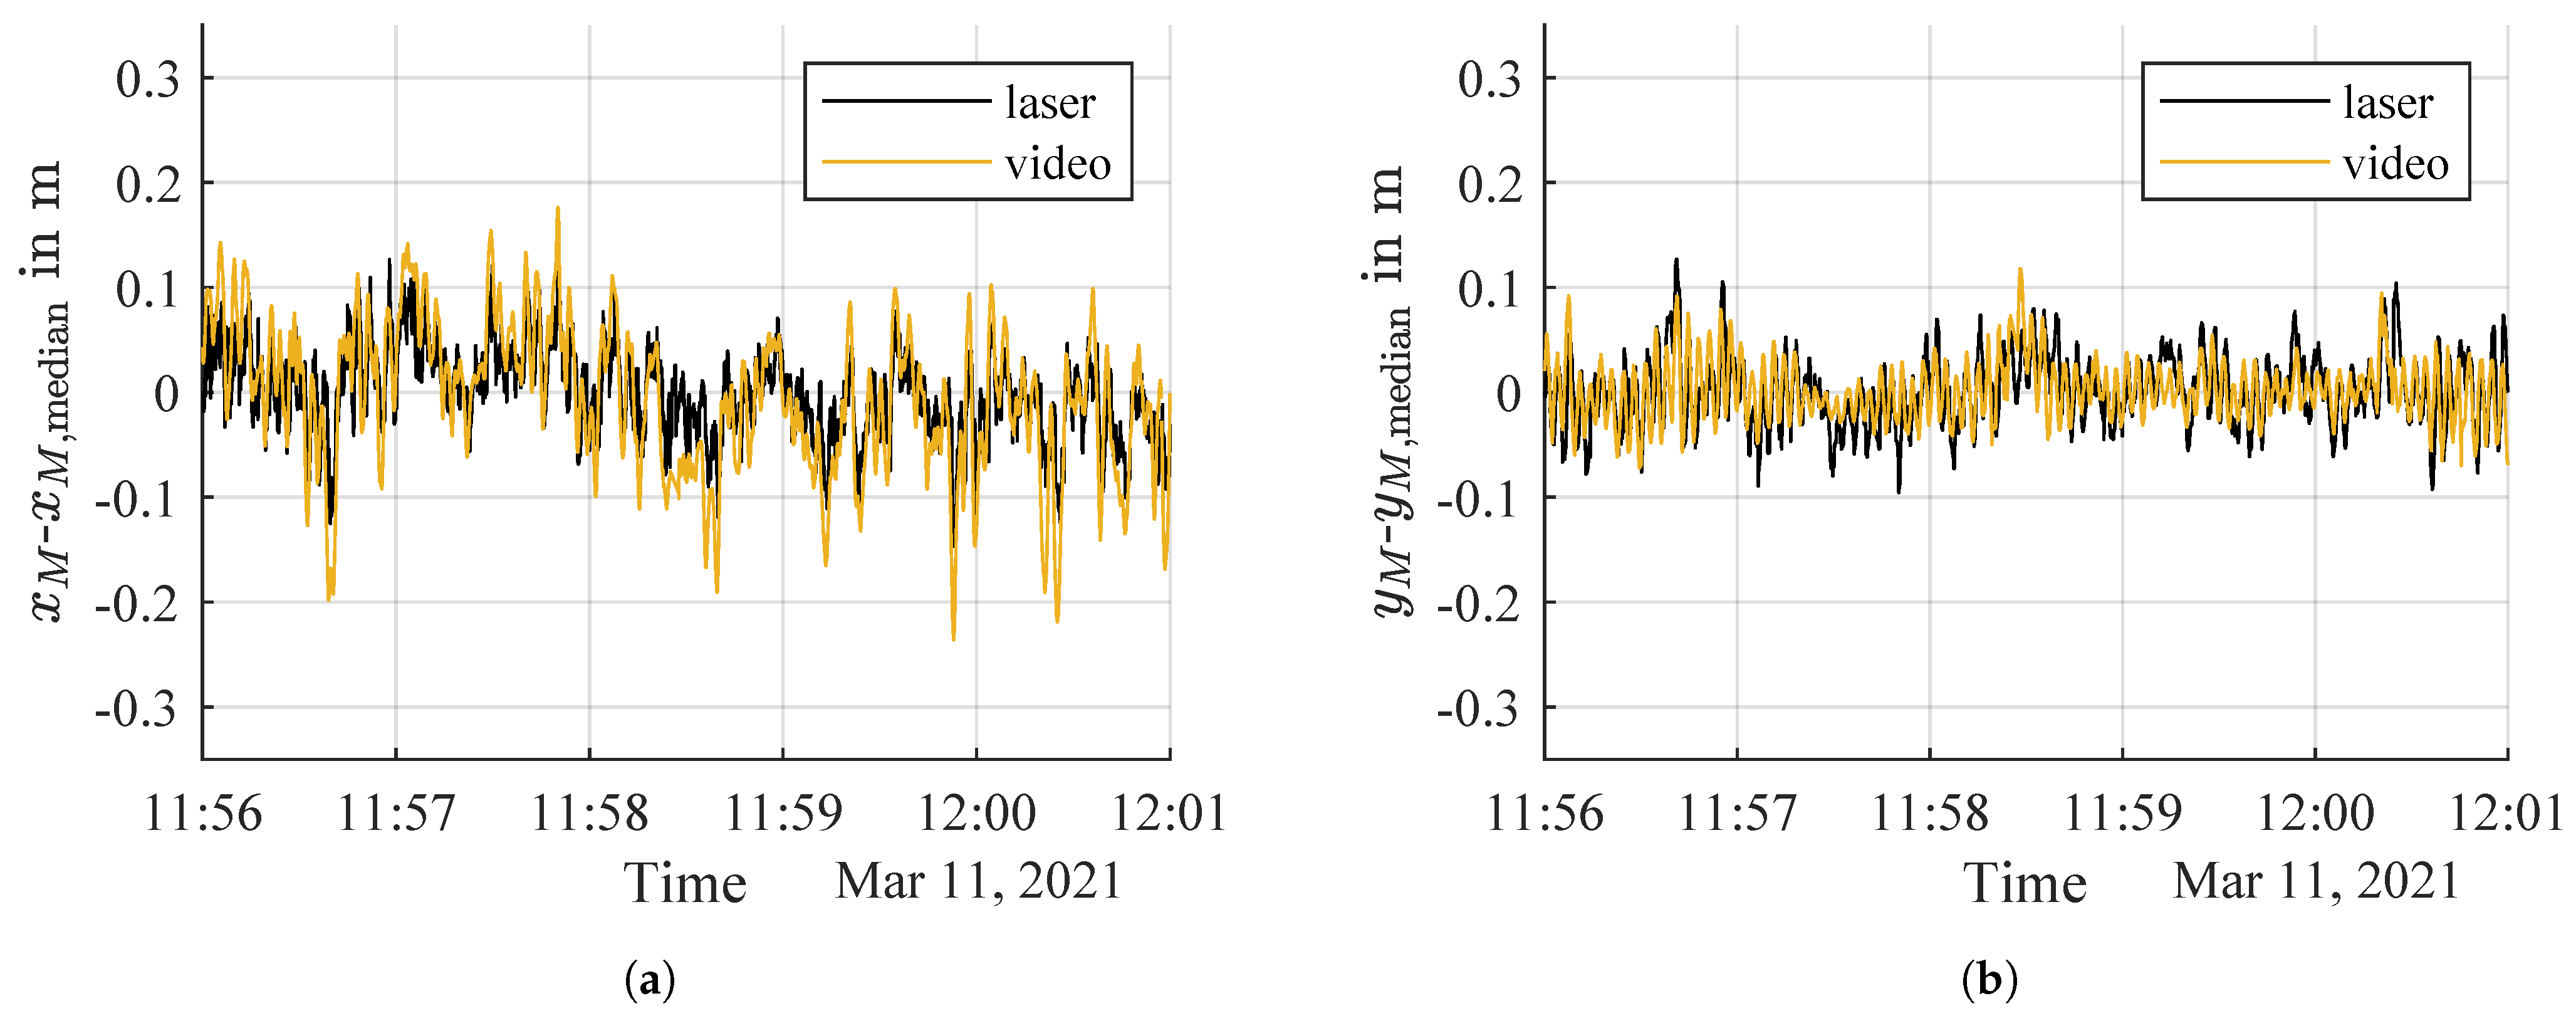
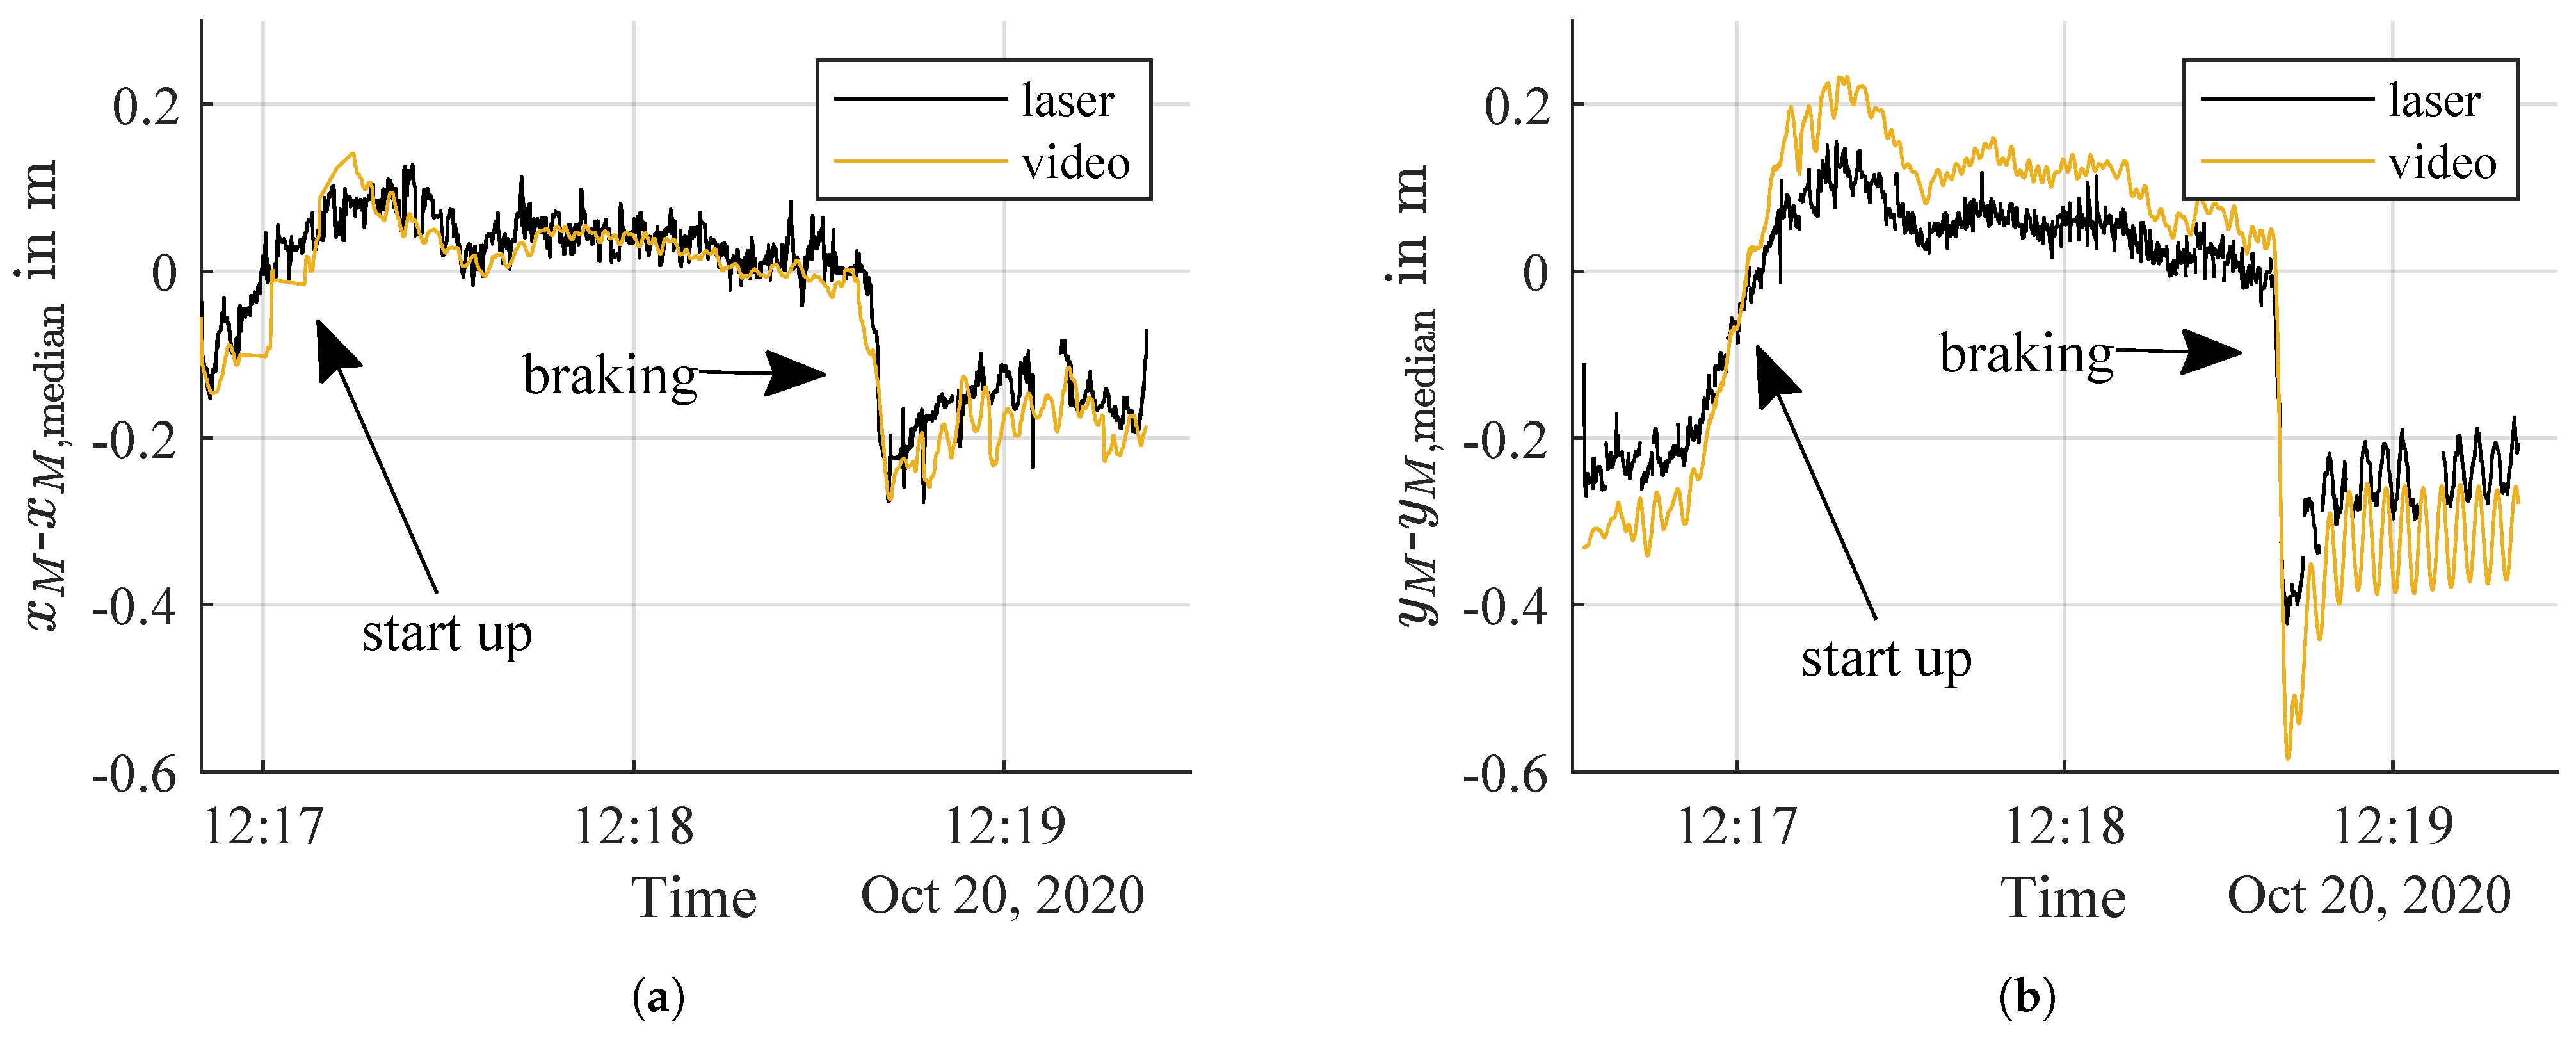
4.2. Horizontal Scanner Alignment: Tower Deformation Analysis in the Time Domain

Measurements were taken for three different operating conditions: low wind speed (Figure 9), high wind speed (Figure 10), and start-up and braking (Figure 11). The measurement conditions are summarized in Table 4.
The measured tower movements for low wind speed for the laser scanner and video measurement are shown in Figure 9. The measurements were taken with a low average wind speed, with the wind partially dropping below the cut-in rate of the wind turbine, causing a low-frequency movement with an amplitude of around 0.5 m in the x M -direction, with the wind turbine near a standstill at around 12:16 to 12:18 and 12:21 to 12:22. The high-frequency oscillations throughout the measurement had an amplitude of up to 0.05 m in the x M -direction and 0.025 m in the y M -direction. The biggest movement can be seen in the x M -direction due to the main wind direction being transverse to the line-of-sight ( φ ≈ 110°).
The measured tower movements for the high average wind condition for the laser scanner and the video measurement are shown in Figure 10. There was no low-frequency movement caused by a partial shutdown of the turbine or gusts of wind. There was, however, a high-frequency oscillation with an amplitude of 0.10 m to 0.15 m in the laser measurements. The oscillations in the x M -direction showed a higher amplitude than the oscillations in the y M -direction due to the main wind direction ( φ ≈ 230°). As expected, the amplitude of these high-frequency oscillations was higher than in the low-wind condition due to the higher wind loads.
The measured tower movements for the measurement during start-up and braking are displayed in Figure 11 (note the slightly different scaling in the y-axis compared to the previous graphs). Due to the measurement angle of φ ≈ 180°, the rotor blades were partially blocking the tower, leading to missing values in the laser measurements. The measurement was carried out under a braking condition, which is visible in the graphs. First, the plant was started up (12:16:50l–12:17:18), then the rotor speed was kept constant until the brakes were applied at 12:18:37. The swinging-out of the tower after the braking was also visible.
There was a qualitative agreement between the measurement taken by the laser scanner and the video measurements in the low wind and braking conditions, with a correlation coefficient of 0.99 and 0.96 in the x M -direction and 0.87 and 0.99 in the y M -direction, respectively.
There as a high correlation between the measurement taken by the laser scanner and the video measurements with the high wind condition as well, with a correlation coefficient of 0.81 and 0.58 for the movement in the x M - and y M -direction; however, it was not as high as in the low wind condition. This could be due to the tower moving while scanning one line. Using a laser scanner with a higher scan rate could eliminate this problem.
Although the correlation for the high-frequency movements was slightly lower than the correlation when there was a low-frequency movement present, the two measurement concepts generally agreed well. There was, however, a disagreement in the amplitude levels of the video measurement. Because there was no structural knowledge about the wind turbine available, it was impossible to know which measurement best described the actual tower movement. The difference in amplitudes could be due to several effects: Firstly, the laser measurement analyzed a high part of the tower, but not necessarily the very top part of the tower, leading to a 5–10 m difference in height between the measurements. If we were to assume that the tower deflects as a straight line, a 10 m difference would account for a difference in amplitude of about 8.3%. This would account for some part, but not all of the differences shown above.
Furthermore, the differences could stem from a systematic error in one of the measurement systems. In proof of concept measurements, where a cylinder placed at a distance of over 150 m from the laser scanner and then moved 1 m in the lateral, as well as axial direction, no systematic error was detected. Therefore, the difference in amplitude was most likely not due to a systematic error in the laser scanner, but rather had a different cause. There was, however, likely a systematic error in the video measurement since its calibration was done using an estimate of a dimension, as no information about the actual dimension was provided by the manufacturer. Furthermore, possible distortion effects of the camera were not taken into consideration during the calibration process, which might lead to a possible overestimation of the actual nacelle movement. The video measurement also captured torsional oscillation of the nacelle, which cannot be measured be the laser measurement.
Nevertheless, although the exact reason for the quantitative difference was not completely clear, the two measurement concepts agreed well qualitatively, especially for the low-frequency movements. The proposed TLS method with the horizontal scanner alignment was therefore capable of characterizing the tower’s movement in different operating conditions.

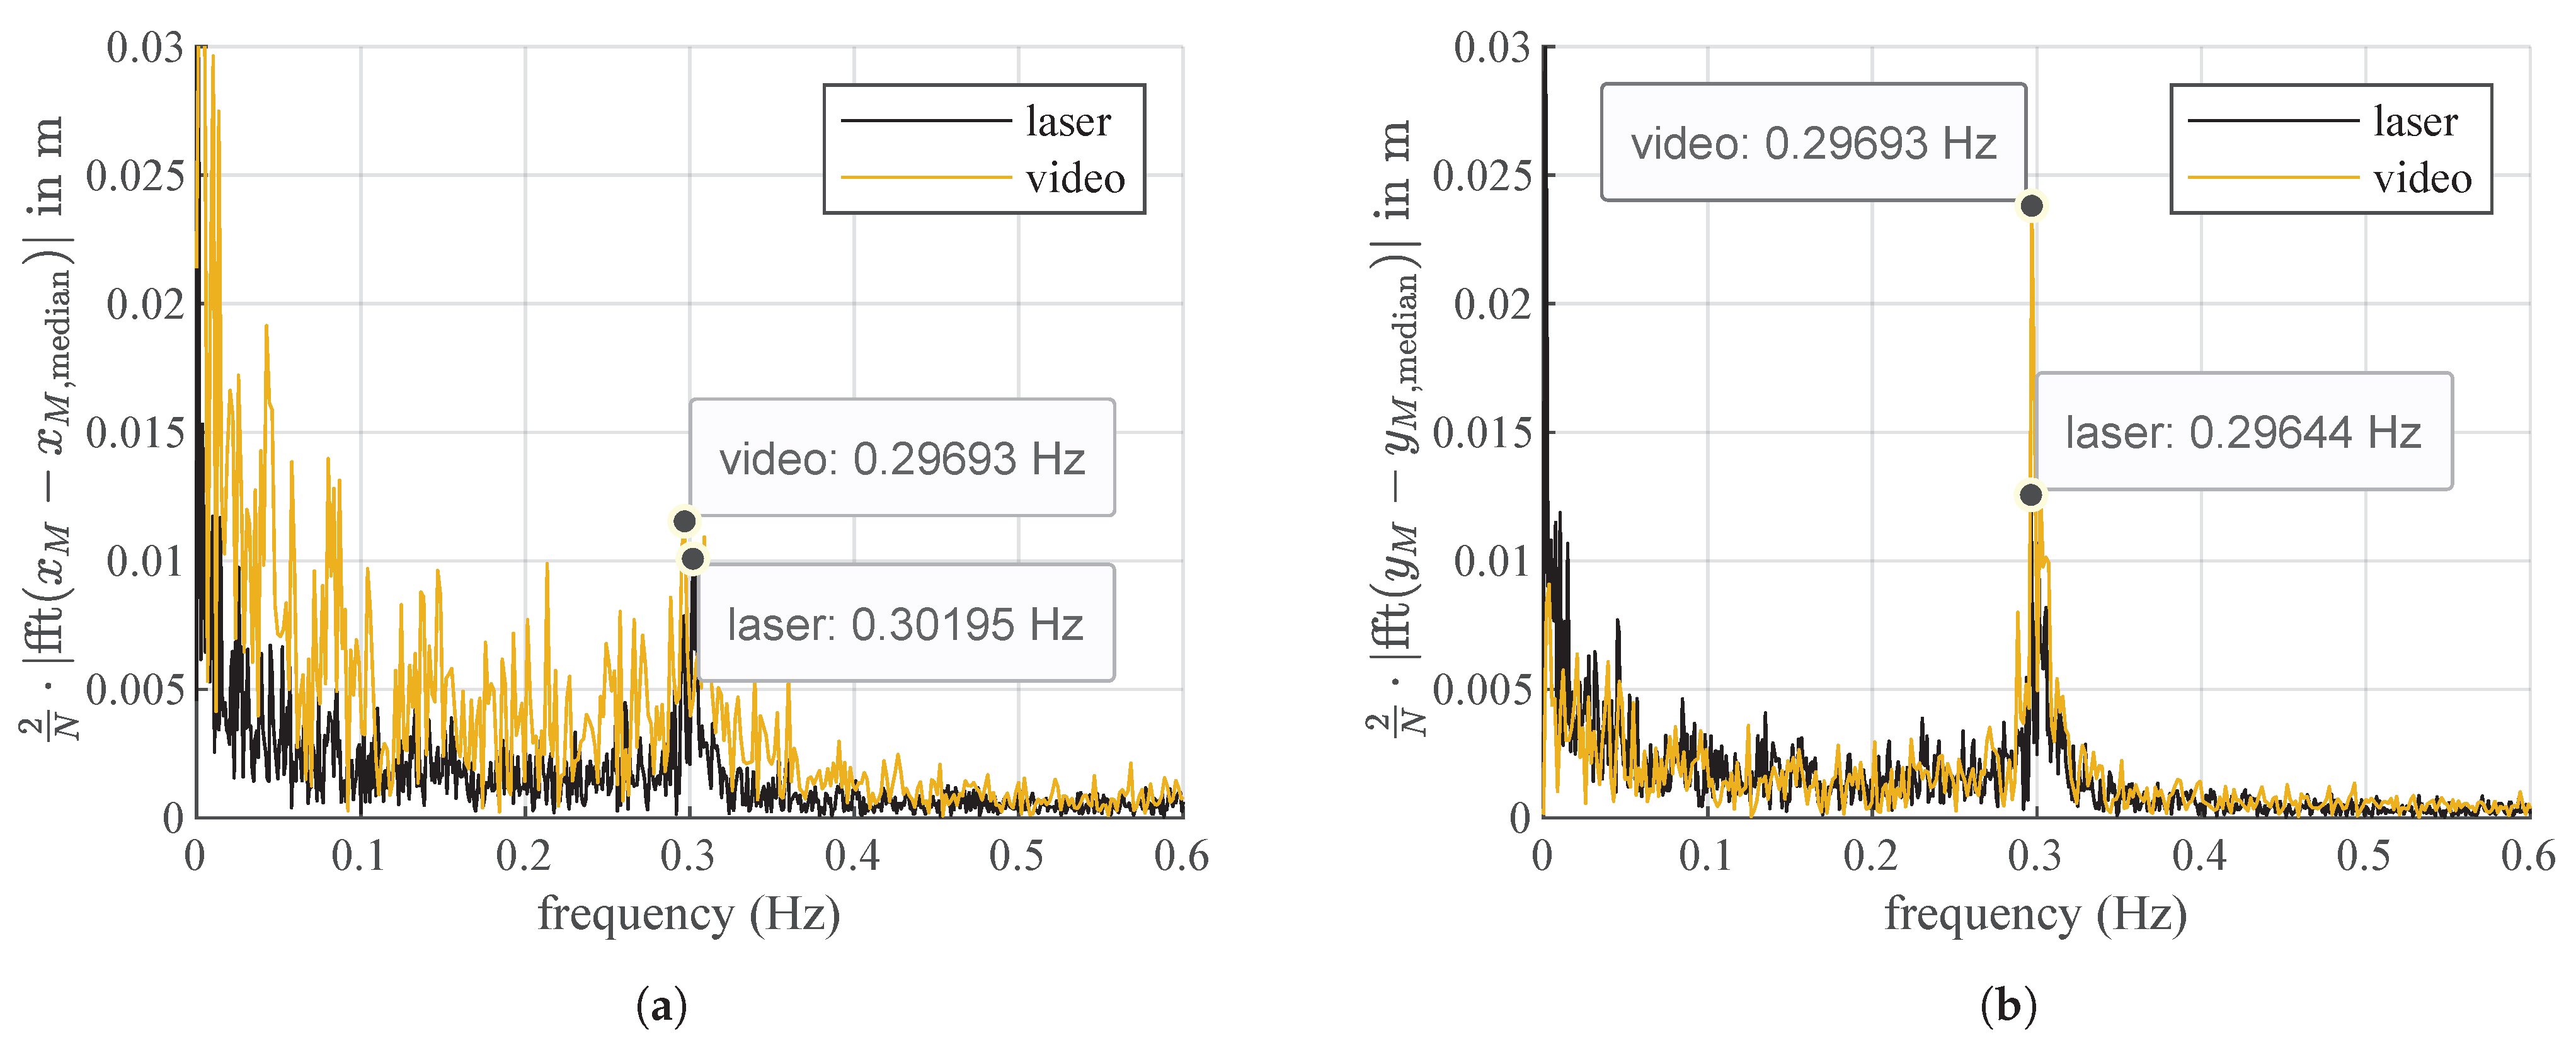
4.3. Horizontal Scanner Alignment: Analysis in the Frequency Domain

All measurements were also analyzed in the frequency domain using a fast Fourier transform. Figure 12 shows an example of this analysis for the measurement taken on 11 March 2021 (strong-wind condition). There was an agreement in the peak for both laser and video measurement at around 0.29 Hz–0.30 Hz, which occurred for all studied measurement conditions. This peak was therefore a dominant frequency of the tower. An analysis of the other measurements, i.e., low wind and start-up and braking conditions in the frequency domain, showed a similar peak, albeit with a lower amplitude. Therefore, this frequency was likely a natural frequency of the tower. There were other peaks in the lateral direction with the video measurement system, which were likely due to noise in the data. Since the same dominant frequency was found for the reference and the laser measurement system, the proposed TLS-based method was shown to provide valid measurements to determine a dominant frequency.

5. Conclusions

The proposed TLS-based measurement system was capable of characterizing the movements of tall wind turbine towers in two directions and the dominant frequencies of that movement from a single access point. This was achieved by placing the laser scanner at a measuring distance of over 150 m from the plant. The laser scanner was tilted upwards to measure the deformation at the top end of the tower. With the help of a least-squares fitting through the measured data points and extraction of the minima for each scan, it was possible to determine the tower’s movement not only in the axial direction (line-of-sight) but also in the lateral direction (transverse to the line-of-sight).
The proposed TLS method of measuring the top part of the tower with the laser scanner was compared to the measurement of the nacelle movement obtained by filming the nacelle from below and using a point-tracking algorithm on a wind turbine with a hub height of 128 m. Three different operating conditions were chosen, i.e., low wind speed, high wind speed, and start-up and braking of the wind turbine. There was a high correlation between the laser and the reference measurement system in the time and frequency domain. The TLS method can therefore reliably characterize the tower’s two-dimensional movement from a large working distance for different operating conditions, independent of the main wind direction. By aligning the laser scanner vertically, it was also possible to obtain the tower’s contour line.
Currently, only one height of the tower can be measured at a time. By using an appropriately designed laser scanner, however, the measurement approach can be straightforwardly adopted for the scanning of multiple heights simultaneously, thus combining the vertical and horizontal alignment of the laser scanner presented in this paper. The proposed TLS method therefore proved to be a capable tool for the structural health monitoring of tall wind turbine towers.

Author Contributions

Conceptualization, P.H., M.S. and A.v.F.; methodology, P.H., A.v.F. and A.F.; software, P.H.; investigation, P.H.; writing—original draft preparation, P.H.; writing—review and editing, P.H., A.v.F., M.S. and A.F.; supervision, A.F. All authors read and agreed to the published version of the manuscript.

Funding

This research was funded by the German Federal Ministry for Economic Affairs and Energy (BMWi) within the project of PreciWind, Grant Number 03EE3013A.

Conflicts of Interest

The authors declare no conflict of interest. The funders had no role in the design of the study; in the collection, analyses, or interpretation of data; in the writing of the manuscript; nor in the decision to publish the results.

References

  1. Veers, P.; Dykes, K.; Lantz, E.; Barth, S.; Bottasso, C.L.; Carlson, O.; Clifton, A.; Green, J.; Green, P.; Holttinen, H.; et al. Grand challenges in the science of wind energy. Science 2019, 366. [Google Scholar] [CrossRef] [PubMed] [Green Version]
  2. Tchakoua, P.; Wamkeue, R.; Ouhrouche, M.; Slaoui-Hasnaoui, F.; Tameghe, T.; Ekemb, G. Wind Turbine Condition Monitoring: State-of-the-Art Review, New Trends, and Future Challenges. Energies 2014, 7, 2595–2630. [Google Scholar] [CrossRef] [Green Version]
  3. Wymore, M.L.; van Dam, J.E.; Ceylan, H.; Qiao, D. A survey of health monitoring systems for wind turbines. Renew. Sustain. Energy Rev. 2015, 52, 976–990. [Google Scholar] [CrossRef]
  4. Dilek, A.U.; Oguz, A.D.; Satis, F.; Gokdel, Y.D.; Ozbek, M. Condition monitoring of wind turbine blades and tower via an automated laser scanning system. Eng. Struct. 2019, 189, 25–34. [Google Scholar] [CrossRef]
  5. Zieger, T.; Nagel, S.; Lutzmann, P.; Kaufmann, I.; Ritter, J.; Ummenhofer, T.; Knödel, P.; Fischer, P. Simultaneous identification of wind turbine vibrations by using seismic data, elastic modeling and laser Doppler vibrometry. Wind Energy 2020, 23, 1145–1153. [Google Scholar] [CrossRef]
  6. Baqersad, J.; Poozesh, P.; Niezrecki, C.; Avitabile, P. Photogrammetry and optical methods in structural dynamics—A review. Mech. Syst. Signal Process. 2017, 86, 17–34. [Google Scholar] [CrossRef]
  7. Ozbek, M.; Meng, F.; Rixen, D.J. Challenges in testing and monitoring the in-operation vibration characteristics of wind turbines. Mech. Syst. Signal Process. 2013, 41, 649–666. [Google Scholar] [CrossRef]
  8. Mukupa, W.; Roberts, G.W.; Hancock, C.M.; Al-Manasir, K. A review of the use of terrestrial laser scanning application for change detection and deformation monitoring of structures. Surv. Rev. 2016, 1–18. [Google Scholar] [CrossRef]
  9. Schneider, D. Terrestrial laser scanning for area based deformation analysis of towers and water damns. In Proceedings of the 12th FIG Symposium, Baden, Austria, 22–24 May 2006; Volume 3rd IAG. [Google Scholar]
  10. Schill, F.; Eichhorn, A. (Eds.) Investigations of Low- and High-Frequency Movements of Wind Power Plants Using a Profile Laser Scanner; 2016. [Google Scholar]
  11. Mitka, B.; Klapa, P.; Gniadek, J. Use of Terrestrial Laser Scanning for Measurements of Wind Power Stations. Geomat. Environ. Eng. 2019, 13, 39. [Google Scholar] [CrossRef]
  12. Artese, S.; Nico, G. TLS and GB-RAR Measurements of Vibration Frequencies and Oscillation Amplitudes of Tall Structures: An Application to Wind Towers. Appl. Sci. 2020, 10, 2237. [Google Scholar] [CrossRef] [Green Version]
  13. Gander, W.; Golub, G.H.; Strebel, R. Least-squares fitting of circles and ellipses. BIT Numer. Math. 1994, 34, 558–578. [Google Scholar] [CrossRef]
  14. Brown, D.; Cox, A.J. Innovative Uses of Video Analysis. Phys. Teach. 2009, 47, 145–150. [Google Scholar] [CrossRef] [Green Version]
  15. Brown, D.; Christian, W.; Hanson, R. Tracker Video Analysis and Modeling Tool. Available online: https://physlets.org/tracker/ (accessed on 16 March 2021).
Figure 1. Sketch of the measurement arrangement showing the laser coordinate system (xL, yL, zL) and the measurement coordinate system (xM, yM, zM). (a) Side view of the vertical alignment of the laser scanner with the fixed scan angle θ. Note that the scan was performed in the yLzL plane. (b) Side view of the horizontal alignment of the laser scanner with an inclination angle α. Note that the scan was performed in the xLyL plane.
Energies 14 03255 g001
Figure 2. All detected points with the vertical scanner alignment in the measurement coordinate system ( y M , z M ) . The points on the tower are marked as the region of interest (ROI).
Energies 14 03255 g002
Figure 3. Procedure for determining the minimum in the horizontal scanner alignment by defining the region of interest (ROI), least-squares fitting, and transformation of the minimum to coordinate system (xM, yM). (a) Points on the tower marked as the region of interest (ROI) in the coordinate system (xL,yL). (b) Parabola fitted through points in the ROI and minimum (xL,min, yL,min) calculated in the coordinate system (xL,yL). (c) The minimum (xM,min, yM,min) is then analyzed in the coordinate system (xM, yM).
Energies 14 03255 g003
Figure 4. Video camera placed at the bottom of the wind turbine, filming the nacelle movement from below.
Energies 14 03255 g004
Figure 5. The origin and coordinate system (black) are defined. The length is calibrated (blue), and the point to be tracked is defined (red).
Energies 14 03255 g005
Figure 6. Top view of the measurement arrangement with horizontal laser scanning alignment and the measurement angle φ . The camera was placed either in Camera Position 1 or in Camera Position 2 depending on the main wind direction.
Energies 14 03255 g006
Figure 7. Experimental setup for in-field wind turbine tower deformation measurements including a laser scanner and a measurement computer.
Energies 14 03255 g007
Figure 8. Contour line measured with vertical scanner alignment.
Energies 14 03255 g008
Figure 9. Tower movement in the lateral and axial direction measured by the laser scanner and video recording during low wind conditions. (a) Tower movement in the lateral direction (xM). (b) Tower movement in the axial direction (yM).
Energies 14 03255 g009
Figure 10. Tower movement in the lateral and axial direction measured by the laser scanner and video recording during strong wind conditions. (a) Tower movement in the lateral direction (xM). (b) Tower movement in the axial direction (yM).
Energies 14 03255 g010
Figure 11. Tower movement in the lateral and axial direction measured by the laser scanner in the horizontal alignment and video recording during start-up and braking. (a) Tower movement in the lateral direction (xM). (b) Tower movement in the axial direction (yM).
Energies 14 03255 g011
Figure 12. Tower movement in the lateral and axial direction. (a) Fourier transform of tower movement in the lateral direction (xM). (b) Fourier transform of tower movement in the axial direction (yM).
Energies 14 03255 g012
Table 1. Wind turbine REpower 3.4M characteristics.
NameValue
hub height128 m
concrete tower length57 m
steel tower length69 m
cut-in wind speed3.5 m s−1
rated wind speed13.5 m s−1
cut-out wind speed25 m s−1
Table 2. Laser scanner LASE 2000D-227 characteristics.
NameValue
laser wave length λ = 128 nm
laser pulse rate40 kHz
laser class1 M
laser spot size at sensor window12 mm2 × 16 mm2
scan angle θ = 90°
points per scanN = 1000
scan rate20 Hz (40 Hz)
uncertainty5 mm
Table 3. Measurement conditions for vertical alignment. See Figure 1a and Figure 6 for sketches of the experimental setup.
NameValue
date16 November 2020
distance d = 127 m
measurement angle φ ≈ 270°
average wind speed8.50 m s−1
Table 4. Measurement details for different operating conditions. See Figure 1b and Figure 6 for sketches of the experimental setup.
Low Wind SpeedHigh Wind SpeedStart-Up and Braking
date14 October 202011 March 202120 October 2020
distance d = 127 m d = 127 m d = 155 m
camera position221
measurement angle φ ≈ 110° φ ≈ 230° φ ≈ 180°
inclination angle α = 42.3° α = 41.8° α = 36.0°
corresponding height on tower h ≈ 115.5 m h ≈ 113.5 m h ≈ 112.6 m
average wind speed6.85 m s−113.89 m s−1≈ 6 m s−1
minimum wind speed2.66 m s−16.99 m s−1
maximum wind speed10.09 m s−122.26 m s−1
Publisher’s Note: MDPI stays neutral with regard to jurisdictional claims in published maps and institutional affiliations.

