Article

Optimization of Architectural Form for Thermal Comfort in Naturally Ventilated Gymnasium at Hot and Humid Climate by Orthogonal Experiment

1
School of Art and Design, Guangdong University of Technology, Guangzhou 510090, China
2
Institute of Urban Innovation, Yokohama National University, Kanagawa 240-8501, Japan
*
Author to whom correspondence should be addressed.
Energies 2021, 14(11), 3228; https://doi.org/10.3390/en14113228
Submission received: 1 April 2021 / Revised: 28 May 2021 / Accepted: 29 May 2021 / Published: 31 May 2021
(This article belongs to the Section G: Energy and Buildings)

Abstract

:
As the gymnasiums in subtropical region with hot and humid climate are naturally ventilated during non-competition periods, occupants exercising indoors often feel uncomfortable, especially in summer. In order to provide thermally comfortable and healthy environment for the occupants, the design on architectural form is found to be an effective solution on improving indoor thermal comfort of naturally ventilated gymnasiums. Therefore, a new perspective regarding optimization of naturally ventilated gymnasiums is proposed in the aspect of the architectural form. This paper presents the optimization of architectural form in naturally ventilated gymnasiums in which simulation and orthogonal experiment methods are combined. Through numerical simulation with FlowDesigner software, the significance of architectural form affecting indoor thermal comfort has been given, and the optimal architectural forms of naturally ventilated gymnasium are determined. The results show that the roof insulation type is the most significant factor influencing indoor thermal comfort; thus, it should be considered primarily in optimization. Moreover, the range analysis and variance analysis reveal the rankings of the factors for the gymnasium thermal comfort. In addition, it is demonstrated that the optimal gymnasium model, when compared with the initial gymnasium model, has a satisfactory effect on improving the indoor thermal comfort, as the average value of Predicted Thermal Sensation (PTS) in August decreased from 1.11 (Slightly hot) to 0.86 (Comfortable). This study provides a new insight for the designers in optimizing the architectural form of gymnasiums for achieving the indoor thermal comfort at hot and humid climate.

1. Introduction

As a public space for sports, exercises, and entertainments, gymnasiums play an important role in people’s daily life. In the subtropical areas, the thermal comfort of occupants exercising in gymnasiums is related to the utilization rate of gymnasiums, energy consumption, and human health. In hot and humid climate, occupants prefer pursuing thermal comfort by air conditioners when doing sports. However, although the air conditioners provide a comfortable environment for occupants directly, this would increase energy consumption and carbon dioxide emissions. Moreover, human adaptive ability to the natural environment would be weakened, as well as their health, while exercising in such places for a long time [1]. Therefore, the study on the thermal comfort in naturally ventilated gymnasium at hot and humid climate has been significantly regarded today [2].
People could achieve thermal comfort mainly from two aspects by two methods: One is individual adjustment, such as the activity level, clothing, and psychological expectation [3,4,5,6]; the other is thermal environment regulating, such as the indoor air temperature, relative humidity, mean radiant temperature, and air velocity [3,4]. Although occupants could adjust themselves on achieving thermal comfort, the regulating on thermal environment could be more effective and comprehensive [7,8]. Furthermore, in the aspect of architectural design, improving the thermal environment by adjusting the architectural forms is one of the most effective methods to achieve thermal comfort.
In the research of the correlation between the architectural form and the thermal comfort, Wei [9] focused on the main energy-saving measures of gymnasium buildings and analyzed the significant sequence of the impact of passive energy-saving technologies on the energy consumption and the cooling load. According to Wei, the external shading and natural lighting were the most significant factors; however, their orders were different due to their respective influence characteristics. Yang et al. [10] investigated the adaptive thermal comfort and climate responsive strategies in dry-hot and dry-cold areas in China and found that the architecture with a semi-basement could satisfy the thermal comfort efficiently, followed by night ventilation in summer. Li [11] simulated the wind pressure in a gymnasium in hot and humid area in China to analyze the influences of interface form on natural ventilation and found that the form of asymmetric interface could improve the ventilation capacity. Huang et al. [12] analyzed the top and side interface forms of gymnasiums in Guangzhou, China and found that the double skin roof and openable side interface could enhance the human thermal comfort. Although the studies correlated between the architectural form and the thermal comfort can be found, most of them are focused on dwelling, school, and office buildings [13,14,15,16,17,18]. These studies rarely focused on the gymnasium building, which played a distinctive role on thermal comfort for the features of large space, specific function, and certain group of people. In addition, few research studies multi-factor by orthogonal experiment method [19,20,21]. Most of them, however, focus on single influential factor of building form, rarely conduct comprehensive and integrated analysis on multi-factor, which has a more practical and meaningful for the research of thermal comfort.
This study aims to improve the indoor thermal comfort of naturally ventilated gymnasiums at hot and humid climate through comprehensive architectural form optimization. Basing on the field investigation in 15 gymnasiums in Guangzhou China, which is a typical city in subtropical region with hot and humid climate [22], an initial model of gymnasium was established to analyze the indoor thermal comfort and explore the optimizing orientation. An orthogonal experiment with variety of factors and levels chosen by analyzing the field investigation was then conducted and simulated with the FlowDesigner software. Based on the simulation results, the significant factors of architectural form on thermal comfort were identified. Furthermore, the optimal combination of architectural forms of gymnasium was suggested to provide reference for the gymnasiums design at hot and humid climate.

2. Materials and Methods

In order to analyze the thermal comfort with multiple factors and the optimization of architectural form in gymnasiums, a hybrid method that combines the orthogonal experiment and computer simulation is conducted in this study, shown in Figure 1.

2.1. Simulation Tool and Its Validation

The first step aims to consider a suitable tool for thermal environment simulation. In order to achieve accurate calculation, simulation tools have been developed by researchers and engineers, such as Ecotect, TRNSYS, PHOENICS, Fluent, and FlowDesigner. Considering that the air temperature, relative humidity, air velocity, and the thermal comfort in the dynamic thermal environment are the main factors involved in this study, FlowDesigner, a type of computational fluid dynamics (CFD) simulation software was used in this study for the thermal and fluid simulations of gymnasiums. This software can enable wind and thermal analysis by easily importing 3D models of buildings or urban blocks developed by modeling tools, which could provide early analysis and reduce the design time. Therefore, it is friendly to used and verified in many studies [23,24,25].
In order to verify the accuracy of the results from the FlowDesigner, the thermal environment between simulation and that from field measurements are compared. The field measurement was conducted in a gymnasium located at the downtown area of Guangzhou, China, between 28 July and 10 August 2016. The gymnasium was completed in 1996 with the structure of steel. It is open on the south, east, and north sides, with a size of 57.6 m × 31.2 m × 10.8 m in length, width, and height. There are 3 basketball courts in the gymnasiums and are mainly used for athletes’ daily training and exercises. The gymnasium is indoor gymnasiums and natural ventilated during the measurement. The values of the indoor air temperature, indoor relative humidity and indoor air velocity were measured in the competition field of gymnasium at 30-min interval, from 9:00 to 18:00. The physical measuring instruments were arranged in five points, as shown in Figure 2, around the competition field at a height of 1.1 m in line with the relevant standards [26]. In turns of simulation, the gymnasium was simulated using the FlowDesigner with the weather data for the simulation is obtained from The United States National Climatic Data Center [27], which provides global historical weather and climate data from observations.
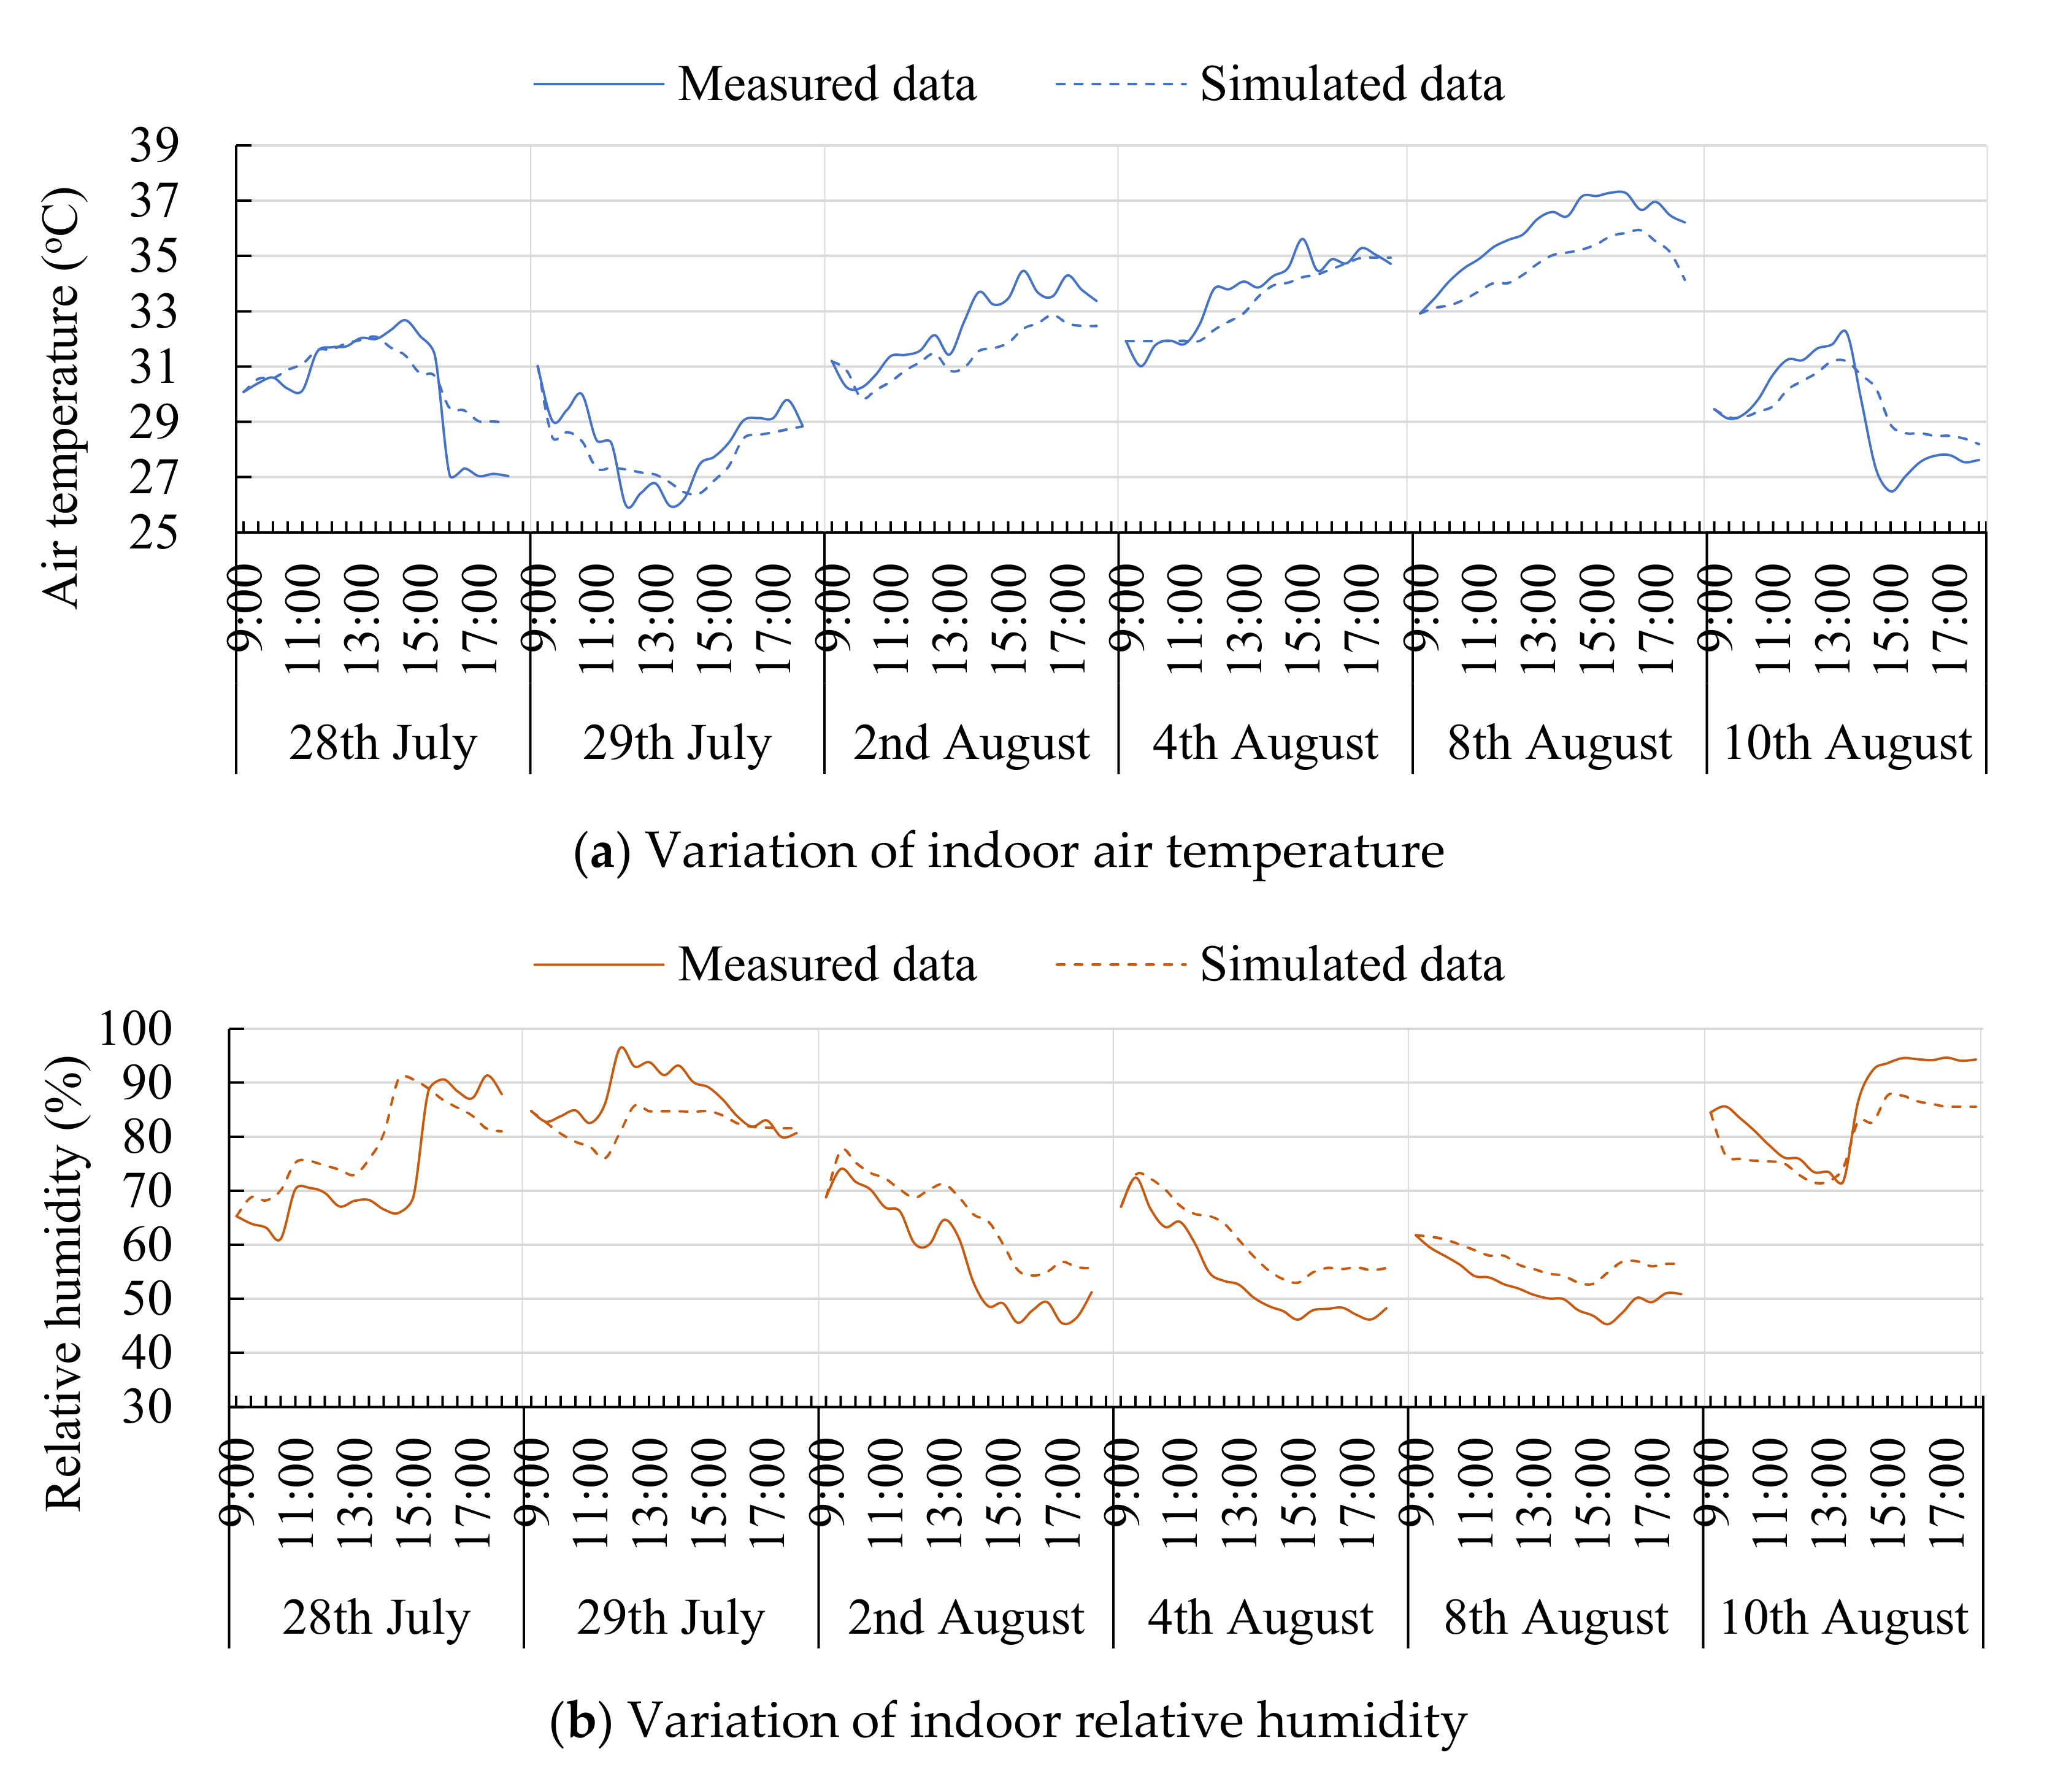
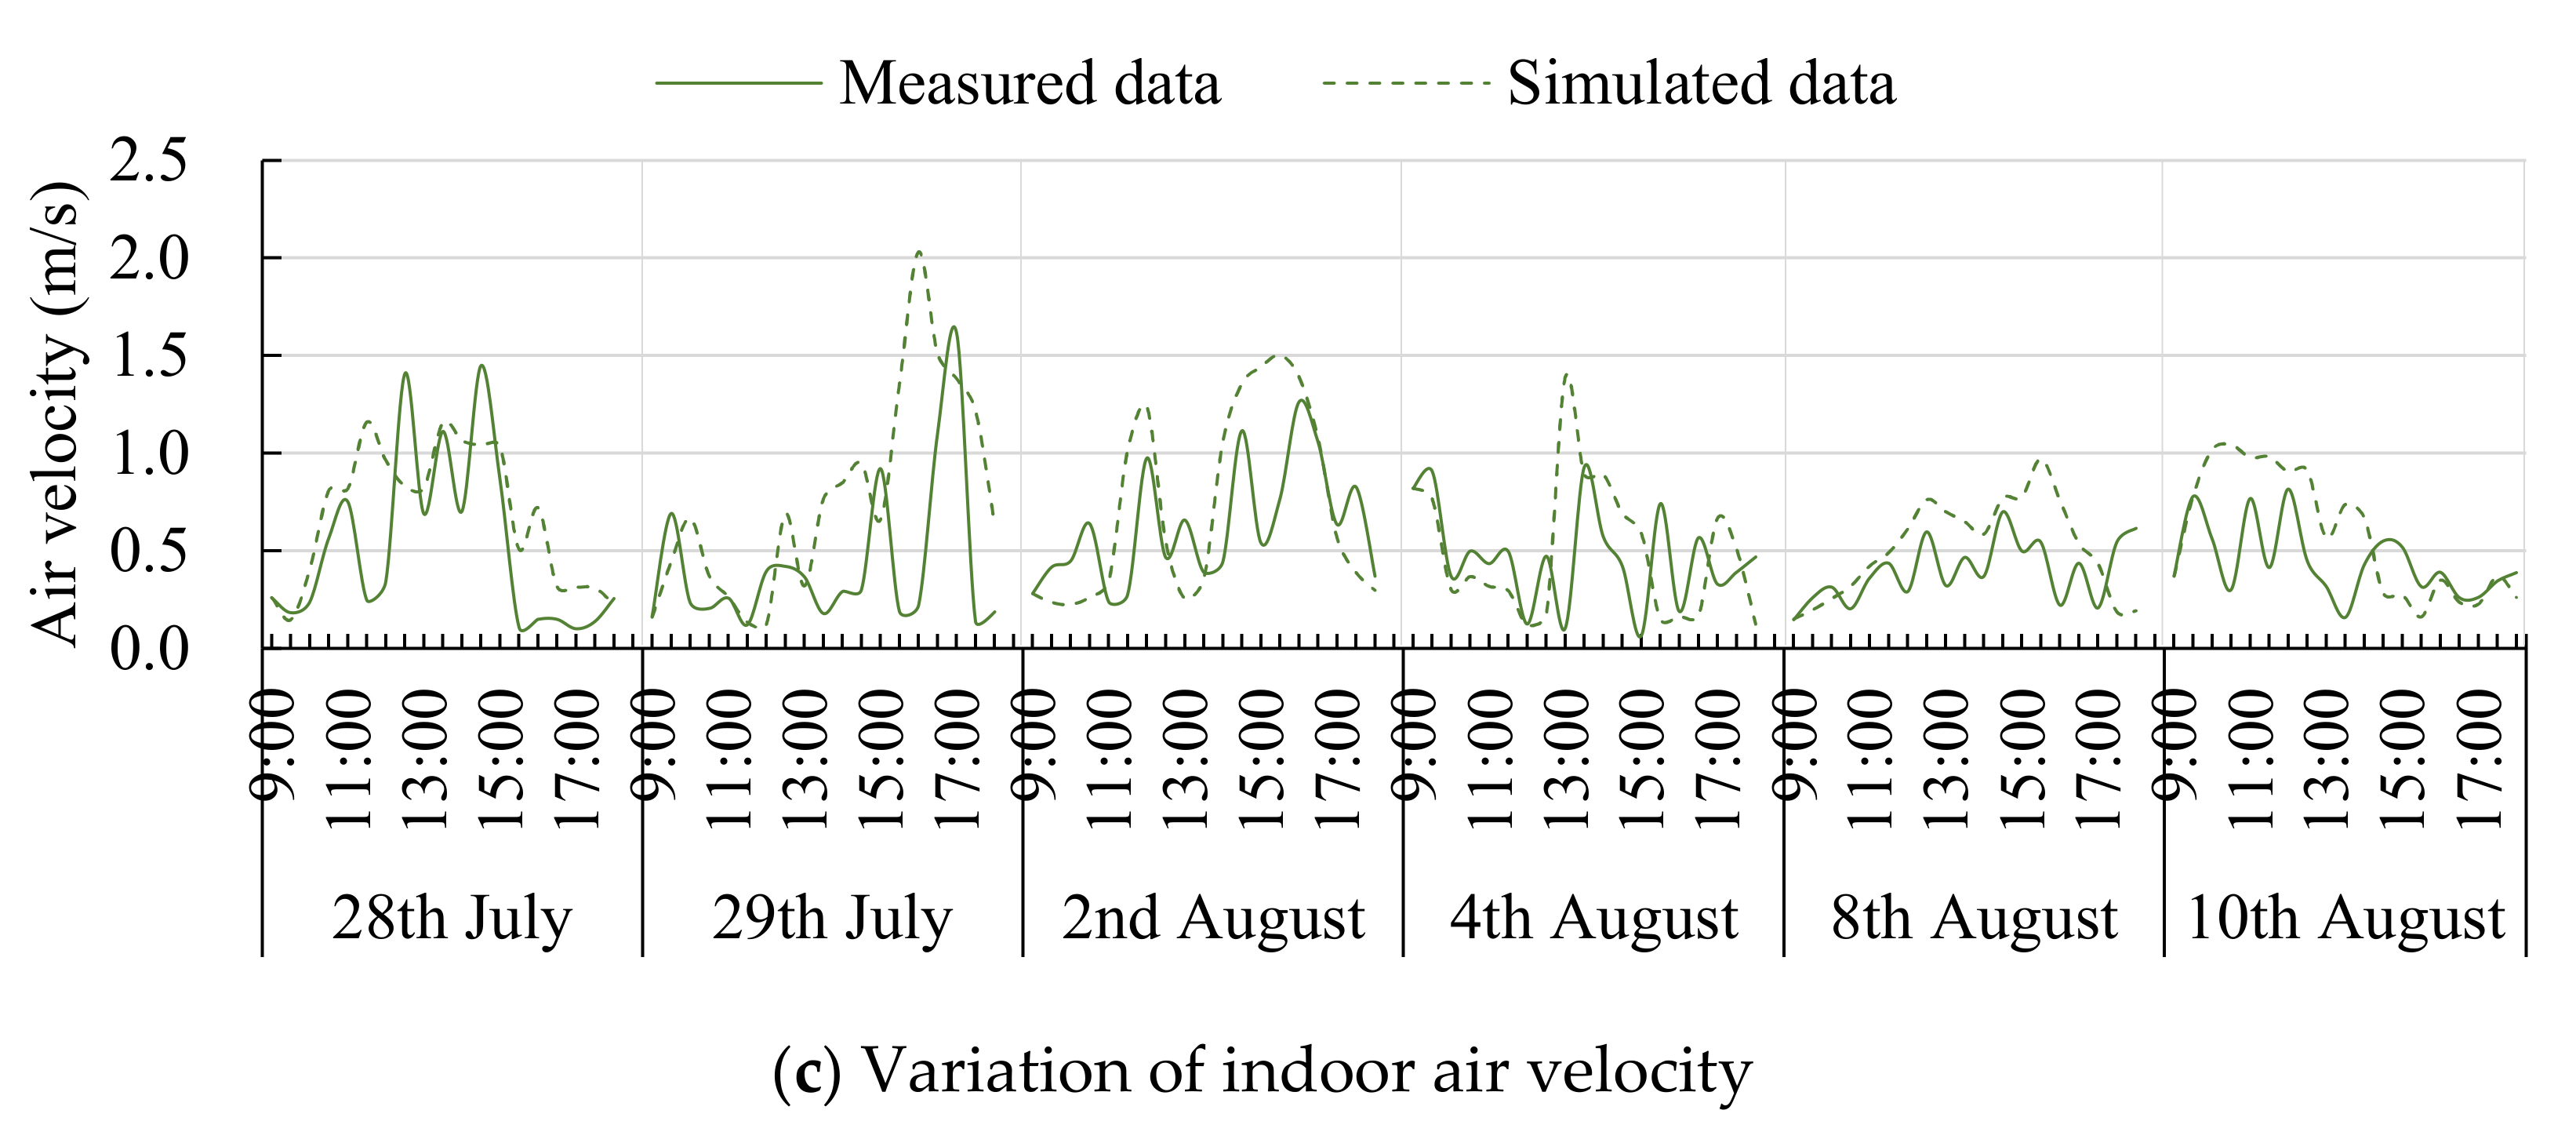
Figure 3 shows the variations of indoor air temperature, relative humidity, and air velocity between measurement and simulation, each value represents a single point at each 30 min. The variation tendencies of air temperature in measurement and simulation, as shown in Figure 3a, are consistent with each other, as well as the tendency of relative humidity, as shown in Figure 3b. The biggest difference between measured data and simulated data of air temperature is 2.92 °C appearing at 14:30 on 10 August, and the least difference is 0.01 °C at 10:30 on 4 August. As far as relative humidity, the biggest difference is 24.78% at 14:30 on 28 July and the least difference is 0.02% at 16:30 on 29 July. While the variation of air velocity between measurement and simulation are less consistent, as shown in Figure 3c, the average values of measurement and simulation are 0.31 m/s and 0.43 m/s, respectively, which shows little difference.
The reason for the discrepancy between the simulated data and the measured data is that the building environment is ideal in simulation, while the building environment is complex and changeable in practice. For example, the performance of the material is constant in the simulated environment but is changeable in the actual environment with the change of the thermal environment; the parameters of insolation are simple in the simulation, but the conditions of insolation in the actual environment are complex, which, to a certain extent, affects the air temperature and radiation. On the other hand, the simulation accuracy is limited; for instance, the accuracy of the grid setting in the simulation software is limited, and the parameter conditions of the special model are limited, which leads to the difference between the simulation data and the measured data. Although there are some errors between them, the trends and average values shown in Figure 3 are still relatively consistent. Therefore, we believe that the FlowDesigner software can be used in this study.

2.2. Selection of Thermal Comfort Model

Since the thermal comfort is the main issue discussed in this study, a thermal comfort model would be selected. The thermal comfort models, such as PMV and SET, are widely used around the world; however, none of them is proper to evaluate the thermal comfort for moving subjects, such as athletes [3,4,28]. For example, PMV is limited to the steady state environment, and SET could be applied in the naturally ventilated environment; however, it could only be used for the people in low metabolic rate. Because the research object in this study is the thermal comfort in the state of exercise in naturally ventilated gymnasiums, a thermal comfort model that is applicable for the occupants in high metabolic rates in gymnasiums is required. Through the field survey on the thermal sensation of exercising occupants in gymnasiums in hot-humid area of China, a model called the Predicted Thermal Sensation (PTS) was proposed in a previous study [29]. This model is available for accurately estimating the thermal sensation of occupants with exercises in gymnasiums at hot and humid climate in China. The PTS model is formulated in Equation (1), and the scale is shown in Table 1.
PTS = −5.127 + 0.201Top + 0.001Wa − 0.045v + 0.002M − 1.184Icl (R2 = 0.814),
where PTS is the Predicted Thermal Sensation, whose values ranges from −3 to 3 as the TSV does; Top is the operative temperature in °C ranges from 10 °C to 40 °C; Wa is the humidity ratio in g/kg’ varies from 8 g/kg’ to 25 g/kg’; v is the air velocity in m/s; M is the metabolic rate in W/m2, whose values ranges from 250 W/m2 to 350 W/m2; Icl is the clothing insulation in clo varies from 0.22 clo to 0.29 clo.

2.3. Principle of Orthogonal Experiment

Orthogonal experiment is a systematic and statistical method for achieving the optimization of multiple factors with different levels of values [20]. These standard arrays provide the way of conducting the minimal number of experiments which could give the full information of all the factors that affect the performance parameter. The orthogonal table is the foundation of the orthogonal experiment, as shown in Equation (2).
Ln (mk),
where L is the symbol of the orthogonal table; n is the number of trials arranged in the orthogonal experiment; m is the number of levels; k is the number of factors.

2.3.1. Range Analysis

As the appropriate analysis methods for the orthogonal experiment, two methods are introduced, range analysis and variance analysis [21]. Range analysis aims to detect the levels of different influential factors on indices, as shown in Equation (3). In this analysis, the larger value of Rj, the greater importance of the factor.
Rj = max (kji) − min (kji),
where Rj is the range of values between the maximum and minimum values of Kji. Kji is the average value of the sum of the experimental results at all levels (i, i = 1, 2, 3) of each factor (j, j = A, B, C, D, E, F).

2.3.2. Variance Analysis

For further analysis, the variance analysis can be used to determine the influences from experimental conditions, errors and the significant of factors. In the variance analysis, the sum of the squared deviation (SS), the degree of freedom (df), and the variance of the factor or error (V) are expressed as Equations (4) and (5). The F value is compared to a critical value of a significant level, which is normally set at 0.05. The impact of the selected factor on the test results is considered to be significant if it is greater than the critical value, and vice versa.
SS = k = 1 n ( W k w ) 2 ,
V = SS/df,
where SS is the sum of the squared deviation; Wk is the results of each trial (k, k = 1, 2, 3, ……, n); w is the arithmetic average of Wk; df is the degree of freedom; V is the variance of the factor.

2.4. Statistical Analysis

In this study, the research process begins with the orthogonal experimental design, then conducts the simulation of the trials in orthogonal experiments, and, finally, analyzes the optimization result in the aspect of thermal comfort. As the simulation in FlowDesigner only outputs the values of air temperature (Ta), surface temperature (Tk), relative humidity (RH), and air velocity (v), a further calculation should be conducted to obtain the PTS value.
The PTS equation, as shown in Equation (1), contains five parameters: operative temperature (Top), humidity ratio (x), air velocity (v), metabolic rate (M), and clothing insulation (Icl). The operative temperature (Top) can be calculated with Equation (6) [3], and the mean radiant temperature (Tr) is calculated with Equation (7) [4,30]. The humidity ratio (Wa) is calculated by the relative humidity (RH), as shown in Equation (8). The metabolic rate is calculated basing upon the measurement of heart rate proposed in the ISO8996 [31]. Since the exercising state in gymnasium is the premise of the study, the average value of 300 W/m2 collected from the previous field survey is applied in this paper. The clothing insulation, calculated from ASHRAE Standard 55-2017 [3], is 0.22 clo for the occupants exercising in gymnasium at hot and humid climate.
Top = ATa + (1 − A) Tr,
T r = N = 1 n ( T N F P N )   ,
W a = 0.622 RH   p as p φ p as ,
where Top is the operative temperature in °C; A is a coefficient as a function of the average air velocity [3]; Ta is the air temperature in °C; Tr is the mean radiant temperature in °C; TN is the surface temperature of surface (N) in °C; Fp-N is the angle factor between a person (p) and surface (N); Wa is the humidity ratio in g/kg’; RH is the relative humidity in %; pas is the saturated water vapor pressure in Pa; p is the atmospheric pressure in Pa.

3. The Initial Model of Gymnasium in Hot and Humid Area

3.1. The Situation of Gymnasiums in Guangzhou City

The basic for optimizing the architectural form of gymnasium is first to realize the situation of gymnasiums exhaustively. To obtain the architectural parameters of gymnasiums, investigation was carried out around 15 naturally ventilated gymnasiums in Guangzhou. The investigation includes the building size, audience capacity, auditorium layout, building material, and the characteristics of the architectural forms. Table 2 gives the building information of investigated gymnasiums, presenting that the gymnasium sizes are medium in major with around 3000~6000 seats and two-sided auditorium. Most of the gymnasiums are built by the material of reinforced concrete. In terms of the window position, most of the windows in investigated gymnasiums are at the height of the walls. As the window-to-wall ratio (WWR) stipulating less than 0.7 in public buildings according to the relevant regulations of China [32], the WWR in most investigated gymnasiums achieve this standard, and 10 of them even less than 0.3. In the aspect of roof slope, 8 gymnasiums are horizontal roofs, and 7 are slope roofs. Since the shading is important in southern China, overhanging eaves are built in most of the gymnasiums with different depths.

3.2. Plan Layout of the Initial Model of Gymnasium

Abstracting the main parameters from the investigated gymnasiums in Guangzhou, an initial model of gymnasium is built up as a basis for simulation and optimization in the next step, the plan layout and perspective of the initial gymnasium model are shown in Figure 4. The gymnasium model is settled in medium size with a total area of 3150 m2. There are two sides auditorium in it, with 3688 seats. The building material is reinforced concrete, and the external walls are 0.3 m in thickness. Windows are built on the high position of the south wall and north wall. Although the WWR of the investigated gymnasiums are around 0.3, the openable and transparent windows are few. Thus, the WWR of initial model is set in 0.1 as the windows are all openable and transparent. In addition, the roof of initial model is horizontal, while the depth of overhanging eave is 1 m.

3.3. Simulation of the Initial Model of Gymnasium

The FlowDesigner is used to simulate the thermal parameters of the initial model over a period of one month (August) on an hourly basis. The weather data for simulation is obtained from the Energy Plus [33]. As the gymnasium is a place for sport, the simulation zone of initial model is the competition field, as shown in the red area (48.6 m × 32.4 m × 1.1 m) of Figure 3. The natural ventilation mode is adopted in this simulation, with the influence of solar radiation considered in the simulation. In the calculation process, the Hypothesis of Boussinesq is used, which means the change of fluid density only would affect the buoyancy. Moreover, the detailed design parameter information about the building envelope is described in Table 3. The simulated results of operative temperature, relative humidity, air velocity, and the PTS values over August on an hourly basis are shown in Figure 5. The settings in initial model simulation are used for further simulations of optimization.
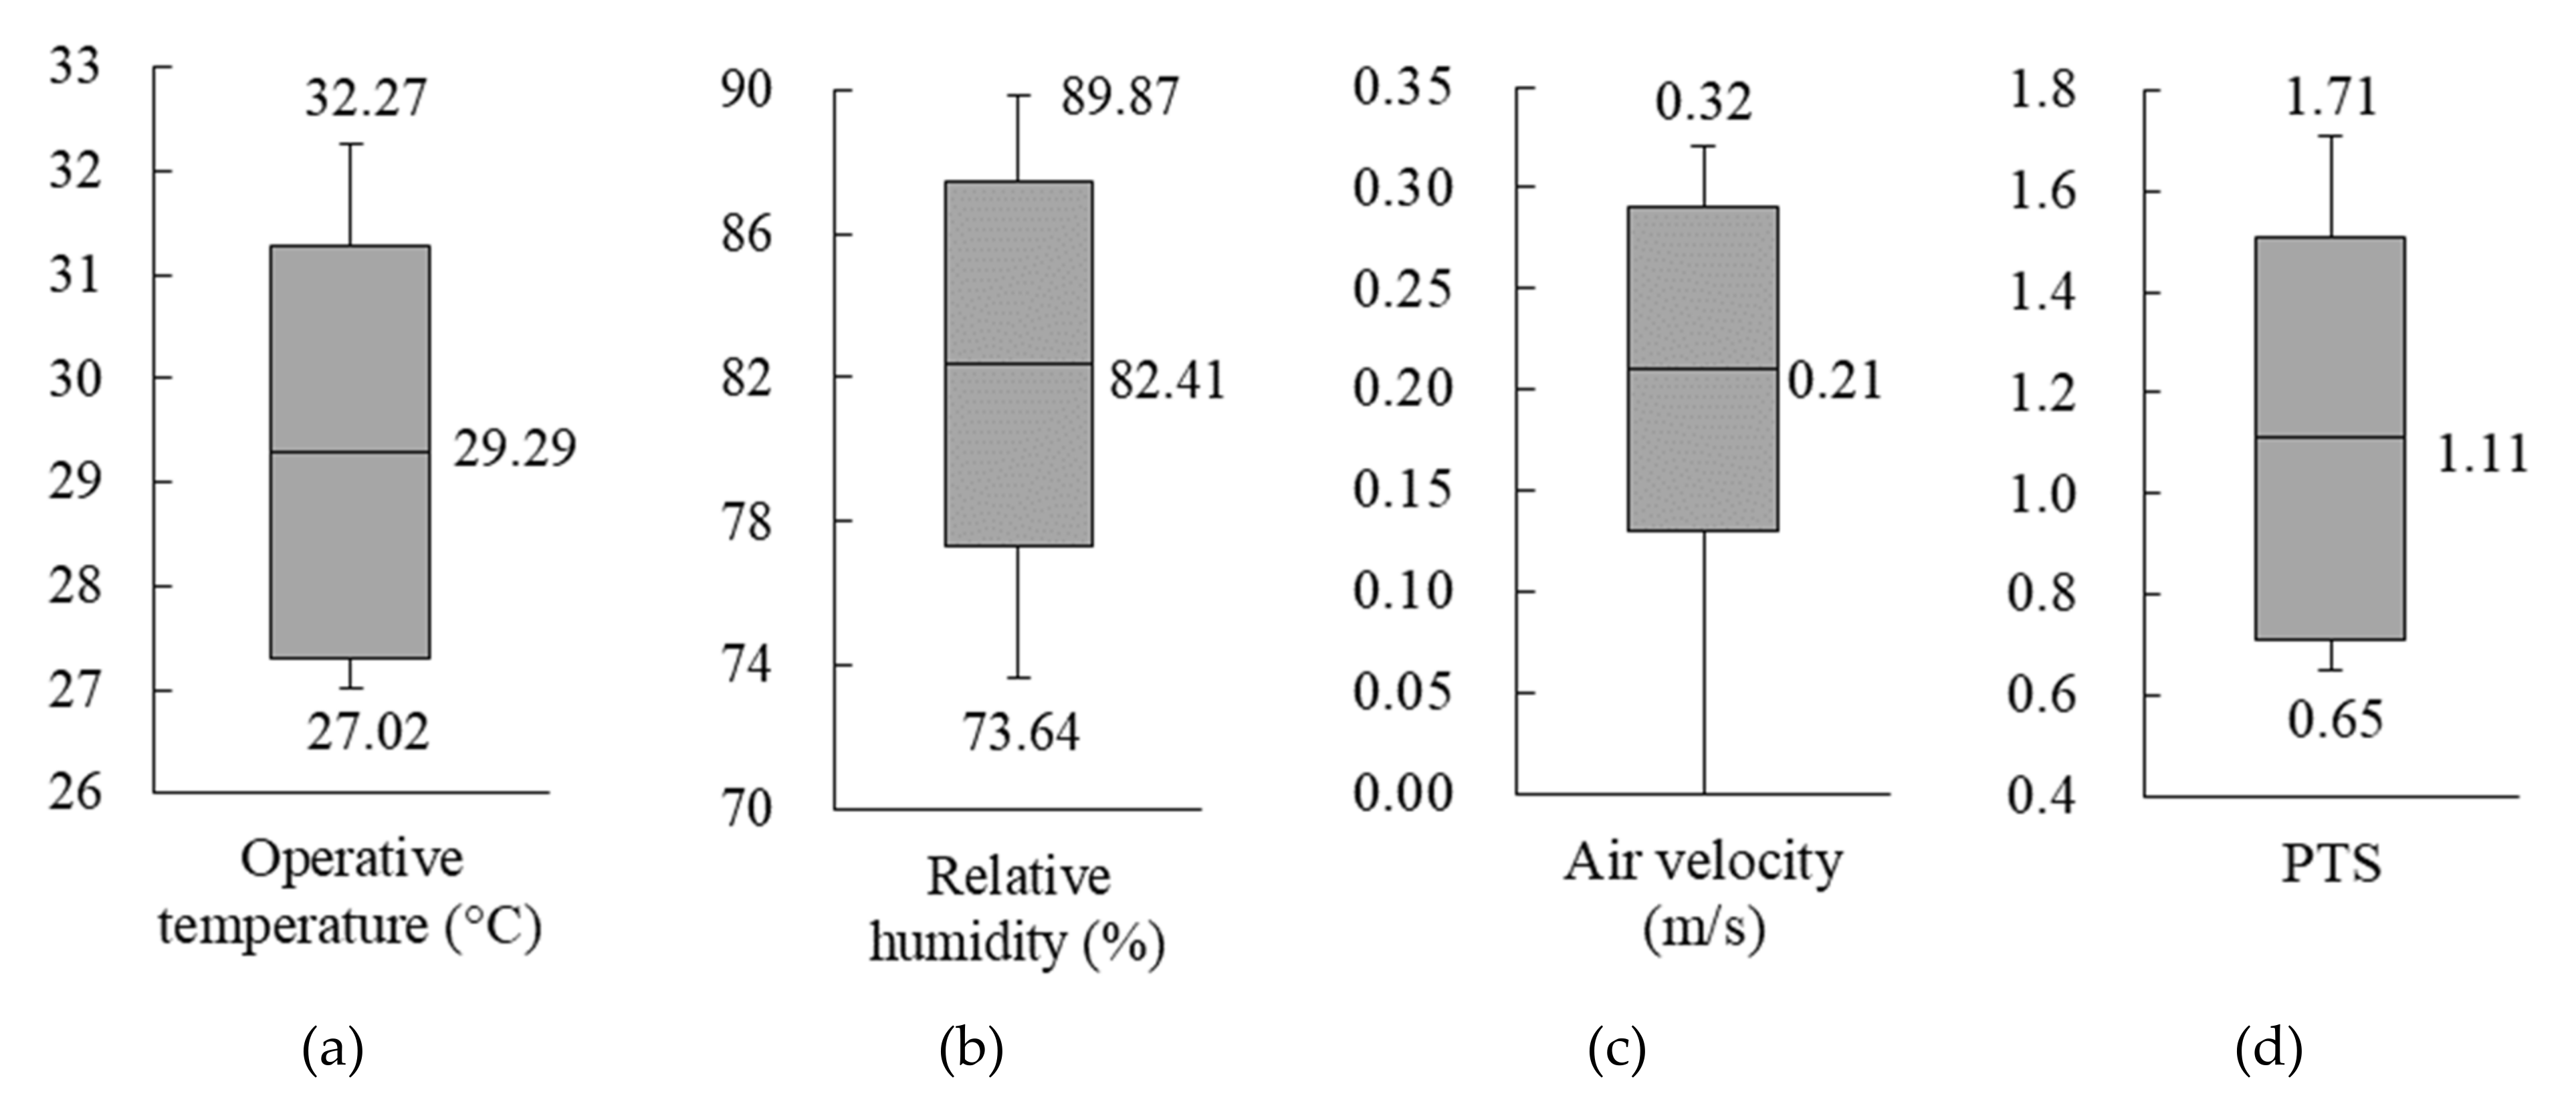
Figure 5 presents that the indoor operative temperature of initial model ranges from 27.02 °C to 32.27 °C in August, with an average value of 29.29 °C and the relative humidity changes from 73.64% to 89.87%, with an average value of 82.41%, which is consistent with the features of the hot-humid climate. In addition, the average air velocity is 0.21 m/s, meeting the requirement of wind speed for sports [34]. In the aspect of PTS value, the average PTS is 1.11, which represents “slightly hot” in thermal sensation. Furthermore, the maximum value reaches 1.71, which is close to “hot” in thermal sensation, indicating that the indoor thermal comfort of initial model is not effective, and the measures should be taken to improve the thermal comfort in summer days.

4. Simulation Results and Optimization Analysis

In order to propose an optimal strategy of architectural form for indoor thermal comfort of gymnasiums, the factors and corresponding levels of architectural form that affecting thermal comfort of gymnasium are selected based on the initial model in this section. Later, the simulations are conducted in FlowDesigner followed by the trials generated from the orthogonal experimental design. After obtaining the thermal environment data from simulations, the PTS values can be calculated. Through the range analysis and variance analysis of PTS values, the optimized architectural form of gymnasium is suggested.

4.1. Simulation Factors and Levels of Orthogonal Experiment

There are many factors of architectural form that influence indoor thermal comfort of gymnasium. According to the initial model and the previous research, six parameters of architectural form are addressed in this study, namely the main window position (A), south WWR (B), north WWR (C), roof insulation type (D), roof slope (E), and depth of overhanging eave (F). These six parameters are taken as the factors of orthogonal experiment, and three levels are chosen for each factor. The orthogonal experiment is shown in Table 4.
  • Factor A: The window position affects the natural ventilation and thermal comfort, as well as even energy consumption. In previous research, Prakash [35] identified a new set of strategies to locate the window openings which could reduce the PMV by 0.12%. Kim et al. [36] demonstrated that the buildings achieve the lowest energy consumption when the windows were located in the middle height in all orientations. As the wind direction in Guangzhou is mainly from southeast to northwest, the window position on south and north is more valuable to study than that on east and west. The three levels in factor A in this study are different positions of main windows that were selected from the result of investigation and the relevant research.
  • Factor B and C: As a significant factor affecting on indoor thermal environment, the WWR plays an important role in architectural design. There are extensive research and efforts focused on the WWR up to now. Kahsay et al. [37] tried to analyze the optimization of window configuration for a high-rise building to minimize its energy consumption, and he obtained the optimum WWR of 30%, 48%, and 30% for a room located on the 2nd, 15th, and 29th floor, respectively. Wen et al. [38] took the indoor air temperature as the parameter to evaluate the optimal WWR and proposed a WWR maps for the architectural design in the early stages. According to the relevant research and regulations of China, as well as the investigation in Guangzhou, the WWR in the study are chosen in three levels, 10%, 20%, and 30%.
  • Factor D: The heat gain from the solar radiation is a key problem in the buildings in south of China. Since the roof surfaces are the main positions absorbing radiant heat, the insulation measures of roofs are critical. Zingre et al. [39] compared the thermal performances between the double skin roof and the insulated roof in Singapore, found that the double roof performs better in reducing heat gain into the building during daytimes. Yang et al. [15] analyzed the correlations between indoor thermal comfort and Double-Skin Façades in different climatic conditions and found that the solar heat gain coefficient of the external window of the Double-Skin Façades possessed the highest importance affecting indoor thermal comfort. In this study, three types of roof are selected to discuss the optimum for the gymnasiums in hot and humid climate. The single skin roof is the ordinary reinforced concrete roof without any passive cooling; the double skin roof is with an air cavity of 500 mm thickness inside; the insulated roof composes of reinforced concrete and an insulation board of 20 mm thickness.
  • Factor E: Roof slope can regulate the natural ventilation and cooling effect. Mao and Yang [40] investigated the heat transfer performance of double-slope hollow glazed roof with different slope angles in hot summer and cold winter regions, and the results indicate that the inner surface temperature of the roof reduced obviously with the roof slope decreases. Since the wind direction in Guangzhou is southeast-to-northwest, the three levels of roof slope in this study are mainly consider the south-north direction.
  • Factor F: The overhanging eave influences natural ventilation and shading, as well as heat insulation. Li [11] simulated the symmetrical and asymmetrical models of a gymnasium in Guangzhou and recommended adjusting the width and angle of the overhanging eaves of the gymnasiums to improve the thermal performance. Due to most of the investigated gymnasiums in Guangzhou own overhanging eaves on the roofs, the three levels of factor F are different in the depth of overhanging eave.

4.2. Range Analysis

Since the six factors (A~F) and three levels (1~3) for each factor are selected for the orthogonal experiment, the orthogonal table L18 (37) is adopted according to the principle of orthogonal experiment. Then, the 18 tests are generated and simulated in FlowDesigner to obtain the thermal environment data and the PTS data. Table 5 illustrates the range analysis results for the influence of different factors on the thermal comfort (PTS). By comparing the Rj values of each factor, the influence of the six factors on PTS are ranked as follows: D > A = E > F > C > B. The most influential factor on thermal comfort in gymnasium is the roof insulation type. Then, it is followed by the main window position, roof slope, depth of overhanging eave, north WWR, and south WWR.
The roof insulation type becomes the most important factor because the climate conditions of high temperature and high radiation in Guangzhou make the building roof receive more heat than other interfaces. Therefore, different roof insulation types would obviously and directly affect the heat gain of the roof, further influencing the indoor air temperature and mean radiant temperature which directly affect the indoor thermal comfort. In addition, the main window position and roof slope rank second, probably because they could influence the wind environment to a certain extent, which further affect the indoor thermal comfort.

4.3. Correlations between Factors and Indicator

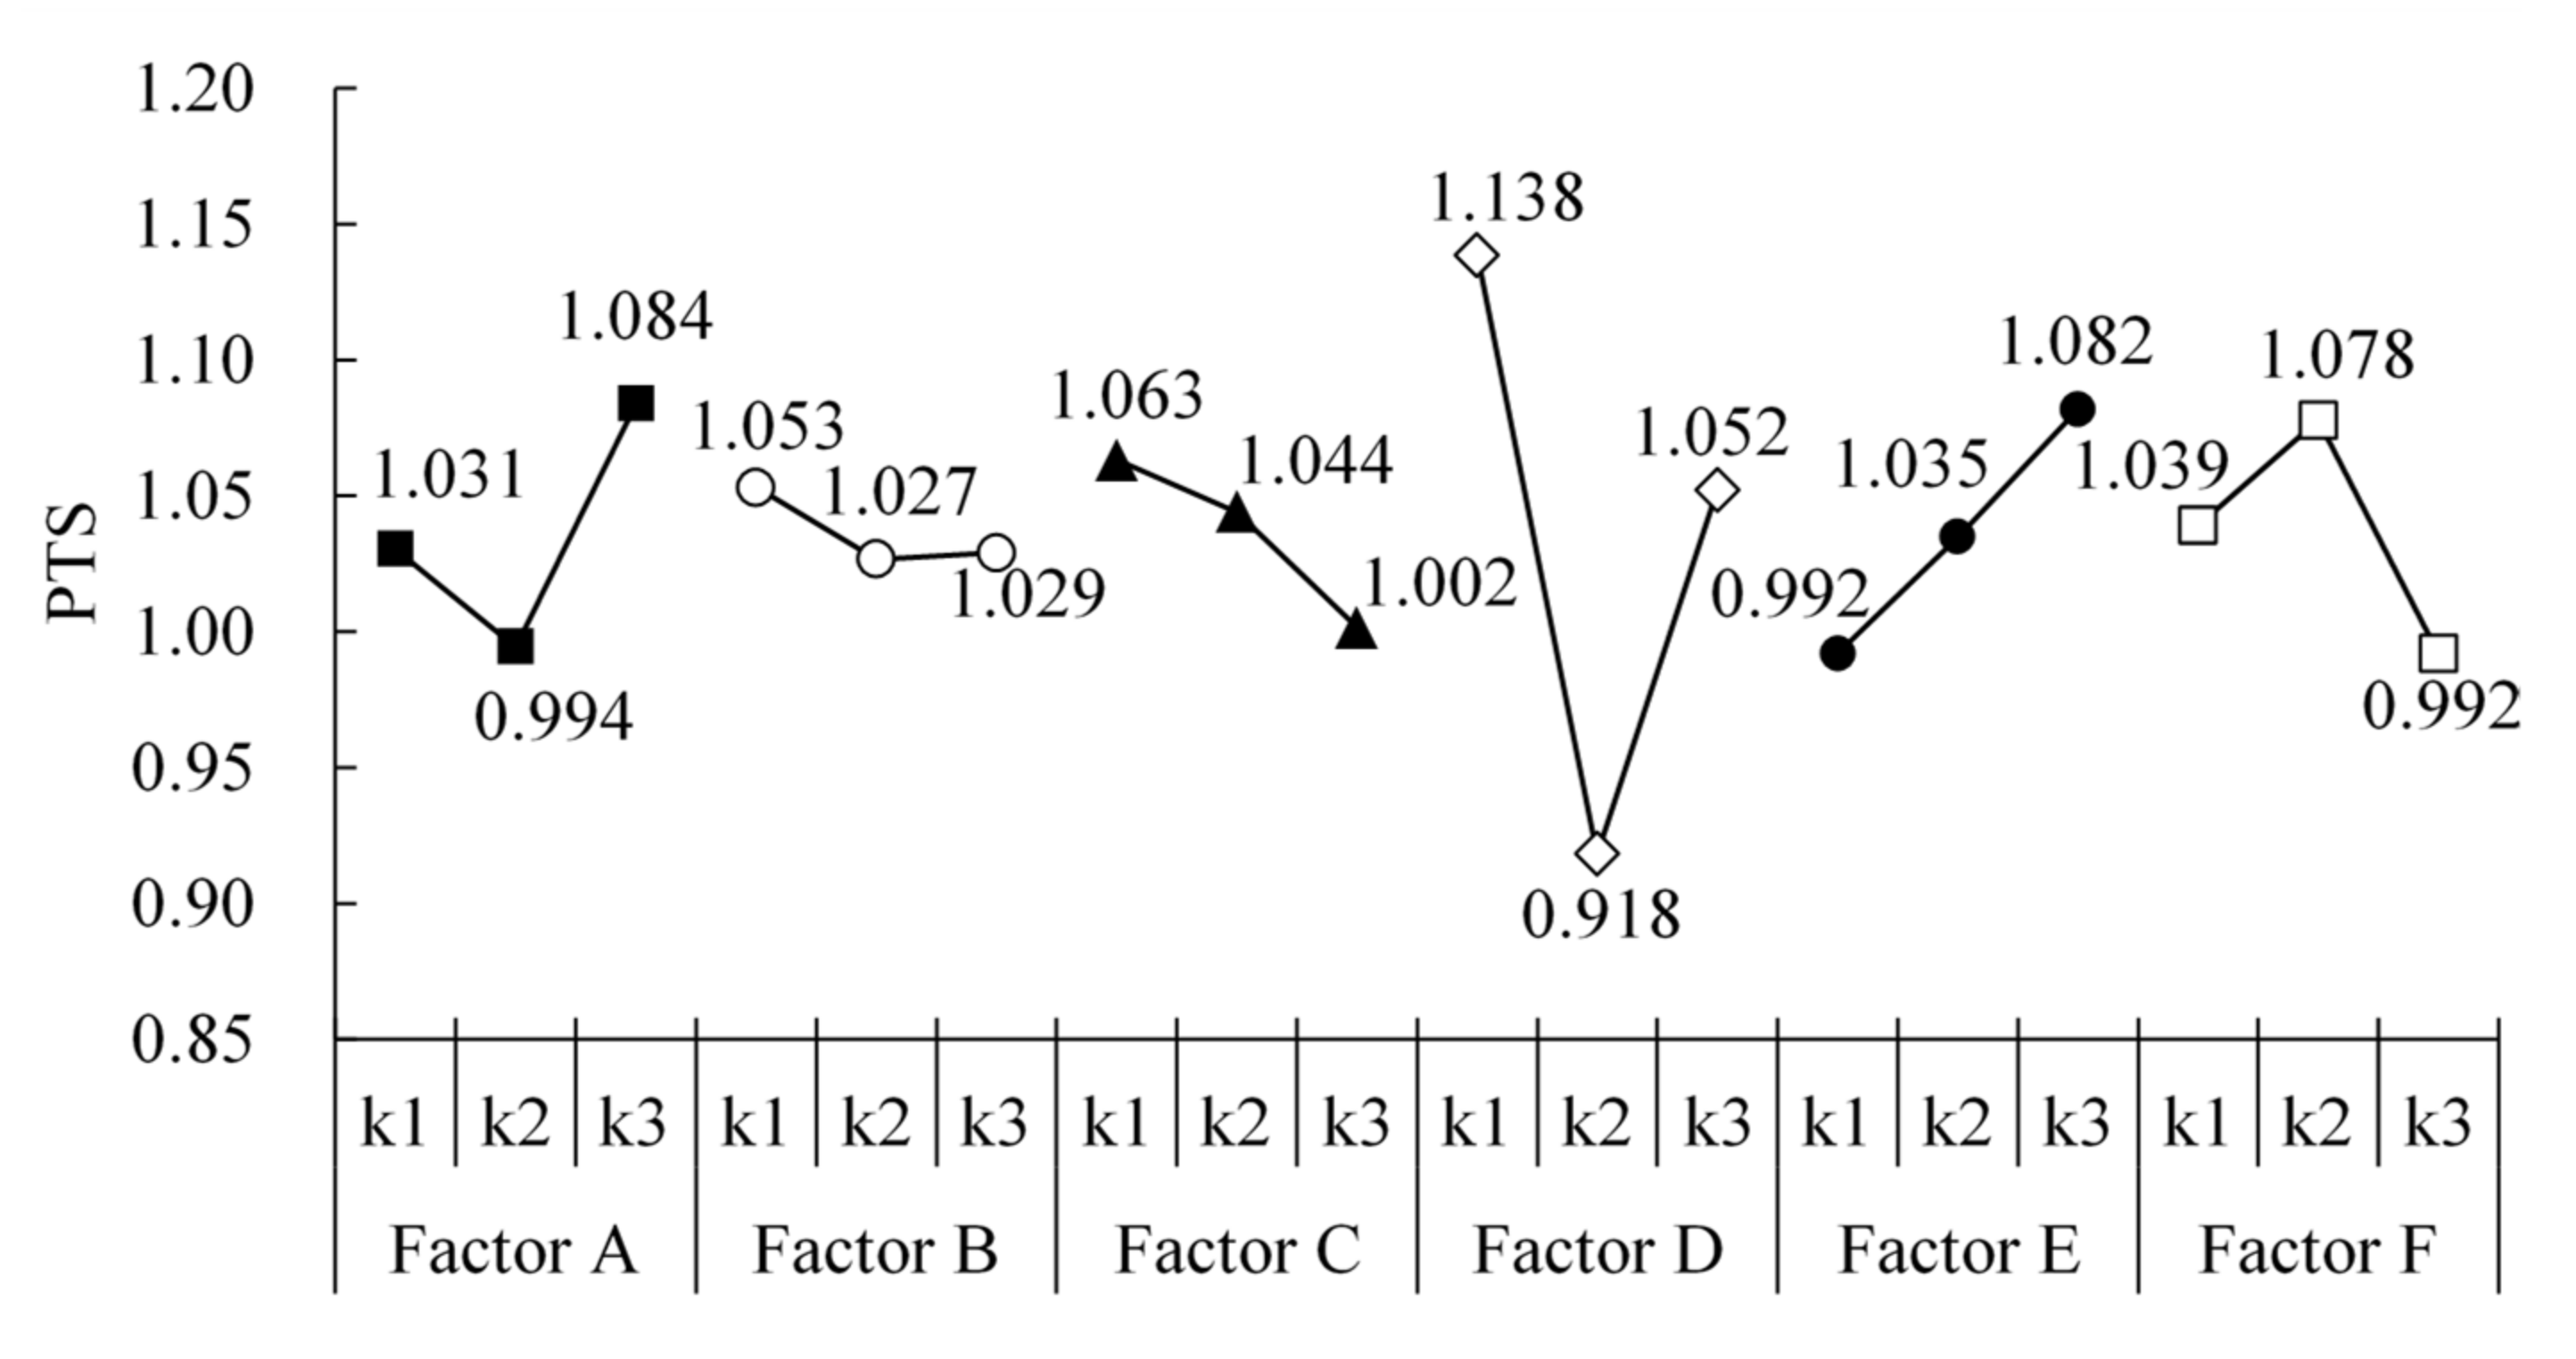
The correlations between the index of interest (PTS) and the six corresponding factors (A~F) are presented in Figure 6. It illustrates the influence rules of factors levels on the PTS in the process of optimization of architectural form. Taking Factor A as an example, the PTS value in Level 1, 2, and 3 is 1.031, 0.994, and 1.084, respectively. As the value in Level 2 achieves the lowest, Level 2 is the optimum for Factor A. In the same way, Factor B, C, D, E, and F achieve the lowest PTS values in Level 3, Level 3, Level 2, Level 1, and Level 3, respectively. Thus, combining the optimal level of each factors, the optimum combination of architectural form is A2B2C3D2E1F3, which represents the windows are at the low position on the south wall and at the high position on the north wall; the south WWR is 20%, and north WWR is 30%; the roof is horizontal and double skin, and the depth of overhanging eave is 9 m.
Because of the prevailing southeast wind in summer in Guangzhou, the low window on the south wall introduces the southerly wind to the greatest extent. Meanwhile, thanks to the thermal pressure difference and the wind pressure difference between the windward side and the leeward side, the indoor hot air flows out through the high window on the north wall, forming a good naturally ventilated environment. Furthermore, a large WWR also improves the natural ventilation. As far as the gymnasium roof is concerned, the double skin roof would benefit from the air gap, which acts as an insulation layer to allow the airflow to effectively take away the heat to outdoor environment, reducing heat gain from the indoor environment through the primary roof. In addition, the 9-m overhanging eave can obtain a better shading effect, which plays an important role in reducing solar radiation and indoor temperature.

4.4. Variance Analysis

Table 6 presents the results of the variance analysis. The sum of the squared deviation (SS), the degree of freedom (df), the variance of the factor (V) and F value (F) have been calculated according to the regulation of variance analysis in orthogonal experiment. By comparing the F values of each factor to the critical value F(0.05), Roof insulation type is the most significant factor influencing the thermal comfort. The factors of main window position, roof slope, depth of overhanging eave, north WWR, and south WWR are less significant than the factor of roof insulation type.

5. Discussion on the Optimization Effects

5.1. Optimized Model vs. Initial Model

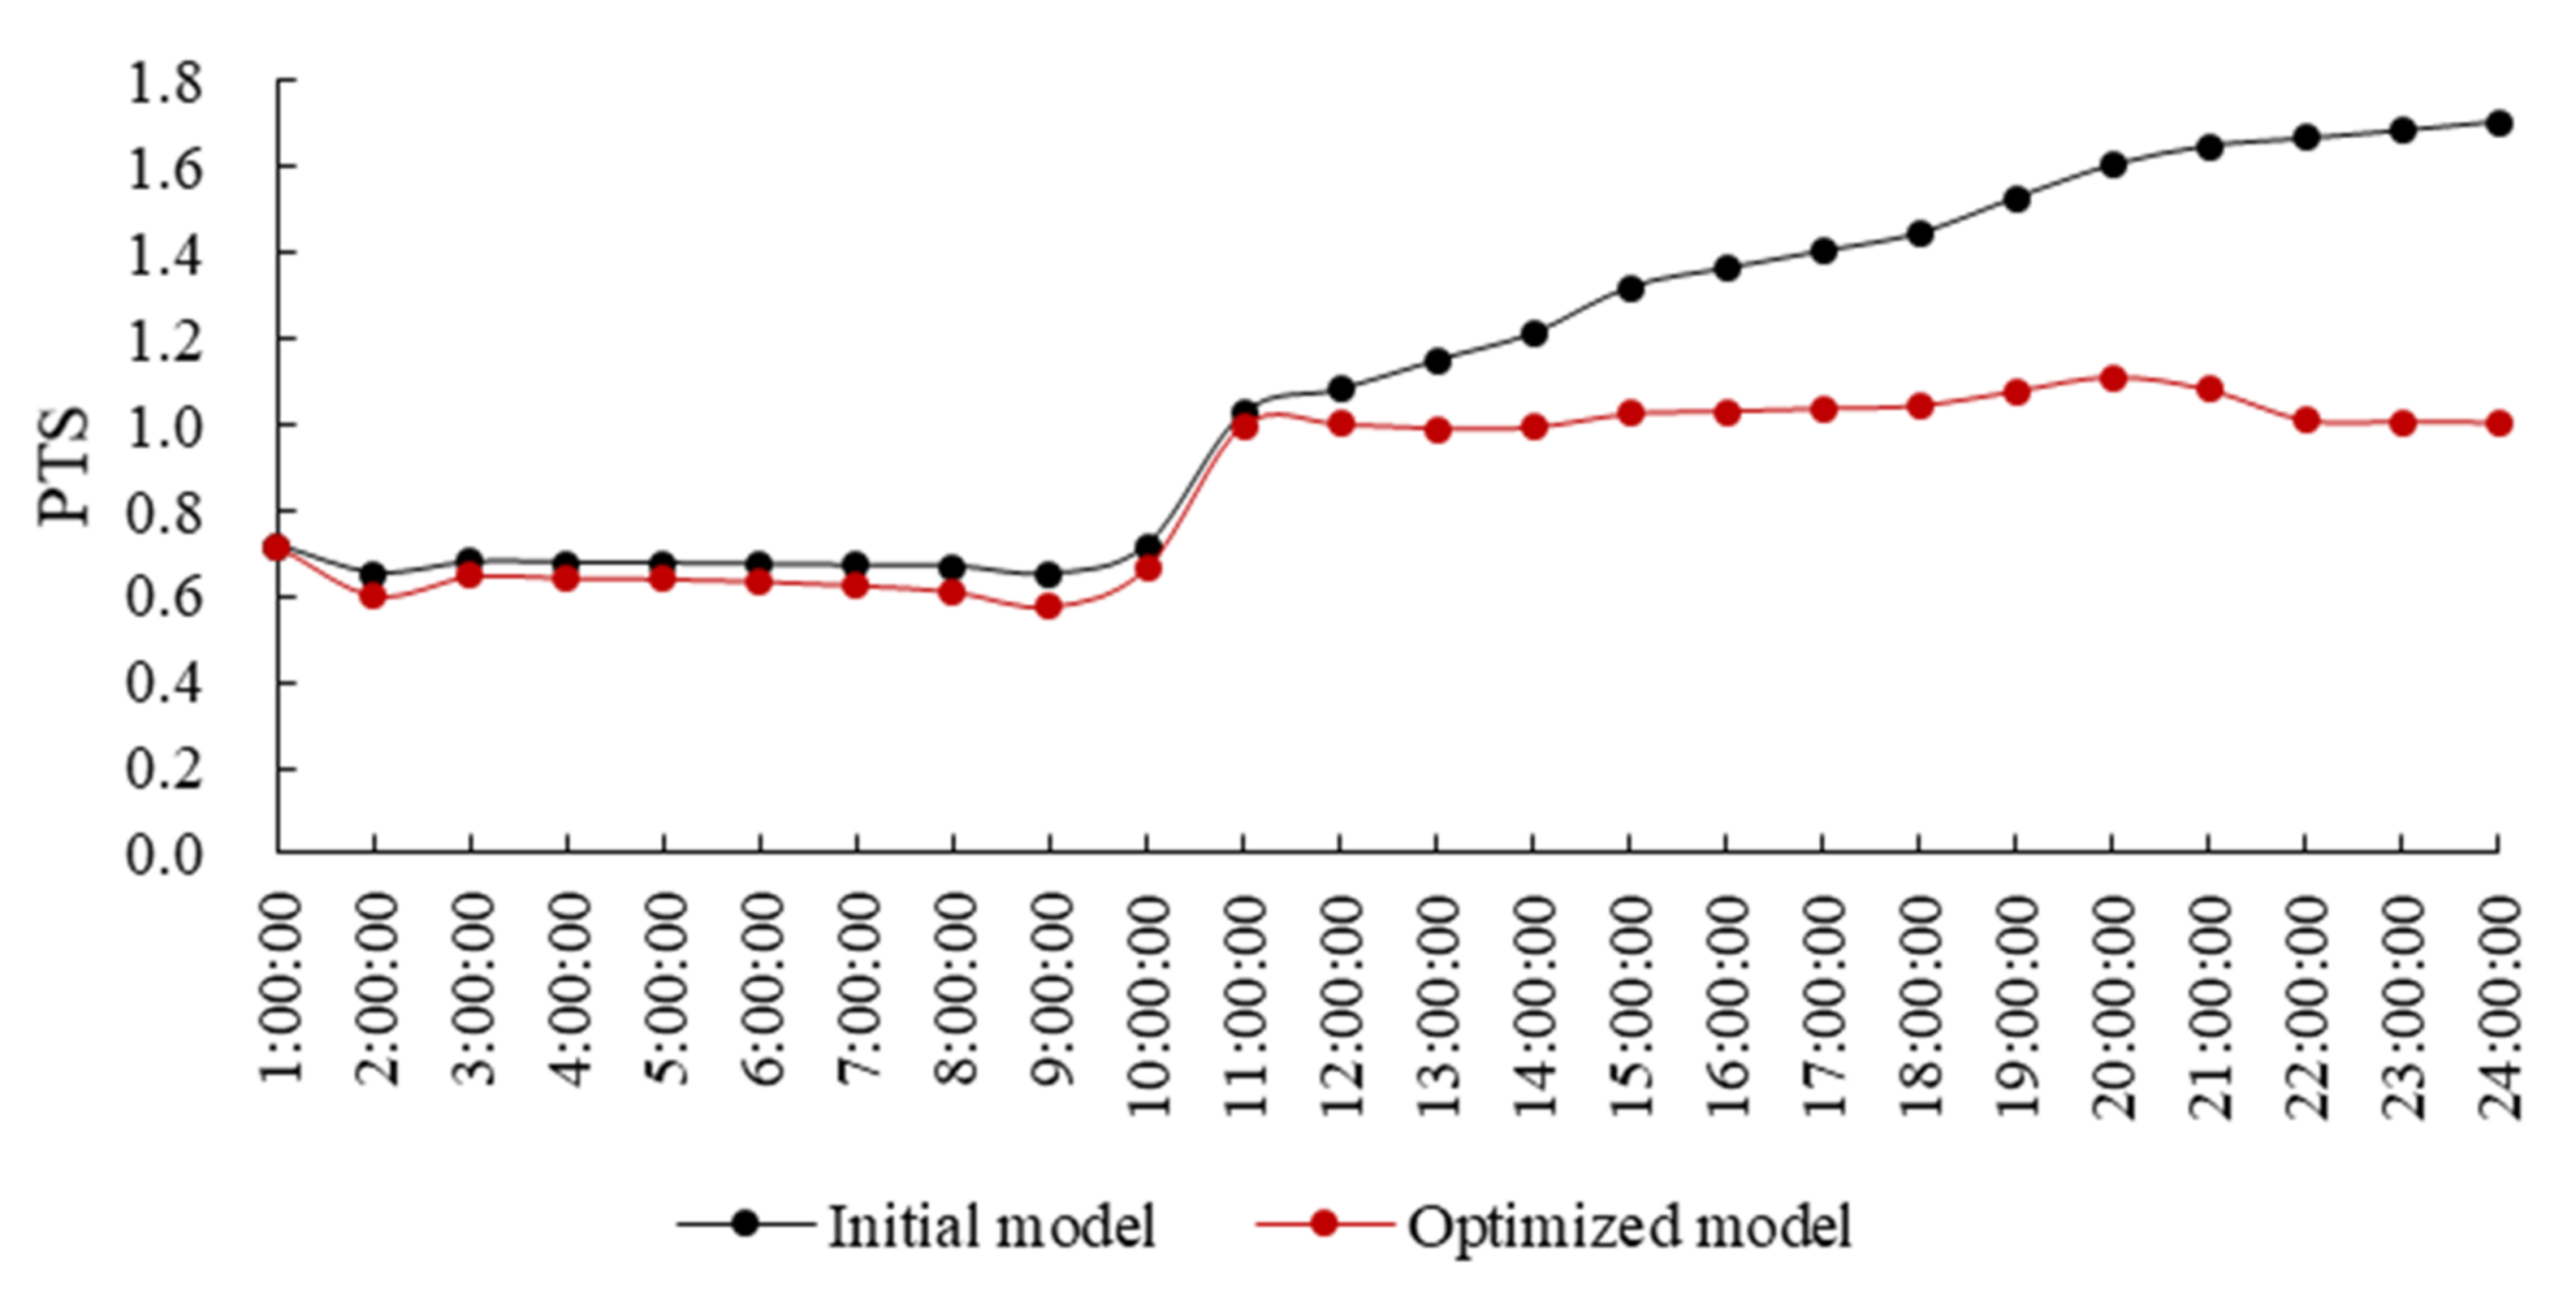
Comparing with the initial model of gymnasium, the optimized model of gymnasium improves a lot, as listed in Table 7. The change of window position, as well as WWR, improves the natural ventilation as the indoor average air velocity increases from 0.21 m/s to 0.77 m/s on summer days. As a significant factor, the double skin roof in optimal model improves the thermal performances, the indoor average operative temperature decreases from 29.3 °C to 28.21 °C, and the PTS drops from 1.11 (slightly hot) to 0.86 (comfortable).
Figure 7 shows the variation of hourly average PTS of the initial model and the optimized model in August. The average PTS values in the optimized model are slightly lower than those in the initial model before 11 am. Then, the gap between them grows to around 0.7 until midnight. The gap of PTS is mainly reflected in the afternoon because the wall and the ground had a certain heat storage capacity, while the heat accumulates in the daytime starts to dissipate in the afternoon due to the time gap. Therefore, the indoor temperature and radiation of the gymnasium without optimization increases rapidly, which results in an increase of the PTS value. On the contrary, the optimized gymnasium form improves the indoor thermal environment and wind environment, thus slowing down the increase of the indoor temperature and radiation, increasing the indoor air flow rate, but reducing the PTS value. This phenomenon indicates that the optimized gymnasium form could improve the indoor thermal comfort to some extent, and such optimized gymnasiums would be beneficial to people and the cities.

5.2. Comparing with Other Studies

This study proves that the roof insulation type is the most significant architectural form affecting indoor thermal comfort of gymnasiums at hot-humid climates. Meanwhile, the double skin roof, benefiting from the effect of thermal insulation of air gap, obtains a better thermal comfort than the single skin roof and insulated roof. Similar results have been found in other relevant studies. Gagliano et al. [41] found that the double skin roof could constitute an interesting system in order to reduce heat transfer from the roof into the building, allowing significant heat flux reduction (up to 50%) during summer. Omar et al. [42] investigated the benefits of using double skin-ventilated roofs for reducing cooling loads and discovered that using the double skin roof could enhance almost 50% of the energy saving rate rather than using the single skin roof. Moreover, the energy saving efficiency could be even better, up to 85%, in case the roof has an insulated layer. Zingre et al. [39] found that performance of the double skin roof was 28–34% better than that of the insulated roof in reducing heat gain into the building during daytime and allowed 3–5 times more heat loss from the building during night-time. These results reflect that the double skin roof, as the optimum type of roof insulation, plays an important role in improving the thermal environment and thermal comfort. Meanwhile, the results also illustrate that the optimization of architectural forms has a great impact on the indoor thermal environment and thermal comfort. In the previous research, Huang et al. [12] found that the gymnasium with large opening on the side interface and multi-story roof achieved lower indoor temperature and better ventilation efficiency. Besides, Li [11] studied the influence of the overhanging eave of gymnasium on thermal comfort in hot-humid regions and found that a deep overhanging eave and slope roof were instrumental in increasing the difference of wind pressure between the windward side and the leeward side, which enhanced the air velocity by 57% compared to the form of flat roof and without overhanging eaves. The result of the roof slope in Li’s study is different from that in this study, which found that the horizontal roof was the optimum form, probably because of the differences in the selection of factors, optimization methods, and micro-environment conditions. However, the research ideas and the results of overhanging eaves are similar to those in this study. In addition, although the WWR for public buildings should not exceed 70%, as shown in the Design Standard for Energy Efficiency of Public Buildings [32], this study obtains a more detailed and targeted optimal WWR for gymnasiums (20% for south WWR and 30% for north WWR) through investigation and optimization.

5.3. Practical Implication

The analyses in this study indicate that the roof insulation is the most influential factor on thermal comfort in gymnasiums at hot and humid climate. Furthermore, the optimized architectural form of gymnasium has been achieved by the orthogonal experiment. This study expands the application of orthogonal experiment to multi-factor research on gymnasium design. By conducting a limited number of experiments in the orthogonal array, full information of factors is effectively obtained. This method, as minimizing the effort and time during analyzes, can be an alternative approach for integrated architectural design. The results in this study can provide a technical reference for the gymnasium design, as well as a guideline for the research of similar type of architecture located in regions with other climates.

5.4. Limitations

Although this study conducted an orthogonal design to provide an optimization analysis of the influencing factors of the gymnasium thermal comfort, there are some limitations. First, the small number of factors and levels of gymnasium forms in the study may affect the reliability and comprehensiveness of the results. Second, the study considers only the superposition of factors, while the interactions among the factors are not investigated. Finally, the orthogonal experiment in this study shows a process of a parametric search without any iteration. Therefore, we conduct in-depth and precise studies on optimization of gymnasium form for thermal comfort, focusing on various influential factors and levels and the discussion on the interactions among factors and the rigorous of experiment, so as to improve the feasibility of the optimization developed in this study.

6. Conclusions

This study has conducted an orthogonal design to provide an optimization analysis of the influencing factors (gymnasium architectural form) of the gymnasium thermal comfort in Guangzhou at hot and humid climate. The orthogonal experiments are applied assisted by field investigation and simulations with the FlowDesigner. The results are analyzed using range analysis and variance analysis, and the main conclusions are summarized.
(1)
Seven hundred and twenty-nine experiments have been dramatically decreased to 18 tests by the method of orthogonal experiment.
(2)
The range analysis and variance analysis demonstrate that the influence of the six factors on PTS (Predicted Thermal Sensation) are ranked as: Roof insulation type > Main window position = Roof slope > Depth of overhanging eave > North window-to-wall ratio > South window-to-wall ratio.
(3)
In terms of thermal comfort of gymnasiums, the optimized architectural form turns out to be the combination of the windows at the low position and high position on the south and north wall, respectively; the south and north window-to-wall ratio of 20% and 30%, respectively; a horizontal roof with double skin and the overhanging eave with the depth of 9 m.
(4)
The PTS (Predicted Thermal Sensation) value decreases from 1.11 (slightly hot) to 0.86 (comfortable) via optimization on the gymnasium forms, and the gap of PTS value between initial model and optimized model is mainly reflected in the afternoon.
(5)
The findings benefit designers and researchers to determine the key parameters in the gymnasium architectural design and to optimize the thermal comfort, as well as energy efficiency.

Author Contributions

Conceptualization, X.H., Q.Z. and I.T.; Methodology, X.H. and Q.Z.; Investigation, X.H.; Resources, Q.Z. and I.T.; Software, X.H. and I.T.; Writing-original draft, X.H.; Writing-review and editing, Q.Z. and I.T. All authors have read and agreed to the published version of the manuscript.

Funding

This research was funded by the Youth Foundation of Guangdong University of Technology, China (Grant No.17ZK0008). This research was also supported by the research fund of Yokohama National University in 2020.

Institutional Review Board Statement

Not applicable.

Informed Consent Statement

Not applicable.

Data Availability Statement

The data presented in this study are available on request from the corresponding author.

Conflicts of Interest

The authors declare no conflict of interest.

Nomenclature

SymbolTitleUnit of Measure
AA coefficient as a function of the air velocity/
dfDegree of freedom/
FStatistic for test/
Fp-NAngle factor between a person (p) and surface (N)/
fsSaturated water vapor pressurePa
IclStatic clothing insulationclo
kNumber of factors in orthogonal experiment/
KjiSum of the experimental results/
kjiAverage value of Kji/
LSymbol of the orthogonal table/
MMetabolic rateW/m2
mNumber of levels in orthogonal experiment/
nNumber of trials in orthogonal experiment/
pAtmospheric pressurePa
PTSPredicted Thermal Sensation/
RjRange of values between the maximum and minimum values of kji/
RHRelative humidity%
SSSum of the squared deviation/
TSVThermal Sensation Vote/
TopOperative temperature°C
TaAir temperature°C
Trmean radiant temperature°C
TkSurface temperature°C
TNSurface temperature of surface (N)°C
VVariance of the factor/
vAir velocitym/s
WWRWindow-to-wall ratio/
WkResults of each trial (k, k = 1, 2, 3, ……, n)/
WaHumidity ratiog/kg’
wArithmetic average of Wk/

References

  1. Chen, L.; Ng, E. Outdoor thermal comfort and outdoor activities: A review of research in the past decade. Cities 2012, 29, 118–125. [Google Scholar] [CrossRef]
  2. Yao, J.W.; Yang, F.; Zhuang, Z.; Shao, Y.; Yuan, P.F. The effect of personal and microclimatic variables on outdoor thermal comfort: A field study in a cold season in Lujiazui CBD, Shanghai. Sustain. Cities Soc. 2018, 39, 181–188. [Google Scholar] [CrossRef]
  3. ASHRAE. ASHRAE Standard 55-2020. In Thermal Environmental Conditions for Human Occupancy; American Society of Heating, Refrigerating and Air-Conditioning Engineers, Inc.: Atlanta, GA, USA, 2020. [Google Scholar]
  4. ASHRAE. Chapter 9, Thermal Comfort, ASHRAE Handbook—Fundamentals; American Society of Heating, Refrigerating and Air Conditioning Engineers, Inc.: Atlanta, GA, USA, 2017. [Google Scholar]
  5. De Dear, R.; Brager, G.S. Towards an adaptive model of thermal comfort and preference. ASHRAE Trans. 1998, 104, 145–167. [Google Scholar]
  6. Humphreys, M.A.; Nicol, J.F. Outdoor temperature and indoor thermal comfort: Raising the precision of the relationship for the 1998 ASHRAE database of field studies. ASHRAE Trans. 2000, 106, 485–492. [Google Scholar]
  7. Fanger, P.O. Thermal Comfort—Analysis and Application in Environmental Engineering; Danish Technology Press: Copenhagen, Denmark, 1970; pp. 142–155. [Google Scholar]
  8. ISO. ISO: International Standard 7730. In Ergonomics of the Thermal Environment—Analytical Determination and Interpretation of Thermal Comfort Using Calculation of the PMV and PPD Indices and Local Thermal Comfort Criteria; International Organization for Standardization: Geneva, Switzerland, 2005. [Google Scholar]
  9. Wei, Z. Research on the Construction of Green and Environmental Protection Modern Gymnasium. J. Physics Conf. Ser. 2021, 1802, 022050. [Google Scholar] [CrossRef]
  10. Yang, L.; Fu, R.; He, W.; He, Q.; Liu, Y. Adaptive thermal comfort and climate responsive building design strategies in dry–hot and dry–cold areas: Case study in Turpan, China. Energy Build. 2020, 209, 1–16. [Google Scholar] [CrossRef]
  11. Li, J. Effect of Form Asymmetry of Gymnasium on Natural Ventilation and Thermal Comfort of Exercise Site. J. South China Univ. Technol. 2013, 41, 83–89. (In Chinese) [Google Scholar]
  12. Huang, X.; Ma, X.; Zhang, Q. Effect of building interface form on thermal comfort in gymnasiums in hot and humid climates. Front. Arch. Res. 2019, 8, 32–43. [Google Scholar] [CrossRef]
  13. Sayadi, S.; Hayati, A.; Salmanzadeh, M. Optimization of Window-to-Wall Ratio for Buildings Located in Different Climates: An IDA-Indoor Climate and Energy Simulation Study. Energies 2021, 14, 1974. [Google Scholar] [CrossRef]
  14. Gupta, R.; Gregg, M. Assessing the Magnitude and Likely Causes of Summertime Overheating in Modern Flats in UK. Energies 2020, 13, 5202. [Google Scholar] [CrossRef]
  15. Yang, S.; Fiorito, F.; Prasad, D.; Sproul, A.; Cannavale, A. A sensitivity analysis of design parameters of BIPV/T-DSF in relation to building energy and thermal comfort performances. J. Build. Eng. 2021, 41, 102426. [Google Scholar] [CrossRef]
  16. Amini, R.; Ghaffarianhoseini, A.; Ghaffarianhoseini, A.; Berardi, U. Numerical investigation of indoor thermal comfort and air quality for a multi-purpose hall with various shading and glazing ratios. Therm. Sci. Eng. Prog. 2021, 22, 100812. [Google Scholar] [CrossRef]
  17. Rawat, M.; Singh, R.N. A study on the comparative review of cool roof thermal performance in various regions. Energy Built Environ. 2021, 23, 26. [Google Scholar] [CrossRef]
  18. Albatayneh, A. Optimisation of building envelope parameters in a semi-arid and warm Mediterranean climate zone. Energy Rep. 2021, 7, 2081–2093. [Google Scholar] [CrossRef]
  19. Shao, N.; Zhang, J.; Ma, L. Analysis on indoor thermal environment and optimization on design parameters of rural residence. J. Build. Eng. 2017, 12, 229–238. [Google Scholar] [CrossRef]
  20. Li, H.X.; Li, Y.; Jiang, B.; Zhang, L.; Wu, X.; Lin, J. Energy performance optimization of building envelope retrofit through integrated orthogonal arrays with data envelopment analysis. Renew. Energy 2020, 149, 1414–1423. [Google Scholar] [CrossRef]
  21. Lv, W.; Li, A.; Ma, J.; Cui, H.; Zhang, X.; Zhang, W.; Guo, Y. Relative importance of certain factors affecting the thermal environment in subway stations based on field and orthogonal experiments. Sustain. Cities Soc. 2020, 56, 102107. [Google Scholar] [CrossRef]
  22. Zhang, Q.; Yang, H. Typical Meteorological Database Handbook for Buildings; China Architecture & Building Press: Beijing, China, 2012; p. 202. (In Chinese) [Google Scholar]
  23. The Historical Changes of Winds above Open Spaces and the Surroundings of Nanjing. Urban. Plan. Forum. 2018, 2, 81–88. (In Chinese)
  24. Rowe, P.G.; Forsyth, A.; Kan, H.Y. China’s Urban Communities: Concepts, Contexts, and Well-Being; Birkhäuser: Boston, MA, USA, 2016; pp. 172–198. [Google Scholar]
  25. Advanced Knowledge Laboratory, Inc. CFD Simulation for Architectural Design. Available online: http://www.akl.co.jp/en/ (accessed on 1 April 2020).
  26. China Architecture & Building Press. JGJ/T347: 2014. In Standard of Test Methods for Thermal Environment of Building; China Architecture & Building Press: Beijing, China, 2014. [Google Scholar]
  27. NCEI. Integrated Surface Database (ISD). Available online: https://www.ncdc.noaa.gov/isd (accessed on 1 April 2020).
  28. ISO. International Standard 7243. In Ergonomics of the Thermal Environment—Assessment of Heat Stress Using the WBGT (Wet Bulb Globe Temperature) Index; International Organization for Standardization: Geneva, Switzerland, 2017. [Google Scholar]
  29. Huang, X.; Zhang, Q.; Wang, Z.; Ma, X. Thermal sensation under high-intensive exercise in naturally ventilated gymnasiums in hot-humid areas of China: Taking basketball players for example. Indoor Built Environ. 2020. [Google Scholar] [CrossRef]
  30. Oliveira, A.V.M.; Raimundo, A.M.; Gaspar, A.R.; Quintela, D.A. Globe Temperature and Its Measurement: Requirements and Limitations. Ann. Work Expo. Health 2019, 63, 743–758. [Google Scholar] [CrossRef]
  31. ISO. International Standard 8996. In Ergonomics of the Thermal Environment—Determination of Metabolic Rate; International Organization for Standardization: Geneva, Switzerland, 2004. [Google Scholar]
  32. China Architecture & Building Press. GB50189-2015. In Design Standard for Energy Efficiency of Public Buildings; China Architecture & Building Press: Beijing, China, 2015. (In Chinese) [Google Scholar]
  33. Energy Plus. Weather Data by Region. Available online: https://energyplus.net/weather-region/asia_wmo_region_2 (accessed on 1 April 2020).
  34. China Architecture & Building Press. JGJ31-2003. In Design Code for Sports Building; China Architecture & Building Press: Beijing, China, 2003. (In Chinese) [Google Scholar]
  35. Prakash, D.; Ravikumar, P. Analysis of thermal comfort and indoor air flow characteristics for a residential building room under generalized window opening position at the adjacent walls. Int. J. Sustain. Built Environ. 2015, 4, 42–57. [Google Scholar] [CrossRef] [Green Version]
  36. Kim, S.; Zadeh, P.A.; Staub-French, S.; Froese, T.; Cavka, B.T. Assessment of the Impact of Window Size, Position and Orientation on Building Energy Load Using BIM. Procedia Eng. 2016, 145, 1424–1431. [Google Scholar] [CrossRef] [Green Version]
  37. Kahsay, M.T.; Bitsuamlak, G.T.; Tariku, F. Thermal zoning and window optimization framework for high-rise buildings. Appl. Energy 2021, 292, 116894. [Google Scholar] [CrossRef]
  38. Wen, L.; Hiyama, K.; Koganei, M. A method for creating maps of recommended window-to-wall ratios to assign appropriate default values in design performance modeling: A case study of a typical office building in Japan. Energy Build. 2017, 145, 304–317. [Google Scholar] [CrossRef]
  39. Zingre, K.T.; Yang, E.H.; Wan, M.P. Dynamic thermal performance of inclined double-skin roof: Modeling and experimental investigation. Energy 2017, 133, 900–912. [Google Scholar] [CrossRef]
  40. Mao, Q.; Yang, M. Experimental and numerical investigation on heat transfer performance of a solar double-slope hollow glazed roof. Appl. Therm. Eng. 2020, 180, 115832. [Google Scholar] [CrossRef]
  41. Gagliano, A.; Patania, F.; Nocera, F.; Ferlito, A.; Galesi, A. Thermal performance of ventilated roofs during summer period. Energy Build. 2012, 49, 611–618. [Google Scholar] [CrossRef]
  42. Omar, A.I.; Virgone, J.; Vergnault, E.; David, D.; Idriss, A.I. Energy Saving Potential with a Double-Skin Roof Ventilated by Natural Convection in Djibouti. Energy Procedia 2017, 140, 361–373. [Google Scholar] [CrossRef]
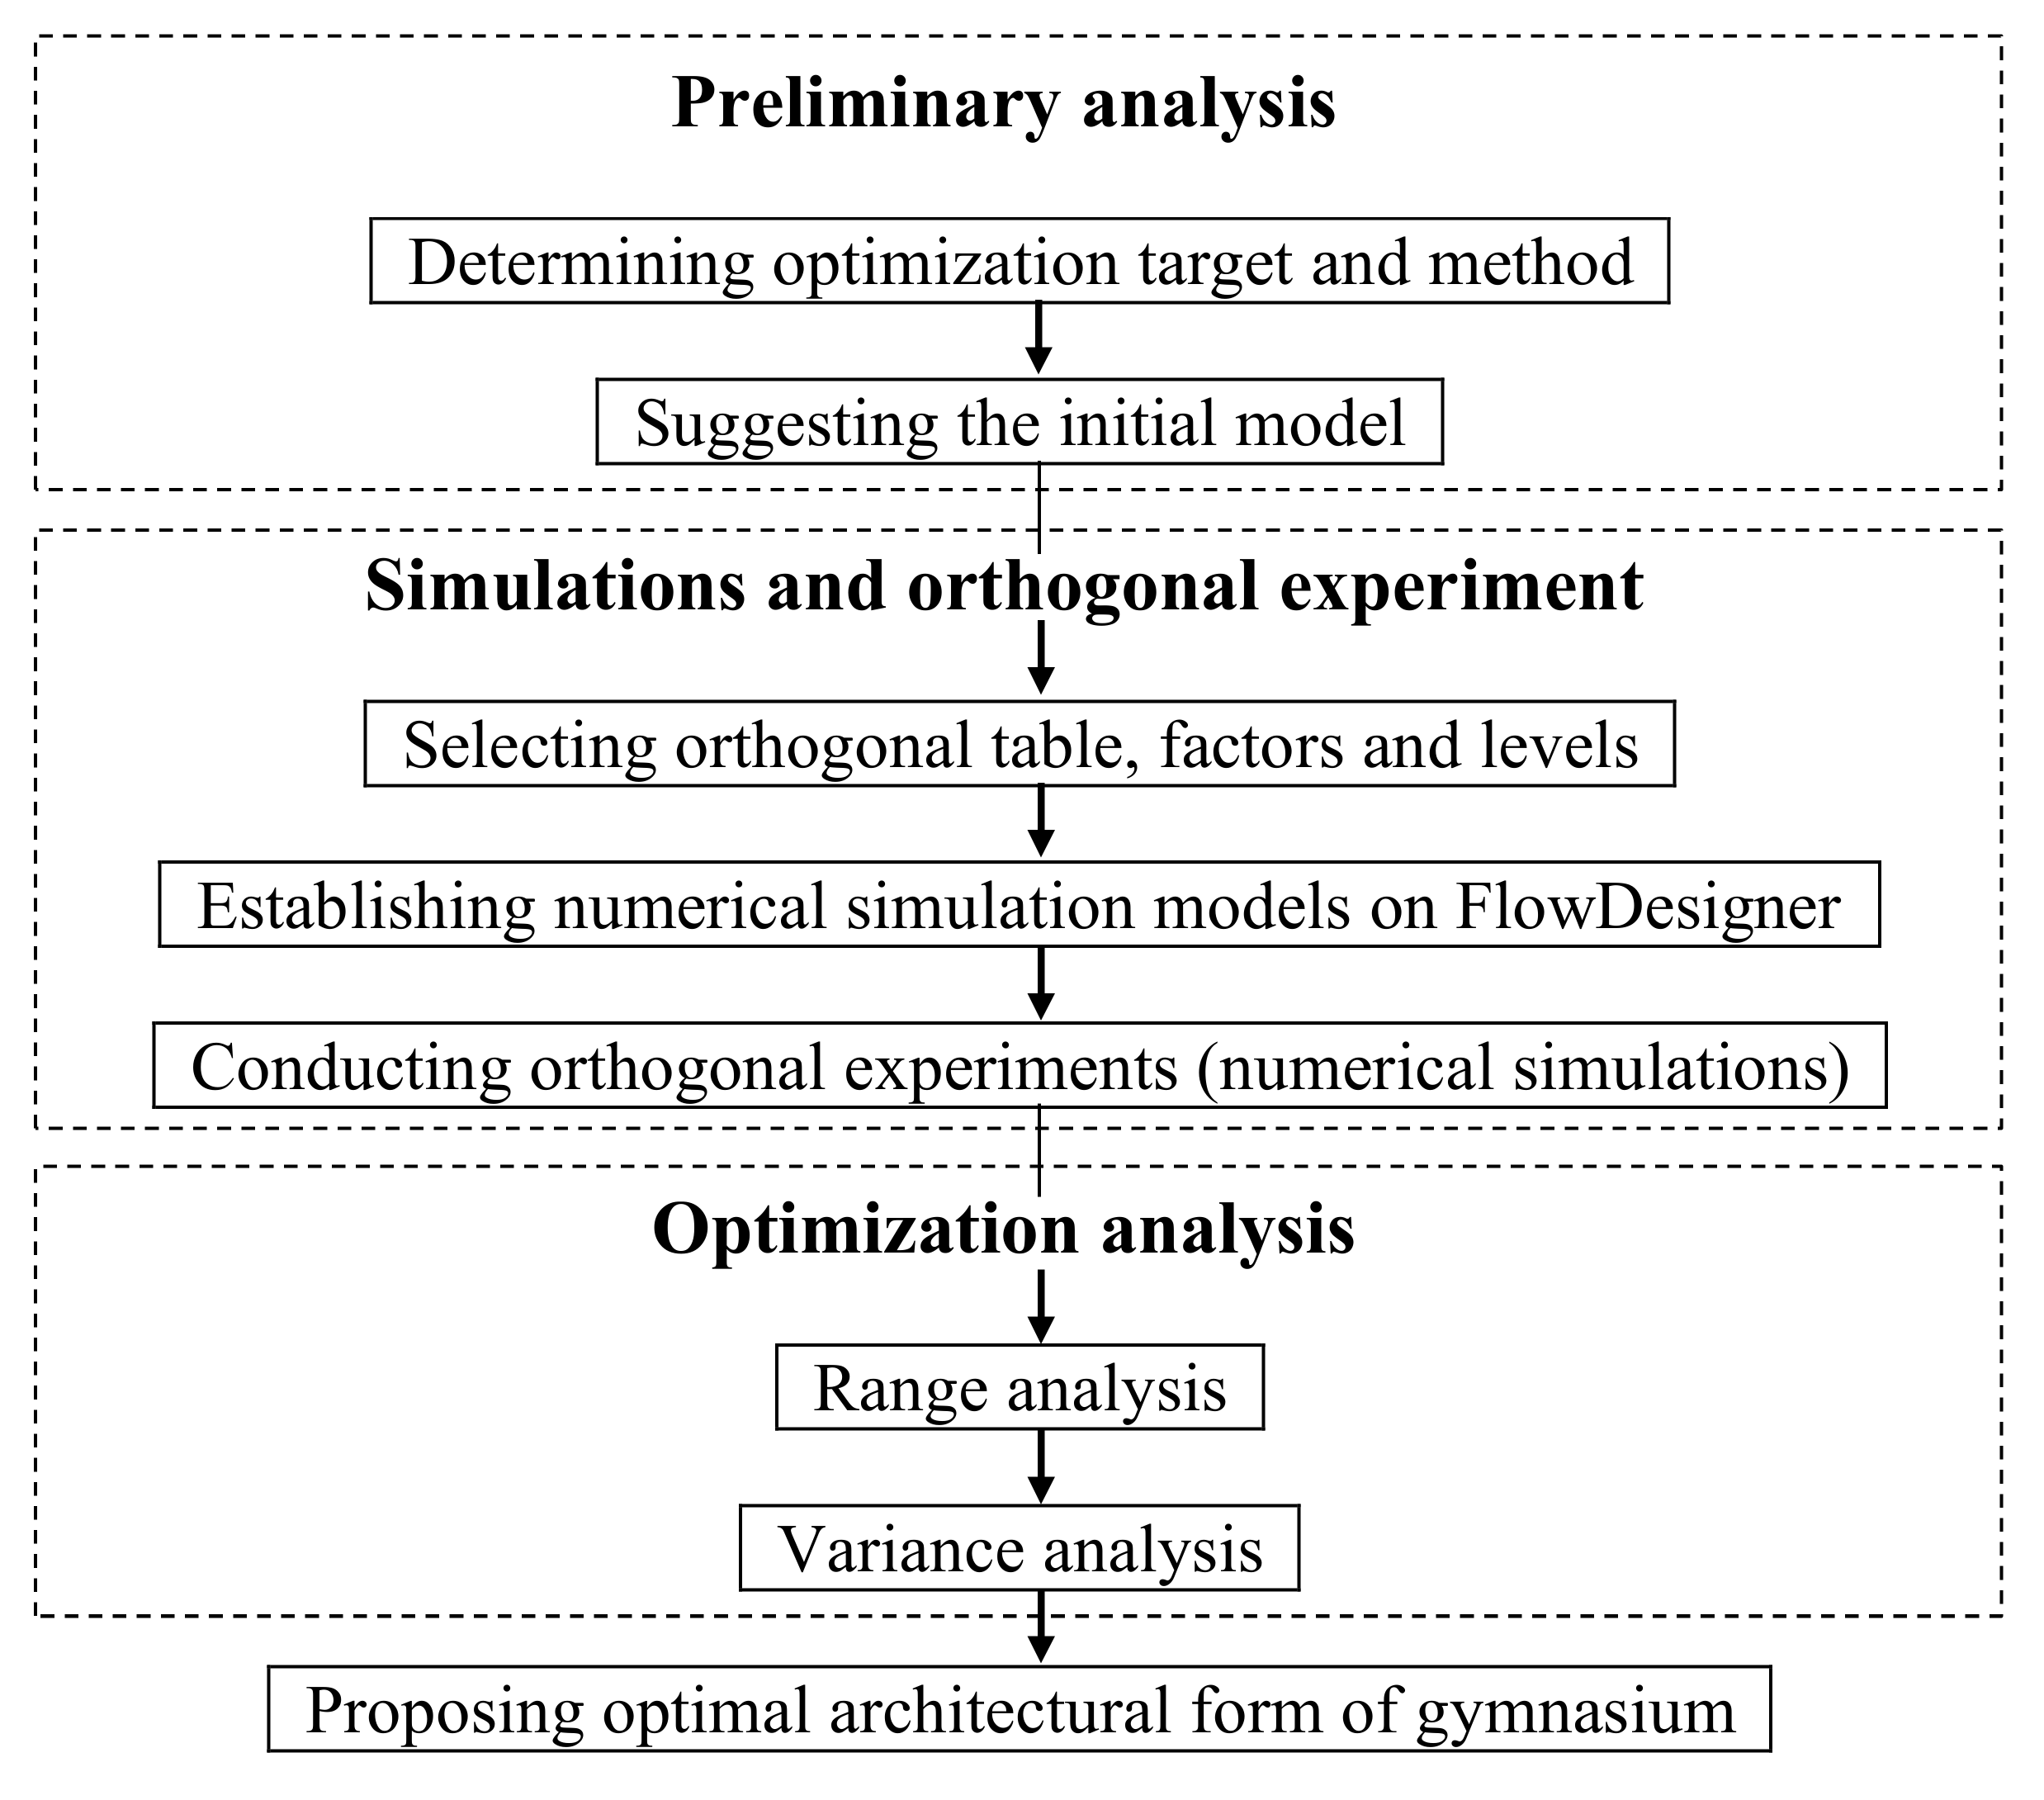
Figure 1. Flow chart of the hybrid method for simulation and optimization.
Energies 14 03228 g001
Figure 2. The interior view and plan of the measured gymnasiums (Points ① to ⑤ represent the locations of the measuring instruments).
Energies 14 03228 g002
Figure 3. Comparison of the thermal environment variations between measurement and simulation.
Energies 14 03228 g003aEnergies 14 03228 g003b
Figure 4. Plan layout and perspective of the initial gymnasium model.
Energies 14 03228 g004
Figure 5. Simulated results of initial model of gymnasium. (a)The range of operative temperature of initial model in August; (b) The range of relative humidity of initial model in August; (c) The range of air velocity of initial model in August; (d) The range of Predicted Thermal Sensation of initial model in August.
Energies 14 03228 g005
Figure 6. Correlations between the factors and the PTS.
Energies 14 03228 g006
Figure 7. Variation of hourly average PTS between the initial model and the optimized model in August.
Energies 14 03228 g007
Table 1. Scale of PTS model.
−3−2−10+1+2+3
Extremely coldColdSlightly coldComfortableSlightly hotHotExtremely hot
Table 2. Information of naturally ventilated gymnasiums in Guangzhou City.
ParameterSituationPercentage
SizeMedium8/15
Small7/15
Audience capacity (seat)3000~60008/15
≤30007/15
Auditorium layout (side)≤29/15
>26/15
Building materialReinforced concrete14/15
steel1/15
Building height (meter)≤1510/15
>155/15
Main window positionHeight of the walls8/15
Bottom of the walls2/15
Both height and bottom of the walls2/15
On the roof3/15
window-to-wall ratio (WWR)≤0.310/15
0.3~0.75/15
Roof slopeHorizontal roof8/15
Single slope3/15
Multi-slope4/15
Overhanging eaveWithout overhanging eave2/15
With overhanging eave13/15
Table 3. Design parameter information of the building envelope.
ComponentMaterialsU-Value (W/ (m2·K))
Exterior wall13 mm decorative brick + 20 mm lime mortar + 10 mm Expanded Polystyrene (EPS) insulation + 240 mm aerated concrete + 20 mm lime mortar0.5
Roof40 mm C20 fine aggregate concrete + 20 mm cement mortar + 5 mm waterproof membrane + 30 mm cement mortar + 60 mm Extruded Polystyrene (XPS) insulation + 20 mm cement mortar + 120 mm reinforced concrete + 20 mm cement mortar0.35
WindowAluminium frame + 6 mm clear single glazing6.073
Floor20 mm cement mortar + 100 mm reinforced concrete + 20 mm cement mortar2.813
Foundation20 mm cement mortar + 80 mm fine aggregate concrete + 500 mm rammed clay0.887
Table 4. Factors and corresponding levels of orthogonal experiment.
FactorLevel 1Level 2Level 3
(A) Main window positionHigh at the south and north wallLow at the south wall and high at the north wallHigh at the south wall and low at the north wall
(B) South WWR10%20%30%
(C) North WWR10%20%30%
(D) Roof insulation typeSingle skin roofDouble skin roofInsulated roof
(E) Roof slopeHorizontal roofRise from south to northRise from north to south
(F) Depth of overhanging eave1 m5 m9 m
Table 5. Results and range analysis of the orthogonal experiments.
Test NumberFactorResult of PTS
ABCDEF
11111111.110
21222220.924
31333330.984
42131221.119
52212330.892
62323110.965
73122130.913
83233211.065
93311321.299
101123321.182
111231131.022
121312210.961
132132310.907
142213121.03
152321231.053
163113231.087
173221311.227
183332120.912
K16.1836.3186.3796.8305.9526.235
K25.9666.1606.2645.5096.2096.466
K36.5036.1746.0096.3136.4915.951
k11.0311.0531.0631.1380.9921.039
k20.9941.0271.0440.9181.0351.078
k31.0841.0291.0021.0521.0820.992
R0.0900.0260.0620.2200.0900.086
Factor rankingD > A = E > F > C > B
Table 6. Variance analysis of the PTS.
FactorSSdfVFF(0.05)Significance
A0.02420.0120.7213.74*
B0.00320.0020.0903.74
C0.01220.0060.3613.74
D0.14820.0744.4463.74**
E0.02420.0120.7213.74*
F0.02220.0110.6613.74
Deviation0.231140.016
Note1: * represents the significance of the different factor. The more the ** are shown, the higher the significance of the corresponding factor is.
Table 7. Comparison of architectural forms and thermal performances between the initial model and the optimized model.
ParametersInitial ModelOptimized Model
Window positionHigh to the south and northLow to the south and high to the north
WWRSouth and north for 10%South for 20% and north for 30%
Roof insulation typeSingle skin reinforced concreteDouble skin reinforced concrete
Roof slopeHorizontal roofHorizontal roof
Depth of overhanging eave (m)19
Indoor avg. operative temperature (°C)29.3028.21
Indoor avg. humidity ratio (g/kg’)20.1620.15
Indoor avg. air velocity (m/s)0.210.77
Indoor avg. PTS1.110.86
Publisher’s Note: MDPI stays neutral with regard to jurisdictional claims in published maps and institutional affiliations.