1. Introduction
The subject of electric vehicles is of wide interest in the world of science. The technology is analyzed in many aspects, as is the impact of electric vehicles on the environment.
When referring to the topic of technology diffusion, it is worth citing the article of Mitra et al. [
1], where the authors analyze four cases of diffusion of innovations in emerging markets. Going further, it is also worth mentioning the thematic focus of the publication, related to the attempt to determine the number of electric vehicles (incl. buses) in different countries [
2,
3] or an attempt to estimate the amount of energy consumed by electric vehicles [
4]. An interesting perspective is also the analysis in terms of identifying opportunities for the development of the described technology in various countries and regions of the world [
4,
5] or the directions of further research on electric vehicles and their impact on the environment [
6].
Electromobility undoubtedly has great opportunities for development due to the growing awareness of the challenges related to climate change. In many countries, which are leaders in implementing this technology, there are incentive systems promoting the purchase of electric cars: direct subsidies, subsidies, tax breaks or additional privileges, such as exemptions from tolls for tolls on tolled highways, for parking in paid zones or the ability to use buses in lanes.
The EU strategy for the integration of the energy system [
7] and the hydrogen strategy adopted in July 2020 indicate what model of transformation will be promoted in EU legislation and the rules for financing investments in the energy sector. It is based on electrification dependent on renewable energy sources. The European Commission assumes that their share in electricity production will have doubled by 2030, reaching around 60%. Electrification in the first place concerns the sector of district heating and individual heating, as well as transport. Transport uses a third of all energy used in the EU, which comes mainly from oil. This means that it is responsible for a significant proportion of greenhouse gas emissions in the European Union and is a major contributor to climate change. While most other sectors of the economy, such as energy and industry, have reduced their emissions since 1990, emissions in the transport sector have increased. 30 years ago, transport was re-sponsible for the emission of 15% of greenhouse gases, now it is already responsible for 25%. Almost 30% of total EU CO
2 emissions come from this sector, 72% of which come from road transport. In road transport, passenger cars are the main source of pollution—they are responsible for almost 61% of emissions [
1].
This makes the transport sector one of the main barriers to achieving climate protection targets today. Without changing lifestyle, consumption model and the use of zero- and low-emission technologies, improvement in this area will not be possible. The European Commission has announced a very large increase in the share of heat pump technology, as well as a rapid development of the charging infrastructure and the number of electric cars. Hydrogen is to play a complementary role, although, as indicated by the European Commission, by 2050 the share of hydrogen among energy carriers will be only about 10%. However, it is necessary to achieve climate neutrality where effective electrification will not be possible, e.g., in many industrial processes or heavy transport. A reflection of the direction set out in the energy system integration strategy is the increase in the sales of electric cars throughout the European Union. In the last three years, sales of new electrically-charged cars in the EU have increased by 110% since 2018-20 [
8]. According to the data from the ACEA report for 2019 [
9], 58.9% of the new cars purchased in Europe at that time were gasoline cars, 30.5% diesels, and 10.6% “green” vehicles. Among them, the most numerous group, 5.9% of all cars registered in 2019 were hybrids. Cars charged from external sources—3% (including 1.9%—electric cars and 1.1%—plug-in hybrids). Cars with LPG installations and E85 fuel adapted to combustion accounted for 1.2% sales, and cars with CNG installation 0.5%.
Currently, the sale of cars powered by hydrogen fuel cells is marginal. It is only 0.04%. Transforming the above data into numbers, in 2019 there were 8.96 million buyers of gasoline cars, 4.65 million of diesel cars, 897 thousand of hybrid cars, 285 thousand of electric cars, 174 thousand of plug-in hybrids and 535 of fuel cell cars.
The EU is clearly pointing the way forward in the field of electric vehicles in its current EU strategy to reduce CO
2 emissions in transport. In order to support zero-emission politics, the European Union will aim to have at least 30 million zero-emission vehicles on its roads by 2030, as it seeks to steer countries away from fossil fuel-based transport [
10]. In a planned strategy the EU will lay out measures to tackle the quarter of EU greenhouse gas emissions that come from the transport sector. However, the EU assumptions may be too optimistic due to the lack of sufficient infrastructure.
Therefore, a question arises about the future of the development of new technologies in motorization, especially the future of electric vehicles. Does it have a chance to win the automotive market? Does it have the potential to be a competitive technology with the traditional one or does it have other options?
The aim of the article is to analyze the current situation of innovative electric vehicle (EV) technology on the European Union market and the potential as well as possible directions of its market diffusion. Presented in this article analysis stands out from the rest of the attempt at clustering the EU countries in terms of the potential, including the speed of implementation of electric car technology.
2. Materials and Methods
For the aim of the study three main research question were stated:
Q1. What is the potential for the dispersion of this innovation (technology) in the nearest future?
Q2. Is the EU market single or diversified in terms of the potential and speed of the diffusion?
Q3. What number of electric vehicles is spread on the market as an innovation? Thus what share of the automotive market in the European Union has been gained by this technology?
Figure 1 illustrates the conception of the methodology of research process conducted for the purposes of the presented article.
According to the Deloitte report from 2020, the European market is not homogeneous. A very large differentiation of the EV market in individual European countries is observed. Growth in Northern and Western Europe is expected to outstrip that in Southern and Eastern Europe as wealthier countries (such as the United Kingdom, Germany, France, the Netherlands, Nordic countries) likely invest more in infrastructure and offer greater cash and tax incentives to accelerate initial growth [
11]. Individual countries differ in terms of both the current demand for electric vehicles and the offered supply of these vehicles. The current diversification will have an impact on the long-term trend. The differences in the market situation of individual countries are shown by McKinsey’s proprietary Electric Vehicle Index (EVI), which explores two important dimensions of electric mobility [
12]:
- (1)
Market demand analyzes, the share of EVs in the overall market, as well as factors affecting EV penetration in each country, such as incentives (for instance, subsidies), existing infrastructure, and the range of available EVs.
- (2)
Industry supply explores the share of a country’s OEMs in the production of EVs and EV components, such as e-motors and batteries, looking at both current and projected numbers. The EVI assesses the key performance indicators in each country and rates them on a scale from 0 to 5 for every dimension. These scores serve as the basis for the final country ranking (exhibit) (see
Figure 2).
In this article, the answers to the Q1 and Q2 research questions were based on an assumption made regarding the significance of two main factors related to the use of clean energies in a given country: the share of LPG gas vehicles and the certain effectiveness of implementing alternative types of engines. On the one hand, in some countries, there is a tendency to invest in gas vehicles. For some countries, such as Turkey, Italy, or Poland, this share is significant (in the order of around three million). Therefore, the structure of vehicle classes in these countries is significantly different from countries where this type of vehicle is less popular or completely neglected. Countries that have been investing in this type of technology for many years will have different trends and needs for infrastructure development. Therefore, it was decided that the factor related to the share of gas vehicles has a significant impact on the share structure of various vehicle types.
On the other hand, a factor that takes into account the willingness to invest in modern vehicle propulsion technologies should be taken into account. It was assumed that more innovative countries will adopt modern technologies (like battery electric vehicle (BEV), plug-in hybrid electric vehicle (PHEV) vehicles, and hydrogen cells) more quickly. Based on European Alternative Fuels Observatory (EAFO) data [
13], it was possible to obtain information about the year in which the first registration of a given type of vehicle took place. As the available data begin in 2008, this year was adopted as a reference point. For each country, the following coefficient was calculated:
where 〖
first registration〗_
i—a year of the
first registration of
BEV,
PHEV, or hydrogen cell type of car. In the absence of implementation of a given innovation, the registration date was assumed as 2021. Then, based on the innovation index, a ranking was created and the “1” value was assigned to the country with the smallest innovation index.
As the obtained data appeared to be very differentiated depending on the country, the grouping of countries according to similarity was applied. Clustering was carried out on the basis of two features: the level of LPG technology in the automotive market and the innovation index. Three levels of the share of LPG-powered vehicles in individual automotive markets were adopted: low, medium and high, and three levels of innovation—low, medium and high. Then the method of k-means grouping with k = 3 was used. The k-means method was chosen because it is a non-hierarchic method and is commonly used when the number of groups to be obtained is known [
14,
15]. Here, arbitrary, the division into three groups were set. The authors decided that this method is sufficient because only two factors determined the clustering of countries. As part of the mentioned above cluster-analysis, three basic groups of the EU countries were identified, for the purposes of this article called groups A, B, C. The differences between the groups result from the diffusion rate of electric car technology, as well as the country’s potential for the development of the technology. The precise division into three main country groups are shown in the Results chapter.
The Rogers innovation market diffusion concept was chosen to answer the third research question (Q3). Referring to this concept, the additional question was stated:
Q3.1. In which phase of market innovation diffusion is electric vehicle technology in the European Union market?
Innovation diffusion is the process of spreading innovation over time, through specific communication channels among members of a given social system. Diffusion is a kind of a social change in which there are accelerated changes in the structure and functions within the social system as a result of accepting or rejecting a given innovation. The four main building blocks of this process are: innovation, communication channel, time and the social system. Communication is the process of creating and sharing information between individuals of a given population in order to achieve mutual understanding. Such communication is a two-way interaction, and in the case of diffusion, the object of communication is a new idea or product. Communication channels are the means by which messages get from one person, or a source of information, to another. The connection of units with such information distribution channels creates a communication network [
16].
Time in the innovation diffusion model has different characteristics. First, in the process of adopting an innovation, it is the time needed to go through the decision-making process. It is also the relative speed with which innovation is adopted by members of the social system. The time parameter can also measure the number of adapters of a specific innovation in a given time period, i.e., the rate of adoption is defined as the relative speed with which members of the social system adopt the innovation. It is usually measured by the time it takes for a given percentage of members of the social system to adopt an innovation [
16]. The social system is defined as “a set of interrelated individuals who are involved in joint problem solving so as to achieve a common goal,” members of the social system can be individual or organizational individuals, as well as groups or subsystems. -covering a given, separated set of units is a jointly achieved goal [
17]. Innovativeness is defined as the degree to which a given person, relatively earlier than other system users, adopts new ideas, and the level of innovation allows for the division of consumers into the categories of adapters [
16]. The process of making decisions on the diffusion of innovation is the activity of searching for and processing information, which motivates an individual to reduce the uncertainty as to the advantages and disadvantages of a new solution. Two factors determine the type of decision to adopt an innovation:
On the basis of these considerations, three types have been identified—types of decisions in the process of diffusion of innovation [
16]:
- (1)
An optional, individual decision to innovate made by an individual independently of other individuals in the social system.
- (2)
Collective decision to innovate made jointly by all units of the social system and most of them follow the common agreements.
- (3)
The official decision on innovation was made “top-down”, i.e., administratively for the entire social system, by a group of people with an influential position and power.
The decisions taken in an official manner are adopted the fastest and most effectively, as they leave no room for the individual’s free choice. Rogers states [
16] that innovation generates uncertainty, it provides an individual or an organization with new alternatives in solving problems or new products to meet needs. However, the individual, being unsure of these new possibilities, is strongly motivated to continue searching for information and confirming his or her decision.
The author defines “uncertainty” as the degree of perception of a certain number of alternatives, taking into account the probability of an event and the use of a given alternative. The information searched for by the individual allows them to choose one of the alternatives and reduce the state of uncertainty and inconvenience. The user’s decision to adopt a new solution is made through a cost-benefit analysis where uncertainty is the main obstacle. People will accept an innovation if they believe that it increases the usefulness of the solution used so far. Uncertainty often causes a decision to be postponed until further evidence is obtained. The final decision is largely determined by personal characteristics, and the variety of adapters allows them to be categorized.
The pace at which innovation is adopted is reflected by the diffusion curve in the decision-making process, in which the individual moves from the initial knowledge of innovation to shaping the attitude towards innovation, making a decision to accept or reject, and then to implement the resolution and use new ideas, and finally confirm the undertaken decisions during use. The total number of adopters of an innovation, i.e., the cumulative number of adapters, takes the form of an “S”-shaped curve. In mathematics, an S-curve is known as a logistic function. In the beginning, the number of innovators slowly increases, then the number increases sharply, reflecting the steep increase in the S-curve. Finally, when more than half of consumers purchased a new solution, the pace of adoption stabilizes [
18]. The bell-shaped curve, on the other hand, is used to characterize the distribution over time of five categories of system members in terms of innovation. These groups are the already mentioned categories of adapters [
18]. The categories of adapters are divided according to their features and characteristics. The model of diffusion of innovation by Rogers—created as a result of empirical research—proves that there are several categories of innovation users who represent different approaches to novelty. Innovators are a small, initial group of the “brave”, they like risk and are eager to try new things. Early adopters are the first group of users to form an opinion of the product while purchasing with some caution. The early majority adopts a new product earlier than the general public, observing opinion leaders. The late majority are skeptics, accepting a new solution only when it is tested by other users. The last group consists of laggards who are afraid of novelty and change and adopt innovation only when it is common and necessary.
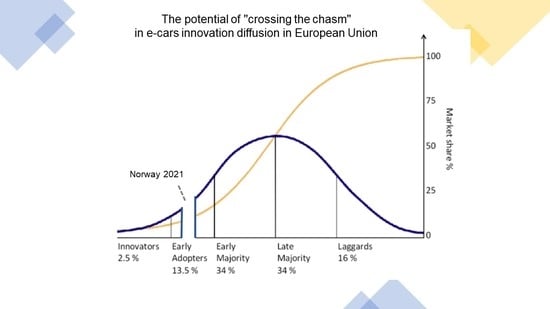
Figure 3 shows the course of adoption of innovations in time for individual categories of adopters, on the horizontal axis is the time needed to adopt the innovation and on the vertical axis the number of innovation users. The navy blue curve reflects a normal bell shape showing the number of adapters over time and broken down by category. In contrast, the yellow curve is an S-curve showing the cumulative number of adapters that rises slightly and then increases sharply as the innovation spreads. Both curves depict the same innovation diffusion phenomenon. With the adoption of the innovation (navy blue curve) by subsequent groups of consumers, the cumulative market share of users grows (yellow curve) and finally reaches the saturation level [
18]. It is worth noting that in the Rogers model the final fragment of diffusion is somewhat arbitrary, because some laggards adapt innovations after a very long time or do not imitate [
17].
One of the researchers exploring Rogers’ concept was Moore. Moore, in his famous publication
Crossing the Chasm [
20], discussed the gaps and barriers that must be overcome to move from one customer group to the next. The largest gap, which he calls “the chasm”, exists between the early adopters and the early majority. When firms manage to bridge this gap, they are already on the way from marginal product to mainstream product and further to broad development and profitability.
There are several factors influencing customers’ decisions to accept or reject an innovation. The first is a relative advantage over the previous solutions known to the market. Another is compatibility, understood as the degree to which an innovation can be adapted to the life of the recipient, the user of the product. The third factor is the ease of use of the new solution. The easier the product is to use, the sooner the recipient will start using it. The last two factors are the ability to check and test an innovation before adoption, and visibility, the degree to which the use of an innovation is visible to others. This factor is very important in the dissemination of information about innovation and arousing interest and willingness to have a given product through a kind of desire to “catch up” with its users, which can be a very important purchase motive.
The Bass model can be used to identify the stage at which the studied innovation is located in the analyzed country/region. Taking into account the diversification of the market potential for the adaptation and development of the described technology, in this article, the Bass model was developed for the A-group countries with the greatest potential. The “A-group countries” term will be described in details in the Results section.
The usage of the Bass model requires the assumption of target market size. According to the data presented in commercial reports of global and especially European EV market, global EV sales rose a dramatic 65% from 2017 to 2018, for a total of 2.1 million vehicles, with sale figures steady through 2019. The subsequent outbreak of the coronavirus pandemic, however, resulted in a 25% decline in EV purchases during the first quarter of 2020. Despite these setbacks, EV demand is again expected to rise and hit 10% of global passenger vehicle sales by 2025, rising to 28% in 2030 and 58% in 2040 [
11,
12]. The share of new car sales taken up by EVs will vary considerably across markets. China is about to achieve a domestic market share of around 48 per cent by 2030—almost double that of the United States (27 per cent), and Europe should achieve 42 per cent. Based on the current growth rate of the market in the A-group countries the target market size for them was assumed at the level of 70–100%.
A descriptive approach to the innovation evolution was presented using the Rogers model, which defines particular groups (stages of innovation development). For calculations, the Rogers model is most often presented in an analytical form as the Bass model (this relationship is shown in
Figure 4). It is important to underline, that the previous graph (
Figure 3) depicts the market shares and the representation of the Rogers curve for diffusion of innovation. The diagram of
Figure 4 below depicts the Bass curve versus the Rogers curve. The Bass curve for each country will be different, therefore the authors decided to show the general relationship between the course of the Bass curve and the Rogers curve (
Figure 4).
The classic Bass model is presented by Equation (2) [
21]:
where it is assumed that the zero moment means the start of diffusion of innovation (
t = 0), it is the point of introducing technology to the market for a quantity buyer. The following notations were used:
F(t) is the total number of innovation users by time t (numbers of EVs in the market from the moment of technology introduction to the current time t),
f(t)—number of innovation users that adopt it at fixed time t, (t usually means a certain time interval, e.g., the whole year),
m—the total number of innovation users (total number of EV on market),
p—the innovation coefficient,
q—the imitation coefficient.
The analytical solution of Equation (2) can be written in the form:
The bell-shaped function
f(t) describes the current sale of electric vehicles on the market. Formally, the function described by Equation (3) is asymmetric, the initial sales value is usually greater than 0 and related to the number of innovators, and therefore also depends on the innovation coefficient
p. The original Bass model does not take into account the aging of technology and the natural replacement of vehicles. Therefore, for this article, it was decided to use the solution of the form of Equation (4):
which represents the current total number of vehicles on the market.
The peak time of function (3) can be written as Equation (5) [
22]:
It is essential that
p <
q and that the maximum of the function
f(
t) occurs after the technology is introduced to the market. The time moments in which the inflection points of Equation (3) occur can be defined as follows (see
Figure 4):
The article considers forecasting the development of innovation evolution based on the information before the first inflection point (sometimes also called LIP—left inflection point). Forecasting ahead of this point is a very challenging task [
1]. It was noted in [
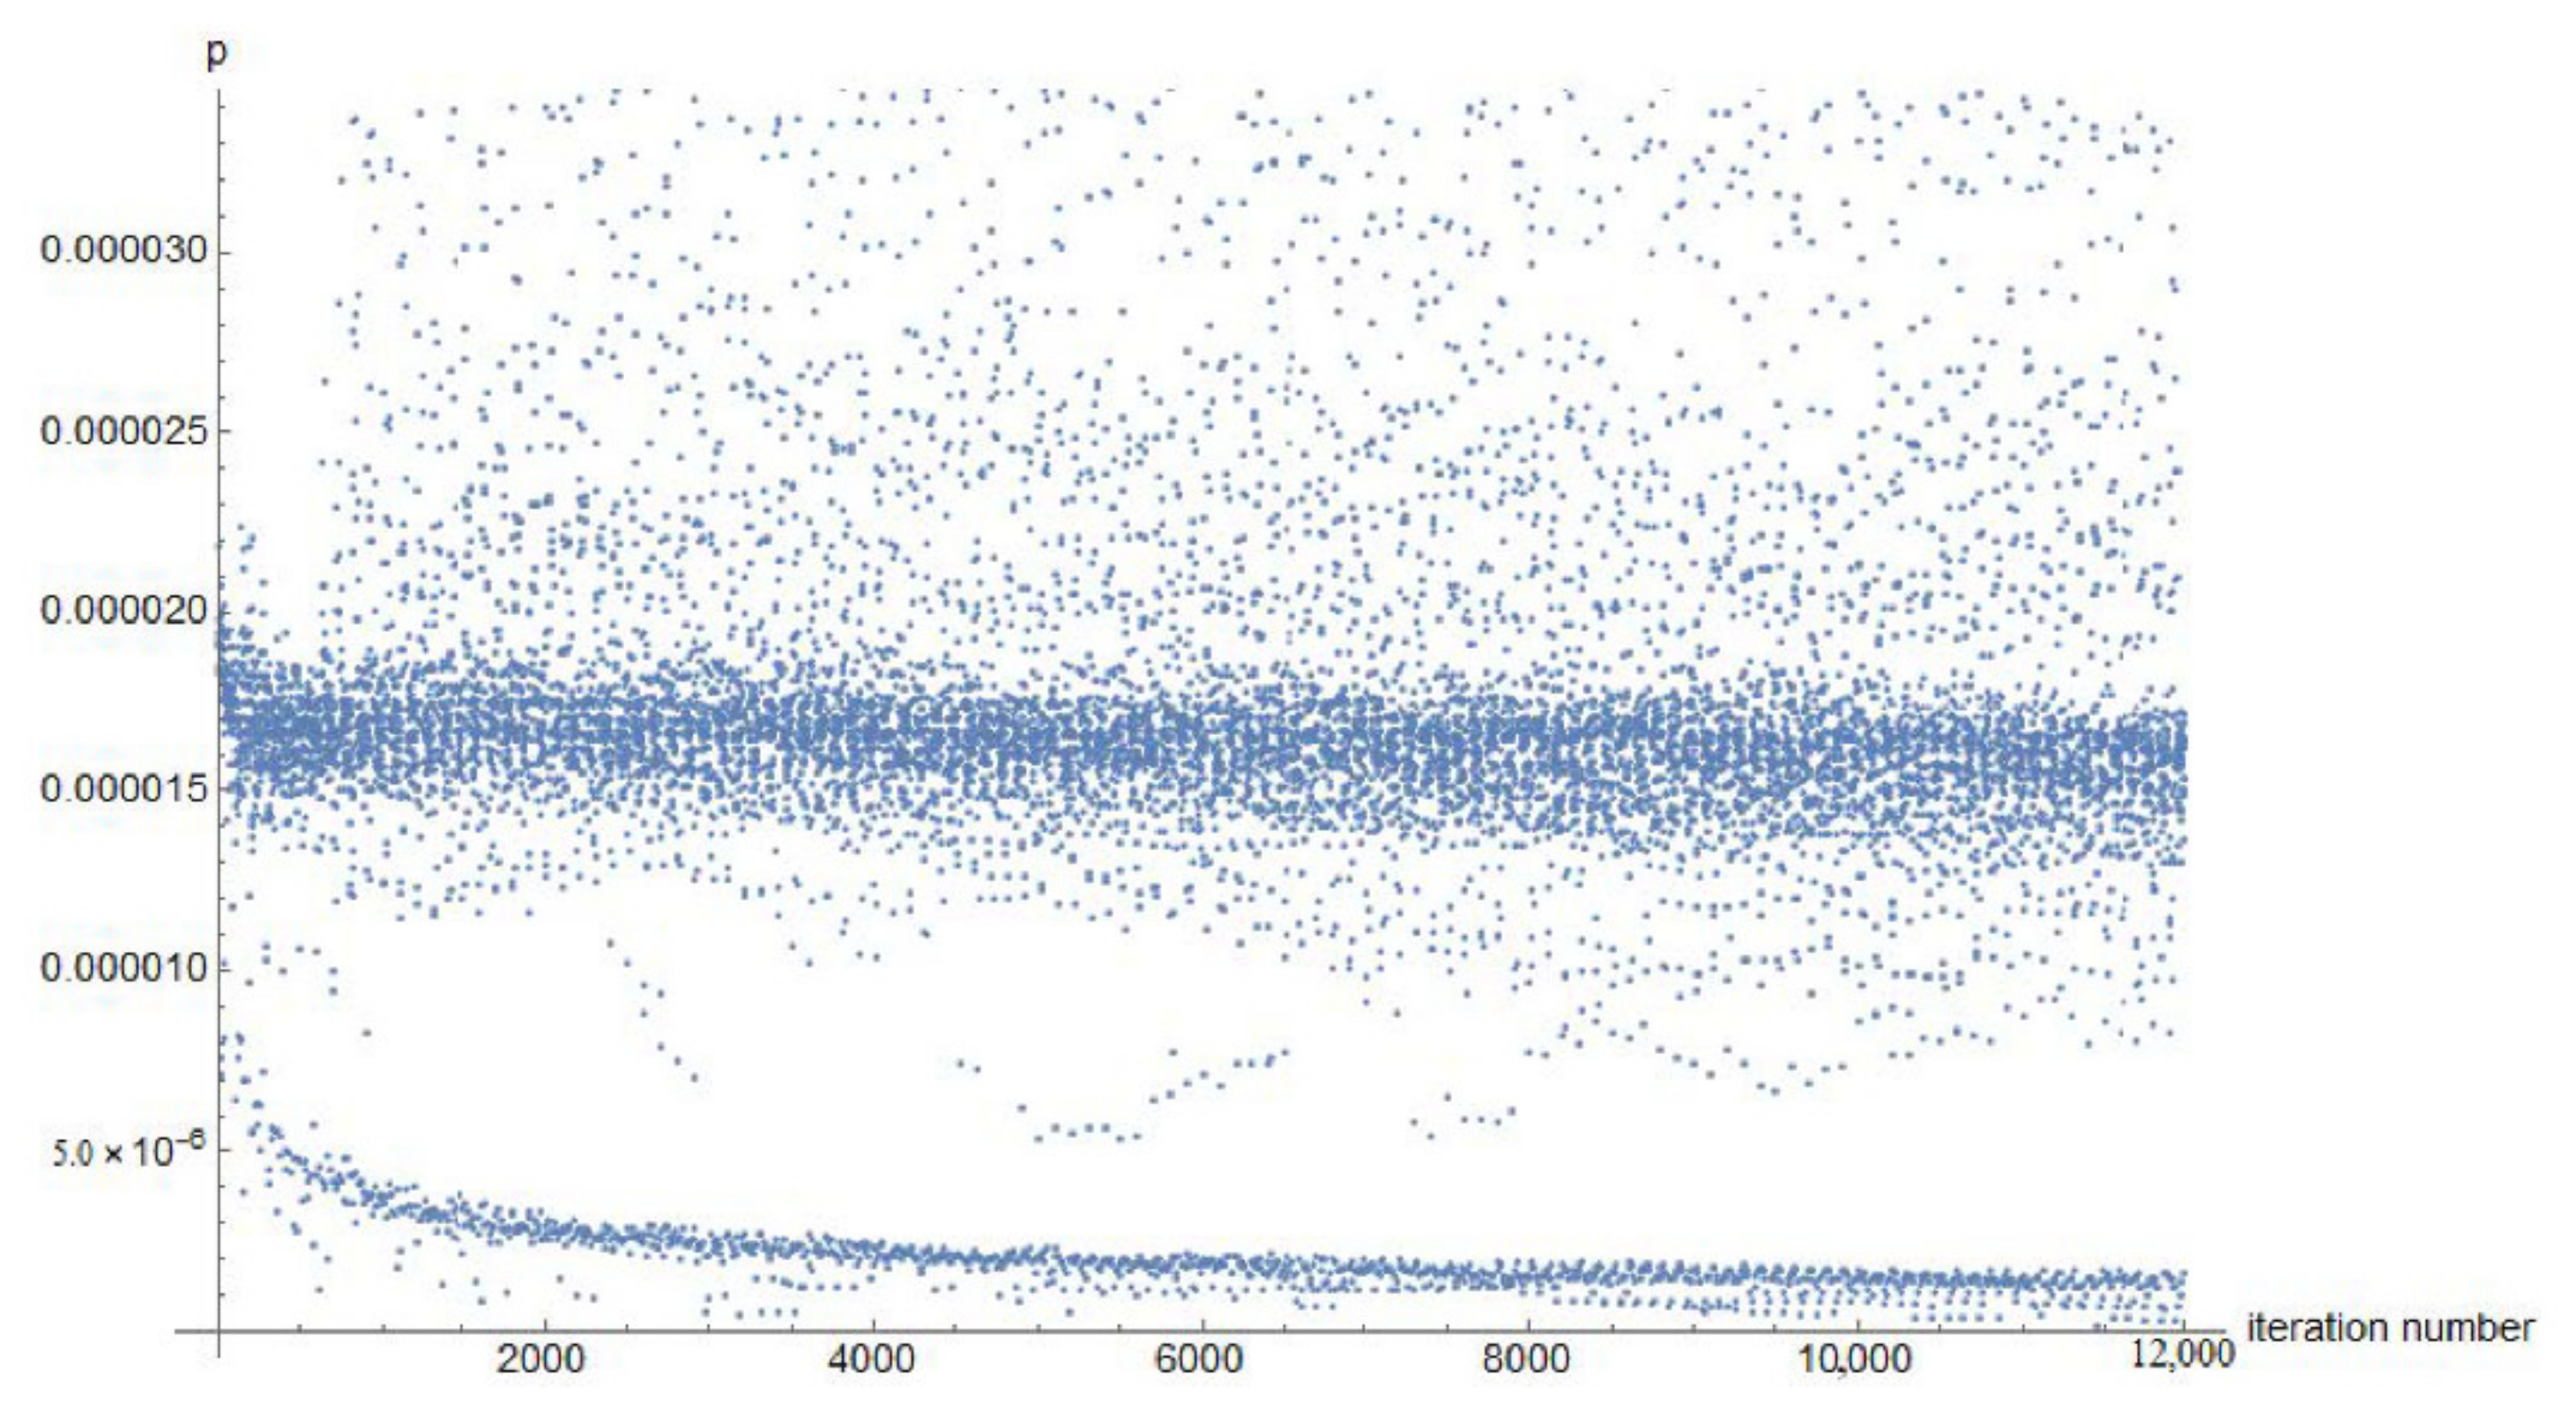
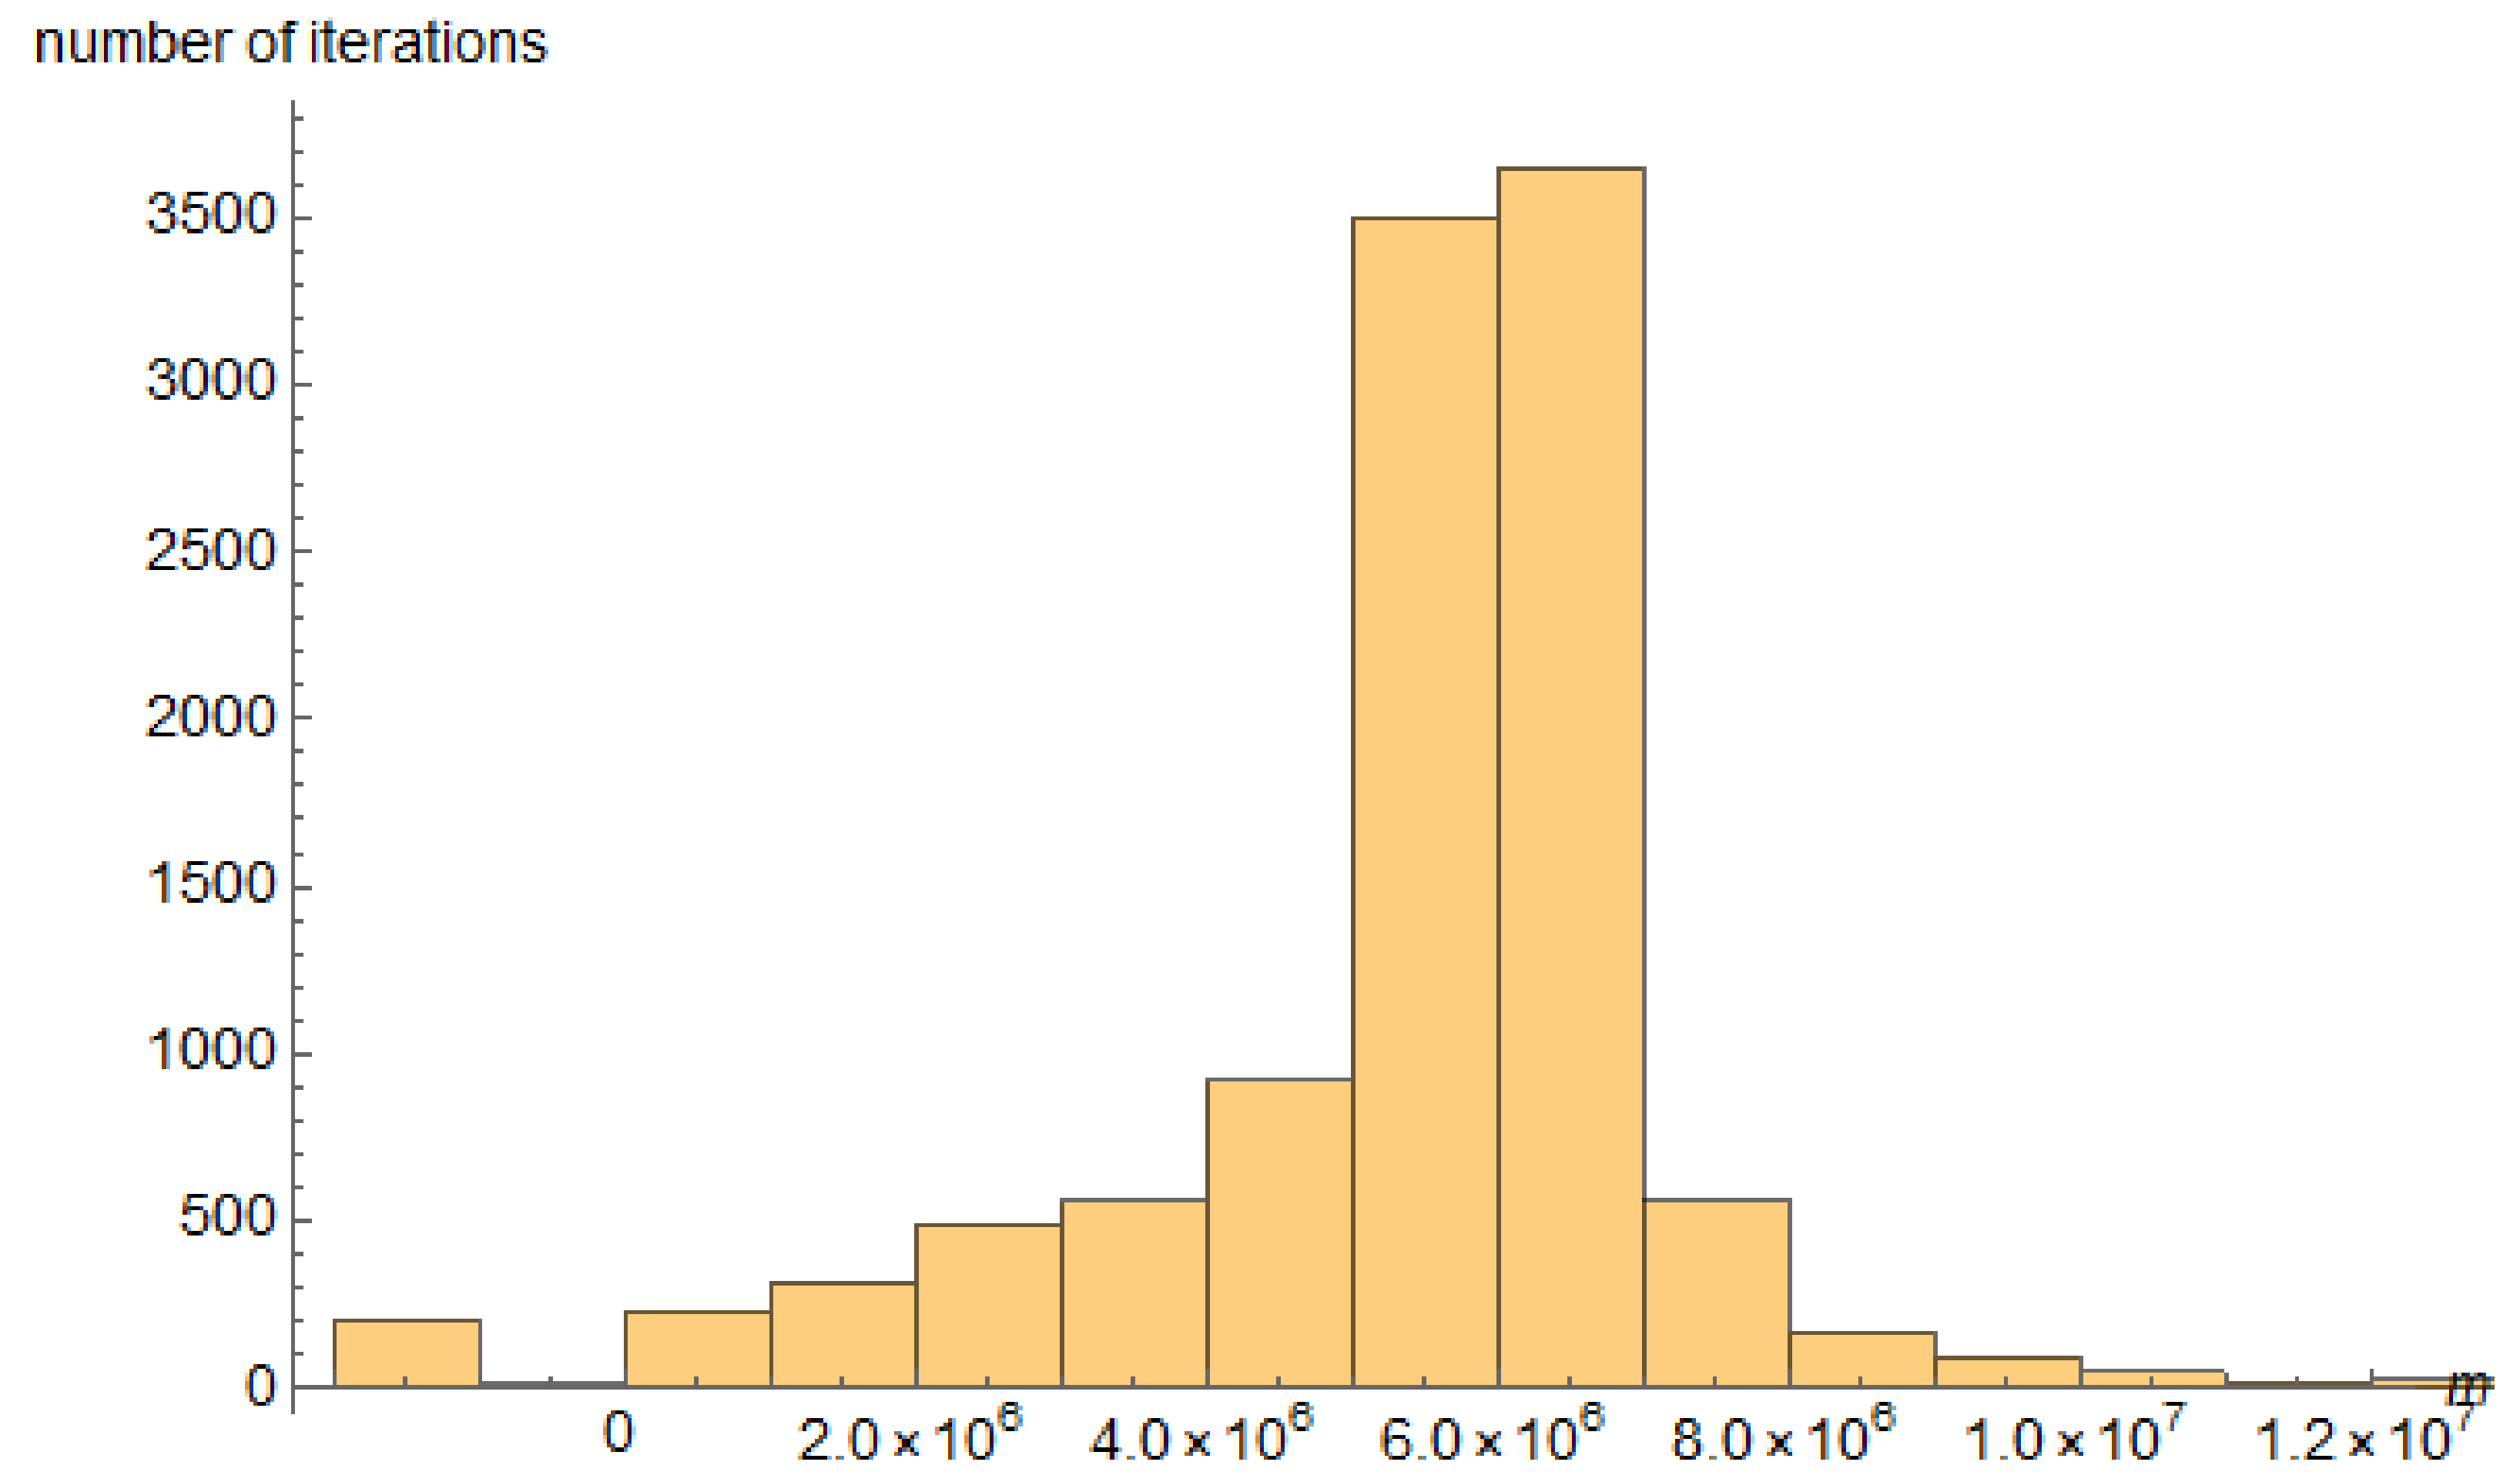
13] that in this type of forecast very large errors may be generated. The nonlinear least square (NLS) method was used to estimate the parameters
p and
q of the Bass model. More specifically, due to the instability of the solutions, the iterative calling of the NLS method with different initial conditions of the
p,
q, and m parameters was used (more details see
Appendix A).


