
Multi-Criteria Analysis for the Selection of the Optimal Mining Design Solution—A Case Study on Quarry “Tambura”


Abstract
1. Introduction
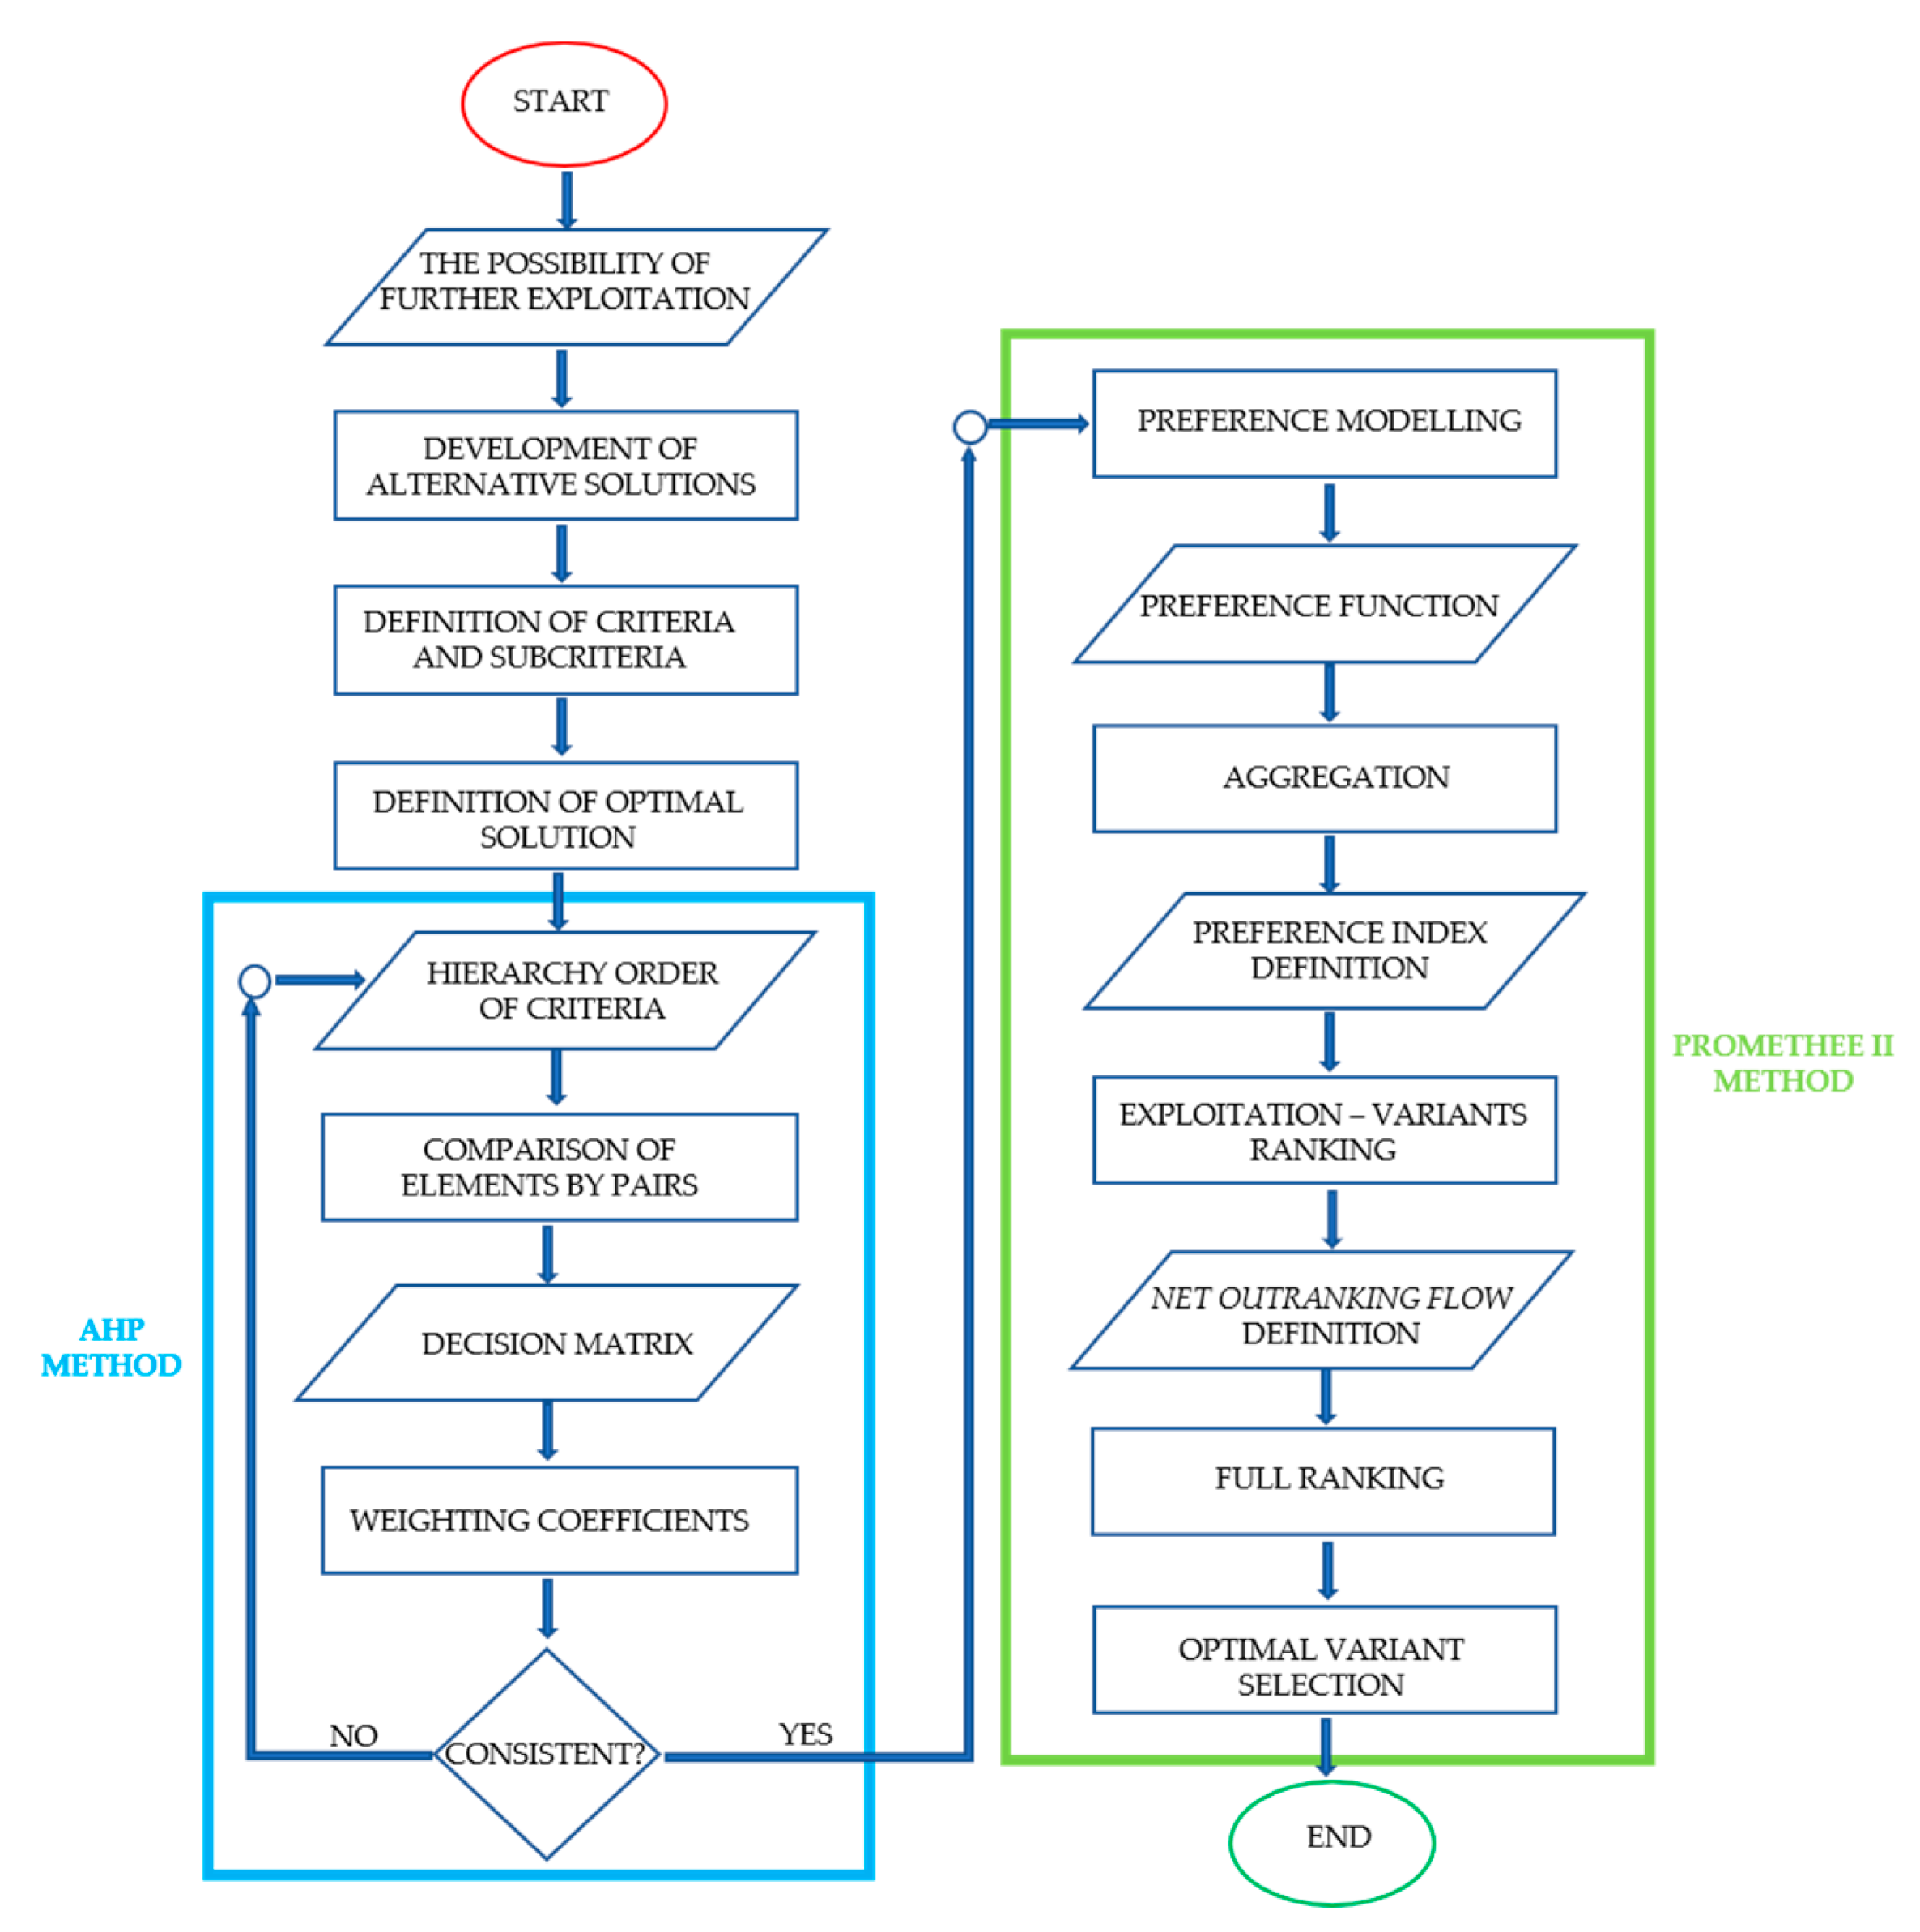
2. Methodology (Methods of Multi-Criteria Decision Making)
2.1. Analytical Hierarchy Process (AHP)
- Define the problem (the desired optimal solution);
- Create a hierarchy of criteria according to their level of importance, the most important at the top and the least important at the lowest level as they usually represent alternatives;
- Determine/create a square matrix of comparisons where you compare criteria (or alternatives) at the same level with other elements of the same level;
- Select the optimal alternative (solution) based on weighting coefficients.
2.2. PROMETHEE II Method
- Preference modelling,
- Aggregation,
- Exploitation.
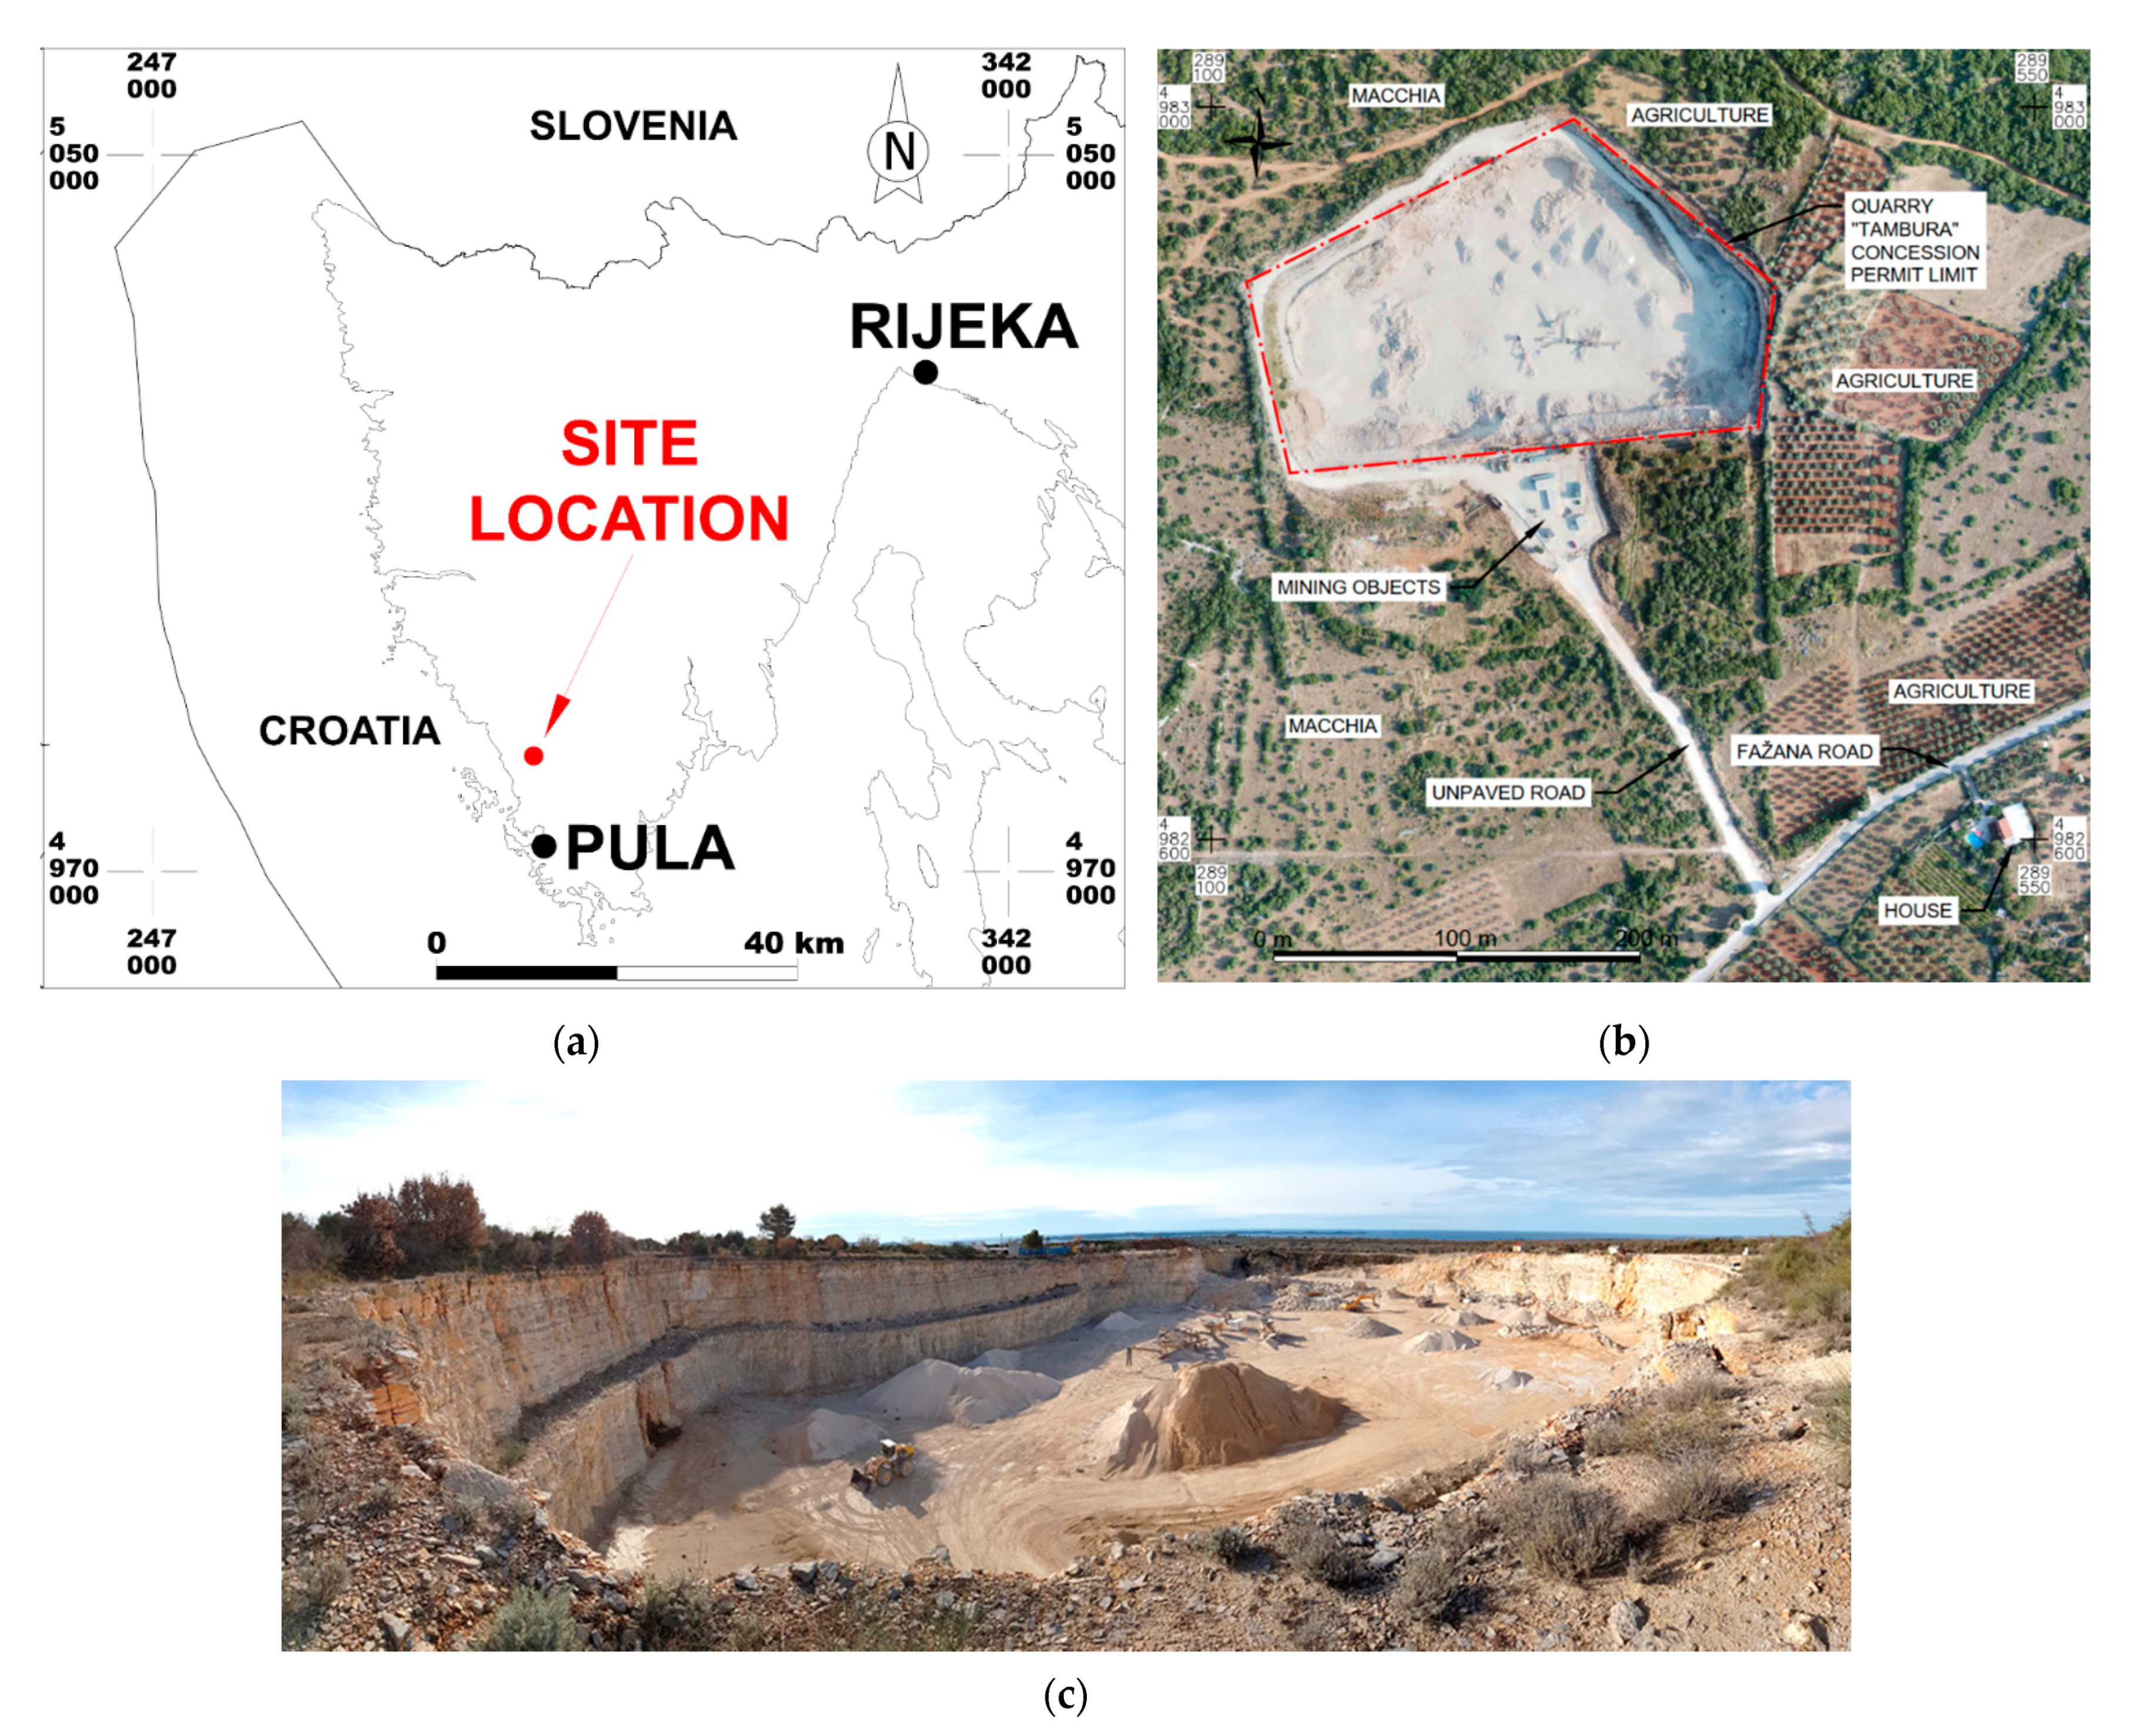
3. Selection of the Optimal Final Contour for the Quarry “TAMBURA”—Case Study
3.1. Site Location
3.2. Criteria Selection for Optimization—Application of the AHP Method
- Compliance with the relevant Croatian legislation,
- Maximally adapt to the present situation of the previously done mining work,
- Ensure the maximum possible level of safety for people and environment,
- Consider other neighbouring objects and works,
- Enable carrying out of biological reclamation after the exploitation is finished, and
- Enable the settlement of all property legal relations on all cadastral parcels covered by the exploitation field.
3.3. Application of the PROMETHEE II Method
- Selection of design solution alternatives (models) for further exploitation,
- Evaluation of models according to the set criteria and their sub-criteria,
- Comparison and ranking of alternative solutions, and
- Selection of the optimal model.
- Criteria evaluated based on the quantitative data,
- Criteria evaluated on the subjective assessment of the designer.
4. Discussion
5. Conclusions
Author Contributions
Funding
Institutional Review Board Statement
Informed Consent Statement
Data Availability Statement
Acknowledgments
Conflicts of Interest
Abbreviations
References
- Deluka-Tibljaš, A.; Karleuša, B.; Dragičević, N. Pregled primjene metoda višekriterijske analize pri donošenju odluka o prometnoj infrastrukturi. Građevinar 2013, 65, 619–631. [Google Scholar] [CrossRef]
- Krpan, L.; Vilke, S.; Milković, M. A model of the selection of an optimal railroad route by applying the multiple-criteria analysis. Teh. Vjesn. Tech. Gaz. 2017, 24, 1155–1164. [Google Scholar] [CrossRef][Green Version]
- Holjevac, N.; Kuzle, I.; Zidar, M.; Modrovčić, M. Razvoj modela analitičkog hijerarhijskog procesa i njegovo korištenje pri donošenju odluke o prelasku na 20 kv pogonski napon. In Proceedings of the 4. (10.) Savjetovanje Hrvatskog Ogranka Međunarodne Elektrodistribucijske Konferencije, Trogir, Croatia, 11–14 May 2014; Hrvatski Ogranak Međunarodne Elektrodistribucijske Konferencije—HO CIRED: Trogir, Croatia, 2014. [Google Scholar]
- Hudej, M.; Vujić, S.; Radosavlević, M.; Ilić, S. Multi-variable selection of the main mine shaft location. J. Min. Sci. 2013, 49, 950–954. [Google Scholar] [CrossRef]
- Dimitrijević, B.; Vujić, S.; Matić, I.; Majianac, S.; Praštalo, J.; Radosavljević, M.; Čolakovic, V. Multi-criterion analysis of land reclamation methods at Klenovnik open pit mine, Kostolac coal basin. J. Min. Sci. 2014, 50, 319–325. [Google Scholar] [CrossRef]
- Šubaranović, T.; Vujić, S.; Radosavljević, M.; Dimitrijević, B.; Ilić, S.; Krunić, D.J. Multi-Attribute Scenario Analysis of Protection of Drmno Open Pit Mine against Groundwater. J. Min. Sci. 2019, 55, 280–286. [Google Scholar] [CrossRef]
- Özfırat, M.K. A fuzzy method for selecting underground coal mining method considering mechanization criteria. J. Min. Sci. 2012, 48, 533–544. [Google Scholar] [CrossRef]
- Kizil, M.S.; Abdalla, S.; Canbulat, I. Underground coal mine layout selection using analytical hierarchy process. Min. Technol. 2014, 123, 20–29. [Google Scholar] [CrossRef]
- Stojanović, C.; Bogdanović, D.; Urošević, S. Selection of the optimal technology for surface mining by multi-criteria analysis. Kuwait J. Sci. 2015, 42, 170–190. [Google Scholar]
- Bouhedja, A.; Idres, A.; Boutrid, A.; Bounouala, M.; Benselhoub, A.; Talhi, K. Application of promethee mathematical model for choosing a secondary breakage process of the oversized blocks in limestone quarries. Min. Sci. 2016, 23, 121–135. [Google Scholar] [CrossRef]
- Aryafar, A.; Rahimdel, M.J.; Tavakkoli, E. Selection of the most proper drilling and blasting pattern by using MADM methods (A case study: Sangan Iron Ore Mine, Iran). Rud. Zb. 2020, 35, 97–108. [Google Scholar] [CrossRef]
- Yari, M.; Bagherpour, R.; Khoshouei, M.; Pedram, H. Investigating a comprehensive model for evaluating occupational and environmental risks of dimensional stone mining. Rud. Zb. 2020, 35, 101–109. [Google Scholar] [CrossRef]
- Baek, J.; Choi, Y.; Park, H. Uncertainty Representation Method for Open Pit Optimization Results Due to Variation in Mineral Prices. Minerals 2016, 6, 17. [Google Scholar] [CrossRef]
- Yari, M.; Bagherpour, R.; Almasi, N. An Approach to the Evaluation and Classification of Dimensional Stone Quarries with an Emphasis on Safety Parameters. Rud. Zb. 2016, 31, 15–26. [Google Scholar] [CrossRef]
- Wang, C.; Tu, S.; Zhang, L.; Yang, Q.; Tu, H. Auxiliary transportation mode in a fully-mechanized face in a nearly horizontal thin coal seam. Int. J. Min. Sci. Technol. 2015, 25, 963–968. [Google Scholar] [CrossRef]
- Nolan, T.A.; Kecojevic, V. Selection of overburden surface mining method in West Virginia by analytical hierarchy process. Int. J. Coal Sci. Technol. 2014, 1, 306–314. [Google Scholar] [CrossRef][Green Version]
- Aghajani Bazzazi, A.; Osanloo, M.; Karimi, B. A new fuzzy multi criteria decision making model for open pit mines equipment selection. Asia-Pacific J. Oper. Res. 2011, 28, 279–300. [Google Scholar] [CrossRef]
- Vujić, S.; Hudej, M.; Miljanović, I. Results of the PROMETHEE method application in selecting the technological system at the Majdan III open pit mine. Arch. Min. Sci. 2013, 58, 1229–1240. [Google Scholar] [CrossRef]
- Betrie, G.D.; Sadiq, R.; Morin, K.A.; Tesfamariam, S. Selection of remedial alternatives for mine sites: A multicriteria decision analysis approach. J. Environ. Manag. 2013, 119, 36–46. [Google Scholar] [CrossRef]
- Yakovlev, V.L.; Zyryanov, I.V.; Akishev, A.N.; Sakantsev, G.G. Determination of open pit diamond mine limits with regard to stripping time difference. J. Min. Sci. 2016, 52, 1143–1149. [Google Scholar] [CrossRef]
- Balusa, B.C.; Singam, J. Underground Mining Method Selection Using WPM and PROMETHEE. J. Inst. Eng. Ser. D 2018, 99, 165–171. [Google Scholar] [CrossRef]
- Chander, B.B.; Gorai, A.K.; Jayantu, S. Design of Decision-Making Techniques Using Improved AHP and VIKOR for Selection of Underground Mining Method. In Proceedings of the 5th International Conference on Advanced Computing, Networking and Informatics, Goa, India, 1–3 June 2017; Sa, P.K., Bakshi, S., Hatzilygeroudis, I.K., Sahoo, M.N., Eds.; Springer Nature Singapore Pte Ltd.: Singapore, 2018; pp. 495–504, ISBN 978-981-10-8636-6. [Google Scholar] [CrossRef]
- Alpay, S.; Yavuz, M. A Decision Support System for Underground Mining Method Selection. In New Trends in Applied Artificial Intelligence; Okuno, H.G., Ali, M., Eds.; Springer: Berlin/Heidelberg, Germany, 2007; Volume 4570, pp. 334–343. ISBN 9783540733225. [Google Scholar] [CrossRef]
- Iphar, M.; Alpay, S. A mobile application based on multi-criteria decision-making methods for underground mining method selection. Int. J. Min. Reclam. Environ. 2019, 33, 480–504. [Google Scholar] [CrossRef]
- Yazdani-Chamzini, A.; Yakchali, S.H.; Zavadskas, E.K. Using a Integrated MCDM Model for Mining Method Selection in Presence of Uncertainty. Econ. Res.-Ekon. Istr. 2012, 25, 869–904. [Google Scholar] [CrossRef]
- Gupta, S.; Kumar, U. An analytical hierarchy process (AHP)-guided decision model for underground mining method selection. Int. J. Min. Reclam. Environ. 2012, 26, 324–336. [Google Scholar] [CrossRef]
- Naghadehi, M.Z.; Mikaeil, R.; Ataei, M. The application of fuzzy analytic hierarchy process (FAHP) approach to selection of optimum underground mining method for Jajarm Bauxite Mine, Iran. Expert Syst. Appl. 2009, 36, 8218–8226. [Google Scholar] [CrossRef]
- Balusa, B.C.; Gorai, A.K. Sensitivity analysis of fuzzy-analytic hierarchical process (FAHP) decision-making model in selection of underground metal mining method. J. Sustain. Min. 2019, 18, 8–17. [Google Scholar] [CrossRef]
- Balusa, B.C.; Gorai, A.K. A Comparative Study of Various Multi-criteria Decision-Making Models in Underground Mining Method Selection. J. Inst. Eng. Ser. D 2019, 100, 105–121. [Google Scholar] [CrossRef]
- Javanshirgiv, M.; Safari, M. The selection of an underground mining method using the fuzzy topsis method: A case study in the Kamar Mahdi II fluorine mine. Min. Sci. 2017, 24, 161–181. [Google Scholar] [CrossRef]
- Asadi Ooriad, F.; Yari, M.; Bagherpour, R.; Khoshouei, M. The development of a novel Model for Mining Method Selection in a Fuzzy Environment; Case study: Tazareh Coal Mine, Semnan Province, Iran. Rud. Zb. 2018, 33, 45–53. [Google Scholar] [CrossRef]
- Ataei, M.; Sereshki, F.; Jamshidi, M.; Jalali, S.M.E. Suitable mining method for Golbini No. 8 deposit in Jajarm (Iran) using TOPSIS method. Min. Technol. 2008, 117, 1–5. [Google Scholar] [CrossRef]
- Yavuz, M. The application of the analytic hierarchy process (AHP) and Yager’s method in underground mining method selection problem. Int. J. Min. Reclam. Environ. 2015, 29, 453–475. [Google Scholar] [CrossRef]
- Kabwe, E. Optimal mining method selection for Nchanga’s Upper Orebody using analytic hierarchy process and Yager’s method. Min. Technol. 2017, 126, 151–162. [Google Scholar] [CrossRef]
- Bajić, S.; Bajić, D.; Gluščević, B.; Ristić Vakanjac, V. Application of Fuzzy Analytic Hierarchy Process to Underground Mining Method Selection. Symmetry 2020, 12, 192. [Google Scholar] [CrossRef]
- Bogdanović, D.; Nikolić, D.; Ilić, I. Mining method selection by integrated AHP and PROMETHEE method. An. Acad. Bras. Cienc. 2012, 84, 219–233. [Google Scholar] [CrossRef] [PubMed]
- Caccetta, L. Application of Optimisation techniques in open pit mining. Int. Ser. Oper. Res. Manag. Sci. 2016, 99, 547–559. [Google Scholar]
- Appianing, E.J.A.; Mireku-Gyimah, D. Open Pit Optimisation and Design: A Stepwise Approach. Ghana Min. J. 2015, 15, 27–35. [Google Scholar]
- Picard, J.-C.; Smith, B.T. Parametric Maximum Flows and The Calculation of Optimal Intermediate Contours in Open Pit Mine Design. INFOR Inf. Syst. Oper. Res. 2004, 42, 143–153. [Google Scholar] [CrossRef]
- Radić, M.; Galić, I.; Farkaš, B. Određivanje Optimalne Konture Površinskog Kopa Boksita “Skakavac L-1” Primjenom Metode Pomičnih Kosina. Rud. Glas. 2019, 23, 175–194. [Google Scholar]
- Farkaš, B. Optimizacija Eksploatacije Arhitektonsko-Građevnoga Kamena u Ovisnosti o Tehno-Ekonomskim Faktorima. Ph.D. Thesis, Rudarsko-Geološko-Naftni Fakultet Sveučilišta u Zagrebu, Zagreb, Croatia, 2017. [Google Scholar]
- Hwang, C.-L.; Yoon, K. Multiple Attribute Decision Making; Lecture Notes in Economics and Mathematical Systems; Springer: Berlin/Heidelberg, Germany, 1981; Volume 186, ISBN 978-3-540-10558-9. [Google Scholar]
- Saaty, T.L. Decision making with the analytic hierarchy process. Int. J. Serv. Sci. 2008, 1, 83–98. [Google Scholar] [CrossRef]
- Saaty, R.W. The analytic hierarchy process-what it is and how it is used. Math. Model. 1987, 9, 161–176. [Google Scholar] [CrossRef]
- Saaty, T.L. Highlights and critical points in the theory and application of the Analytic Hierarchy Process. Eur. J. Oper. Res. 1994, 74, 426–447. [Google Scholar] [CrossRef]
- Saaty, T.L.; Ozdemir, M.S. Why the magic number seven plus or minus two. Math. Comput. Model. 2003, 38, 233–244. [Google Scholar] [CrossRef]
- Brans, J.P.; Vincke, P. Note—A Preference Ranking Organisation Method. Manag. Sci. 1985, 31, 647–656. [Google Scholar] [CrossRef]
- Brans, J.-P.; Mareschal, B. PROMETHEE methods. In Multiple Criteria Decision Analysis: State of the Art Surveys; Figueira, J., Greco, S., Ehrgott, M., Eds.; International Series in Operations Research & Management Science; Springer: New York, NY, USA, 2005; Volume 78, pp. 163–186. ISBN 978-0-387-23081-8. [Google Scholar] [CrossRef]
- Klanac, J.; Perkov, J.; Krajnović, A. Primjena AHP i PROMETHEE metode na problem diverzifikacije. Oeconomica Jadertina 2013, 3, 3–27. [Google Scholar] [CrossRef]
- Tomić, V.; Marinković, Z.; Janošević, D. Promethee method implementation with multi-criteria decisions. Mech. Eng. 2011, 9, 193–202. [Google Scholar]
- Albadvi, A.; Chaharsooghi, S.K.; Esfahanipour, A. Decision making in stock trading: An application of PROMETHEE. Eur. J. Oper. Res. 2006, 177, 673–683. [Google Scholar] [CrossRef]
- Hrastov, A. Optimizacija Kontura Površinskog Kopa na Eksploatacijskom Polju Tehničko—Građevnog Kamena “Tambura”. Master’s Thesis, Rudarsko-Geološko-Naftni Fakultet Sveučilišta u Zagrebu, Zagreb, Croatia, 2019. [Google Scholar]
- Farkaš, B.; Perić, M.; Hrastov, A.; Pištelek, I.; Buti, L. Idejni Rudarski Projekt Eksploatacije Tehničko-Građevnog Kamena na Eksploatacijskom Polju “Tambura”, rev. 3; Faculty of Mining Geology and Petroleum Engineering, University of Zagreb: Zagreb, Croatia, 2019. [Google Scholar]
- Matjašić, I. Elaborat o Rezervama Tehničko-Građevnog Kamena na Eksploatacijskom Polju “Tambura” kod Vodnjana—IV Obnova Proračuna Rezervi; Calx d.o.o.: Zagreb, Croatia, 2015. [Google Scholar]
- Knežević Jurić, K.; Bašić Končar, M.; Hovezak, I.; Jurić, D.; Hrastov, A.; Buti, L.; Farkaš, B.; Pavlić, K.; Hanić, A.; Krešo, N.; et al. Studija o Utjecaju na Okoliš: Izmjena Zahvata Eksploatacije Tehničko-Građevnog Kamena na Eksploatacijskom Polju “Tambura”; Kaina d.o.o.: Zagreb, Croatia, 2020. [Google Scholar]


| Degree/Intensity of Importance | Definition | Description |
|---|---|---|
| 1 | Equally favourable | 2 elements (i and j) have equal value |
| 3 | Slightly more favourable | Element (i) is slightly more favourable than element (j) |
| 5 | Highly favourable | Element (i) is highly favourable than element (j) |
| 7 | Very highly favourable | Element (i) is very highly favourable than element (j) |
| 9 | Extremely favourable | Element (i) is extremely favourable than element (j) |
| 2, 4, 6, 8 | Median values between two definitions |
| n | RI |
|---|---|
| 1 | 0.00 |
| 2 | 0.00 |
| 3 | 0.58 |
| 4 | 0.90 |
| 5 | 1.12 |
| 6 | 1.24 |
| 7 | 1.32 |
| 8 | 1.41 |
| 9 | 1.45 |
| 10 | 1.49 |
| Criteria Group | Degree/Intensity of Importance | Definition |
|---|---|---|
| Project parameters | 1 | Equally preferred |
| Mineral deposit reserves | 1 | Equally preferred |
| Economic indicators | 4 | Moderately to strongly preferred |
| Environmental impact | 5 | Strongly preferred |
| Property legal relations | 9 | Extremely preferred |
| Criteria Group | Project Parameters | Mineral Deposit Reserves | Economic Indicators | Environmental Impact | Property Legal Relations |
|---|---|---|---|---|---|
| Project parameters | 1.00 | 1.00 | 0.25 | 0.20 | 0.11 |
| Mineral deposit reserves | 1.00 | 1.00 | 0.20 | 0.25 | 0.11 |
| Economic indicators | 4.00 | 4.00 | 1.00 | 0.20 | 0.33 |
| Environmental impact | 5.00 | 5.00 | 5.00 | 1.00 | 0.33 |
| Property legal relations | 9.00 | 9.00 | 3.00 | 3.00 | 1.00 |
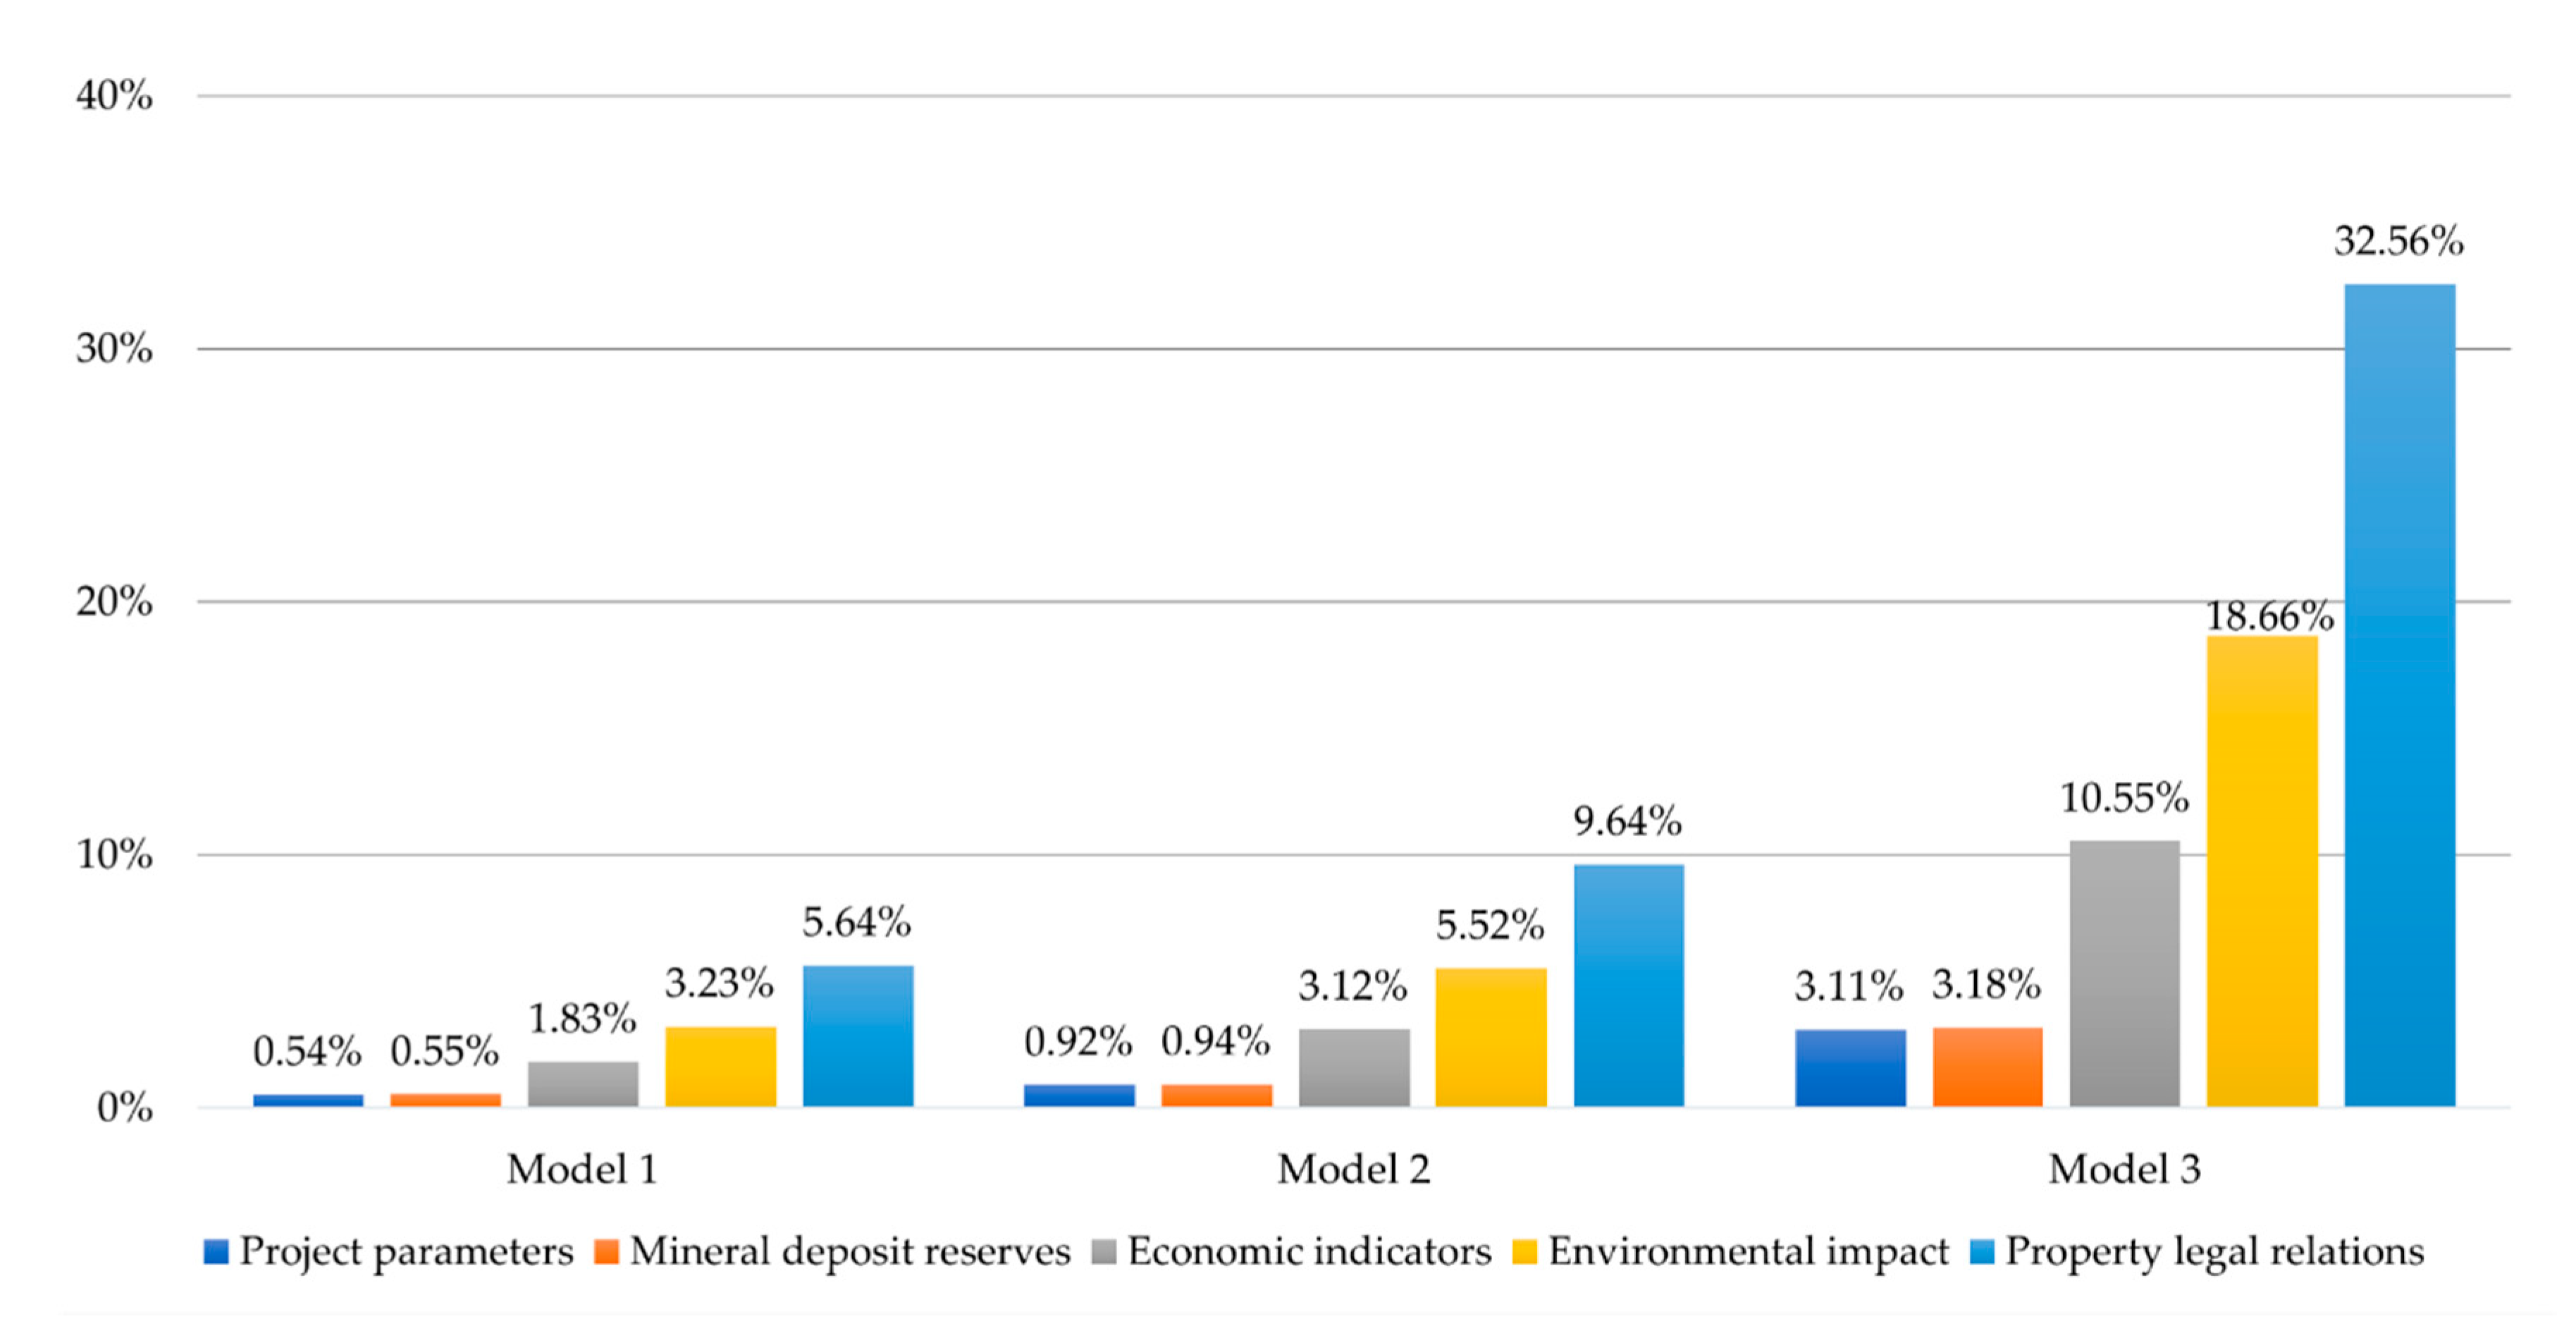
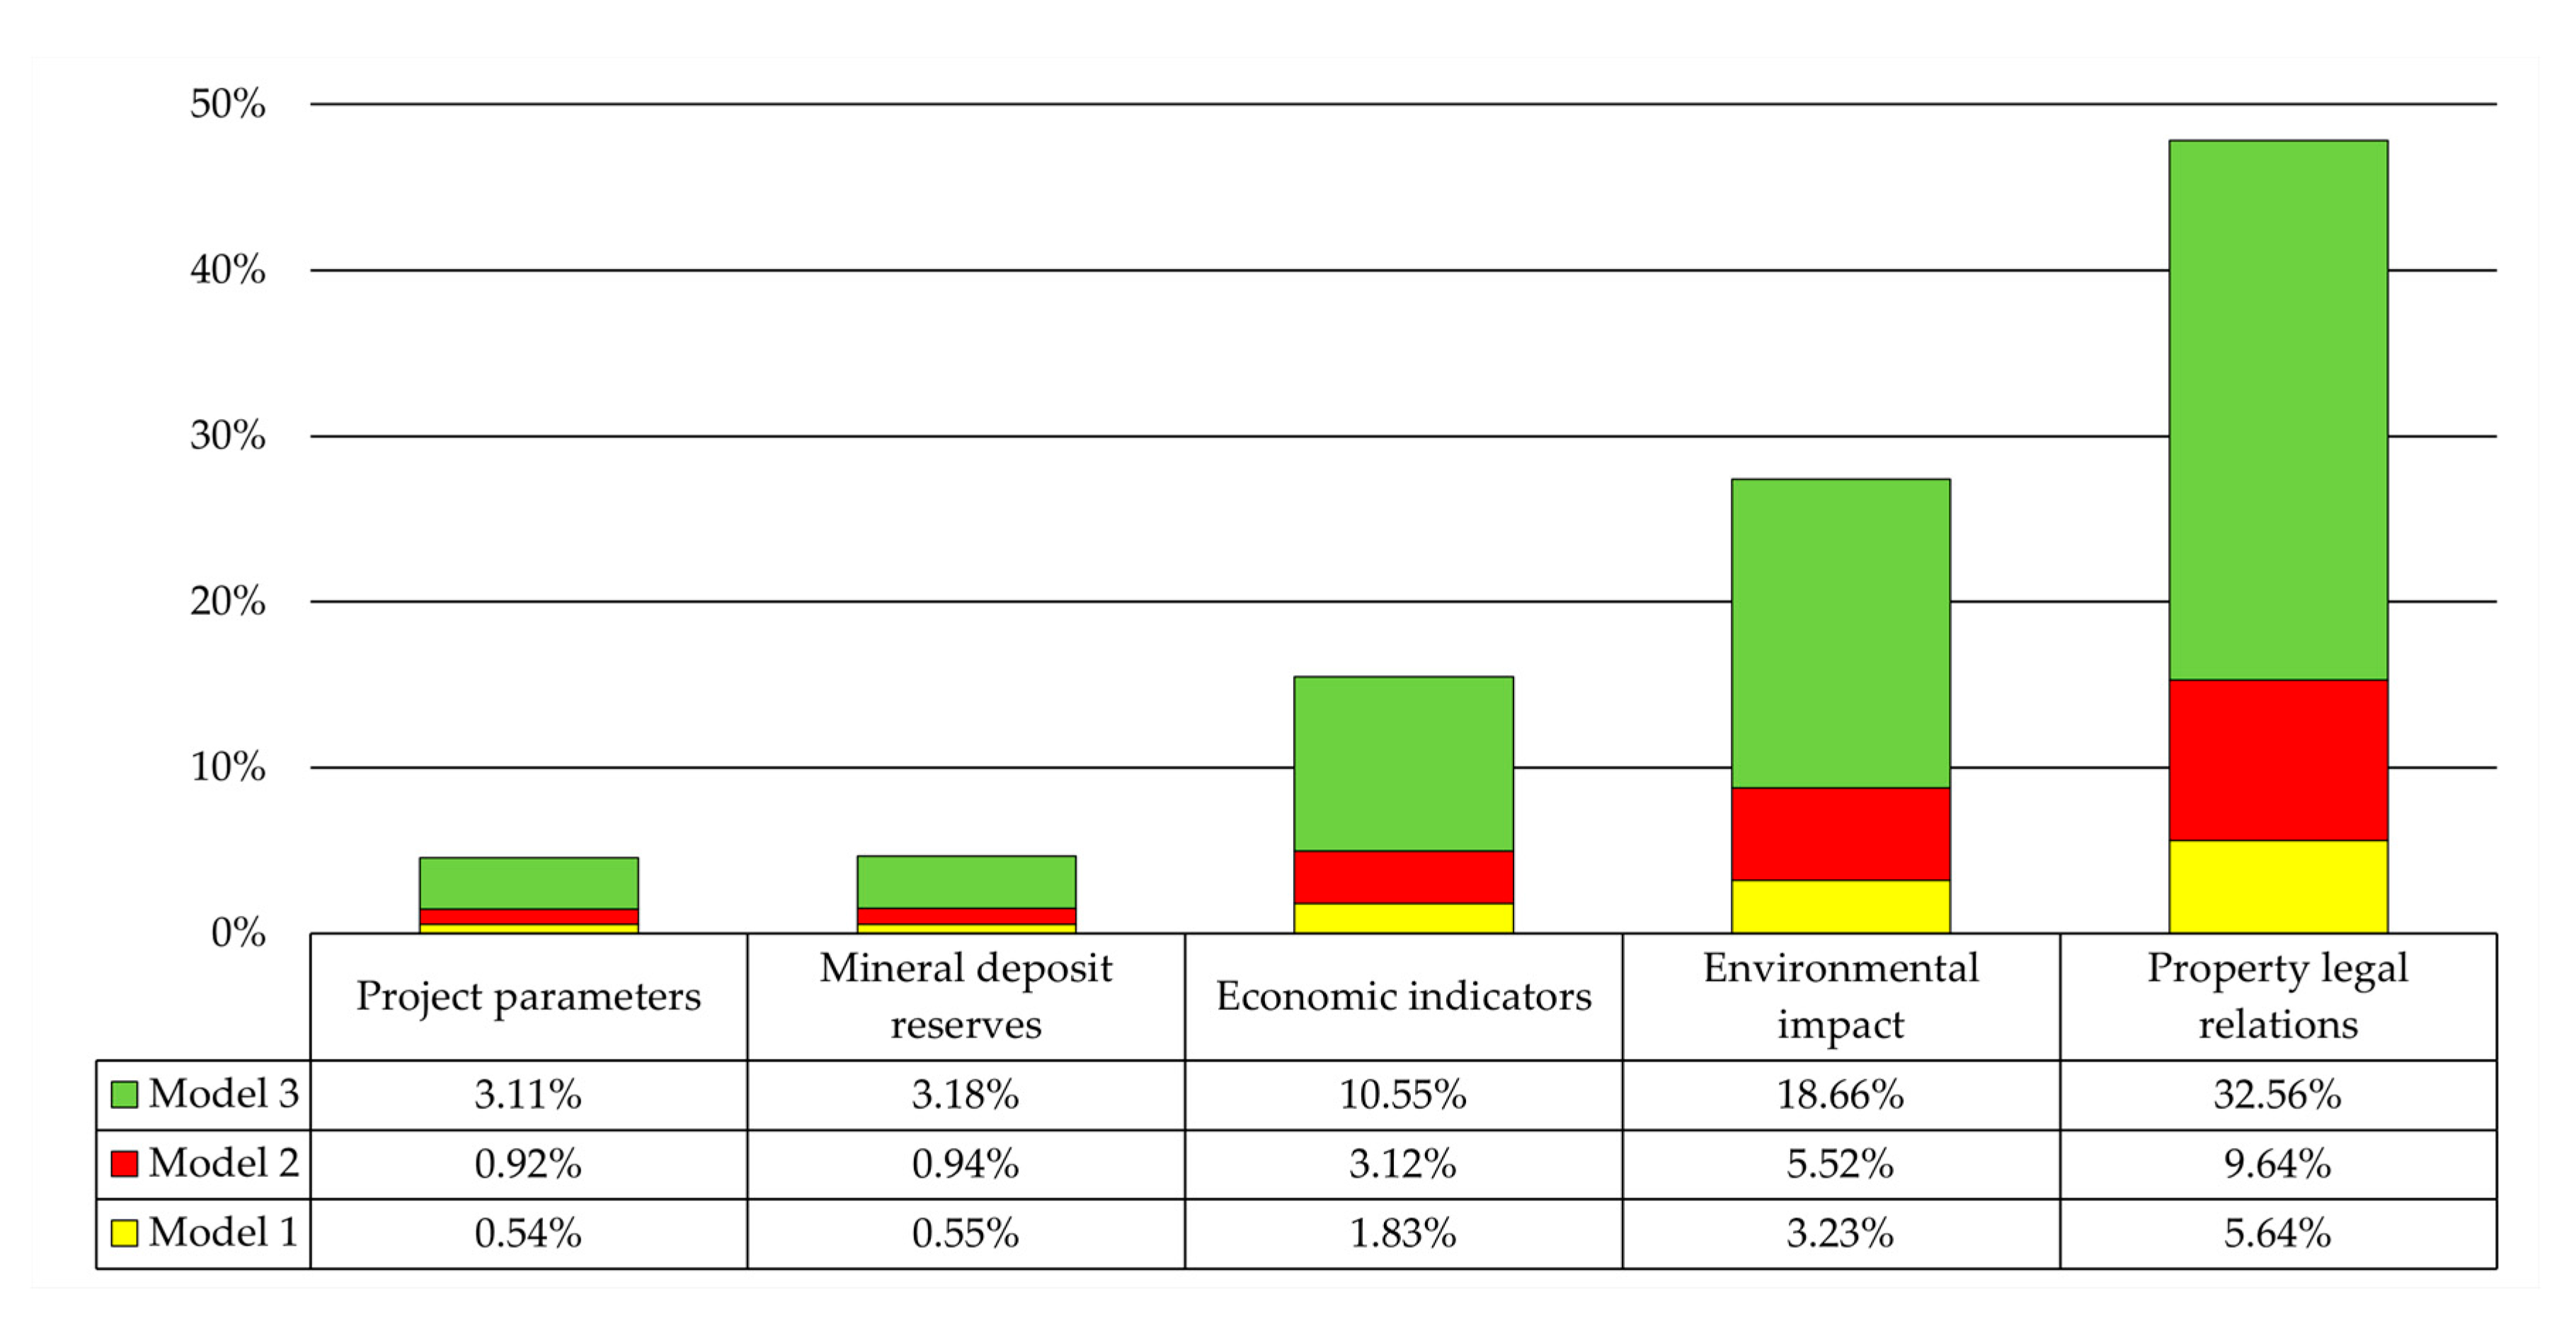
| Criteria Group | Weighting Coefficient | Weighting Coefficient (%) |
|---|---|---|
| Project parameters | 0.05 | 5.00 |
| Mineral deposit reserves | 0.05 | 5.00 |
| Economic indicators | 0.16 | 16.00 |
| Environmental impact | 0.27 | 27.00 |
| Property legal relations | 0.48 | 48.00 |
| Project Parameters | Models | ||
|---|---|---|---|
| Model 1 | Model 2 | Model 3 | |
| Maximum bench height (he), m | 20.0 | 17.0 | 24.0 |
| Minimum width of bench level (B), m | 3.0 | 5.0 | 5.0 |
| Angle of inclination of bench slope (αe), ° | ≤70 | ≤70 | ≤70 |
| Angle of inclination of final slope (αz), ° | ≤60 | ≤61 | ≤61 |
| Area of exploitation field, ha | 3.88 | 3.88 | 3.79 |
| Selection Criteria | ||||||
|---|---|---|---|---|---|---|
| Criteria Group | % | Criteria Name | % | Category Mark | ||
| Project parameters | 5 | Maximum bench height (he), m | 8 | C1 | ||
| Minimum width of bench level (B), m | 6 | C2 | ||||
| Angle of inclination of bench slope (αe), ° | 23 | C3 | ||||
| Angle of inclination of final slope (αz), ° | 43 | C4 | ||||
| Area of exploitation field, ha | 19 | C5 | ||||
| Mineral deposit reserves | 5 | Balance reserves, m3 | 28 | C6 | ||
| Out of balance reserves, m3 | 10 | C7 | ||||
| Exploitation reserves, m3 | 62 | C8 | ||||
| Economic indicators | 16 | Profit, kn | 19 | C9 | ||
| Fee expenses, kn | Fixed fee, kn | 17 | C10 | |||
| Variable fee, kn | Government budget, kn | 14 | C11 | |||
| Local regional unit, kn | 24 | C12 | ||||
| Local government unit, kn | 27 | C13 | ||||
| Environmental impact | 27 | Biodiversity | 7 | C14 | ||
| Geological and hydrological characteristics | 9 | C15 | ||||
| Seismological, pedological, and climatological characteristics | 7 | C16 | ||||
| Infrastructural and economic characteristics | 16 | C17 | ||||
| Cultural and landscape characteristics | 6 | C18 | ||||
| Noise | 18 | C19 | ||||
| Blasting | 21 | C20 | ||||
| Population | 17 | C21 | ||||
| Property legal relations | 48 | Possibility of enabling access to all cadastral parcels | 100 | C22 | ||
| Environmental Impact | ||||||
|---|---|---|---|---|---|---|
| None | / | Weak | / | Moderate | / | High |
| 7 | 6 | 5 | 4 | 3 | 2 | 1 |
| Selection Criteria | Models | |||||
|---|---|---|---|---|---|---|
| Criteria Group | % | Criteria Mark | Model 1 | Model 2 | Model 3 | |
| Project parameters | 5 | C1 | m max | 20 | 17 | 24 |
| C2 | m min | 3 | 5 | 5 | ||
| C3 | ° max | 70 | 70 | 70 | ||
| C4 | ° max | 60 | 61 | 61 | ||
| C5 | ha max | 3.88 | 3.88 | 3.79 | ||
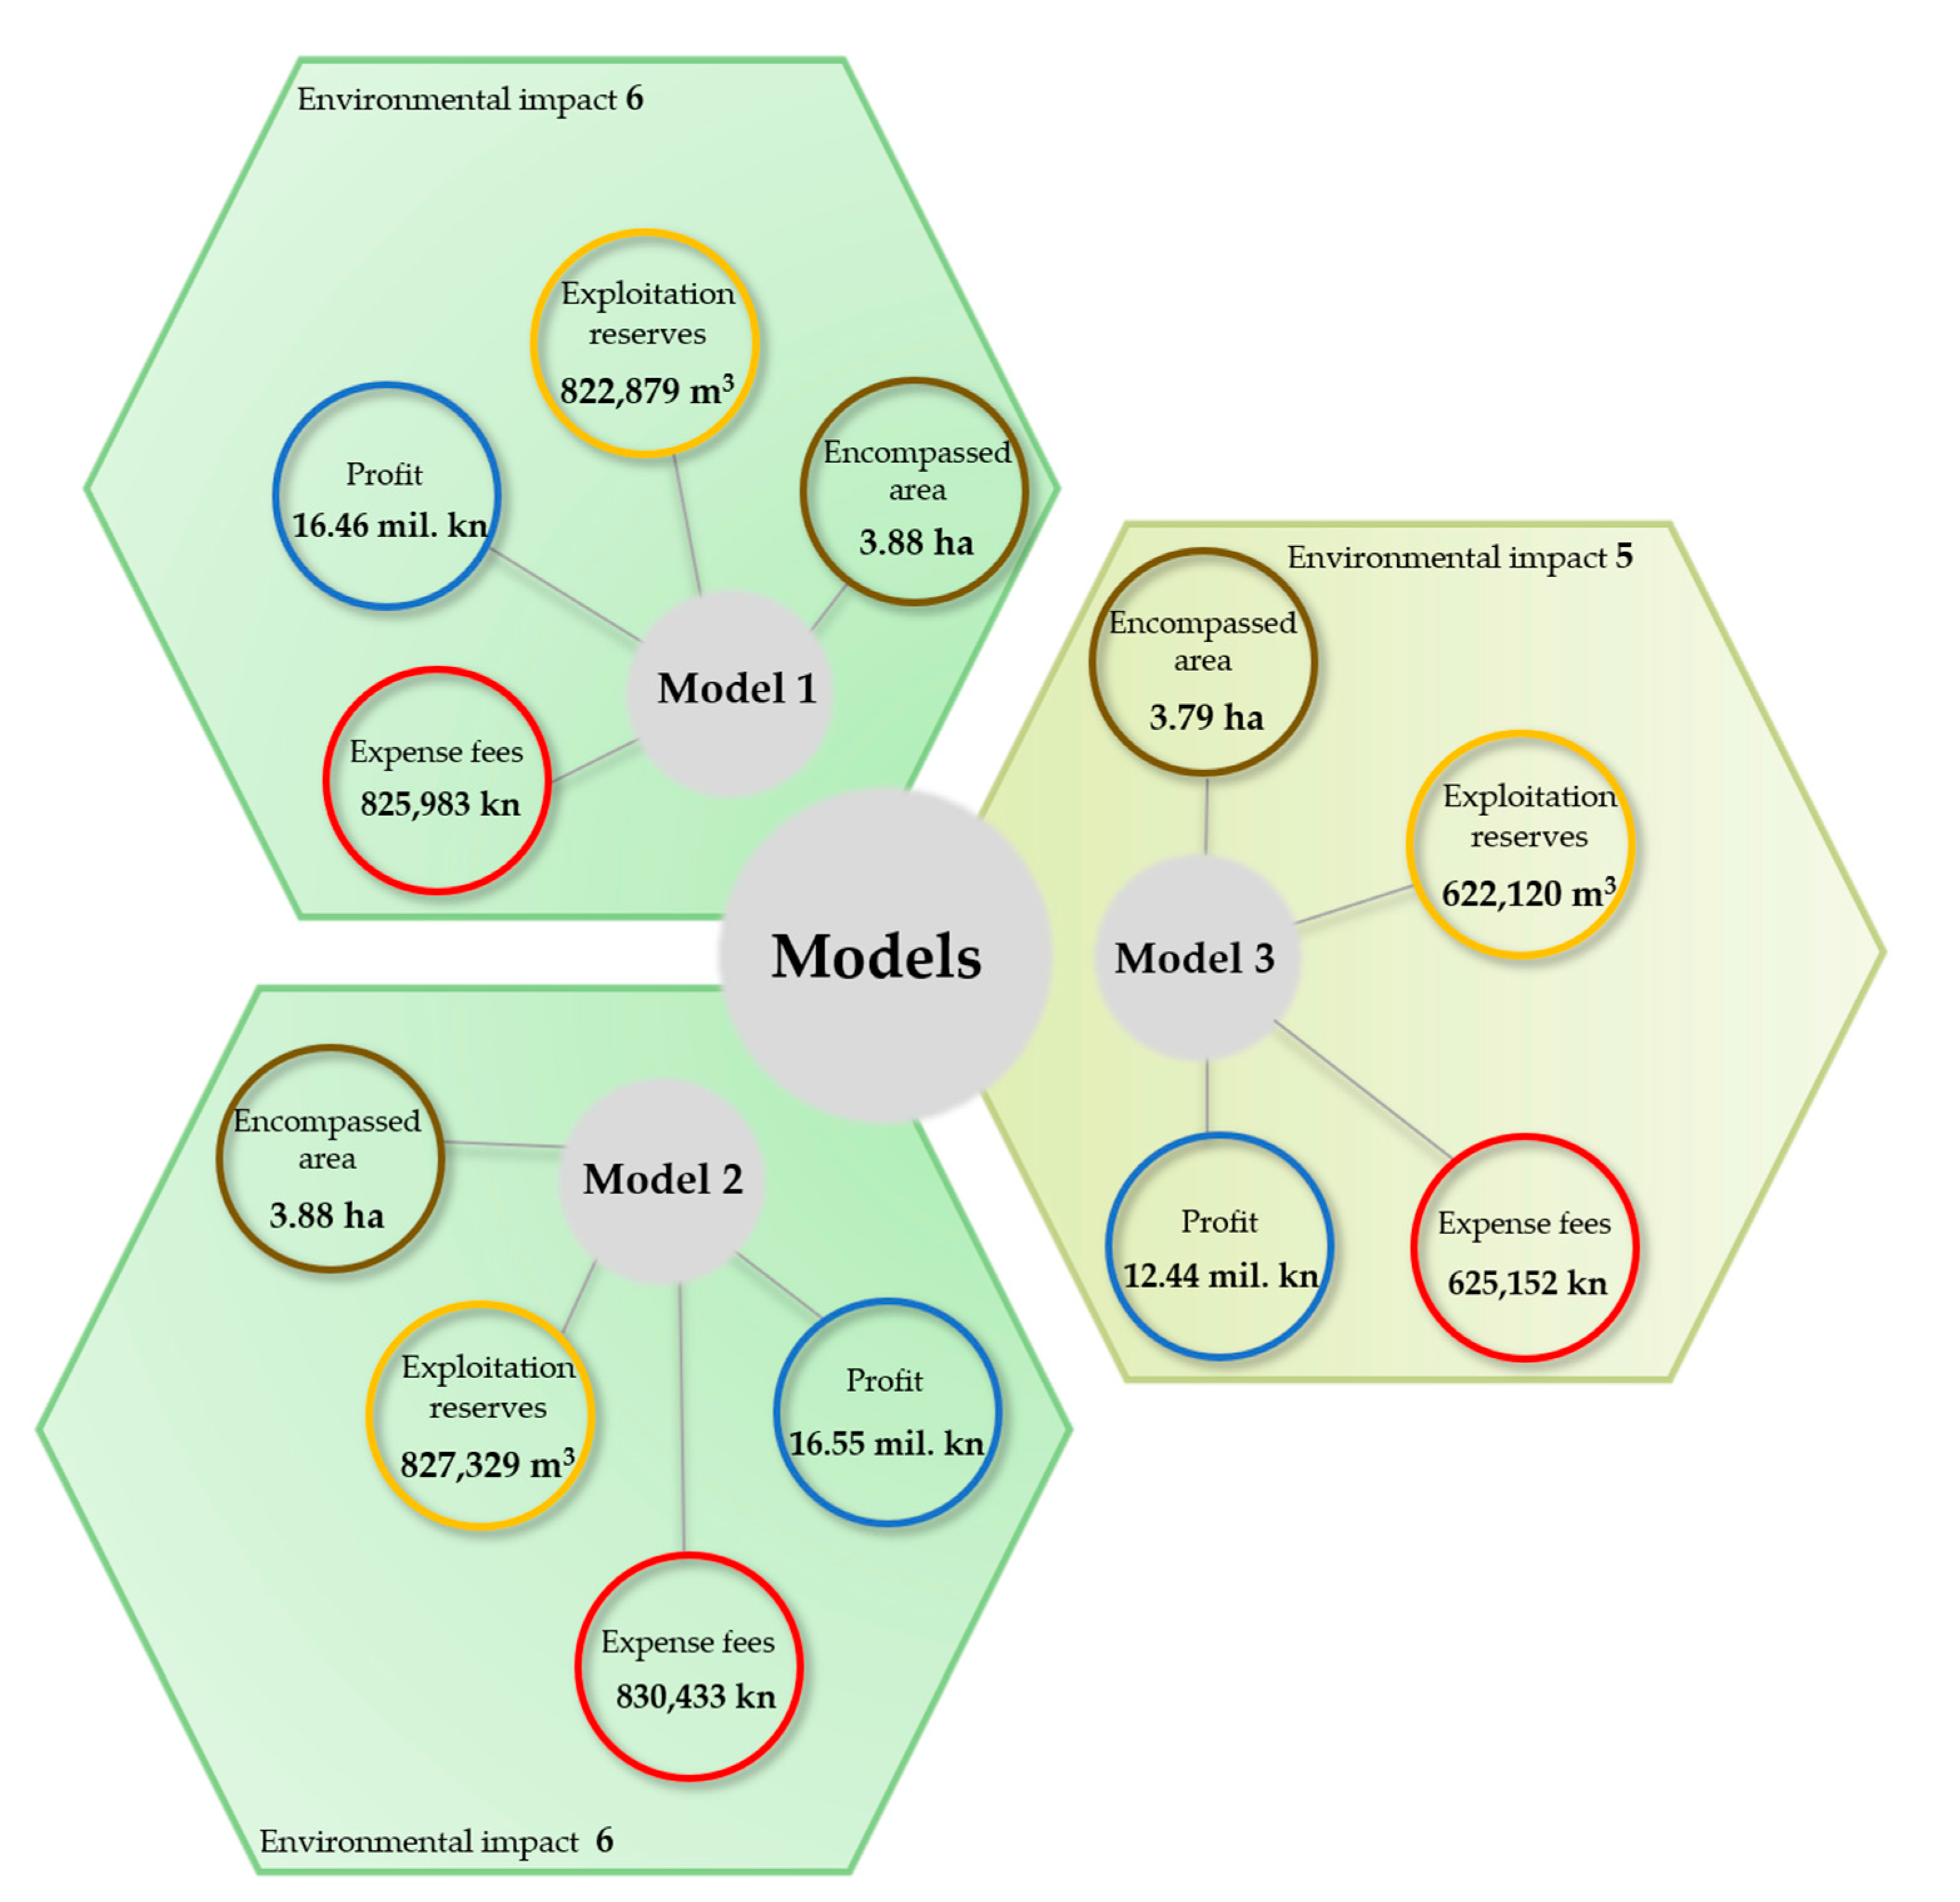
| Mineral deposit reserves | 5 | C6 | m3 max | 839,672 | 844,213 | 634,817 |
| C7 | m3 max | 507,177 | 500,038 | 553,694 | ||
| C8 | m3 max | 822,879 | 827,329 | 622,120 | ||
| Economic indicators | 16 | C9 | kn min | 16,457,578 | 16,546,579 | 12,442,405 |
| C10 | kn max | 3104 | 3104 | 3032 | ||
| C11 | kn min | 411,439 | 413,664 | 311,060 | ||
| C12 | kn min | 164,576 | 165,466 | 124,424 | ||
| C13 | kn min | 246,864 | 248,199 | 186,636 | ||
| Environmental impact | 27 | C14 | max | 4 | 3 | 6 |
| C15 | max | 5 | 6 | 7 | ||
| C16 | max | 4 | 4 | 5 | ||
| C17 | max | 6 | 6 | 7 | ||
| C18 | max | 6 | 6 | 6 | ||
| C19 | max | 4 | 3 | 6 | ||
| C20 | max | 3 | 3 | 5 | ||
| C21 | max | 5 | 5 | 6 | ||
| Property legal relations | 48 | C22 | yes/no | no | no | yes |
| Flow | Model 1 | Model 2 | Model 3 |
|---|---|---|---|
| ϕ− entering flow | 0.2509 | 0.2940 | 0.4043 |
| ϕ+ leaving flow | 0.2789 | 0.1924 | 0.4779 |
| Model | ϕ(a) | Final Ranking |
|---|---|---|
| Model 1 | 0.0280 | 2 |
| Model 2 | −0.1017 | 3 |
| Model 3 | 0.0737 | 1 |
Publisher’s Note: MDPI stays neutral with regard to jurisdictional claims in published maps and institutional affiliations. |
© 2021 by the authors. Licensee MDPI, Basel, Switzerland. This article is an open access article distributed under the terms and conditions of the Creative Commons Attribution (CC BY) license (https://creativecommons.org/licenses/by/4.0/).
Share and Cite
Farkaš, B.; Hrastov, A. Multi-Criteria Analysis for the Selection of the Optimal Mining Design Solution—A Case Study on Quarry “Tambura”. Energies 2021, 14, 3200. https://doi.org/10.3390/en14113200
Farkaš B, Hrastov A. Multi-Criteria Analysis for the Selection of the Optimal Mining Design Solution—A Case Study on Quarry “Tambura”. Energies. 2021; 14(11):3200. https://doi.org/10.3390/en14113200
Chicago/Turabian StyleFarkaš, Branimir, and Ana Hrastov. 2021. "Multi-Criteria Analysis for the Selection of the Optimal Mining Design Solution—A Case Study on Quarry “Tambura”" Energies 14, no. 11: 3200. https://doi.org/10.3390/en14113200
APA StyleFarkaš, B., & Hrastov, A. (2021). Multi-Criteria Analysis for the Selection of the Optimal Mining Design Solution—A Case Study on Quarry “Tambura”. Energies, 14(11), 3200. https://doi.org/10.3390/en14113200