Article

Precise Evaluation of Gas–Liquid Two-Phase Flow Pattern in a Narrow Rectangular Channel with Stereology Method

by
Maciej Masiukiewicz
and
Stanisław Anweiler
*
Department of Process and Environmental Engineering, Faculty of Mechanical Engineering, Opole University of Technology, ul. Mikołajczyka 5, 45-271 Opole, Poland
*
Author to whom correspondence should be addressed.
Energies 2021, 14(11), 3180; https://doi.org/10.3390/en14113180
Submission received: 29 March 2021 / Revised: 20 May 2021 / Accepted: 24 May 2021 / Published: 29 May 2021
(This article belongs to the Special Issue Multiphase Flows)

Abstract

:
The drive to increase the efficiency of processes based on two-phase flow demands the better precision and selection of boundary conditions in the process’ control. The two-phase flow pattern affects the phenomena of momentum, heat, and mass transfer. It becomes necessary to shift from its qualitative to quantitative evaluation. The description of the stationary structure has long been used in structural studies applied to metals and alloys. The description of a gas–liquid two-phase mixture is difficult because it changes in time and space. This paper presents a study of the precise determination of two-phase flow patterns based on stereological parameters analysis. The research area is shown against the flow map proposed by other researchers. The experiment was taken in the thin clear channel with dimensions of W = 50 × H = 1200 × T = 5 mm. The test method is based on the visualization of a two-phase air–water adiabatic flow pattern in the rectangular channel where superficial air velocities ranging from 0.006 to 0.044 m/s and the superficial water velocity ranged from 0.011 to 1.111 m/s. A high-speed camera was used for visualization. Images were analyzed with the use of stereological techniques. The study included the classification of structures according to generally accepted two-phase flow regime nomenclature for upwards co-current gas–liquid flow in a vertical rectangular channel. The result of the research was the determination of the stereological parameters’ changes with reference to the two-phase mixture flow hydrodynamics. The results were presented as waveform fluctuations in the values of stereological factors such as the volume fraction VV, interfacial surface SV, number of objects NV, mean chord l′m and the free distance λ. The description of how these parameters change with changes in phase fluxes is also presented. These waveforms help to distinguish the transient flow regimes, which allow for the automatic adjustment of the process stability. The authors found templates of the stereological parameters’ dependencies for flow pattern recognition. The research demonstrates wide possibilities of stereological methods’ application for the analysis of the two-phase gas–liquid process. The stereological model of two-phase pattern control enables the identification of process disorders.

Graphical Abstract

1. Introduction

Two-phase flows of liquid and gas are encountered, among others, where boiling, condensation, rapid pressure drop in the liquid, cavitation, hydraulic transport, and others occur. Hence, liquid and gas flow take place in many technical devices and systems in power generation, refrigeration, rocket technology, hydraulic transport, and other technical fields. The industry needs the high quality and performance of these devices and systems. This need, in turn, leads to a search for newer and improved methods to more accurately predict and control processes based on the flow of multiphase mixtures. The two-phase flow pattern in such devices has a major impact on the intensity of the heat and mass transfer process and the overall process stability, e.g., in the power generation industry, the uniformity of heating the water screen (the flame tubes) and the flow distribution of the forming two-phase mixture have an impact on boiler safety [1,2]. Sustainable development in the economy requires energy-saving abilities, along with a reduction in energy consumption, waste generation, and the use of raw materials. The enabling of waste recycling, waste energy recovery, and the rise in overall process efficiency in industries is also essential [3,4]. Industrial processes that meet these characteristics are now in high demand.
Interest in two-phase flows at a wide range of scales (especially mini- and micro-scale) has increased due to the possibility of using boiling liquids [5,6], i.e., liquid–vapor flows, in power systems or for cooling systems [7,8] of miniaturized integrated components in electronics, high-power lasers, compact heat exchangers with high flow rates, etc. [9,10]. This interest comes from the fact that in the boiling process, especially when the vapor phase content is low, the heat transfer coefficients are much higher than for single-phase flows which, until now, were commonly used in cooling systems. [11]. In addition, there is the aspect of the miniaturization of devices, and the possibility of running processes in parallel as well as in a continuous operation mode [12]. The global pursuit of sustainable development strengthens efforts to improve performance while reducing the size of all devices. Research on flow, boiling, and heat transfer in smaller-scale channels enables the utilization of latent heat of vaporization in their compact sizes. The ability to calculate the pressure drop or holdup increase for two-phase flows in channels with variable cross-sections and to determine changes in enthalpy, flow velocity, and other physical quantities, such as the distribution of the aridness and the volumetric content of the vapor phase, forms the basis for the design of piping systems, the construction of equipment and complex industrial apparatus [13]. These calculations are significantly different for the design of equipment at the macro scale, and the micro-scale. An example of this is the study of two-phase flow in minichannels, which are used in micro heat exchangers, and concerning the flow structures formed in them and the pressure drops of the two-phase fluid moving in such capillaries [14]. The evaluation of the two-phase flow regime with the identification of flow patterns and void fraction, in most cases, is carried out by visual observation of the two-phase mixture flowing in a transparent duct. In cases where visual observation is not possible, direct measurements are used using various types of probes placed inside the duct [15], or with the use of electrical capacitance tomography [16,17], gamma radiation [18], X-ray attenuation [19], and ultrasonic technology [20]. Another approach is to infer the type of structure based on, for example, measurements of the physical properties of the introduced phases and knowledge of the geometric dimensions of the apparatus [21,22] with the use of computer techniques, non-invasive measurements, and control of two-phase flow [23]. Additionally, image analysis [24,25,26] with numeric modeling [27,28,29] and the neuro-wavelet approach [30] are now commonly used. Currently, technology allows signals to be recorded at high frame rates, and the resulting data provide information about the dynamic characteristics of the entire process. This allows for stochastic analysis of the process [31].
In the past, it was believed that an increase in production was associated with an increase in the scale of industrial processes and equipment, and this was the prevailing trend worldwide. Today, this trend is reversed; miniaturization dominates, and devices are becoming more and more compact to achieve the largest possible heat transfer or phase contact area in a given volume. Microdevices are also easier to control, and the processes within them are more stable compared to macro-scale devices. Many of these processes use two-phase fluid flow moving through micrometer-scale channels. An example of research on developing rules to precisely control bubble formation in gas–liquid microfluidic devices (original: a microfluidic flow-focusing device) is the work [32], mixing/reaction in microchannel [33], cool electronic components [34], and molecular biological processes [35]. The most important issue in industrial processes is process control and safety. Systems using gas–liquid two-phase mixture flow have been widely used in many industries and establishing the flow regime (especially the pattern of the two-phase fluid) is essential to process operation. Due to the complexity of the two-phase mixture flow phenomenon, measurement of the parameters and features of the two-phase patterns is still a challenge [1,36]. There is a search for algorithms for flow structure reconstruction based on image analysis [37,38].
This research intends to develop and apply a new technique for two-phase flow visualization and control based on stereology science. Stereology enables the reconstruction of three-dimensional objects from their two-dimensional representations. With the use of a high frame rate camera and a common software, the proposed method is capable of achieving comparable accuracy to tomographic methods and provides a quantitative and qualitative valuation of the two-phase flow patterns [39,40]. With the experimental results in this paper, an attempt is made to prove an earlier hypothesis, which stated that the parameters of a gas–liquid two-phase flow pattern can be accurately measured through stereology. The contribution of this work is the evaluation of the two-phase flow pattern, which allows for a more accurate description of the flow regime and makes it possible to quantitatively measure the characteristics of the flow structure.

2. Flow Pattern Classification and Flow Maps

In process engineering calculations involving the flow of a two-phase mixture, the evaluation of the flow structure (two-phase flow pattern) is of fundamental importance. The type of the two-phase flow structure is one of the main parameters on which the mechanism of heat and momentum exchange depends [41]. Therefore, the question of structure prediction and, consequently, taking into account its influence on the flow-related phenomena, is one of the important engineering tasks [42].
The flow pattern of a gas–liquid mixture moving in a duct is the distribution of the concentration of the two phases, at a given place and time, involved in the occurring phenomenon. The formation of specific types of two-phase fluid flow pattern depends on various factors, which include: physicochemical properties of the phases (e.g., density, viscosity, surface tension, duct pressure), mass fluxes of the phases, geometrical conditions of the duct (e.g., size, shape, the position of the duct), properties of the materials used to construct the duct (e.g., roughness of the internal surfaces of the duct). The structure of a two-phase fluid may change with the length of the conduit through which the mixture flows, the change in direction of flow of a phase (e.g., upstream, downstream, countercurrent, co-current). It can occur naturally (e.g., by evaporation, condensation) or artificially as a result of both phases being fed into the conduit simultaneously.
Many researchers have dealt with the classification of two-phase fluid flow patterns, e.g., for upward co-current flow [2,41,42]. In general, the determination of the type of structure was made intuitively based on subjective visual observations, averaging the distribution of phase concentration over time and space. As a result, several structure types were identified, which eventually yielded the so-called basic classification of two-phase fluid patterns. For upward air–water co-current flow in a vertical channel: dispersed bubbles (DB), bubbles (B), plugs (P) or slugs (S), froth or foam (F), annular (A) and mist flow (M) [43,44]. However, this classification does not exhaust all the forms of structures and patterns that can form during the flow of a two-phase mixture. The subjectivity of the assessment and the multitude of observed types of structures make it difficult to compare the results obtained for the same type of channel, with the same orientation by different researchers.
As the hydrodynamic properties of a two-phase fluid change, there is a change in the flow pattern of that fluid, which means that it is possible to predict it from known parameters specific to that flow. Based on this observation, some researchers have produced a variety of diagrams named flow maps. These maps are graphical representations of the extent of each flow pattern type in the form of areas separated by boundary lines. However, the boundary lines are not explicitly defined, but only provide a rough boundary on the areas in which certain classical forms of fluid flow may occur (see Figure 1 and Figure 2).
Initially, these boundaries were determined almost exclusively based on experimental data, and an example of a modern study on identifying the two-phase flow pattern and determining a flow map for such a channel configuration is presented in [47]. With time, maps started to emerge from theoretical models. At present, the latter approach is dominant even though the simultaneous flow of non-mixing fluids is a much more complex problem than the flow mechanics of single-phase fluids. The description of macroscopic instability mechanisms occurring in two-phase flow systems is widely discussed in the work [48]. Examples of theoretical/analytical solutions are models based on an open-source finite element framework to model multiphase polydispersed flows for bubbling flow in microchannels [49], or the classical transient drift–flux model with simplifying equations that speed up calculations [50]. Due to the lack of a universally accepted coordinate system for flow maps, many authors use individual criteria and their classification of structures to create them.
This state of matters causes great problems with the systematization or selection of the proper map, and the structure assessment made on their basis covers only classical flow regimes. It is an insufficient approach for constantly rising precision requirements of designers and users of new industrial apparatus.

3. Problem Definition

The production systems (especially in mini-scale) require very well-defined features of the forming two-phase structure. Relying on information about the flow regime, and hence the structure, based on flow maps is not sufficient. Boundary lines determined either from models or observations separate the areas of occurrence of a given type of structure. Additionally, here the question arises: does it mean that in every point of this area the structure will be the same?
Due to the complexity of the two-phase fluid flow, researchers most often refer to flow models or flow maps in evaluating the observed pattern to assign and fit their observations to the classical nomenclature of flow regimes. This approach may not be sufficient for the development of increasingly precise devices in which the type of the two-phase flow structure produced has a major impact on the processes. Therefore, in addition to qualitative evaluation, accurate quantitative evaluation becomes more important. For this task, stereology is very well suited, which has been developed precisely for the quantitative evaluation of multiphase microstructure in materials. This evaluation is based on stereological parameters that enable its three-dimensional original to be statistically reproduced. In this study, stereological techniques were used to analyze flow structures whose extent was contained in uniform areas defined by the boundary lines of the presented flow maps. The study aimed to check whether there are differences in the two-phase flow patterns in the bubble pattern area of occurrence and if so, how big they are. The novelty is the precise determination of the hydrodynamic properties of the pattern and the possibility of matching them to the requirements of a given industrial process.
Since stereology of a two-phase flow allows not only qualitative but also quantitative assessment, we can quite accurately compare similar types of two-phase flow patterns. That is, we can identify differences for structures that are categorized as a given structure type from a common nomenclature and are contained within the area separated by boundary lines. These subtle differences in the structural features can be used to improve a particular process. It can be said that in this way, an additional detailed flow map can be created for a selected area of an existing map with specific boundary lines for a specific system or device.

4. Materials and Methods

To evaluate the structure of a gas–liquid two-phase fluid employing stereological techniques qualitatively and quantitatively, a system, shown in Figure 3, was used to produce gas–liquid mixtures. At the lower part of the system, there is a mixing chamber with a pinhole distributor in which the two phases (water and air) are mixed. The resulting mixture flows co-current vertically upward in a narrow, rectangular channel. The walls of the channel are transparent, which makes it possible to record the phenomenon. The mixture flows in a volume with the dimensions: width (W) = 0.05 m, thickness (T) = 0.005 m, height (H) = 1.2 m., as shown in Figure 4a. During the experiment, the gas velocity was changed in the range wG0 = 0.006–0.044 m/s, the liquid velocity in the range wL0 = 0.01–1.1 m/s.
The measured data were acquired using a high-speed imaging camera, which recorded the forming two-phase flow patterns in a transparent channel. The bright field technique, which is presented in Figure 4b, was used to visualize the phenomenon. The recorded data are a sequence of bitmap images that enable observations of the evolution of the two-phase flow over time. As shown in [39], the image that best characterizes the type of two-phase flow pattern is the one with the grey level value (GL) closest to the average calculated for the whole sequence. Such images were then digitally processed. This operation was aimed at the enhancement of image features, making it easier to distinguish individual phases of the mixture. The final step in the evaluation was the analysis by stereological techniques [51]. Stereology was originally developed for quantitative metallography. In these techniques, an image is examined by applying a test feature to the image, which can be in the form of a surface, a line, or a point. In the presented work, a linear test element was used to determine the phase composition of the relative volume VV using the linear method [52]. On the other hand, the directed secant method in combination with the linear method was used to determine the boundary surfaces of the interfacial relative surface SV. For the determination of the relative number of NV objects, the Saltykov inverse diameters method [53] was used. These methods have been adapted to digital image testing to speed up the process of two-phase flow pattern identification [54]. Image processing and analysis is a very important process for metallographic measurements [55], which can be successfully used analogously to measurements related to structure recognition of two-phase fluid flow. The idea of these techniques is shown in Figure 5.
The completed counts on the two-phase pattern image using the chord as a test element were used to determine five stereological parameters. Specific parameters for this case are: the volume fraction VV, the interfacial surface SV, the number of objects NV, the mean chord l′m, and the free distance λ. These are not all possible stereological parameters that can be determined from the image of the two-phase fluid structure, but such that allow it to be explicitly described and assigned to a general classification of two-phase flow patterns. The basic and most important, from the process point of view, flow parameters of multiphase mixtures are phase fractions and the size of the interfacial surface. Reaching accurate values of these parameters was the basic aim of stereological parameters selection. Among many stereological parameters, the chosen ones allowed us to reach the goal as quickly as possible. These parameters have been calculated using Equations (1)–(5).
The relative volume of convex shapes from the projection equation:
V V = A A l m t
Relative interfacial area of the closed body from the projection equation:
S V = 4 A A t
A number of closed bodies in the volume from the projection equation:
N V = N A t
The average length of chords for the projected objects equation:
l m = L L N L
Average free distance for convex shapes from the projection equation:
λ = t A A l m N L l m
The parameter VV is the volume fraction and is used to determine the relative volume of a given phase relative to the total volume of the mixture. The volume fraction is the percentage of a given component in a given volume. The VV parameter cannot determine the distribution of a given phase or the shape of the flow pattern. The following stereological parameters are used for this purpose. The SV parameter is the relative interfacial surface area per unit volume of the mixture expressed in m2/m3. The stereological method finds closed boundaries separating volumes of individual components of a two-phase mixture. The parameter NV is the number of particles in a given area and represents the number of bubbles or droplets per unit volume of the mixture, expressed in numbers of particles per m3 of the two-phase mixture. The mean chord l′m and mean free distance λ are structural parameters characterizing certain spatial features of the two-phase flow pattern; in this case, the sizes or distances between individual elements of the dispersed phase, such as bubbles or droplets. A more detailed description and definitions of the parameters used can be found in the paper [51]. A single parameter, although it can sufficiently describe some feature of a gas–liquid mixture (e.g., volume fraction VV—the proportion of gas in the mixture volume), is insufficient to identify the flow structure formed. For VV alone, we do not know, for example, how this gas is distributed in the mixture volume (shape and size of bubbles, their distribution in the channel volume). Further inference about the nature of the flow requires analysis of the values of a group of parameters. That is, the main advantage of the described method is the parameterization of the image of the flow structure of the two-phase fluid. This provides a starting point for an automatic system of the monitoring and control of such a phenomenon. Additionally, the information coming from the discussed five stereological parameters is sufficient because the key concept of the developed method is the parameterization of the flow pattern image, in the way to be comprehensible for the regulatory system, those 5 parameters support it.

5. Results

As previously written, data acquisition is a multi-step process. The first stage of research is the visualization of the phenomenon of two-phase fluid flow. The tests were planned in the bubbling flow regime area. The range of tests is presented in the form of points on the background of flow maps in Figure 6 and Figure 7. The liquid phase flux varied from 0.01 to 1.00 m3/h, while the gas phase flux from 0.005 to 0.04 m3/h.
As a result, digital images of the gas–liquid mixture pattern created inside the test channel were obtained, as shown in Figure 8. It clearly shows a diversity of structures even though, according to the flow maps shown earlier, the flow pattern is still within the parameters predicted for a bubbly structure. In a qualitative assessment, all these cases are within the bubbling regime, but in a quantitative assessment, the variation in hydrodynamic parameters can be significant, as shown later in this article.
In the second phase, secant scanning of the registered images was performed. As a result, chord lengths were obtained and assigned to the corresponding class intervals. The obtained results were then classified into the resolution series shown in Table 1.
Each set of secant and chord for a particular scan direction provides sufficient data for further analysis. However, due to the possibility of a structure with a partially linear orientation, scanning in two perpendicular directions was performed and then the acquired data were summed to increase the accuracy of the analysis. Table 2 shows an example of the summed data of the analyzed bubble structure.
In the third phase, the above data were used to determine the searched stereological parameters. As a result, for each image, a set of values characterizing a given structure were obtained. Determined values of stereological parameters used in this research, similarly to registered images, were set in matrices, each separately for a given parameter. In these matrices, the column represents the parameter values obtained for increasing liquid phase velocity wL0 and the row represents the parameter values obtained for increasing gas phase velocity wG0. Finally, all the determined values are summarized in Table 3.
To better illustrate the nature of stereological parameter changes depending on flow rates, let us show them in the form of planar graphs, as in Figure 9. These are qualitative diagrams, showing the topography of the changes that are to be used to obtain information about the control and regulation of the process.
As a result of the study, changes in the geometric characteristics of the objects forming the structure of the gas–liquid mixture were observed with a change in the flow parameters of both phases. For example, when considering the relationship between the determined structural parameters summarized in Table 3, between the point P1 and its immediate surroundings, we can analyze the transition from P1 to P2, P1 to P5, and P1 to P6, as shown in Figure 8.
For example, when the flow characteristics representing the transition from point P1 to P2 are changed, the following effects can be observed:
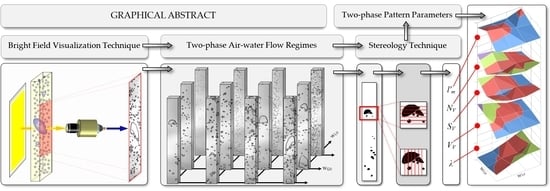
  • the gas volume fraction VV increases by 42%,
  • interfacial area SV increased by 150%,
  • the number of bubbles NV increased by 200%,
  • the mean bubble dimension l′m decreased by 45%
  • the average distance between bubbles λ decreased by 41%.
This means that a greater number of smaller bubbles appear in the structure with a simultaneous increase in VV, SV and NV. This is also evidenced by a decrease in the average bubble size l′m and the distance between the bubbles λ. Additionally, an increase in the volume fraction results in a decrease in the distance between bubbles in the mixture volume. Other structural changes are observed in the transition from P1 to P5. In this case, there is a simultaneous increase in SV and NV but a decrease in VV. This means that despite the fading of the gas phase, there has been a development of the interfacial surface. This indicates that the bubbles are more finely distributed and have a larger interfacial area. The appearance of more bubbles (an increase in NV at constant volume) resulted in a decrease in bubble size. Additionally, more abundant bubbles in the same volume must have smaller distances between them (decrease in λ).
As can be seen, these are directly measurable parameters and once appropriate algorithms are developed, these can be measured in real-time and used for process control. For example, when looking for the best structural features, e.g., a very developed interfacial surface and a large volume share, which promotes turbulence in the process and the acceleration of contact reactions, it is clear from the four points considered that it will be the structure that has established at P2 or P6 that best meets the requirements.

6. Conclusions

With the experimental results in this paper, an attempt is made to prove an earlier hypothesis, which stated that the parameters of a gas–liquid two-phase flow pattern can be accurately measured through stereology. As a result of the research, the authors found dependency patterns of stereological parameters for flow pattern recognition. These patterns in future research will provide information for controlling gas–liquid two-phase flow. The paper demonstrates the broad applicability of stereological methods to analyze the gas–liquid two-phase process.
Using stereological techniques adapted for the identification and structure assessment of gas–liquid two-phase mixtures, five parameters were determined that are important for the analysis of two-phase fluid flow. These are volume fraction VV, interfacial area SV, number of objects NV, mean chord l′m and free distance λ. Only by analyzing the entire set of parameters can the flow patterns be properly interpreted and evaluated.
For better illustration, an analogous plane plot was created for each parameter, mapping its variation against changes in gas and liquid velocities.
Comparing the sets of five parameters for consecutive structures in this area, we do not observe, as could be expected, a uniform trend, e.g., ascending or descending in the direction of the boundary line, of the values for the individual parameters. On the other hand, some kind of disturbance of this trend in the direction perpendicular to the boundary line was observed. This is particularly evident for structures that formed at liquid phase velocity wL0 = 0.11 m/s. The parameter values for these structures are either smaller (e.g., for the parameter λ, SV, NV) or larger (e.g., for the parameter l′m) than their neighbors, which is observed as a valley or a hill on the planar diagrams. The shape of the planar graphs thus shows potential for identifying the causes of instability.
It is seen that even in a uniform region of bubble structure, the method is very sensitive and shows subtle changes that occur between parameters characterizing the two-phase structure when the liquid or gas phase velocity changes. By mapping the entire two-phase flow region with a set of proposed parameters within which a process is carried out, we can fully control it. This information is also important for the automatic control and monitoring of the process, as it allows an accurate determination of the flow conditions.
The contribution of this work is the evaluation of the two-phase flow pattern, which allows for a more accurate description of the flow regime and makes it possible to quantitatively measure the characteristics of the flow structure.
The design of processes using two-phase fluid flows is based on the use of a specific flow structure. The structure with the most desirable parameters for the process (such as an appropriately sized interfacial area) has priority for the process. Any deviation is undesirable. Stereological parameters can measure the details of the structure, which makes it possible, for example, through feedback with the control and measuring equipment, to react quickly and return to the optimal value of a specific parameter, which makes it possible to increase the efficiency. Although the process is generally in the bubble regime, it can still be optimized just by using subtle changes in the stereological parameters.

Author Contributions

Conceptualization and methodology, M.M.; validation, M.M., S.A.; formal analysis, investigation and resources M.M.; data curation, M.M.; writing—original draft preparation, M.M.; writing—review and editing, S.A.; visualization, supervision and project administration, S.A. All authors have read and agreed to the published version of the manuscript.

Funding

This research received no external funding.

Conflicts of Interest

The authors declare no conflict of interest.

References

  1. Pang, L.; Yi, S.; Duan, L.; Li, W.; Yang, Y. Thermal stress and cyclic stress analysis of a verticalwater-cooledwall at a utility boiler under flexible operation. Energies 2019, 12, 1170. [Google Scholar] [CrossRef] [Green Version]
  2. Oya, T. Upward Liquid Flow in a Small Tube into which Air Streams: 3rd Report, Pipe Friction I. Bull. JSME 1972, 15, 1522–1533. [Google Scholar] [CrossRef] [Green Version]
  3. Mikulčić, H.; Duić, N.; Dewil, R. Environmental management as a pillar for sustainable development. J. Environ. Manag. 2017, 203, 867–871. [Google Scholar] [CrossRef]
  4. Nicklin, D.J.; Wilkes, J.O.; Davidson, J.F. Two-phase flow in vertical tubes. Trans. Inst. Chem. Eng. 1962, 40, 61–68. [Google Scholar]
  5. Zaborowska, I.; Grzybowski, H.; Rafałko, G.; Mosdorf, R. Boiling dynamics in parallel minichannel system with different inlet solutions. Int. J. Heat Mass Transf. 2021, 165, 120655. [Google Scholar] [CrossRef]
  6. Tian, Z.; Gu, B.; Zhang, Y.; Gao, W. Flow boiling heat transfer under marine motions: A comprehensive review. Ann. Nucl. Energy 2020, 143, 107455. [Google Scholar] [CrossRef]
  7. Sikora, M.; Bohdal, T. Heat and flow investigation of NOVEC649 refrigerant condensation in pipe minichannels. Energy 2020, 209, 118447. [Google Scholar] [CrossRef]
  8. Bohdal, T.; Charun, H.; Sikora, M. Pressure drop during condensation of refrigerants in pipe minichannels. Arch. Thermodyn. 2012, 33, 87–106. [Google Scholar] [CrossRef]
  9. Barreto, E.X.; Oliveira, J.L.G.; Passos, J.C. Analysis of air-water flow pattern in parallel microchannels: A visualization study. Exp. Therm. Fluid Sci. 2015, 63, 1–8. [Google Scholar] [CrossRef]
  10. Kim, B.J.; Sohn, B.H.; Jeong, S. Two-phase flow regimes for counter-current air-water flows in narrow rectangular channels. KSME Int. J. 2001, 15, 941–950. [Google Scholar] [CrossRef]
  11. Gregorc, J.; Žun, I. Inlet conditions effect on bubble to slug flow transition in mini-channels. Chem. Eng. Sci. 2013, 102, 106–120. [Google Scholar] [CrossRef]
  12. Pecherkin, N.; Chekhovich, V. Mass Transfer in Two-Phase Gas-Liquid Flow in a Tube and in Channels of Complex Configuration. In Mass Transfer in Multiphase Systems and Its Applications; InTech Open: London, UK, 2011. [Google Scholar]
  13. Mohmmed, A.O.; Al-Kayiem, H.H.; Osman, A.B.; Sabir, O. One-way coupled fluid–structure interaction of gas–liquid slug flow in a horizontal pipe: Experiments and simulations. J. Fluids Struct. 2020, 97, 103083. [Google Scholar] [CrossRef]
  14. Ide, H.; Kariyasaki, A.; Fukano, T. Fundamental data on the gas–liquid two-phase flow in minichannels. Int. J. Therm. Sci. 2007, 46, 519–530. [Google Scholar] [CrossRef]
  15. Xu, J.; Liu, F.; Xiao, Q.; Huang, J.; Fei, Y.; Yang, Y.; Zhai, Y.; Pan, J.; Wang, H. Synergistic effect of flow pattern evolution of dispersed and continuous phases in direct-contact heat transfer process. Int. J. Refrig. 2020, 112, 201–214. [Google Scholar] [CrossRef]
  16. Almutairi, Z.; Al-Alweet, F.M.; Alghamdi, Y.A.; Almisned, O.A.; Alothman, O.Y. Investigating the characteristics of two-phase flow using electrical capacitance tomography (ECT) for three pipe orientations. Processes 2020, 8, 51. [Google Scholar] [CrossRef] [Green Version]
  17. Xu, Z.; Wu, F.; Yang, X.; Li, Y. Measurement of gas-oil two-phase flow patterns by using CNN algorithm based on dual ECT sensors with venturi tube. Sensors 2020, 20, 1200. [Google Scholar] [CrossRef] [PubMed] [Green Version]
  18. Roshani, M.; Phan, G.T.T.; Jammal Muhammad Ali, P.; Hossein Roshani, G.; Hanus, R.; Duong, T.; Corniani, E.; Nazemi, E.; Mostafa Kalmoun, E. Evaluation of flow pattern recognition and void fraction measurement in two phase flow independent of oil pipeline’s scale layer thickness. Alex. Eng. J. 2021, 60, 1955–1966. [Google Scholar] [CrossRef]
  19. Roshani, M.; Phan, G.; Hossein Roshani, G.; Hanus, R.; Nazemi, B.; Corniani, E.; Nazemi, E. Combination of X-ray tube and GMDH neural network as a nondestructive and potential technique for measuring characteristics of gas-oil–water three phase flows. Meas. J. Int. Meas. Confed. 2021, 168, 108427. [Google Scholar] [CrossRef]
  20. Fang, L.; Zeng, Q.; Wang, F.; Faraj, Y.; Zhao, Y.; Lang, Y.; Wei, Z. Identification of two-phase flow regime using ultrasonic phased array. Flow Meas. Instrum. 2020, 72, 101726. [Google Scholar] [CrossRef]
  21. Troniewski, L.; Ulbrich, R. The analysis of flow regime maps of two-phase gas-liquid flow in pipes. Chem. Eng. Sci. 1984, 39, 1213–1224. [Google Scholar] [CrossRef]
  22. Mosdorf, R.; Górski, G. Identification of two-phase flow patterns in minichannel based on RQA and PCA analysis. Int. J. Heat Mass Transf. 2016, 96, 64–74. [Google Scholar] [CrossRef]
  23. Wajman, R. Computer methods for non-invasive measurement and control of two-phase flows: A review study. Inf. Technol. Control 2019, 48, 464–486. [Google Scholar] [CrossRef] [Green Version]
  24. Sikora, M.; Bohdal, T. Application of computer image analyzes in the investigation of refrigerants condensation in minichannels. Arch. Thermodyn. 2019, 40, 103–114. [Google Scholar]
  25. Ligus, G.; Zajac, D.; Masiukiewicz, M.; Anweiler, S. A new method of selecting the airlift pump optimum efficiency at low submergence ratios with the use of image analysis. Energies 2019, 12, 735. [Google Scholar] [CrossRef] [Green Version]
  26. Anweiler, S.; Szmolke, N. Analiza struktury przepŁywu mieszaniny gaz-ciaŁo staŁe z wykorzystaniem cyfrowej metody rozpoznawania obrazu. Inz. Chem. Proces. 2001, 22, 187–192. [Google Scholar]
  27. Wasilewski, M.; Anweiler, S.; Masiukiewicz, M. Characterization of multiphase gas–solid flow and accuracy of turbulence models for lower stage cyclones used in suspension preheaters. Chin. J. Chem. Eng. 2019, 27, 1618–1629. [Google Scholar] [CrossRef]
  28. Ligus, G.; Wasilewski, M.; Kołodziej, S.; Zając, D. CFD and PIV Investigation of a Liquid Flow Maldistribution across a Tube Bundle in the Shell-and-Tube Heat Exchanger with Segmental Baffles. Energies 2020, 13, 5150. [Google Scholar] [CrossRef]
  29. Gogolin, A.; Wasilewski, M.; Ligus, G.; Wojciechowski, S.; Gapinski, B.; Krolczyk, J.B.; Zajac, D.; Krolczyk, G.M. Influence of geometry and surface morphology of the U-tube on the fluid flow in the range of various velocities. Meas. J. Int. Meas. Confed. 2020, 164, 108094. [Google Scholar] [CrossRef]
  30. Sunde, C.; Avdic, S.; Pázsit, I. Classification of two-phase flow regimes via image analysis and a neuro-wavelet approach. Prog. Nucl. Energy 2005, 46, 348–358. [Google Scholar] [CrossRef]
  31. Ulbrich, R.; Krótkiewicz, M.; Szmolke, N.; Anweiler, S.; Masiukiewicz, M.; Zajac, D. Recognition of two-phase flow patterns with the use of dynamic image analysis. Proc. Inst. Mech. Eng. Part. E J. Process. Mech. Eng. 2002, 216, 227–234. [Google Scholar] [CrossRef]
  32. Fu, T.; Ma, Y.; Funfschilling, D.; Li, H.Z. Bubble formation and breakup mechanism in a microfluidic flow-focusing device. Chem. Eng. Sci. 2009, 64, 2392–2400. [Google Scholar] [CrossRef]
  33. Yue, J.; Chen, G.; Yuan, Q.; Luo, L.; Gonthier, Y. Hydrodynamics and mass transfer characteristics in gas-liquid flow through a rectangular microchannel. Chem. Eng. Sci. 2007, 62, 2096–2108. [Google Scholar] [CrossRef]
  34. Dang, M.; Hassan, I.; Muwanga, R. Adiabatic two phase flow distribution and visualization in scaled microchannel heat sinks. Exp. Fluids 2007, 43, 873–885. [Google Scholar] [CrossRef]
  35. Vázquez Blanco, M.; Grosso, O.; Bellido, C.A.; Iavícoli, O.R.; Berensztein, C.S.; Ruda Vega, H.; Lerman, J. Effect of flow on complex biological macromolecules in microfluidic devices. Biomed. Microdevices 2001, 3, 225–238. [Google Scholar]
  36. Liang, F.; Sun, Y.; Yang, G.Y.; Song, L. Gas-liquid two-phase flow rate measurement with a multi-nozzle sampling method. Exp. Therm. Fluid Sci. 2015, 68, 82–88. [Google Scholar] [CrossRef]
  37. Fu, Y.; Liu, Y. Development of a robust image processing technique for bubbly flow measurement in a narrow rectangular channel. Int. J. Multiph. Flow 2016, 84, 217–228. [Google Scholar] [CrossRef]
  38. Amoresano, A.; Langella, G.; Di Santo, M.; Iodice, P. Advanced Imaging Techniques for Multiphase Flows Analysis. J. Phys. Conf. Ser. 2017, 882. [Google Scholar] [CrossRef]
  39. Masiukiewicz, M.; Anweiler, S. Two-phase flow structure assessment based on dynamic image analysis. Flow Meas. Instrum. 2019, 65, 195–202. [Google Scholar] [CrossRef]
  40. Anweiler, S.; Masiukiewicz, M. Application of stereology for two-phase flow structure validation in fluidized bed reactors. Therm. Sci. 2016, 20, 1199–1208. [Google Scholar] [CrossRef] [Green Version]
  41. Hughes, D.W. Two-Phase Flow and Heat Transfer; Butterworth, D., Hewitt, G.F., Eds.; Harwell Series; Oxford University Press: Oxford, UK, 1977; p. 514. [Google Scholar]
  42. Andruszkiewicz, A.; Hans-Dieter, S. Ultrasonic measurements of flow in two-phase liquid-gas systems. Part I, The method for measurements. Chem. Process. Eng. 2008, 29, 113–128. [Google Scholar]
  43. De Castro Teixeira Carvalho, F.; de Melo Freire Figueiredo, M.; Serpa, A.L. Flow pattern classification in liquid-gas flows using flow-induced vibration. Exp. Therm. Fluid Sci. 2020, 112, 109950. [Google Scholar] [CrossRef]
  44. Shanthi, C.; Pappa, N. An artificial intelligence based improved classification of two-phase flow patterns with feature extracted from acquired images. ISA Trans. 2017, 68, 425–432. [Google Scholar] [CrossRef] [PubMed]
  45. Taitel, Y.; Bornea, D.; Dukler, A.E. Modelling flow pattern transitions for steady upward gas-liquid flow in vertical tubes. AIChE J. 1980, 26, 345–354. [Google Scholar] [CrossRef]
  46. Kaichiro, M.; Ishii, M. Flow regime transition criteria for upward two-phase flow in vertical tubes. Int. J. Heat Mass Transf. 1984, 27, 723–737. [Google Scholar] [CrossRef]
  47. Pietrzak, M. Flow patterns and volume fractions of phases during liquid-liquid two-phase flow in pipe bends. Exp. Therm. Fluid Sci. 2014, 54, 247–258. [Google Scholar] [CrossRef]
  48. Ruspini, L.C.; Marcel, C.P.; Clausse, A. Two-phase flow instabilities: A review. Int. J. Heat Mass Transf. 2014, 71, 521–548. [Google Scholar] [CrossRef]
  49. Bhutani, G.; Brito-Parada, P.R.; Cilliers, J.J. Polydispersed flow modelling using population balances in an adaptive mesh finite element framework. Comput. Chem. Eng. 2016, 87, 208–225. [Google Scholar] [CrossRef] [Green Version]
  50. Aarsnes, U.J.F.; Ambrus, A.; Di Meglio, F.; Karimi Vajargah, A.; Morten Aamo, O.; Van Oort, E. A simplified two-phase flow model using a quasi-equilibrium momentum balance. Int. J. Multiph. Flow 2016, 83, 77–85. [Google Scholar] [CrossRef]
  51. Masiukiewicz, M.; Anweiler, S. Two-phase flow phenomena assessment in minichannels for compact heat exchangers using image analysis methods. Energy Convers. Manag. 2015, 104, 44–54. [Google Scholar] [CrossRef]
  52. Underwood, E.E. Quantitative Stereology for Microstructural Analysis. In Microstructural Analysis; Springer: Boston, MA, USA, 1973; pp. 35–66. [Google Scholar]
  53. Ondracek, G. Key position of stereology in quantitative microstructure-correlations of multiphase materials. Acta Stereol. 1982, 1, 5–21. [Google Scholar]
  54. Wojnar, L. Image Analysis: Applications in Materials Engineering, 1st ed.; CRC Press: Boca Raton, FL, USA, 1998; ISBN 9780849382260. [Google Scholar]
  55. Gupta, S.; Sarkar, J.; Kundu, M.; Bandyopadhyay, N.R.; Ganguly, S. Automatic recognition of SEM microstructure and phases of steel using LBP and random decision forest operator. Meas. J. Int. Meas. Confed. 2020, 151, 107224. [Google Scholar] [CrossRef]
Figure 1. Two-phase flow map according to Titel [45] for vertical pipe with the areas of flow patterns indicated.
Energies 14 03180 g001
Figure 2. Two-phase flow map according to Mishima and Ishii [46] for the narrow vertical rectangular channel with the areas of flow patterns indicated.
Energies 14 03180 g002
Figure 3. Schematic view of the measurement setup with the air/water inlet, air/water mixing chamber, rectangular measurement channel, air/water separator.
Energies 14 03180 g003
Figure 4. (a) Flow channel dimensions (a); bright field measurement technique diagram (b).
Energies 14 03180 g004
Figure 5. The idea of the measurement with the stereological technique—presentation of the linear method.
Energies 14 03180 g005
Figure 6. Two-phase flow map according to Titel for vertical pipe with the research area shown (red dots).
Energies 14 03180 g006
Figure 7. Two-phase flow map according to Mishima and Ishii for the narrow vertical rectangular channel with the research area shown (red dots).
Energies 14 03180 g007
Figure 8. An ordered matrix of recorded images of two-phase flow patterns; the increment in gas phase velocity wG0 is left to right, and the increment in liquid phase velocity wL0 is from front to back.
Energies 14 03180 g008
Figure 9. Plane graph of the variability of stereological parameters depending on phase velocity.
Energies 14 03180 g009
Table 1. A set of chords obtained by vertical secant object scanning (1024 pixels) in projection image.
Class Interval of Chord Lengths (Vertical)1–34–67–910–1213–1516–1819–2122–2425–2728–30Total
Class No.12345678910
Midpoint of the class li25811141720232629
Count ni55121152209250127432545991
Calculated chord length ni′ li110605121622993500215986057510414511,573
Actual chord length108621123323183521211485456810514211,584
Table 2. Summary values obtained from vertical and horizontal image scan data.
Image Scanning ParameterSymbolValueUnit
total length of secants in the projectionL′303,104pixels
total length of the secants on the cross-sectionL354,291pixels
total number of chords obtained from the projectionn′c1880pcs.
total number of chords obtained from the sectionnc7609pcs.
total length of the chords obtained from the projectionΣ′nili23,161pixels
total length of the chords obtained from the sectionΣnili119,540pixels
Table 3. Matrix of the stereological parameters for analyzed flow rates.
Stereological ParameterwL0 (m/s)wG0 (m/s)
0.00560.01110.02220.0444
volume fraction VV (%)0.01113.85.411.916.7
0.11113.36.67.514.1
1.11110.20.20.30.6
interfacial surface SV (m2/m3)0.011142.7107.0213.7256.9
0.111176.2106.675.8125.6
1.1111157.3121.8150.0233.9
number of objects NV (pcs/dm3)0.0111267.4802.71574.61822.5
0.1111579.5761.3445.0678.4
1.11111427.61071.41304.01979.3
mean chord l′m (m)0.01110.00600.00330.00360.0041
0.11110.00320.00400.00700.0085
1.11110.00100.00140.00150.0018
free distance λ (m)0.01110.12050.07080.03130.0223
0.11110.10580.06120.05910.0298
1.11110.13730.13650.10170.0553
Publisher’s Note: MDPI stays neutral with regard to jurisdictional claims in published maps and institutional affiliations.

