1. Introduction
With the increasingly stringent regulations on fuel consumption and emissions in various countries, hybrid electric vehicles (HEVs) have been widely studied due to their high efficiency and low emission characteristics [
1,
2]. HEVs can run in different operating modes according to driving requirements and system status to achieve the required target performance [
3]. In the process of switching from the pure electric mode to the hybrid mode, the battery power must meet two tasks, namely, driving the vehicle and starting the engine. When the battery power is not enough to meet the acceleration demand at the next moment, the engine starting may lead to the reduction of driving power, which will deteriorate the drivability.
Many scholars and companies have conducted extensive research on engine start control. In order to meet the engine start time requirements, Zhao et al. [
4] determined the integrated starter generator (
ISG) open-loop control torque target value according to the engine resistance torque. Liu et al. [
5] designed a six-stage coordinated control strategy to make the engine start quickly and smoothly. During the engine speed increase phase, the motor provides both driving torque and additional torque to overcome engine resistance. When the engine speed reaches the ignition speed, it provides driving torque, and at the same time, the motor torque decreases. Zeng et al. [
6] used the model predictive control algorithm to optimize the control of each phase of the mode switching so that the engine can start quickly and the system output torque changes steadily. Zhuang et al. [
7] proposed an engine start control strategy based on different driving power demand. Taking into account the power limit of the driving motor, the engine start time is sacrificed to meet the driving power demand.
The above research mainly focuses on the engine start control strategy, without considering the influence of battery power limitation. Insufficient battery power will reduce the effectiveness of the engine start control strategy and inhibit vehicle acceleration [
8]. At a lower battery state of charge (
SOC) and ambient temperature, the peak discharge power of the battery will drop significantly. During switching the operating mode from the pure electric mode to the hybrid mode, the battery discharge power request may exceed the normal operating range, which will shorten the battery life [
9,
10]. Moreover, battery durability issues will increase the total cost of ownership of electric vehicles [
11,
12]. Therefore, battery management systems (BMS) that limit over-discharge power have been developed [
13]. However, the limitation imposed by BMS on the battery request power through the proportional-integral (
PI) controller will result in a reduction in the driving power [
14]. Su et al. [
15] simulated the impact of battery power limitation on the dynamic response characteristics of the engine starting process. The simulation results show that the torque output fluctuation of the drive system increases significantly because the compensation ability of the motor torque is limited by the battery discharge power.
If the pure electric mode can be exited before the discharge power of the battery reaches the limit, the effect of the engine start on the acceleration response of the vehicle can be avoided. Therefore, the mode selection strategy should switch the target mode at the appropriate time. Most of the existing research on the mode selection strategy is based on the optimal instantaneous system efficiency or the smallest instantaneous equivalent fuel consumption [
16,
17,
18,
19], however, its impact on the mode switching process has received less attention. The mode selection strategy using the logic thresholds method has considered battery power effects, but it is difficult to adapt to complex driving conditions and road conditions [
20]. Based on the above problems, the main objective of this research is to propose an adaptive mode selection strategy based on variable power reserve, which comprehensively considers the economy and drivability. Considering different acceleration requests, the weight of economy and drivability is adjusted in real-time, and the comprehensive performance is real-time evaluation to determine the target mode.
The main contribution of the proposed strategy is that it guarantees the driver’s power demand, accelerates the engine power response, and achieves the best performance with considering the battery power limit.
2. HEV Model
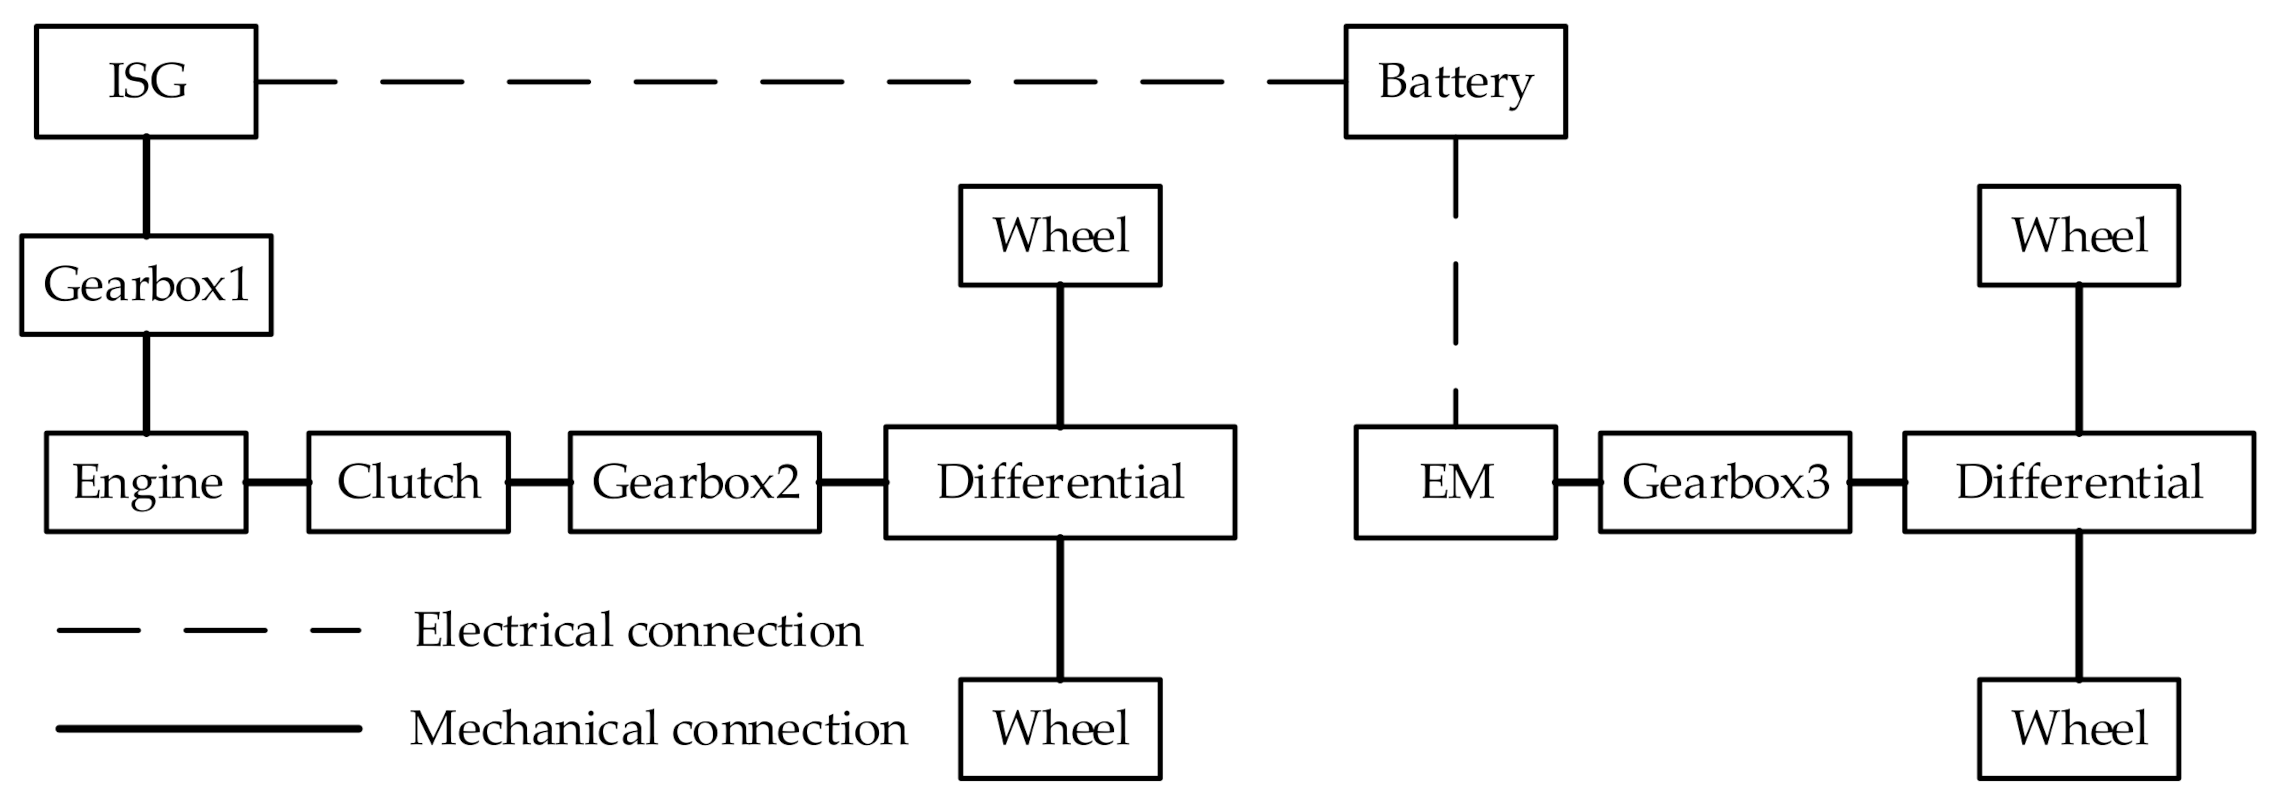
The series-parallel HEV powertrain consists of an engine, clutch,
ISG, electric motor (
EM), battery, and three fixed-ratio gearboxes, as shown in
Figure 1. The major components’ parameters of the HEV are listed in
Table 1.
ISG is used to start the engine, adjust engine speed and generate electricity, and the clutch is used to disconnect the mechanical connection between the engine and the wheels. When the vehicle is driving, HEV has three operating modes:
Pure electric mode: engine turned off, clutch disconnected, vehicle driven by EM
Series mode: engine running, clutch disconnected, the electric power of the EM provided by the battery and ISG
Parallel mode: engine running, clutch closed, vehicle driven by the engine and EM together
To evaluate the performance of the proposed mode selection strategy, the HEV is modeled as follows.
2.1. Engine Model
Figure 2 shows the engine model, which is comprised of three components: maximum/minimum torque curve, engine map, and first-order transfer function. The inputs are engine speed, engine torque command and fuel injection enable command. The outputs consist of engine torque and fuel consumption rate.
As shown in
Figure 3, the fuel consumption rate is obtained using engine map as a function of the engine speed and torque.
where,
Teng is engine output torque,
neng is engine speed,
is engine fuel consumption rate.
The maximum/minimum torque curve ensures that the output torque does not exceed the limits of the engine. According to Ref. [
21], a first-order transfer function is used to represent the output response of the engine torque,
where,
Tengcmd is engine torque command,
τ is time constant.
2.2. Motor Model
The modeling approach of the motor is similar to that of the engine, which is based on maps of torque and efficiency.
Figure 4 shows the efficiency map of EM and
ISG. The model inputs are motor torque command and motor speed, the outputs consist of motor torque and electric power.
A motor can work in traction mode and power generation mode. The motor power is calculated by
where,
Tmot and
nmot is the torque and speed,
ηmot is the motor efficiency.
2.3. Battery Model
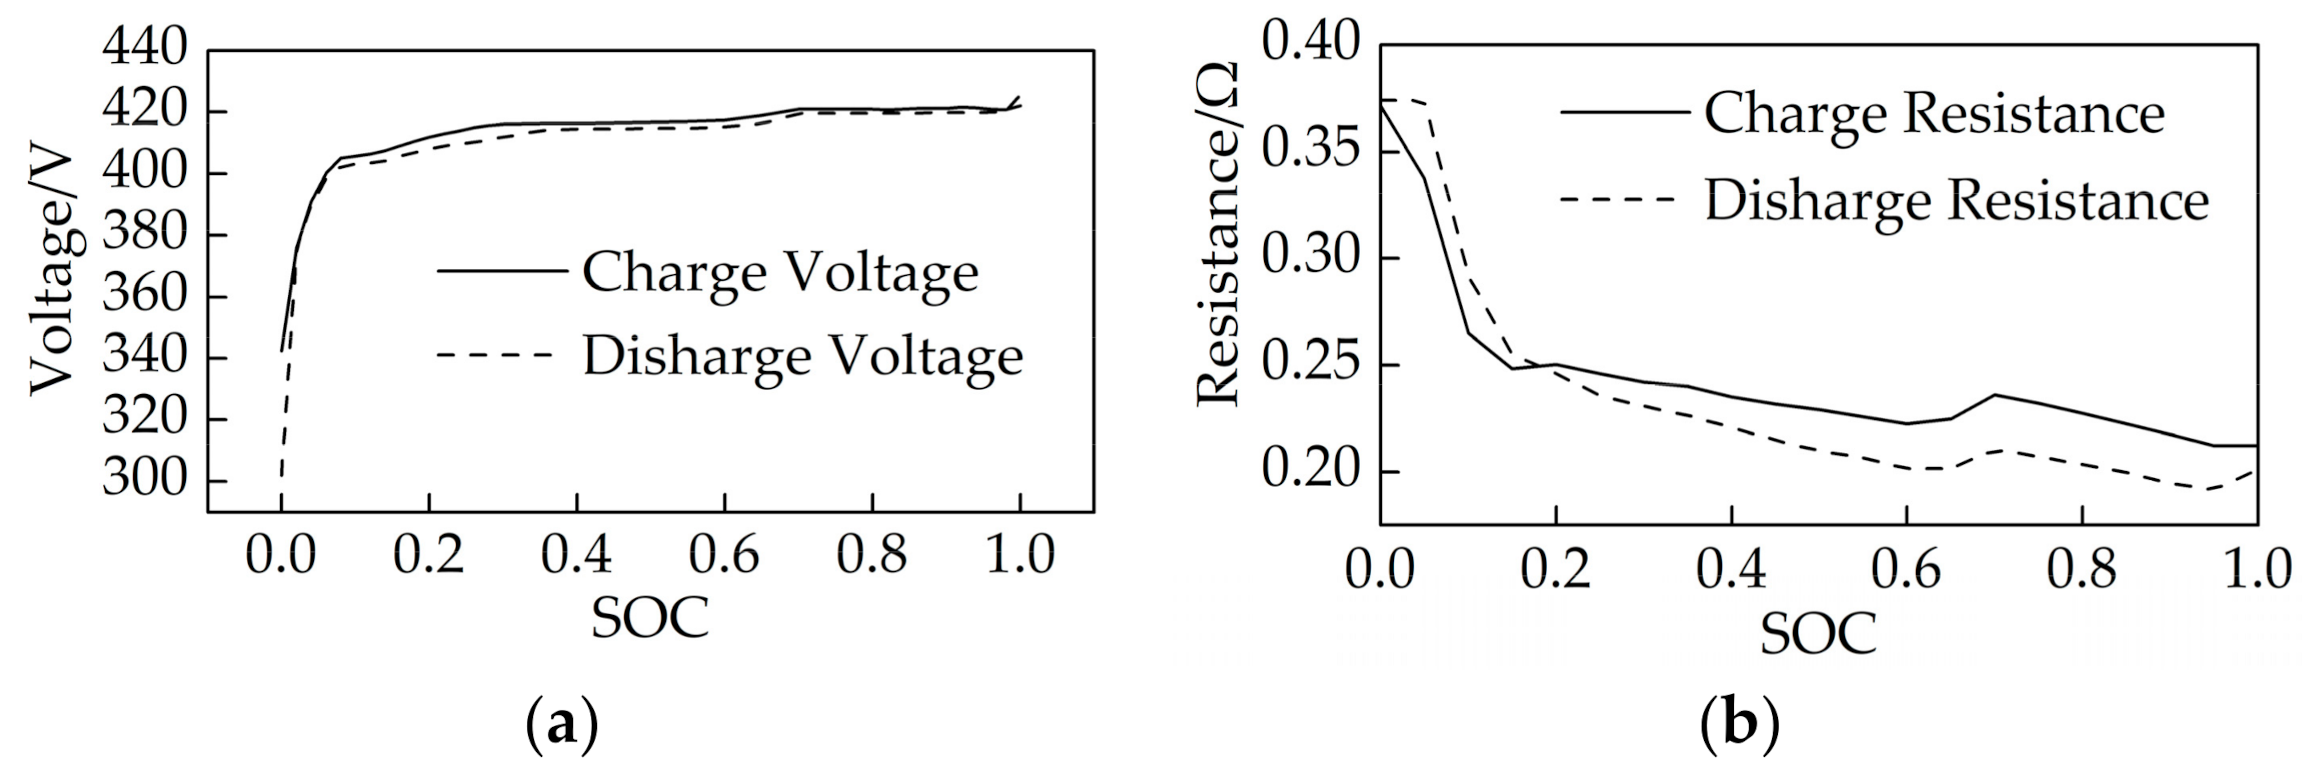
As shown in
Figure 5, the battery model includes an ideal voltage source to provide the open circuit voltage (
Voc), and internal resistance (
R0) to simulate the internal loss of the battery [
22].
According to Kirchhoff’s law, the terminal voltage of the battery is a function of current:
The battery power is calculated by:
SOC is defined as the percentage of the battery’s remaining capacity to the full capacity, which can be calculated by electric current integration:
where,
SOC0 is initial
SOC,
Qnom is full battery capacity.
2.4. Driver Model
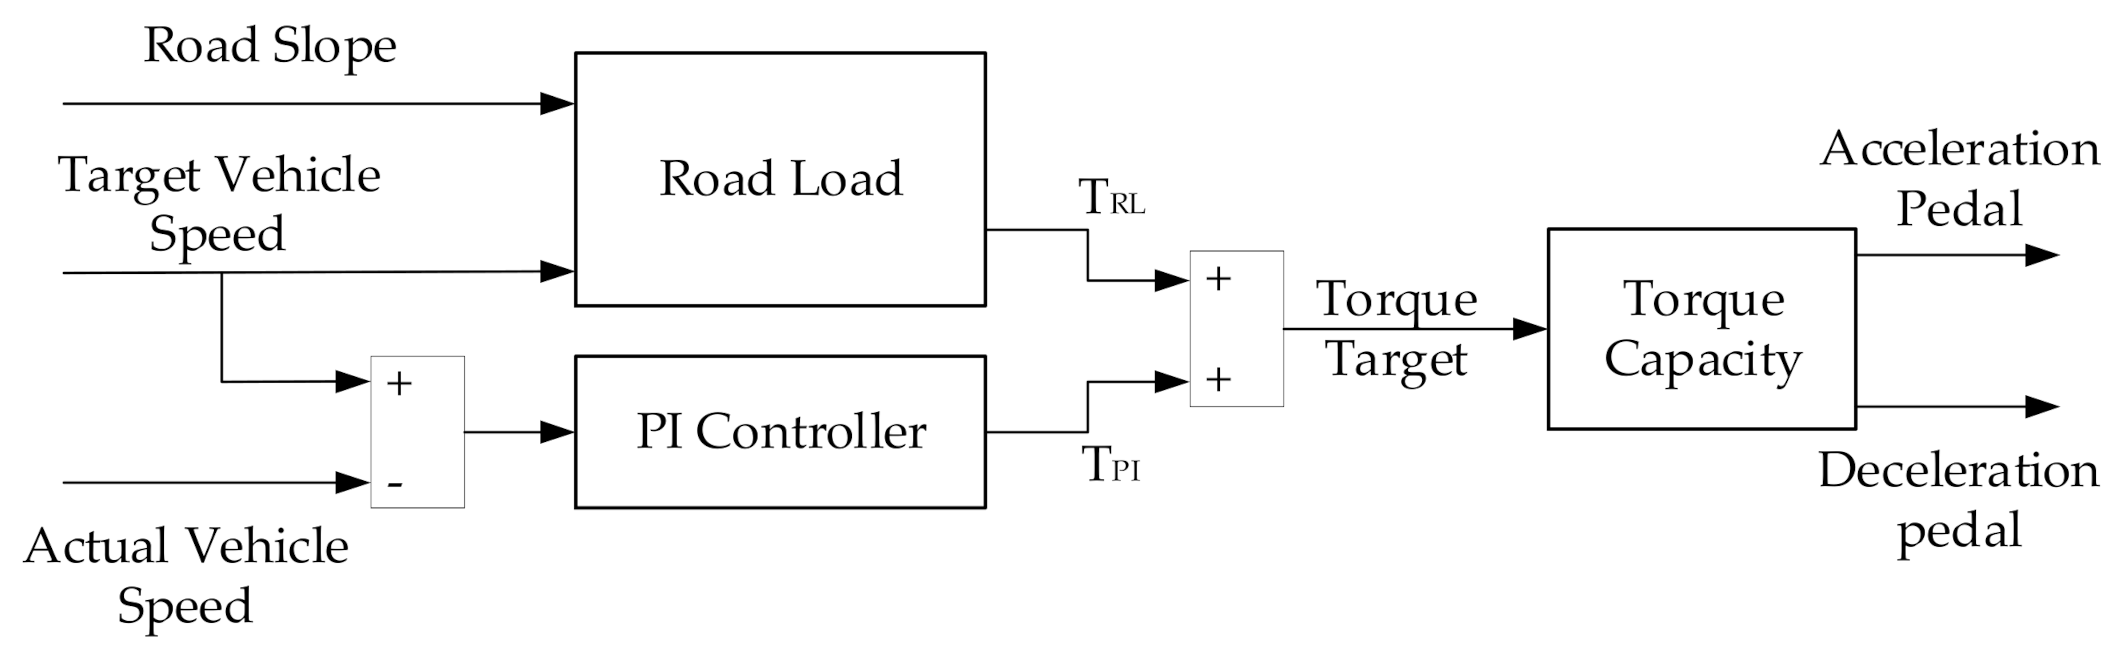
The driver model controls the accelerator pedal position and brake pedal position according to the actual vehicle speed and the target vehicle speed so that the vehicle follows the desired speed trajectory. The calculation process of pedal position is shown in
Figure 6.
The target torque is the sum of road load torque
TRL and PI controller torque
TPI:
The road load torque
TRL is the sum of air resistance, rolling resistance, and slope resistance:
where,
vtar is target speed,
ρ is the air density,
A is the area of the front wind surface, and
Cd is the air resistance coefficient,
g is the acceleration of gravity,
δ is the road slope,
Cr is the tire rolling resistance coefficient,
r is the tire radius.
PI controller torque
TPI is calculated by:
where,
vact is actual speed,
kp is the proportional gain and
ki is the integral gain.
The pedal position is calculated by the ratio of target torque to vehicle torque capacity:
where,
acc is the accelerator pedal position,
brk is the brake pedal position,
Tdrive_max is the maximum driving torque, and
Tbrake_max is the maximum braking torque.
3. Powertrain Control Structure
For HEVs, the propulsion system has two types of state variables [
23], one is a continuous state, such as engine torque and speed; the other is a discrete state, namely operating modes. Therefore, the system control function is divided into three layers, as shown in
Figure 7. The first two functions control the continuous state variables and discrete state variables respectively, and the third function is used to coordinate the transition between discrete states. The inputs of the system control are the system state feedback and the driver pedal position, and the outputs are the target torque of the engine,
ISG and
EM, as well as the fuel injection enable command and clutch pressure command.
Calculate the target torque value of engine, ISG and EM, economy score, drivability score and the settings of the engine and clutch working state under the current driving conditions.
Select the best operating mode under the current driving conditions according to the economy score and drivability score, and send the target state of the engine and clutch corresponding to the best mode to the third layer. At the same time, judge the actual operating mode according to the actual state of the engine and clutch, send the torque target values corresponding to the actual operating mode to the third layer.
Coordinate the state switching of the engine and the clutch, as well as coordinate the transitional changes of torque and speed, e.g., speed synchronization. First, the actual state and target state of the engine and clutch are compared to judge whether there is state switching. If there is no state switching, the torque target values are directly output. If there is a state switching, the torque target values are calculated by the corresponding state switching module.
4. Adaptive Mode Selection Strategy Based on Variable Power Reserve
Similar to the transmission gear selection strategy of traditional vehicles, the mode selection strategy of HEVs decides the timing and target mode for switching.
The goal of the mode selection strategy is to meet driving demand and improve system efficiency. Therefore, performance metrics must be designed to quantify the drivability and economy of each mode. In this strategy, the drivability score and economic score are defined to evaluate the performance of operating modes in real time, and the proportion of the above two metrics in the comprehensive performance score is determined according to the driving conditions. The mode selection is completed by comparing the comprehensive performance scores of the candidate modes.
4.1. Variable Power Reserve Adaption Method
In the process of mode switching, battery power must be used to drive the vehicle and start the engine at the same time. If the battery cannot provide enough power, it will inhibit the vehicle from accelerating and cause drivability problems. Since the power reserve represents the instantaneous available power for acceleration, it can be used as a metric for evaluating drivability. The power reserve is defined by the difference between the maximum driving power and the road load power:
where,
Pres_act is the actual power reserve of the vehicle in different operating modes,
Pmax is the maximum driving power,
PRL is the road load power.
In pure electric mode, the maximum output power is the minimum of the maximum discharge power of the battery and the maximum driving power of the
EM motor.
where,
Pbattmax is the maximum battery discharge power,
PEMmax is the maximum
EM driving power,
ηe is electrical transmission efficiency,
ηm is the mechanical transmission efficiency.
In series mode, the maximum output power is obtained by,
where,
Pgenmax is the maximum generating power of
ISG motor.
In parallel mode, the maximum output power is obtained by,
where,
Pengmax is the maximum engine power.
Setting a high constant power reserve can make the vehicle produce a consistent acceleration response under different driving conditions. However, this method will cause the vehicle to exit the pure electric mode early under less aggressive driving conditions, and cannot fully utilize the economic advantages of HEVs at low driving power demand. Therefore, a variable power reserve that varies with vehicle speed [
24] is applied here, which is defined as:
where
Pres_req(v) is the power reserve required to make the vehicle have acceptable acceleration capability at a certain speed, and
ares(v) is the acceleration reserve. For HEVs, the acceleration reserve refers to the extra acceleration that the vehicle will obtain by fully depressing the accelerator pedal at a certain time when driving at a certain speed without switching the operating mode [
25]. In pure electric mode, the acceleration reserve is limited by the battery
SOC and the motor driving power.
Ngo [
26] assumed that the acceleration request at every vehicle speed is a random variable. By off-line statistical analysis of the vehicle acceleration characteristics in various standard driving cycles, the power reserve at every velocity is determined, so that the vehicle can meet 90% of the actual driving situation.
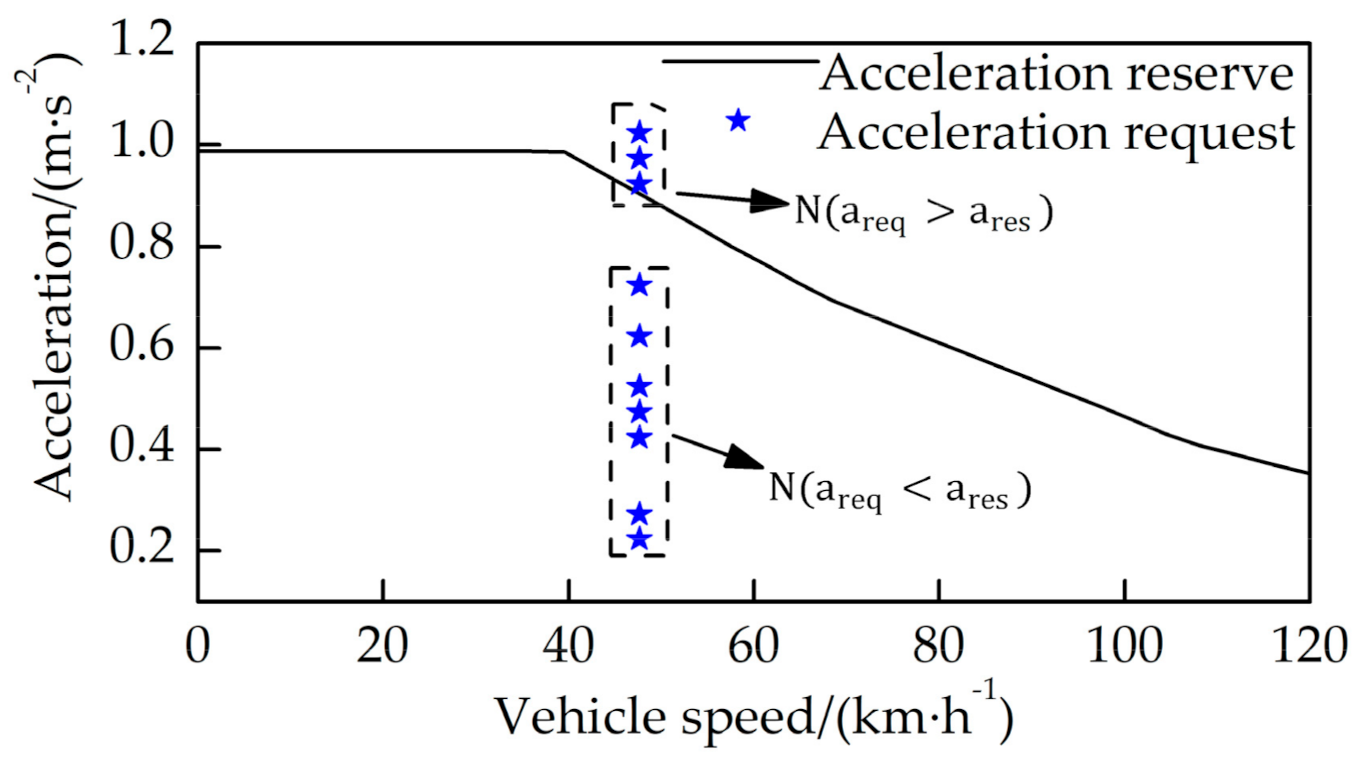
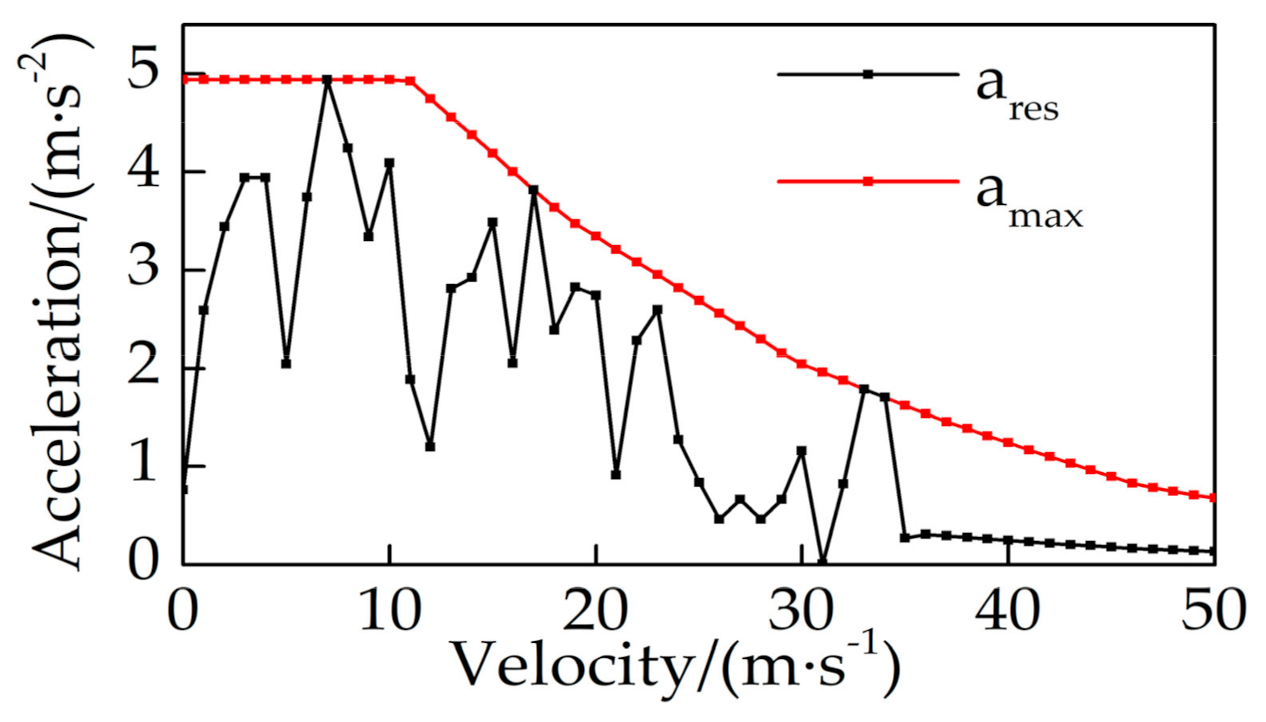
Different from the above method, a dynamic and real-time adaption method for power reserve is proposed. This study adjusts the acceleration reserve incrementally through online statistical analysis of vehicle acceleration characteristics to realize the real-time adjustment of power reserve. As a demonstration,
Figure 8 shows the analysis of the acceleration request data and the adjustment of the acceleration reserve at a vehicle speed of 50 km/h.
Obtain the number of times that the acceleration request is greater than and less than the acceleration reserve by sampling, and calculate the probability that the acceleration request is less than the acceleration reserve:
where,
areq is the acceleration request,
N (
areq (
v) <
ares (
v)) is the times that the acceleration request is less than the acceleration reserve,
N (
areq (
v) >
ares (
v)) is the times that the acceleration request is greater than the acceleration reserve.
When
pa (
v) is less than a certain desired probability, it means that at this speed, there is a high possibility that the acceleration demand will exceed the current acceleration reserve setting. Therefore, the acceleration reserve should gradually increase by Δ
a, so that
pa (
v) gradually reaches the desired probability. Here, it is expected that
pa (
v) is equal to 90%, that is, the vehicle can satisfy 90% acceleration demand so that the vehicle has an acceptable level of drivability [
27]. This process can be represented by
Figure 9.
The detailed steps for implementing the power reserve adaption are described below.
Step 1: Define a set of arrays to store adaption process variables, and update the acceleration reserve through arrays elements operations. The arrays’ definitions are shown in
Table 2. In the speed range of 0 to 50 m/s, the vehicle speed is discretized at intervals of 1 m/s, arrays elements are indexed using discrete vehicle speeds.
Step 2: Count the number of acceleration requests less or greater than the acceleration reserve at the current discrete vehicle speed;
where, Δ
a is the hysteresis threshold.
Step 3: Calculate the probability that the acceleration request is less than the acceleration reserve at the current discrete speed;
Step 4: Select the acceleration reserve increment according to the calculated probability;
where, Δ
p is the hysteresis threshold.
Step 5: Adjust the acceleration reserve curve using the acceleration reserve increment, and limit the acceleration reserve between 0 and maximum acceleration;
Step 6: The acceleration reserve corresponding to the current vehicle speed is obtained by interpolating the array ares. Calculate the required power reserve at the current vehicle speed using Formula (14).
The steps are executed in a sequential manner at each sampling time. The sampling time of the HEV model and the system control strategy is 10 ms, which is unnecessary for the power reserve adaption strategy. In this implementation, the sampling time of the power reserve adaption strategy is 100 ms.
4.2. Drivability Score and Economy Score Calculation
The drivability score is defined as:
where
Kmax is the maximum drivability score.
K indicates the potential of the current mode to meet the demand power reserve. The high K value means that when the driver presses the accelerator pedal, the driving power of the propulsion system can change enough to achieve the desired acceleration response, resulting in satisfactory drivability.
The economy score of the operating modes is quantified by the overall efficiency. Take the ratio of output power and input power of the propulsion system as the overall efficiency [
28],
where
Pout is system output power,
Pin is system input power,
Pdrive is driving power,
Pcharge is the battery charge power,
Pfuel is the fuel power, and
Pdischarge is battery discharge power.
Figure 10 shows the overall efficiency calculation process, and the inputs are the torque target value calculated by the torque distribution function and the actual speed.
4.3. Comprehensive Score Calculation
To obtain the best performance, the best mode should be determined under various driving conditions. Under constant speed conditions, due to the emphasis on vehicle economy, the demand for power reserve is small; under acceleration conditions, due to the emphasis on vehicle drivability, the demand for power reserve is relatively large [
29]. Therefore, the weighting factor u is defined to adjust the relative importance of the economic score and the drivability score in real time according to the acceleration demand, and the comprehensive performance score is calculated and compared for mode selection, as shown in Formula (23). Among the candidates, the operating mode that shows the highest comprehensive performance score is selected as the target operating mode.
where,
C is the comprehensive performance score and u is the weighting factor. In this implementation, the weighting factor u increases linearly with the increase of acceleration requests. When the acceleration request is 0,
u =
umin; when the acceleration request is greater than or equal to the acceleration reserve,
u = 1. The
umin is related to the aggressiveness of the driving cycle. In order to be prepared for possible acceleration requests, the more aggressive the driving cycle, the greater
umin. In addition, in the moderate driving cycle, considering limiting the battery discharge depth, the setting of
umin cannot be too low.
5. Results and Analysis
In this part, a vehicle simulation was performed under the US06 driving cycle and the FTP driving cycle. Compared with the mode selection strategy based on logic thresholds (LTB), the performance of the proposed mode selection strategy was verified. According to Ref. [
30] and considering the characteristics of the vehicle structure studied, the LTB strategy is established as shown in
Figure 11. In the traction condition, the switching rules between operating modes are determined according to driving power demand
Preq, vehicle speed, acceleration, and
SOC. The numbers in the circle indicate the priority of switching, the smaller the value, the higher the priority. The following is a detailed description:
- (1)
To maintain the battery SOC and meet the driving power, switching rules between pure electric mode and series mode are below:
If SOC < 0.25 or Preq > Pmax_E, and the actual mode is pure electric mode, the series mode is selected as the target mode;
If SOC > 0.3, Preq < Pmax_E, and the actual mode is series mode, the pure electric mode is selected as the target mode.
- (2)
In the fixed ratio gearbox configuration, the minimum vehicle speed of engine driving is 40 km/h, switching rules between series mode and parallel mode are below:
If vehicle speed > 40 km/h, Preq < Pmax_P, areq < 1 m/s−2, and the actual mode is series mode, the parallel mode is selected as the target mode.
If vehicle speed < 40 km/h or Pmax_P < Preq < Pmax_S, and the actual mode is parallel mode, the series mode is selected as the target mode.
- (3)
To maintain the battery SOC, switching rules between pure electric mode and parallel mode are below:
If SOC < 0.25, vehicle speed > 40 km/h, Preq < Pmax_P, and the actual mode is pure electric mode, the parallel mode is selected as the target mode.
If SOC > 0.3, Preq < Pmax_E, and the actual mode is parallel mode, the pure electric mode is selected as the target mode.
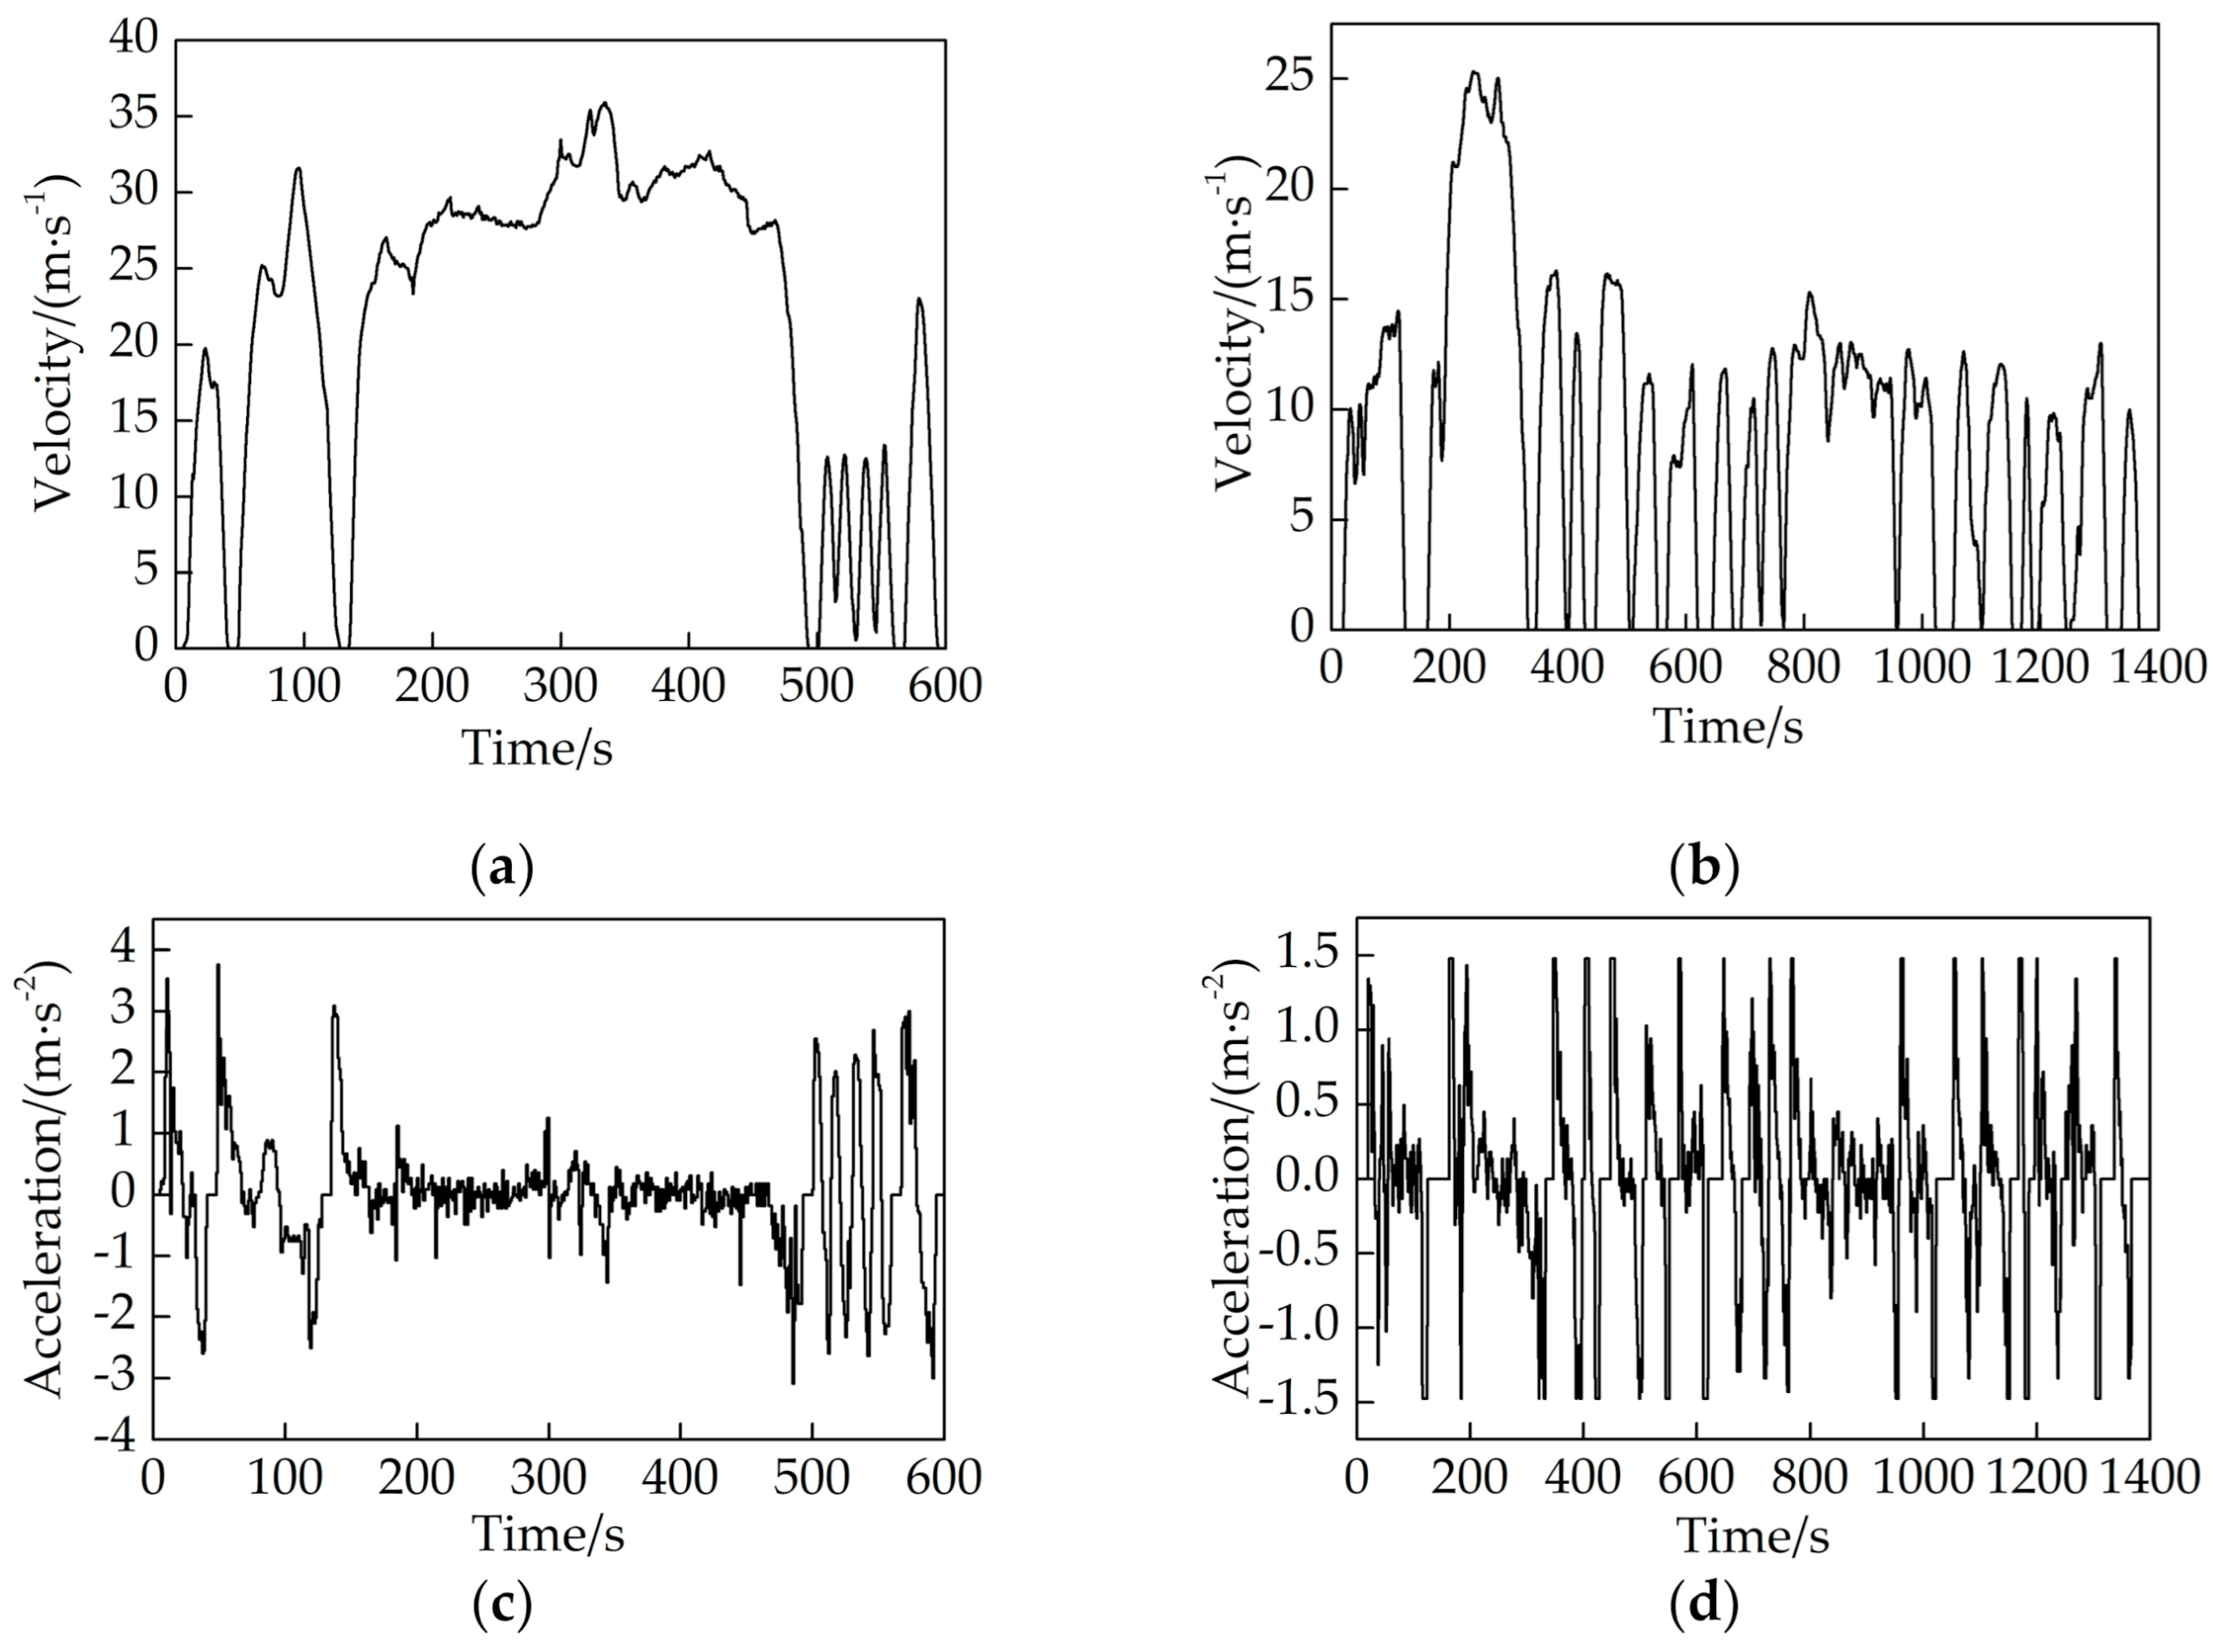
The US06 cycle is used to simulate the high-speed and aggressive cycle, and the FTP cycle is used to simulate the city cycle, as shown in
Figure 12.
5.1. US06 Cycle
5.1.1. Simulation of Mode Selection Strategy Based on Logic Thresholds
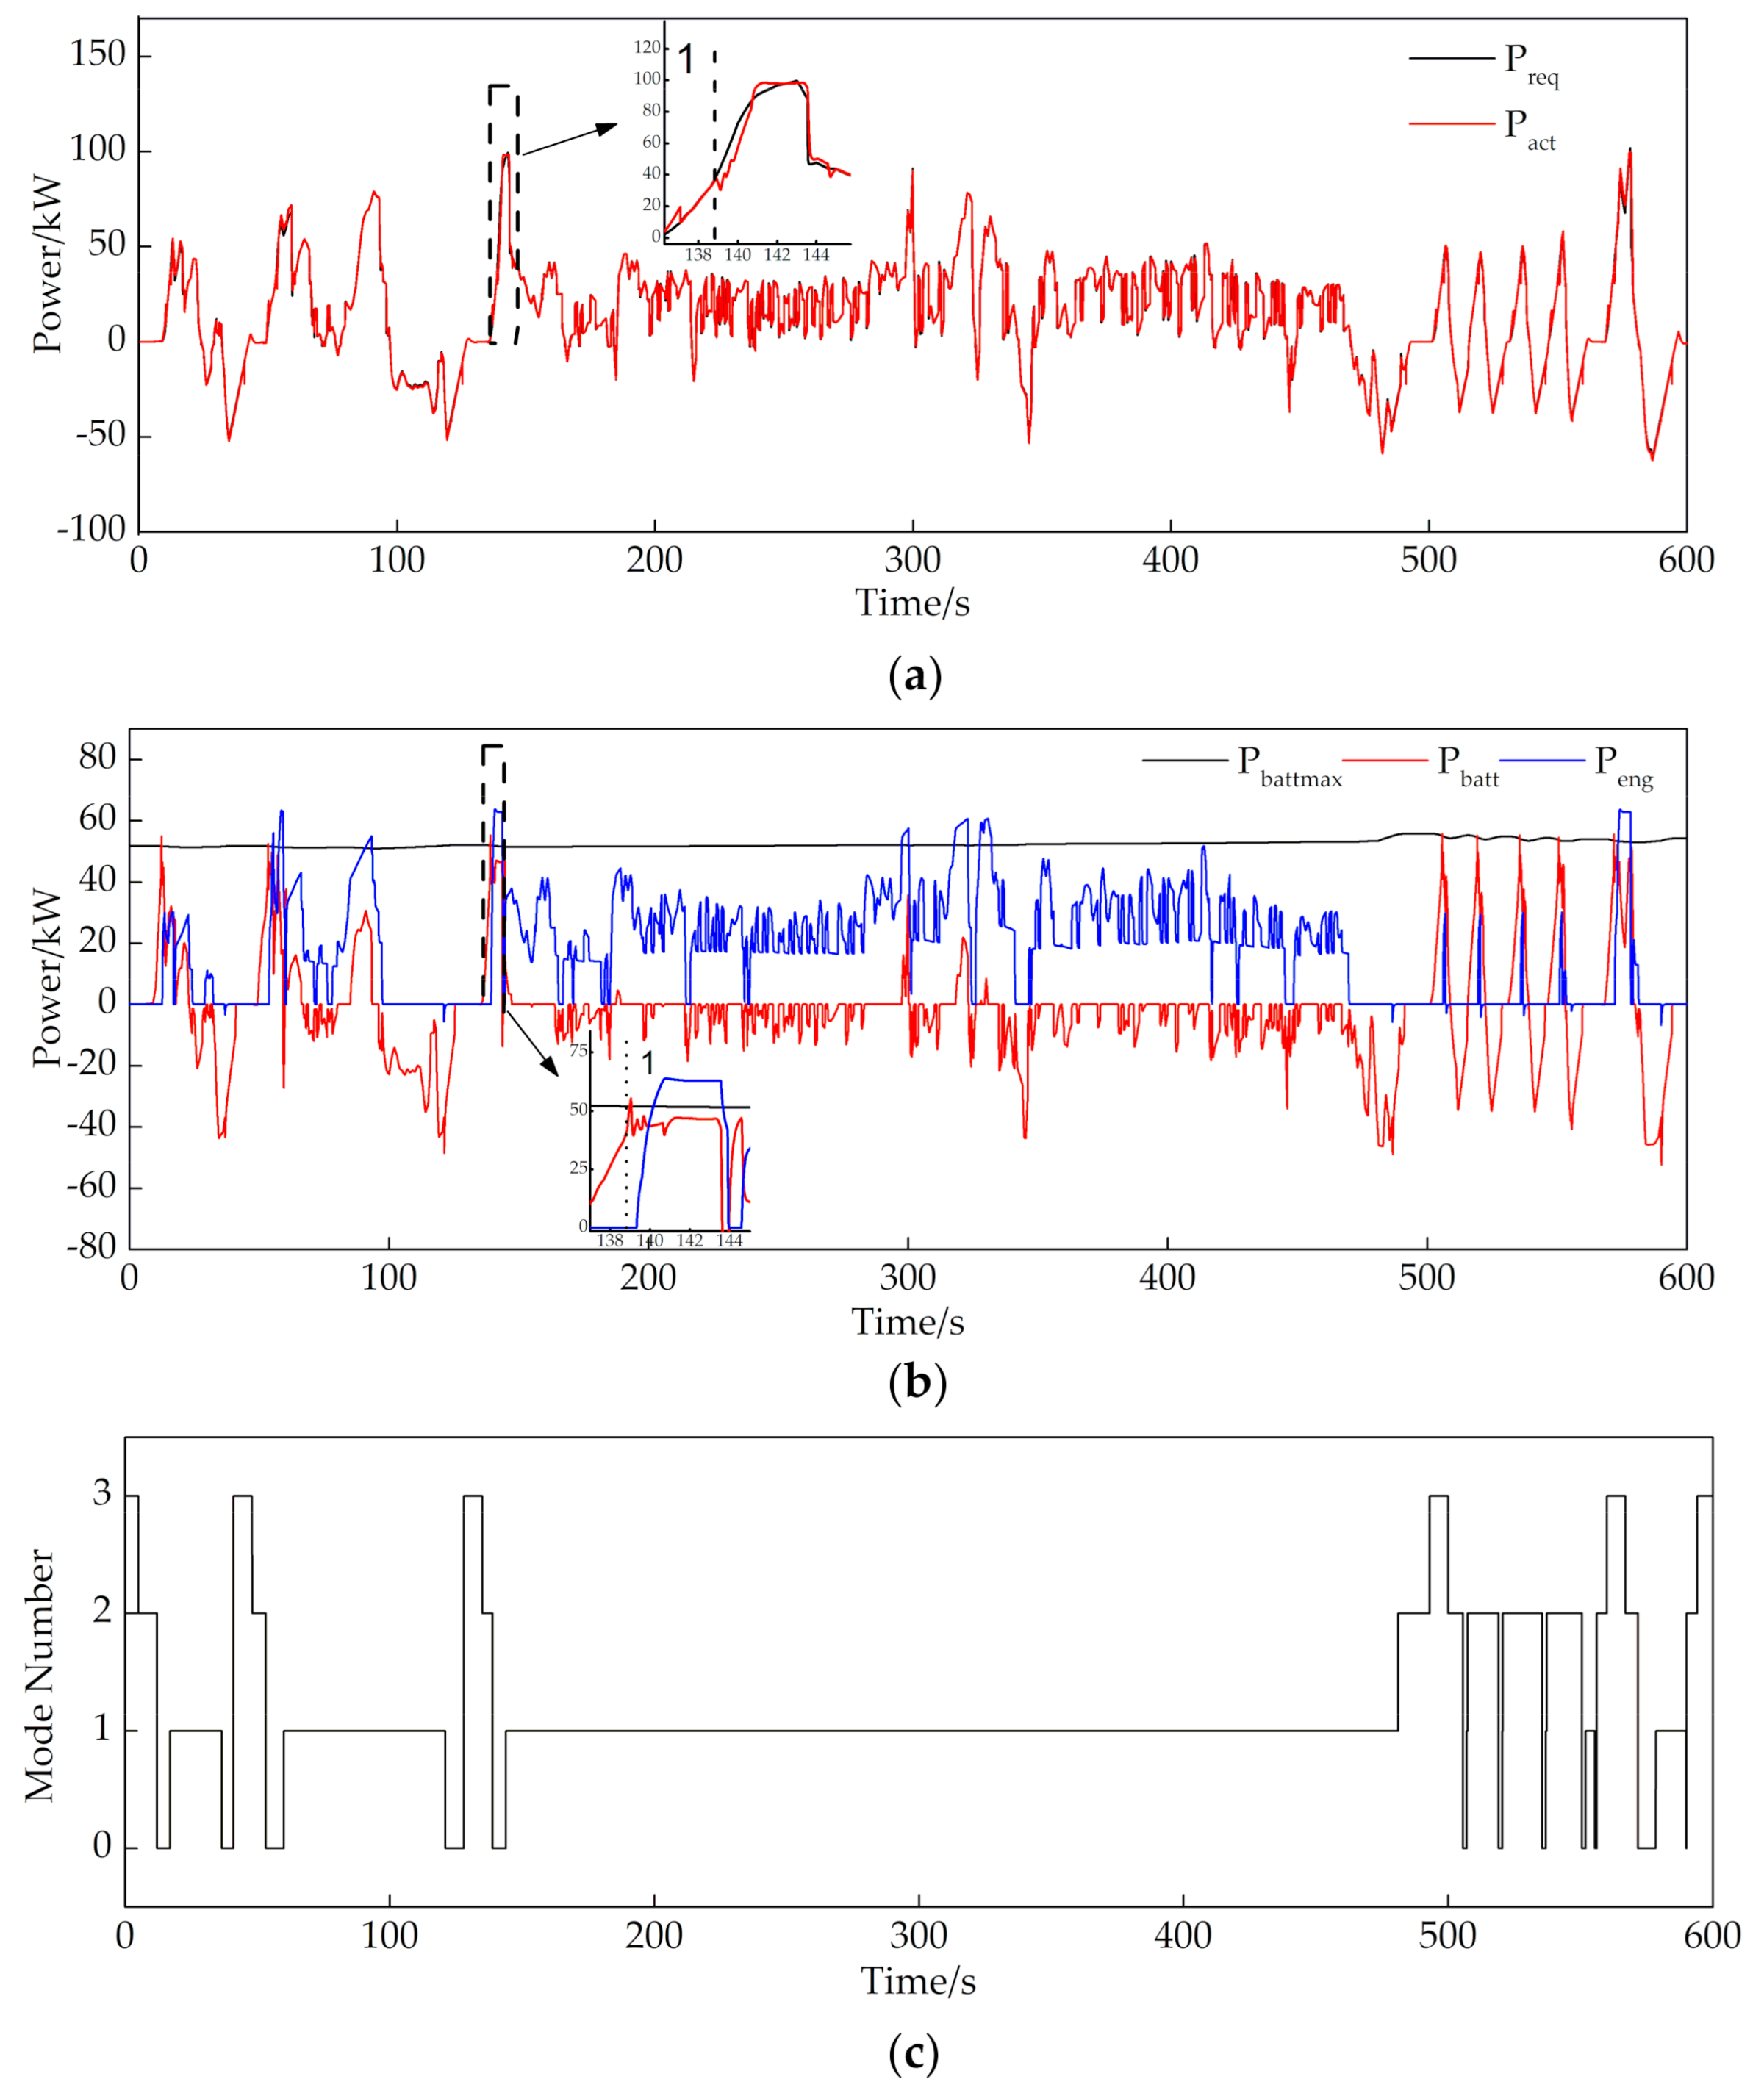
Figure 13 shows the simulation results under US06 cycle with the initial
SOC of 0.28. Mode numbers 0–3 represent series mode, parallel mode, pure electric mode, and vehicle stop, respectively.
Pact is the actual driving power.
The partially enlarged view in
Figure 13 shows that the driving power decreases significantly during mode switching. At time 1, the target mode is changed from pure electric mode to series mode and
ISG is used for engine start. Since the engine starting task has a higher priority, the EM power is adjusted by feedback to make the battery work within the power limit as far as possible. This process leads to the decrease of the driving power provided by the battery.
If the battery has extra power to meet the transient task during mode switching, the influence of engine start-up on the driving power can be reduced. It can be improved by adjusting the threshold parameter of the LTB strategy. However, the fixed threshold parameter may cause the pure electric mode to exit when the driving power is low, resulting in increased fuel consumption, especially in city cycle. This leads to the development of adaption mode selection strategy based on variable power reserve (AVPRB).
5.1.2. Simulation of Adaption Mode Selection Strategy Based on Variable Power Reserve
In order to adapt to the driving cycle, it takes some time for the AVPRB strategy to adjust the acceleration reserve.
Figure 14 shows the acceleration reserves under the US06 cycle. The adaptive acceleration reserve can meet 90% of driving requirements in the full speed range under US06 cycle.
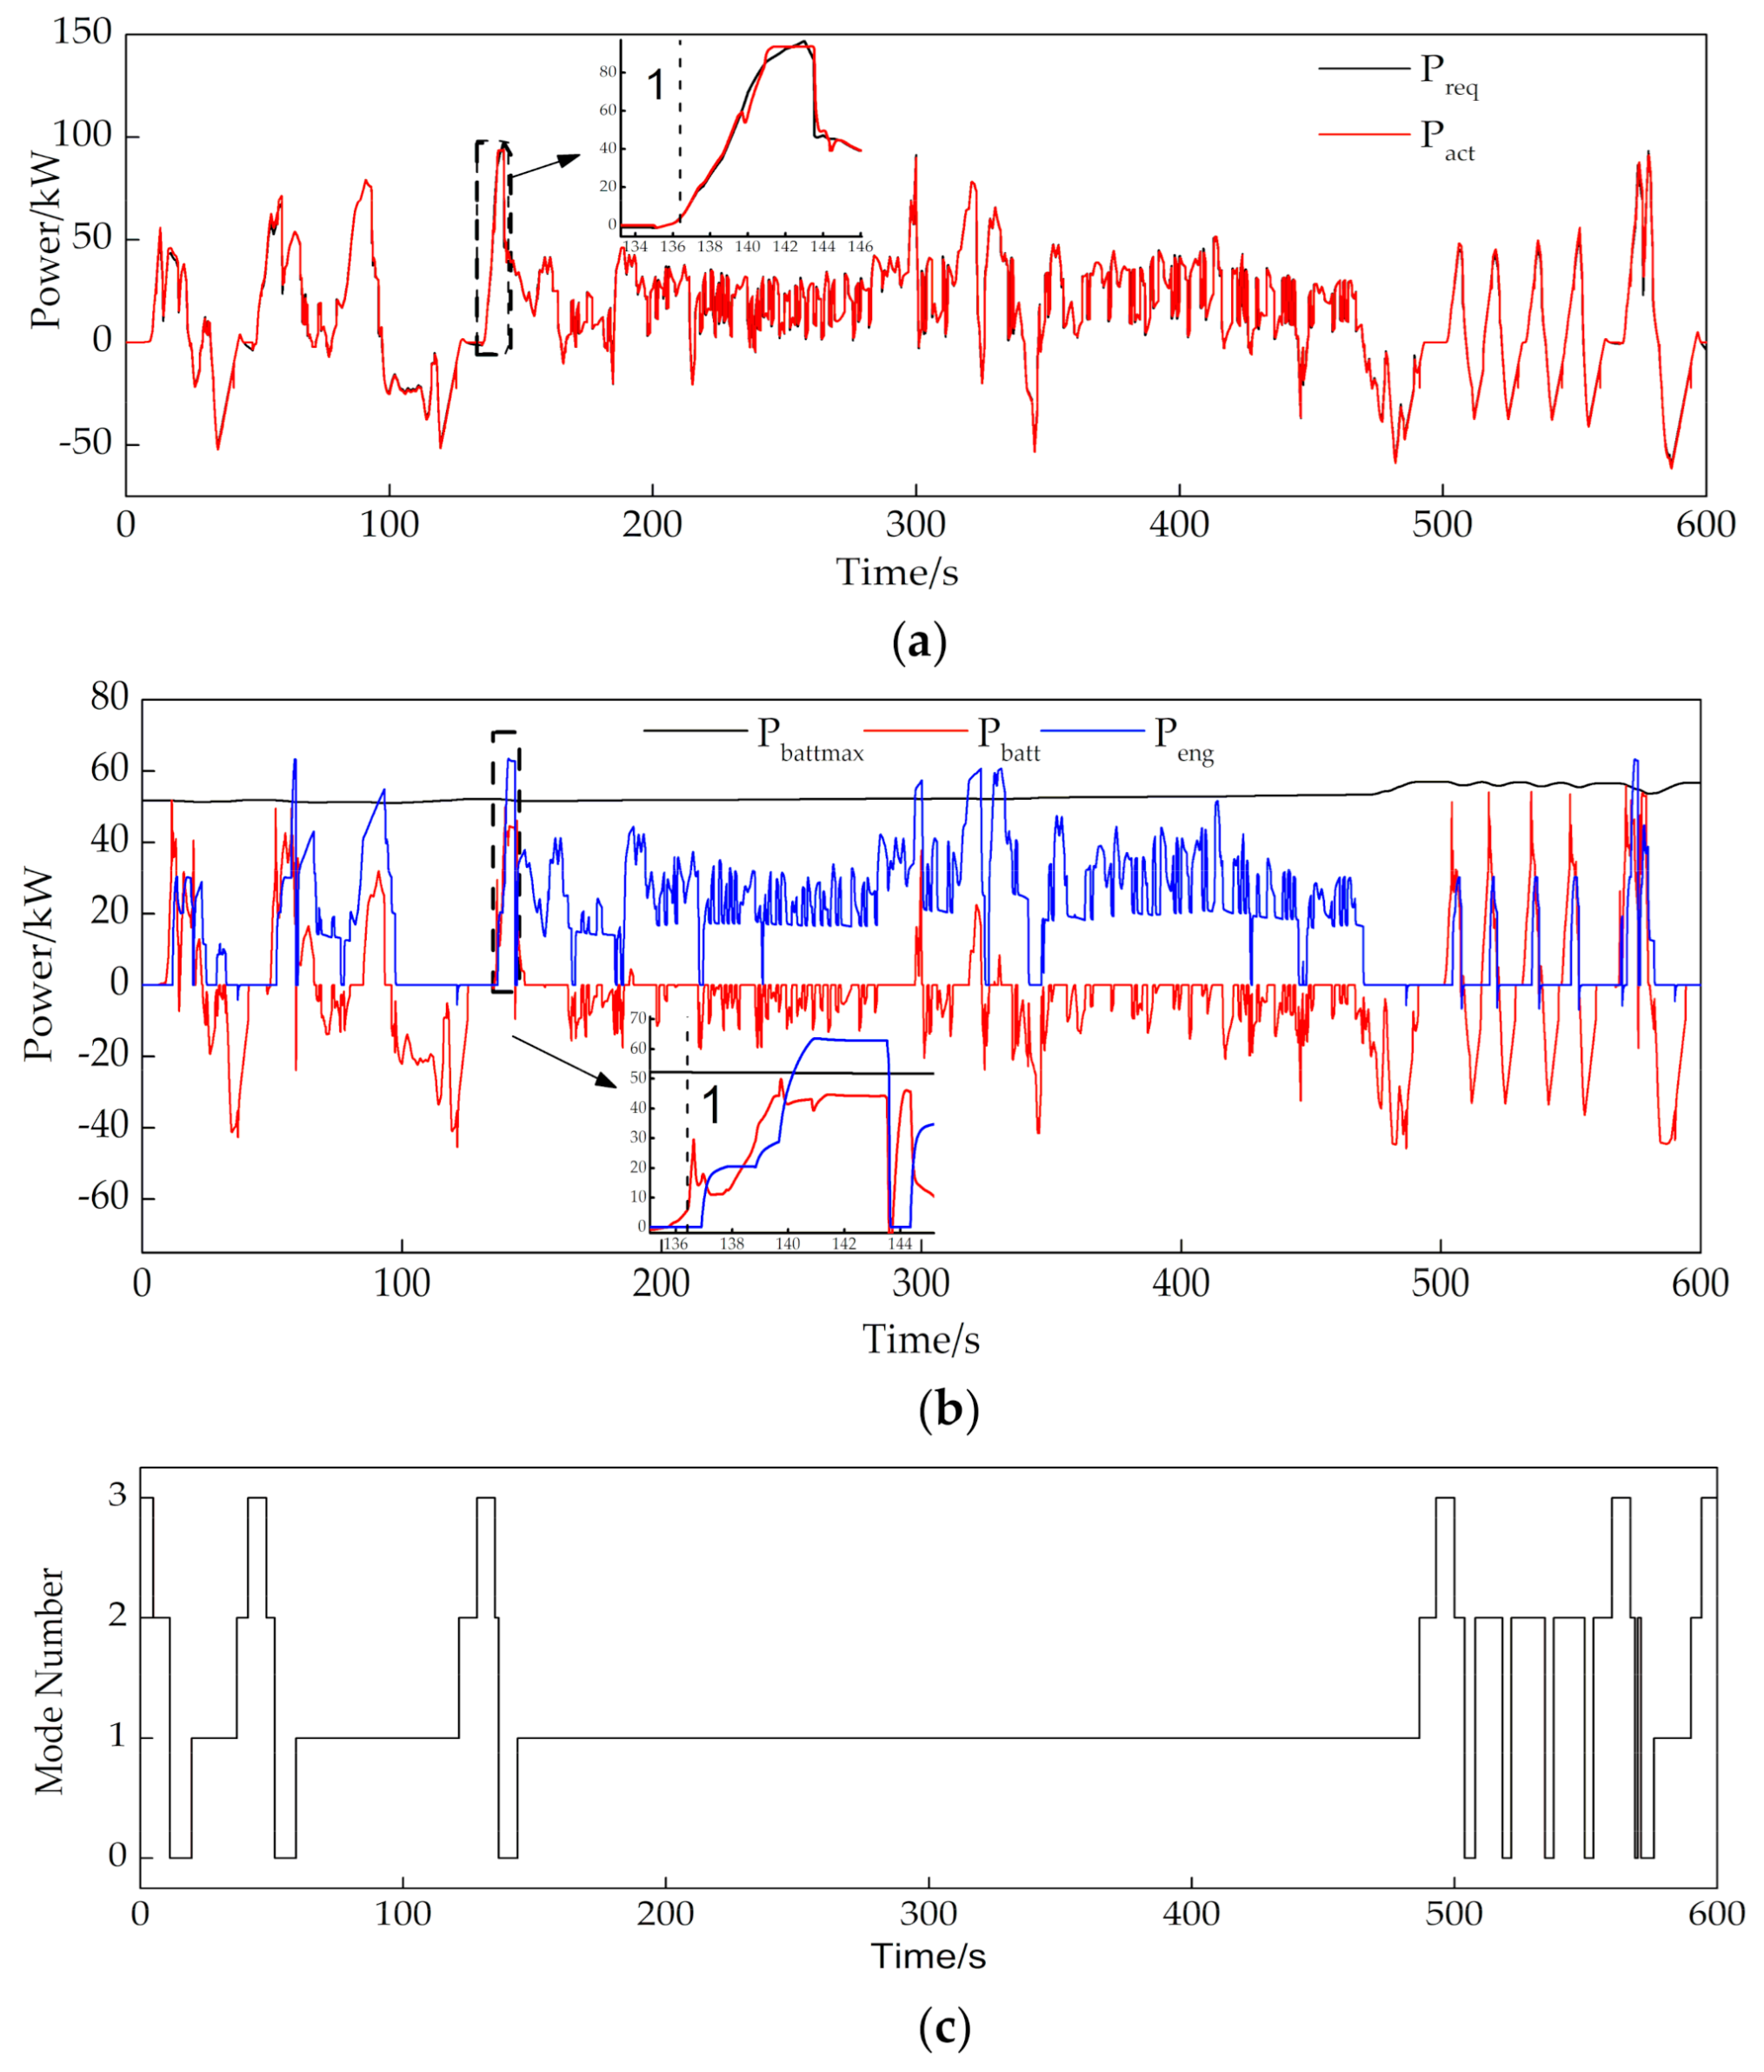
Figure 15 shows the simulation results of the AVPRB strategy. The partially enlarged view shows that the driving power drop is significantly reduced. This is because the pure electric mode exit timing is advanced. It allows the battery to provide power to the EM and
ISG within the power limit.
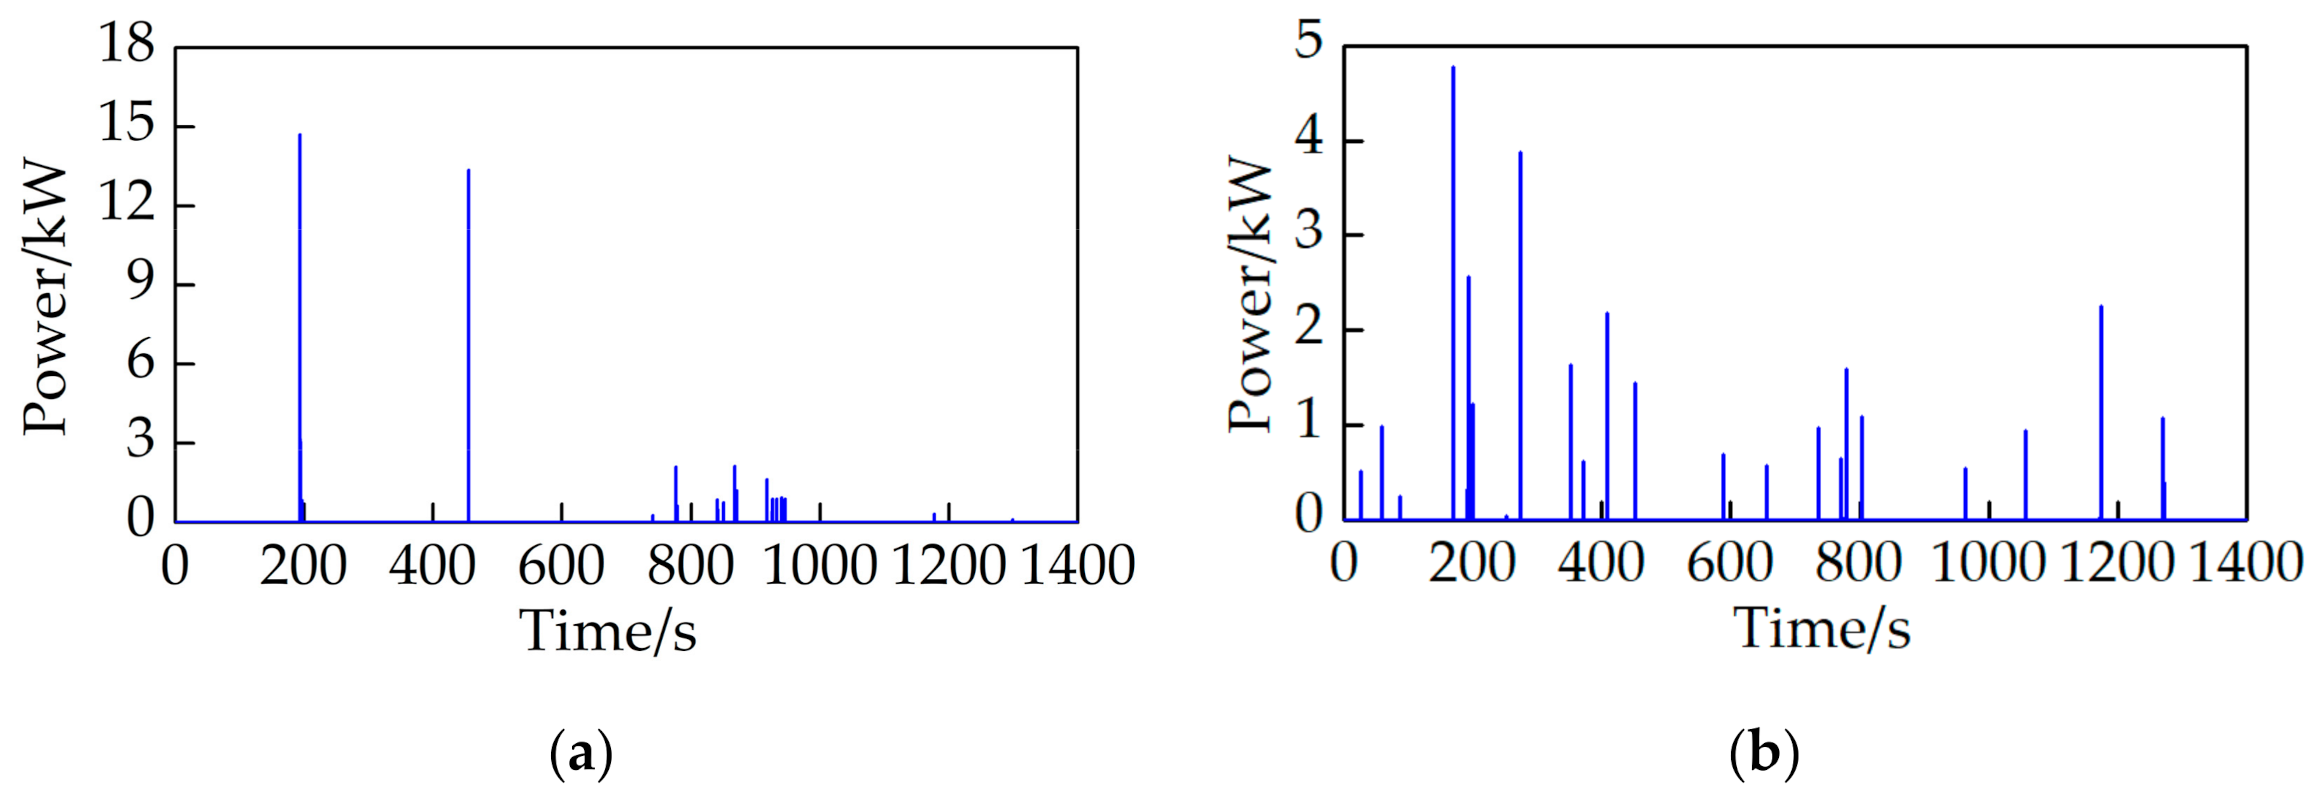
Figure 16 shows the driving power drop results (calculated by
Preq −
Pact) of the two mode selection strategies. In order to quantify the degree of driving power drop during switching from pure electric mode to hybrid mode, use the following integral for calculation,
In contrast, under US06 cycle, the total driving power drop of AVPRB strategy is reduced by 74.2%.
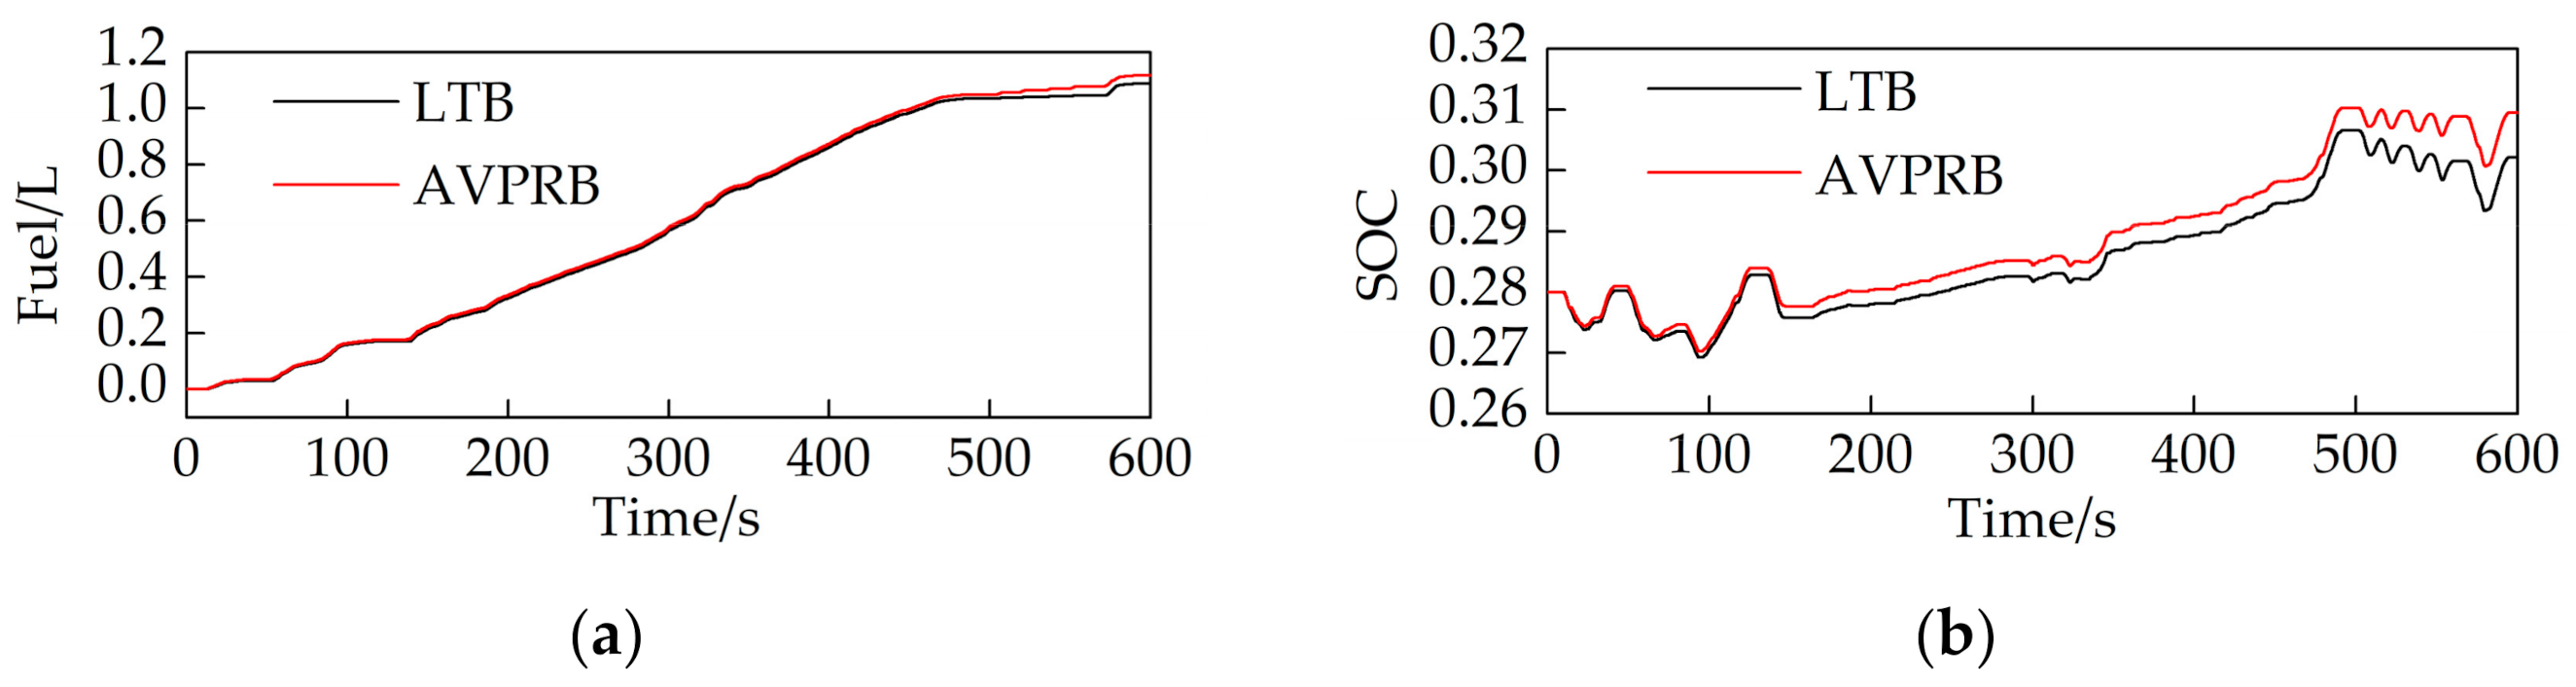
Since economy and drivability are contradictory attributes in many situations, it is necessary to evaluate the impact of the proposed mode selection strategy on fuel consumption.
Figure 17 shows the fuel consumption and
SOC of the two strategies under the US06 cycle. Compared with the LTB strategy, the AVPRB strategy maintains
SOC at a higher level while has almost the same amount of fuel consumption. The higher the
SOC, the greater the maximum discharge power of the battery, which can reserve power for future mode switching to avoid battery over-discharge and help to improve battery durability. At the end of the US06 cycle, there is a rapid acceleration condition. With the proposed strategy, battery over-discharge is completely limited during mode switching, as shown in
Figure 18.
5.2. FTP Cycle
In order to further verify the effectiveness of the proposed mode selection strategy, the vehicle simulation was performed under FTP cycle, and the initial conditions are the same as above.
Figure 19 shows the result of the acceleration reserve adjustment under the FTP cycle. In contrast, because the FTP cycle is more moderate, its acceleration reserve is less than that of the US06 cycle.
Figure 20 shows the driving power drop results of the two mode selection strategies under the FTP cycle. The total driving power drop of AVPRB strategy is reduced by 65%. The results show that the drivability is also greatly improved under the city cycle FTP.
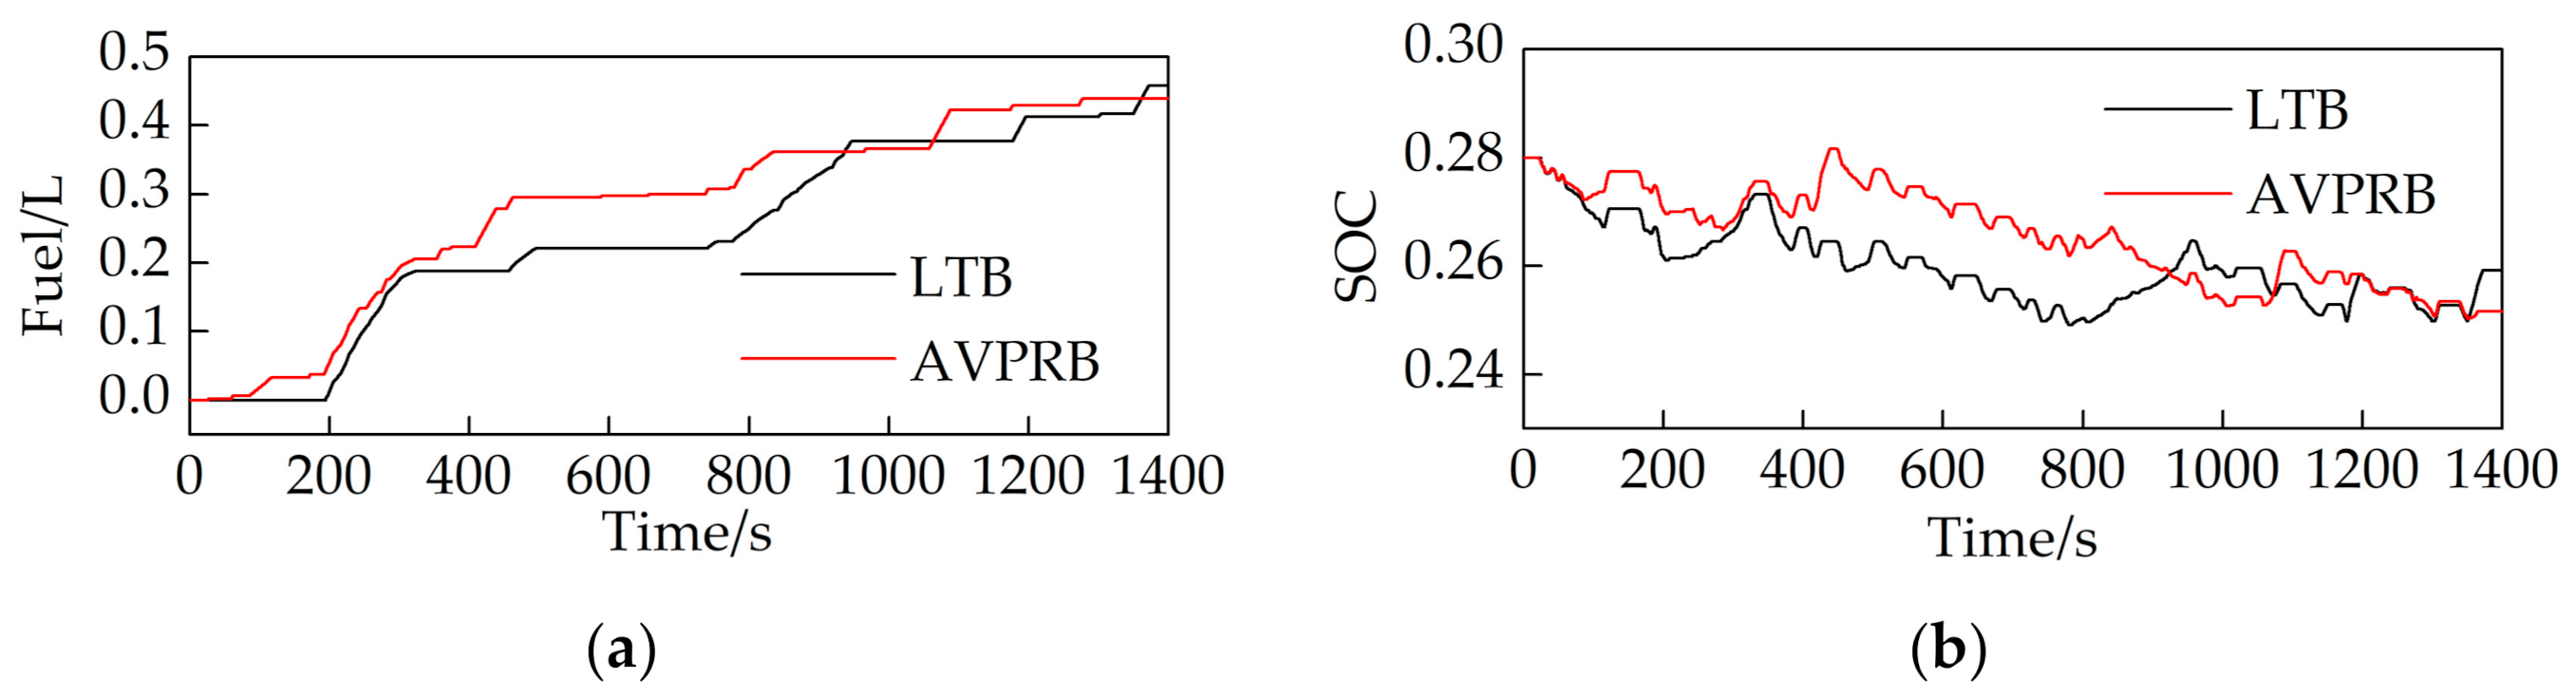
Figure 21 shows the fuel consumption and
SOC of the two strategies under the FTP cycle. In contrast, the fuel consumption of AVPRB strategy is reduced by 4.2%, and the
SOC of the battery is kept in a reasonable range. Although the
SOC final value is relatively lower with the AVPRB strategy, there is no battery over-discharge due to the small acceleration request under FTP cycle. Therefore, AVPRB strategy can make more use of electric energy to reduce fuel consumption.
6. Conclusions
In order to solve the drivability problem caused by the battery power limitation during mode switching, this paper proposes a novel mode selection method. Through the real-time evaluation of the power reserve and overall efficiency of the operating modes, the target mode is determined to meet the driving demand without damaging the vehicle fuel economy. By online statistical analysis of vehicle acceleration characteristics, the required power reserve is dynamically updated to adapt to the driving cycle.
Compared with the mode selection strategy based on logic thresholds, the driving power drop is reduced by 74.2% and 65% under the US06 cycle and the FTP cycle, respectively. The proposed strategy can effectively improve the drivability of the hybrid electric vehicles under special conditions.
Under the US06 cycle, the over-discharge of the battery is fully restrained and fuel consumption is almost the same. Under the FTP cycle, more electric energy can be used to reduce fuel consumption while keep the SOC at a reasonable level.
Although the proposed model in this study can adapt to various working conditions and optimize the weights of fuel economy and power responsiveness, it is relatively sensitive to the weight factor umin. In the future, we will consider automatically determining the weighting factor umin by identifying the characteristics of the driving cycle and carrying out real vehicle verification.
Author Contributions
Conceptualization, J.F. and B.Z.; methodology, J.F.; software, J.F.; validation, J.F., J.Z. and H.W.; formal analysis, Z.W. and H.W.; investigation, J.F.; resources, B.Z.; data curation, J.F.; writing—original draft preparation, J.F.; writing—review and editing, J.F., B.Z., and J.Z.; visualization, J.F.; supervision, B.Z.; project administration, Z.W.; funding acquisition, B.Z. All authors have read and agreed to the published version of the manuscript.
Funding
This research was funded by National Key R&D Program, China, grant number 2016YFB0101402.
Institutional Review Board Statement
Not applicable.
Informed Consent Statement
Not applicable.
Data Availability Statement
Conflicts of Interest
The authors declare no conflict of interest.
Nomenclature
| BMS | Battery Management System |
| EM | Electric Motor |
| HEV | Hybrid Electric Vehicle |
| ISG | Integrated Starter Generator |
| PHEV | Plug-in hybrid Electric Vehicle |
| PI | Proportion-Integral |
| SOC | State of Charge |
References
- Onat, N.C.; Kucukvar, M.; Tatari, O. Conventional, hybrid, plug-in hybrid or electric vehicles? State-based comparative carbon and energy footprint analysis in the United States. Appl. Energy 2015, 150, 36–49. [Google Scholar] [CrossRef]
- Charadsuksawat, A.; Laoonual, Y.; Chollacoop, N. Comparative Study of Hybrid Electric Vehicle and Conventional Vehicle Under New European Driving Cycle and Bangkok Driving Cycle. In Proceedings of the 2018 IEEE Transportation Electrification Conference and Expo, Asia-Pacific (ITEC Asia-Pacific), Bangkok, Thailand, 6–9 June 2018; pp. 1–6. [Google Scholar]
- Zhuang, W.; Li, S.; Zhang, X.; Kum, D.; Song, Z.; Yin, G.; Ju, F. A survey of powertrain configuration studies on hybrid electric vehicles. Appl. Energy 2020, 262, 114553. [Google Scholar] [CrossRef]
- Zhao, Z.; Lei, D.; Chen, J.; Li, H. Optimal control of mode transition for four-wheel-drive hybrid electric vehicle with dry dual-clutch transmission. Mech. Syst. Signal Process. 2018, 105, 68–89. [Google Scholar] [CrossRef]
- Liu, Y.; Chen, D.; Lei, Z.; Qin, D.; Zhang, Y.; Wu, R.; Luo, Y. Modeling and control of engine starting for a full hybrid electric vehicle based on system dynamic characteristics. Int. J. Automot. Technol. 2017, 18, 911–922. [Google Scholar] [CrossRef]
- Zeng, X.; Li, X.; Dong, B. Coordination Control Strategy for Mode Switching of a Parallel Hybrid Electric System Based on Continuously Variable Transmission. SAE Int. J. Commer. Veh. 2020, 13. [Google Scholar] [CrossRef]
- Zhuang, W.; Kum, D.; Peng, H.; Wang, L.; Li, D. Optimal Engine Starts of an Input-Split Hybrid Electric Vehicle. SAE Int. J. Altern. Powertrains 2015, 4, 343–351. [Google Scholar] [CrossRef]
- Zhao, Z.; Jiang, L.; Wang, C.; Li, M. Engine start-up optimal control for a compound power-split hybrid powertrain. Mech. Syst. Signal Process. 2019, 120, 365–377. [Google Scholar] [CrossRef]
- Yang, J.; Zhu, G.G. Adaptive Recursive Prediction of the Desired Torque of a Hybrid Powertrain. IEEE Trans. Veh. Technol. 2014, 64, 3402–3413. [Google Scholar] [CrossRef]
- Esfandyari, M.; Esfahanian, V.; Yazdi, M.H.; Nehzati, H.; Shekoofa, O. A new approach to consider the influence of aging state on Lithium-ion battery state of power estimation for hybrid electric vehicle. Energy 2019, 176, 505–520. [Google Scholar] [CrossRef]
- Wróblewski, P.; Drożdż, W.; Lewicki, W.; Miązek, P. Methodology for Assessing the Impact of Aperiodic Phenomena on the Energy Balance of Propulsion Engines in Vehicle Electromobility Systems for Given Areas. Energies 2021, 14, 2314. [Google Scholar] [CrossRef]
- Wróblewski, P.; Drożdż, W.; Lewicki, W.; Dowejko, J. Total Cost of Ownership and Its Potential Consequences for the Development of the Hydrogen Fuel Cell Powered Vehicle Market in Poland. Energies 2021, 14, 2131. [Google Scholar] [CrossRef]
- Gabbar, H.A.; Othman, A.M.; Abdussami, M.R. Review of Battery Management Systems (BMS) Development and Industrial Standards. Technologies 2021, 9, 28. [Google Scholar] [CrossRef]
- Zheng, F.; Jiang, J.; Sun, B.; Zhang, W.; Pecht, M. Temperature dependent power capability estimation of lithium-ion batteries for hybrid electric vehicles. Energy 2016, 113, 64–75. [Google Scholar] [CrossRef]
- Su, Y.; Su, L.; Hu, M.; Qin, D.; Fu, C.; Yu, H. Modeling and Dynamic Response Analysis of a Compound Power-Split Hybrid Electric Vehicle During the Engine Starting Process. IEEE Access 2020, 8, 186585–186598. [Google Scholar] [CrossRef]
- Daniela, T.; Enrica, M. Development of an on-line energy management strategy for hybrid electric vehicle. Energy Procedia 2018, 148, 106–113. [Google Scholar] [CrossRef]
- Karbowski, D.; Kwon, J.; Kim, N.; Rousseau, A. Instantaneously Optimized Controller for a Multimode Hybrid Electric Vehicle. SAE Tech. Pap. 2010. [Google Scholar] [CrossRef]
- Tan, F.; Yan, E. An Efficiency-Based Hybrid Mode Selection Model for A P134 Plug-In Hybrid Powertrain Architecture. SAE Tech. Pap. 2020. [Google Scholar] [CrossRef]
- Wang, H.; Sacheva, K.; Tripp, J.; Chen, B.; Robinette, D.; Shahbakhti, M. Optimal Map-Based Mode Selection and Powertrain Control for a Multi-Mode Plug-in Hybrid Electric Vehicle. In Proceedings of the 2018 14th IEEE/ASME International Conference on Mechatronic and Embedded Systems and Applications (MESA), Oulu, Finland, 2–4 July 2018; pp. 1–6. [Google Scholar]
- Hao, J.; Yu, Z.; Zhao, Z.; Shen, P.; Zhan, X. Optimization of Key Parameters of Energy Management Strategy for Hybrid Electric Vehicle Using DIRECT Algorithm. Energies 2016, 9, 997. [Google Scholar] [CrossRef]
- Winke, F. Transient Effects in Simulations of Hybrid Electric Drivetrains; Springer: Stuttgart, Deutschland, 2019. [Google Scholar]
- Onori, S.; Serrao, L.; Rizzoni, G. Hybrid Electric Vehicles: Energy Management Strategies; Springer: London, UK, 2016. [Google Scholar]
- Oncken, J.; Sachdeva, K.; Wang, H.; Chen, B. Integrated Predictive Powertrain Control for a Multi-Mode Plug-in Hybrid Electric Vehicle. IEEE/ASME Trans. Mechatron. 2021. [Google Scholar] [CrossRef]
- Ngo, V.D.; Navarrete, J.A.C.; Hofman, T.; Steinbuch, M.; Serrarens, A. Optimal gear shift strategies for fuel economy and driveability. Proc. Inst. Mech. Eng. Part D J. Automob. Eng. 2013, 227, 1398–1413. [Google Scholar] [CrossRef]
- Jacobson, B. Vehicle Dynamics Compendium for Course MMF062; Edition 2016; Chalmers University of Technology: Göteborg, Sweden, 2016. [Google Scholar]
- Ngo, D.V. Gear Shift Strategies for Automotive Transmissions. Ph.D. Thesis, Eindhoven University of Technology, Eindhoven, The Netherlands, 2012. [Google Scholar]
- Zhang, D. Vehicle Parameters Estimation and Driver Behavior Classification for Adaptive Shift Strategy of Heavy Duty Vehicles. Ph.D. Thesis, Clemson University, Clemson, SC, USA, 2017. [Google Scholar]
- Feola, M.; Martini, F.; Ubertini, S. An analytical model for hybrid vehicles design. SAE Tech. Paper 2005. [Google Scholar] [CrossRef]
- Teufelberger, P.; Yolga, M.; Ringdorfer, M.; Korsunsky, E. Optimised Control of a Dedicated Hybrid Transmission. MTZ Worldw. 2016, 77, 36–41. [Google Scholar] [CrossRef]
- Cai, Y.; Ouyang, M.; Yang, F. Energy management and design optimization for a series-parallel PHEV city bus. Int. J. Automot. Technol. 2017, 18, 473–487. [Google Scholar] [CrossRef]
Figure 1.
HEV powertrain configuration.
Figure 1.
HEV powertrain configuration.
Figure 3.
Fuel consumption rate map (unit: g/s).
Figure 3.
Fuel consumption rate map (unit: g/s).
Figure 4.
Motor efficiency map: (a) EM efficiency map; (b) ISG efficiency map.
Figure 4.
Motor efficiency map: (a) EM efficiency map; (b) ISG efficiency map.
Figure 5.
Battery model: (a) battery open circuit voltage; (b) battery internal resistance.
Figure 5.
Battery model: (a) battery open circuit voltage; (b) battery internal resistance.
Figure 7.
Powertrain control structure.
Figure 7.
Powertrain control structure.
Figure 8.
Analysis of the acceleration request.
Figure 8.
Analysis of the acceleration request.
Figure 9.
Acceleration reserve adjustment process.
Figure 9.
Acceleration reserve adjustment process.
Figure 10.
Overall efficiency calculation.
Figure 10.
Overall efficiency calculation.
Figure 11.
Mode selection strategy based on logic thresholds.
Figure 11.
Mode selection strategy based on logic thresholds.
Figure 12.
Driving cycles: (a) US06 cycle velocity; (b) FTP cycle velocity; (c) US06 cycle acceleration; (d) FTP cycle acceleration.
Figure 12.
Driving cycles: (a) US06 cycle velocity; (b) FTP cycle velocity; (c) US06 cycle acceleration; (d) FTP cycle acceleration.
Figure 13.
Results of LTB strategy under US06 cycle: (a) driving power; (b) battery power and engine power; (c) target operating mode.
Figure 13.
Results of LTB strategy under US06 cycle: (a) driving power; (b) battery power and engine power; (c) target operating mode.
Figure 14.
Acceleration reserves under the US06 cycle.
Figure 14.
Acceleration reserves under the US06 cycle.
Figure 15.
Results of AVPRB strategy under US06 cycle: (a) driving power; (b) battery power and engine power; (c) target operating mode.
Figure 15.
Results of AVPRB strategy under US06 cycle: (a) driving power; (b) battery power and engine power; (c) target operating mode.
Figure 16.
Driving power drop results under US06 cycle: (a) LTB strategy; (b) AVPRB strategy.
Figure 16.
Driving power drop results under US06 cycle: (a) LTB strategy; (b) AVPRB strategy.
Figure 17.
Fuel consumption and SOC of the two strategies under the US06 cycle: (a) fuel consumption; (b) SOC.
Figure 17.
Fuel consumption and SOC of the two strategies under the US06 cycle: (a) fuel consumption; (b) SOC.
Figure 18.
Battery power comparison between LTB strategy and proposed AVPRB strategy.
Figure 18.
Battery power comparison between LTB strategy and proposed AVPRB strategy.
Figure 19.
Acceleration reserves under the FTP cycle.
Figure 19.
Acceleration reserves under the FTP cycle.
Figure 20.
Driving power drop results under FTP cycle: (a) LTB strategy; (b) AVPRB strategy.
Figure 20.
Driving power drop results under FTP cycle: (a) LTB strategy; (b) AVPRB strategy.
Figure 21.
Fuel consumption and SOC of the two strategies under the FTP cycle: (a) fuel consumption; (b) SOC.
Figure 21.
Fuel consumption and SOC of the two strategies under the FTP cycle: (a) fuel consumption; (b) SOC.
Table 1.
HEV parameters.
| Component | Parameter | Value | Unit |
|---|
| Engine | Speed range | 1000~5500 | rpm |
| Maximum torque | 225 | Nm |
| Maximum power | 105 | kW |
| ISG | Speed range | 0~13,000 | rpm |
| Maximum torque | 96 | Nm |
| Maximum power | 93 | kW |
| EM | Speed range | 0~15,000 | rpm |
| Maximum torque | 300 | Nm |
| Maximum power | 135 | kW |
| Gearbox1 | Gear ratio | 2 | - |
| Gearbox2 | Gear ratio | 2.25 | - |
| Gearbox3 | Gear ratio | 11.5 | - |
| Battery | Capacity | 12.5 | kWh |
| Vehicle body | Mass | 2000 | kg |
| Front area | 2.6 | m2 |
| Wheel radius | 0.34 | m |
Table 2.
Variable power reserve adaption process variables.
Table 2.
Variable power reserve adaption process variables.
| Array | Description |
|---|
| Acceleration reserve |
| Maximum acceleration of vehicle |
| The number of times the acceleration request greater than the acceleration reserve |
| The number of times the acceleration request less than the acceleration reserve |
| The probability of acceleration requests less than the acceleration reserve |
| Acceleration reserve increment |
| Publisher’s Note: MDPI stays neutral with regard to jurisdictional claims in published maps and institutional affiliations. |
© 2021 by the authors. Licensee MDPI, Basel, Switzerland. This article is an open access article distributed under the terms and conditions of the Creative Commons Attribution (CC BY) license (https://creativecommons.org/licenses/by/4.0/).


