Article

Environmental Impact Evaluation of Current Municipal Solid Waste Treatments in India Using Life Cycle Assessment

by
Venkata Ravi Sankar Cheela
1,2,
Michele John
2,
Wahidul K. Biswas
2,* and
Brajesh Dubey
1
1
Environmental Engineering and Management, Department of Civil Engineering, Indian Institute of Technology Kharagpur, Kharagpur 721302, West Bengal, India
2
Sustainable Engineering Group, Curtin University, Perth 6102, Australia
*
Author to whom correspondence should be addressed.
Energies 2021, 14(11), 3133; https://doi.org/10.3390/en14113133
Submission received: 7 May 2021 / Revised: 25 May 2021 / Accepted: 25 May 2021 / Published: 27 May 2021
(This article belongs to the Special Issue Life Cycle Assessment of Environmental System)

Abstract

:
An environmental life cycle assessment was conducted to compare proposed municipal solid waste treatment systems with the existing system in Visakhapatnam, India. Five waste alternative treatment systems, including open dumping of municipal solid waste (S1), landfill without gas recovery [LFWGR] (S2), landfill with gas recovery (S3), anaerobic digestion + LFWGR (S4), and incineration + LFWGR (S5). EASETECHTM was considered for assessment using ReCiPE Midpoint (Heuristic) world environmental impact assessment method. Global warming potential (GWP), terrestrial acidification (TA), freshwater eutrophication (FEW), marine water eutrophication (ME), human toxicity (HTP), terrestrial ecotoxicity (TE), freshwater ecotoxicity (FWT), and marine ecotoxicity (MET) impacts were determined for each option. The existing MSW disposal practice in Visakhapatnam city (baseline scenario, S1) has the highest GWP (1107 kg CO2 eq.), which can potentially be reduced to 68.2%, 81.5%, 98.2%, and 94.5% by alternative waste management scenarios S2, S3, S4 and S5, respectively. Scenario S4, involving the use of anaerobic digestion of food waste and residues dumped in engineered landfill without energy recovery was found to be the option with the highest mitigation potential of most of the impacts, and it contributes to significant environmental benefits in terms of ecological footprints in a low-income country such as India. Sensitivity analysis was conducted to confirm the reasonable legitimacy of data used for the determination of the impacts.

Graphical Abstract

1. Introduction

Developing countries are increasingly facing significant problems with the unregulated disposal of municipal solid waste (MSW). Population growth, urbanization, demographic transfers, changes in consumption patterns, economic standards, and utilization of less biological products contribute to increasing waste quantities [1]. Improper waste management leads to environmental, economic, and social problems, but considering it as a resource can meet future energy demands [2]. India is an agriculture-based lower-middle income country, annually generating 62 million tons of waste; the waste collection efficiency is 70%, out of which 25–28% is treated using biological and thermal conversion technologies, and the balance is disposed of in an unlined landfill [3]. Waste management was a less prioritized issue in India until the formulation of MSW rules in 2000. The Swachh Bharath (Clean India) initiative in 2014 increased the awareness levels among people on MSW. Revision of MSW rules in 2016 steered local authorities to design and develop infrastructure to handle the increasing waste quantities [4]. The Ministry of Housing and Urban Affairs (MoHUA) estimated that the urban population will increase from 31.6% in 2011 to 40% by 2030 [5]. Rapid urban population growth increases stress on the existing waste infrastructure. Urban planning integrated with sustainable approaches is the solution to meet future demands [6]. The integration of circular economy approaches provides the scope to recover material and energy from MSW [7].
The availability of non-developed land made open dumping the cheapest method of disposal in India [8]. In unlined landfills, physical, chemical, and biological reactions generate leachate, which contaminates soil and water profiles [9,10]. Open burning of waste emits particulate matter (PM), greenhouse gases, and other toxic compounds. The type of emissions depends on the waste composition and burning conditions. Globally, open burning of waste accounts for 24% of PM10, 29% of PM2.5, and 43% of organic carbon out of the total anthropogenic emissions [11]. According to the World Resources Institute Climate Analysis Indicators Tool (WRI CAIT), greenhouse gas emissions in India increased from 1142 MtCO2 eq. (1990) to 3202 MtCO2 eq. (2014). Based on sector, emissions from the energy sector accounted for 68.7%, followed by agriculture 19.6%, industrial process 6.0%, land-use change and forestry 3.8%, and waste 1.9% of total emissions [12]. Decomposition of municipal solid waste is the third primary anthropogenic source of methane, contributing approximately 11% of total anthropogenic methane emissions [13]. India’s government developed a national action plan on climate in 2008 and devised mechanisms based on carbon policies to achieve the voluntary goal of reducing the emission intensity of a gross domestic product by 20–25% by 2020 over the 2005 level [14]. Council authorities are designing mechanisms to develop sustainable waste management strategies integrating biological (anaerobic digestion) and thermal (incineration) treatment systems to meet the needs of population growth and environmental standards [15]. Human health and environmental risks associated with the emissions from open dumping and burning lead to the public demand for waste management systems [16].
Life cycle assessment (LCA) is a system-based tool for quantifying potential environmental burdens associated with a product’s life cycle [17,18]. Over the past decade, LCA has been applied widely in waste management in Asian countries [2,19,20]. Khandelwala et al. [2] used LCA to assess the environmental impacts of four waste treatment scenarios for Nagpur, including recycling, composting, anaerobic digestion and landfilling, and concluded that the combination of all the treatment technologies is an optimum environmental management option. Similarly, Yadav et al. [19] compared four waste management scenarios in another Indian city of Dhanbad, including collection and transportation, composting, recycling and landfilling and also found that the combination of composting, recycling, and a landfill is an optimum option. Srivastava and Nema [21] assessed four waste management options—composting, recycling, incineration, and landfilling—for Delhi. Inventory data include quantity and composition of waste as inputs, and energy recovery, air and water emissions as outputs. The study concluded that recycling waste had low environmental impacts. Babu et al. [22] compared four landfill options—open dumping, landfilling with and without gas collection, and bio-reactor landfilling—for Bangalore city. Inventory data include fuel and electricity as inputs, and emissions from unit operations as outputs. Based on energy depletion potential, global warming potential, and eutrophication potential impact categories, the study concluded that bio-reactor landfilling had minimum impacts. Sharma and Chandel [23] assessed global warming, acidification, eutrophication, and human toxicity impact categories for six waste management scenarios for Mumbai. They have modeled treatment scenarios combining composting, anaerobic digestion, incineration, recycling, landfilling, and open dumping with bio-reactor landfilling. The study concluded that a combination of composting, anaerobic digestion, and a landfill is a preferable option. The reviewed studies performed LCA using generic software (SimaPro (PRé Sustainability, The Netherlands) of Gabi (Sphera Solutions GmbH, Leinfelden-Echterdingen, Germany).
At the forefront of sustainability for 30 years, focused on for evaluation of environmental impacts. However, in the present LCA software specific to waste management (EASETECH) is used for impact evaluation. According to various reports, the environmental impact of waste treatment technologies differs from region to region, owing to variation in waste composition and characteristics. The combination of waste treatment technologies needs to be designed specifically to regional conditions based on waste characteristics. Based on the review of LCA of MSW management in India, shown in Table 1; (a) impact analysis based on waste composition and characteristics in the Indian subcontinent is not performed, and (b) there is no study focusing on the southern region of India.
Visakhapatnam is an emerging metropolitan city in the northeast corner of Andhra Pradesh, India. Geographically, located between 17°31′42″–17°55′29″ northern latitude to 83°2′5″–83°25′17″ eastern longitude, the city is bestowed with a hot and humid climate. The city covers a local planning area of 625 sq km. The Greater Visakhapatnam Municipal Corporation (GVMC) is the concerned council authority for public health, solid waste management, and sanitation. The MSW generates about 1200 ± 100 MT of waste daily. The collected waste is disposed of in an unlined landfill located 22 km away from the city. The unlined landfill spread over 95 acres is surrounded by hills on three sides and a housing colony on the other side. The dumpsite is 0.5 km away from the national highway (NH-16), and it is within a 5 km radius from the sea (Bay of Bengal). With the implementation of the Clean India mission, Smart Cities, and the Solid Waste Management ruling of 2016, council authorities focused on developing scientific waste treatment systems to handle and treat MSW. An incineration unit of 15 MW capacity, sanitary landfill, an anaerobic digestion plant (start-up project), and compost units (50 tons/day) are under development.
The present study aims to apply the LCA approach, including the waste composition, characteristics, and southern India electricity mix, to assess the environmental profiles of different waste handling and management alternatives for the coastal city of Visakhapatnam, India. The scenarios include open dumping, landfilling with and without gas collection, anaerobic digestion, and incineration. The impact categories considered include global warming potential (GWP), terrestrial acidification (TA), freshwater eutrophication (FEW), marine water eutrophication (ME), human toxicity (HTP), terrestrial ecotoxicity (TE), freshwater ecotoxicity (FWT), and marine ecotoxicity (MET). The outcomes of this study will equip policymakers and administrators in planning and designing waste handling and management activities at a landfill.

2. Method and Materials

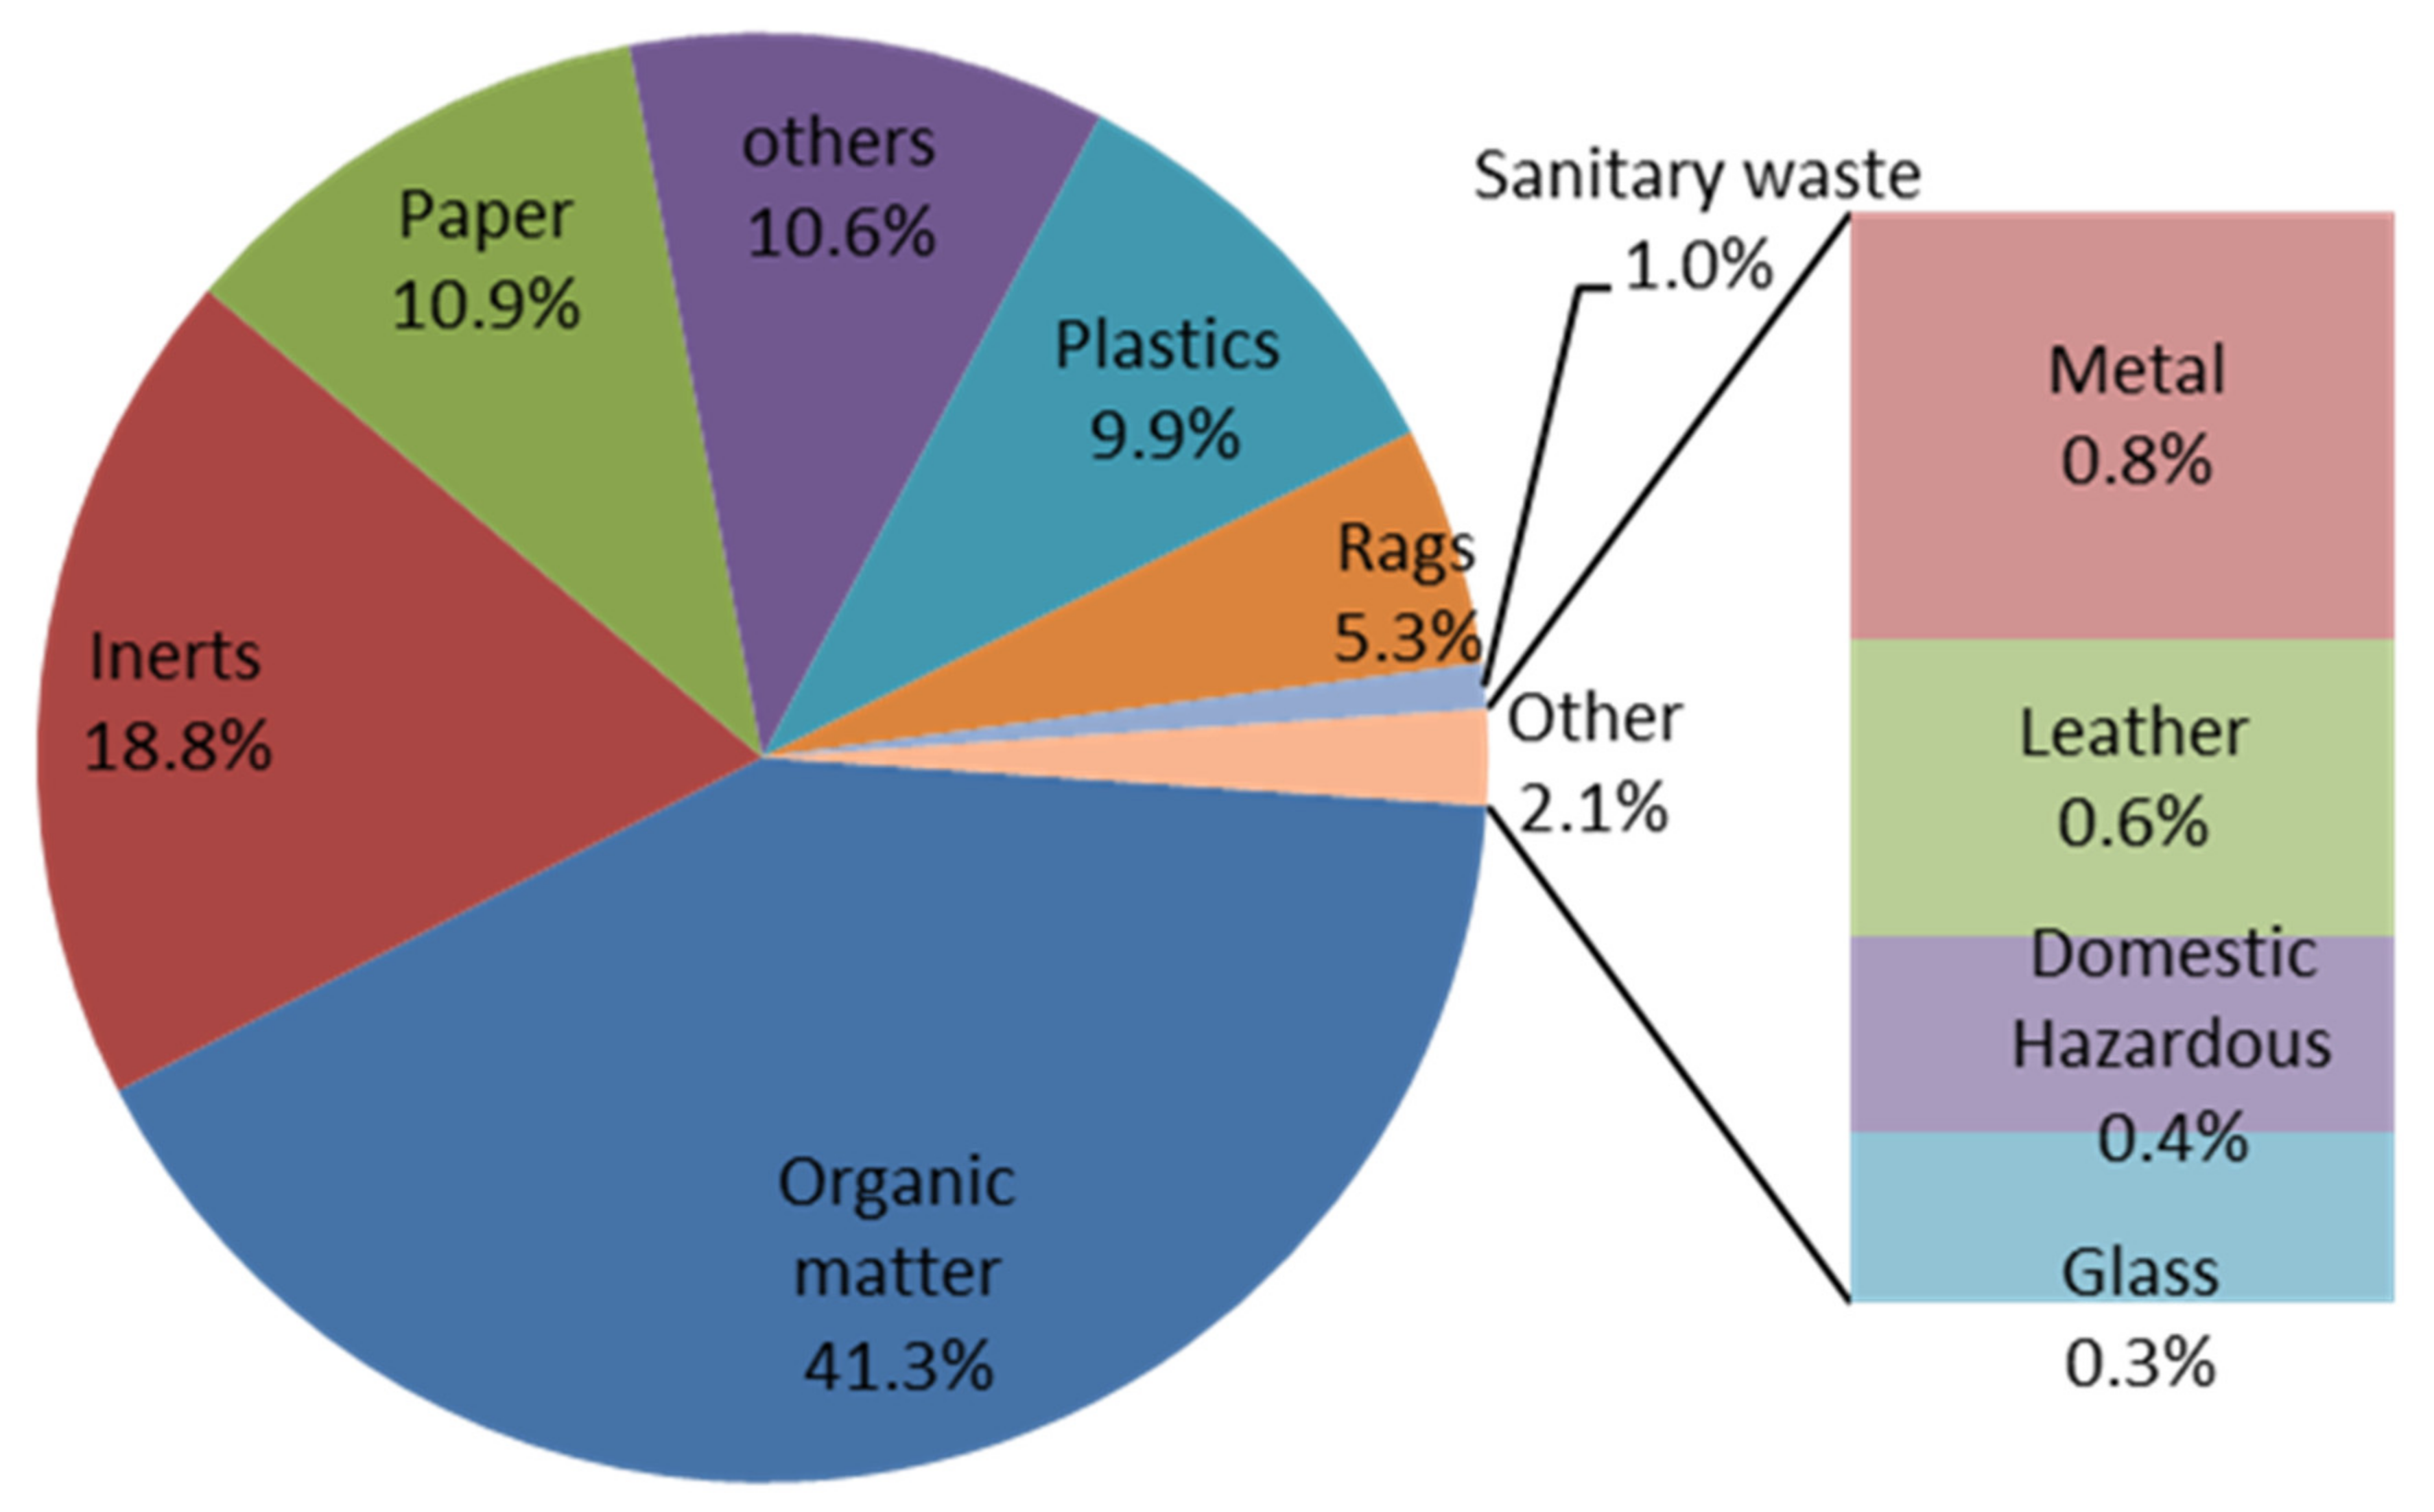
2.1. Waste Characterization

Waste sampling and characterization studies were performed following ASTM 5231D: 2016 [28] protocol. MSW samples were collected from vehicles arriving at an unlined landfill facility in Visakhapatnam (study area). Physicochemical characteristics of waste components were measured on the representative samples as per the standard codal provisions.

2.2. Scenarios Development for Waste Management Systems

The waste treatment alternatives, which were modeled to compare environmental impacts, were based on the physical and chemical composition of the waste generated in the study area, and are discussed below. The system boundaries of these treatments are presented in Figure 1.

2.2.1. Scenario (S1): Baseline Scenario: Unlined Landfill

This scenario corresponds to the existing MSW disposal practice in Visakhapatnam city. The waste collected by the GVMC is disposed of in an unlined landfill, which is 22 km from the city. The waste undergoes an anaerobic decomposition process emitting a potent greenhouse gas; methane. The interaction of waste with rainwater and the moisture generated during the decomposition process produces toxic liquid leachate.

2.2.2. Scenario (S2): Engineered Landfill without Energy Recovery

In this scenario, waste is disposed of in an engineered landfill, including leachate treatment and gas collection systems, but does not convert methane to electricity. Gas generated is collected and flared before releasing into the atmosphere. The amount of landfill gas (LFG) produced was estimated by the first-order degradation model recommended by the IPCC. The projected collection efficiency of LFG for the design period was assumed to be 60% [29,30]. The surface oxidation efficiency of methane from fugitive emissions was between 15% and 20% [31]. The total electrical power consumption for leachate treatment was 25–30 kWh/ton.

2.2.3. Scenario (S3): Engineered Landfill with Energy Recovery

In this scenario, waste is disposed of in an engineered landfill, equipped with an energy recovery arrangement (i.e., conversion of methane to electricity) and a leachate treatment facility. The electricity generation from the LFG will be developed to meet the energy demand. The efficiency of power generation was expected to be 30% [23]. The collection efficiency of LFG and energy consumption in leachate treatment were assumed to be the same as those in S2. The only difference between S2 and S3 is energy recovery, i.e., the gas collected is used for electricity generation instead of flaring.

2.2.4. Scenario (S4): Anaerobic Digestion of Food Waste and Residues Dumped in Engineered Landfill without Energy Recovery

In this scenario, the organic fraction of waste is segregated and sent to an anaerobic digestion (AD) unit. The remaining waste is disposed of in an engineered landfill without energy recovery. Leachate treatment and gas collection systems are included. The gas collected will be flared before released into the atmosphere. During the AD process, biogas produced will be collected to generate electricity with a conversion efficiency of 30% [23]. The collection efficiency of the biogas produced was assumed to be 95% [31]. The biogas slurry produced will be treated using the same treatment process to treat the leachate in the previous scenario. The digestive residue is applied to land as a replacement for mineral fertilizer.

2.2.5. Scenario (S5): Incineration with Energy Recovery and Residues Dumped in an Inert Landfill

The government of India is planning to develop incineration plants to meet the energy demands of the country. Organic fraction is the major component of the MSW, with the moisture content ranging between 30–35% and the calorific value between 1200 and 1400 kcal/kg, which is less than the required calorific value (1500 kcal/kg), to utilize feedstock as a fuel source for incineration [32]. In this scenario, moving grate incineration was considered to treat the waste collected. This process is efficient in handling waste with high moisture content and a low calorific value. It is estimated that 15% of the water is drained as leachate. The amount of incinerated bottom ash (IBA) produced is approximately 20–23% by weight of the MSW [33]. The IBA is stabilized before landfilling to reduce the impacts of heavy metals. Treatment of process water from incineration is included in this scenario. The collection efficiency of LFG and energy consumption in leachate treatment were assumed to be the same as those in S2.

2.3. Life Cycle Assessment

The study followed the four steps outlined in the ISO 14040-44:2006 standards [34,35] in performing an LCA analysis, including goal and scope, life cycle inventory (LCI), life cycle impact assessment (LCIA), and interpretation.

2.3.1. Goal and Scope Definition

The goal of this study is to compare different MSW management alternatives from a life cycle perspective. The study’s functional unit was the management of one ton of generated MSW in Visakhapatnam city, Andhra Pradesh (India). The functional unit was chosen to compare the alternative scenarios considered with similar studies. This analysis assumes an integrated waste management plan (IWMP) developed at the landfill site. Scenarios were developed by considering anaerobic digestion, incineration, and engineered landfilling (with and without energy recovery). The impacts of collecting and transporting waste to the landfill for the treatment were assumed to remain the same for all scenarios developed, as the treatment units are located at the same waste management facility. Emissions associated with energy generation to manufacture heavy equipment and capital goods were not considered in the LCA modeling used in these studies [36,37]. Methane and carbon dioxide generation rates were estimated using a first-order decay rate model based on the material fraction elemental composition of waste and associated decay rates. The amount of leachate generated was determined using the infiltration rate, waste layer height, and bulk density [38]. In the present study, environmental assessment was performed to handle and manage 1 ton of MSW in the study area. The waste is received at the waste facility and the complete waste is treated using the combination of treatment technologies presented in the scenarios provided. The total environmental credits given to these scenarios also considered their ability to produce useful products (slurry with fertilizer, energy from incineration with grid electricity). The system boundary ends once the wastes have been treated enabling the determination of its environmental management performance. Hence, the allocation was not considered in the present study.

2.3.2. Life Cycle Inventory Data

Life cycle inventory (LCI) is a prerequisite to carry out an environmental impact assessment. LCI quantifies the amount of inputs in terms of material and energy and outputs in terms of emissions and wastes during the life cycle stages of waste management systems. The inventory dataset is used to develop the flow of inputs and outputs through the life cycle stages.

Landfill

A dataset for the engineered landfill with gas flaring and energy recovery systems was adopted from the default technologies available in the EASETECH database (developed by the Technical University of Denmark, 2020, EASETECH v3.7-LCA-model for assessment of environmental technologies), due to the unavailability of Indian-specific landfill gas flaring and energy conversion systems datasets for different geographic locations. Collection and utilization of gas were assumed to happen over 55 years, and then no collection was considered over the next 45 years, but oxidation of gas is expected to happen in the top layer [39]. Leachate collection and treatment were considered based on the dataset provided in Bassi et al. [40]. The input data used for modeling this system are shown in Table 2.

Anaerobic Digestion and Compost Land Application

Anaerobic digestion of organic waste was modeled based on the biphasic wet-digester-based systems implemented in India [45]. Anaerobic digestion technology available in the EASETECH database was used for modeling, and inputs were optimized for Indian conditions. The plant parameters used in modeling are volatile solids (i.e., 70% of the food waste degradation); methane content in biogas (63%); methane leakage from the digester (2%); and the efficiency of converting biogas to electricity (35%) [31]. The digested slurry was composted on-site and applied to land. Land application assumes that the compost will replace 100% for potassium and phosphorous and only 20% for nitrogen [46]. Water emissions are not included in the system, as it is assumed that they are recirculated to the reactor to enhance the degradation process [23]. Windrow composting (biological treatment method for producing compost by piling organic waste in long rows) was modeled using the parameters, including food waste degradation (75%), loss of volatile solids (75%), carbon (77%), and nitrogen (8%), during the process [19,23]. The input data used for modeling this system are shown in Table 2.

Incineration Unit

The incineration plant was modeled based on the mass-burn incineration technology available in the EASETECH database. The ancillary materials used in modeling the incineration plant have been shown in Table 2. The emissions are evaluated based on the waste dataset’s physical and chemical characteristics inputted into the EASETECH software. The amount of electricity used for leachate treatment and the amount of electricity substituted by the LFG electricity were modeled based on India’s average electricity mix [47]. The net electrical efficiency was considered to be 20%, based on a moving grate type incineration plant located in Timarpur, New Delhi [48]. The IBA generated was considered to be disposed of in a landfill, as it was in S2.

2.3.3. Life Cycle Impact Assessment

EASETECH allows for the conversion of inputs and outputs to environmental impacts on air, soil, and water components by modeling contaminants on mass flow (input-specific) and process-specific approaches [49]. The advantage of this software compared to generic LCA software (ex SimaPro) is that it has especially been designed for MSW, as it allows them to incorporate material flow modeling of MSW fractions [17]. Accordingly, the software allows the use of information on a variety of waste compositions and a range of processes involved in waste treatment, in order to calculate environmental impacts for a range of waste management scenarios. As shown in Figure 2, the flow layer contains the physico-chemical characteristics (e.g., the composition of substances, heating value, volatile solid content) of a possible amount of municipal waste usually generated in a residential area. As this municipal solid waste could vary across regions, the waste composition of Visakhapatnam was incorporated into this software, enabling it to calculate the location-specific emissions associated with the treatment of waste for five different waste management scenarios considered in this LCA analysis. The software has in-built databases for external processes, allowing it to calculate the emissions associated with the production of inputs (e.g., energy, water, chemicals) required to operate the waste treatment processes (e.g., anaerobic digestion, incineration). Finally, there are also emissions and waste generation from operating treatment processes (e.g., IBA, dioxin, CO2 generation from incineration, CH4 from anaerobic digestion). Therefore, emissions and waste created during the following events create LCI of emissions (i.e., the second layer of Figure 2).
Once the emissions have been calculated resulting from the five waste management scenarios, they were classified in terms of impacts (e.g., CO2 for global warming potential, SO2 for acidification, C2H2 for photochemical smog). Once these emissions had been classified, they were characterized (Figure 2) by converting the gases causing a particular impact to an equivalent amount of a gas representing this particular impact (e.g., CO2, N2O, and CH4 are converted to an equivalent amount of CO2, SOx and NO are converted to an equivalent amount of SO2). The reference time horizon for global warming potential is considered as 100 years, as it is a reference time frame for climate change policy [50]. For impacts associated with the acidification, toxicity impact categories have a large magnitude of impact on future generations over a long-time horizon (>100 years) [51]. In this study, the time horizon of 100 years was set to determine the inventory. ReCiPE Midpoint (Heuristic) world model was used to determine the characterized environmental profiles of the alternatives. ReCiPe 2016 impact assessment methodology provides a hierarchical perspective with 100-year time horizons, and includes a higher number of midpoint indicators at a global scale [52]. The impact categories include both non-toxic and toxic impact categories, but water and land use were excluded from the study as they depend on the geographic location [39]. The impact categories were identified by reviewing LCA studies conducted in the Indian scenarios (Table 1), and are listed in Table 3. Sensitivity analysis was performed by varying the waste sorting efficiency from 10% to 100% at a step interval of 10. The percentage variations in the global warming potential were evaluated for S4 and S5 scenarios.

2.3.4. Uncertainty Analysis

Uncertainties are associated with the inventory data used for determining the environmental impacts of waste treatment alternatives for the management of MSW. In this analysis, material properties and process parameter datasets were developed for the Indian context; validation ensures that the LCA results are not affected by uncertainties in the database. Monte Carlo simulation (MCS) was performed for each dataset to estimate these uncertainties. The MCS was performed for 1000 iterations at a 95% confidence level, using the input value to produce a distribution [49,53]. The statistical parameters mean, standard deviation, and coefficient of variance were determined for the alternative scenarios.

2.3.5. Comparative Analysis of Scenarios

Identification of better treatment alternatives was performed by ranking each alternative based on the evaluated environmental impacts. Individual ranks were given to the treatment alternatives for each impact category. The treatment alternative with the lowest environmental impact was identified and recommended.

3. Results and Discussion

3.1. Physicochemical Characteristics of MSW

The physicochemical characteristics of MSW collected by the first author were determined as a part of this research. The MSW mainly consists of organic matter (41.3%), inert material (18.8%), paper (10.9%), and plastic (9.9%), and the remaining waste components constitute (19.1%). The physical characteristics of the MSW are shown in Figure 3. Food and yard waste are the major contributing components to organic waste. The inert and other components consist of sand, silt, dust, grit, ash, inseparable paper, food residues, street sweeping waste, drain cleaning waste, and construction debris. Based on the chemical characterization of MSW, the moisture content varies between 28% and 35%, volatile solids between 39% and 43%, carbon content between 20% and 28%, oxygen between 14% and 22%, hydrogen between 25% and 5.5%, both sulfur and nitrogen constitute 2%, and calorific value ranges between 5680 and 7110 kJ/kg (1360–1700 kcal/kg).

3.2. Life Cycle Impact Assessment Results

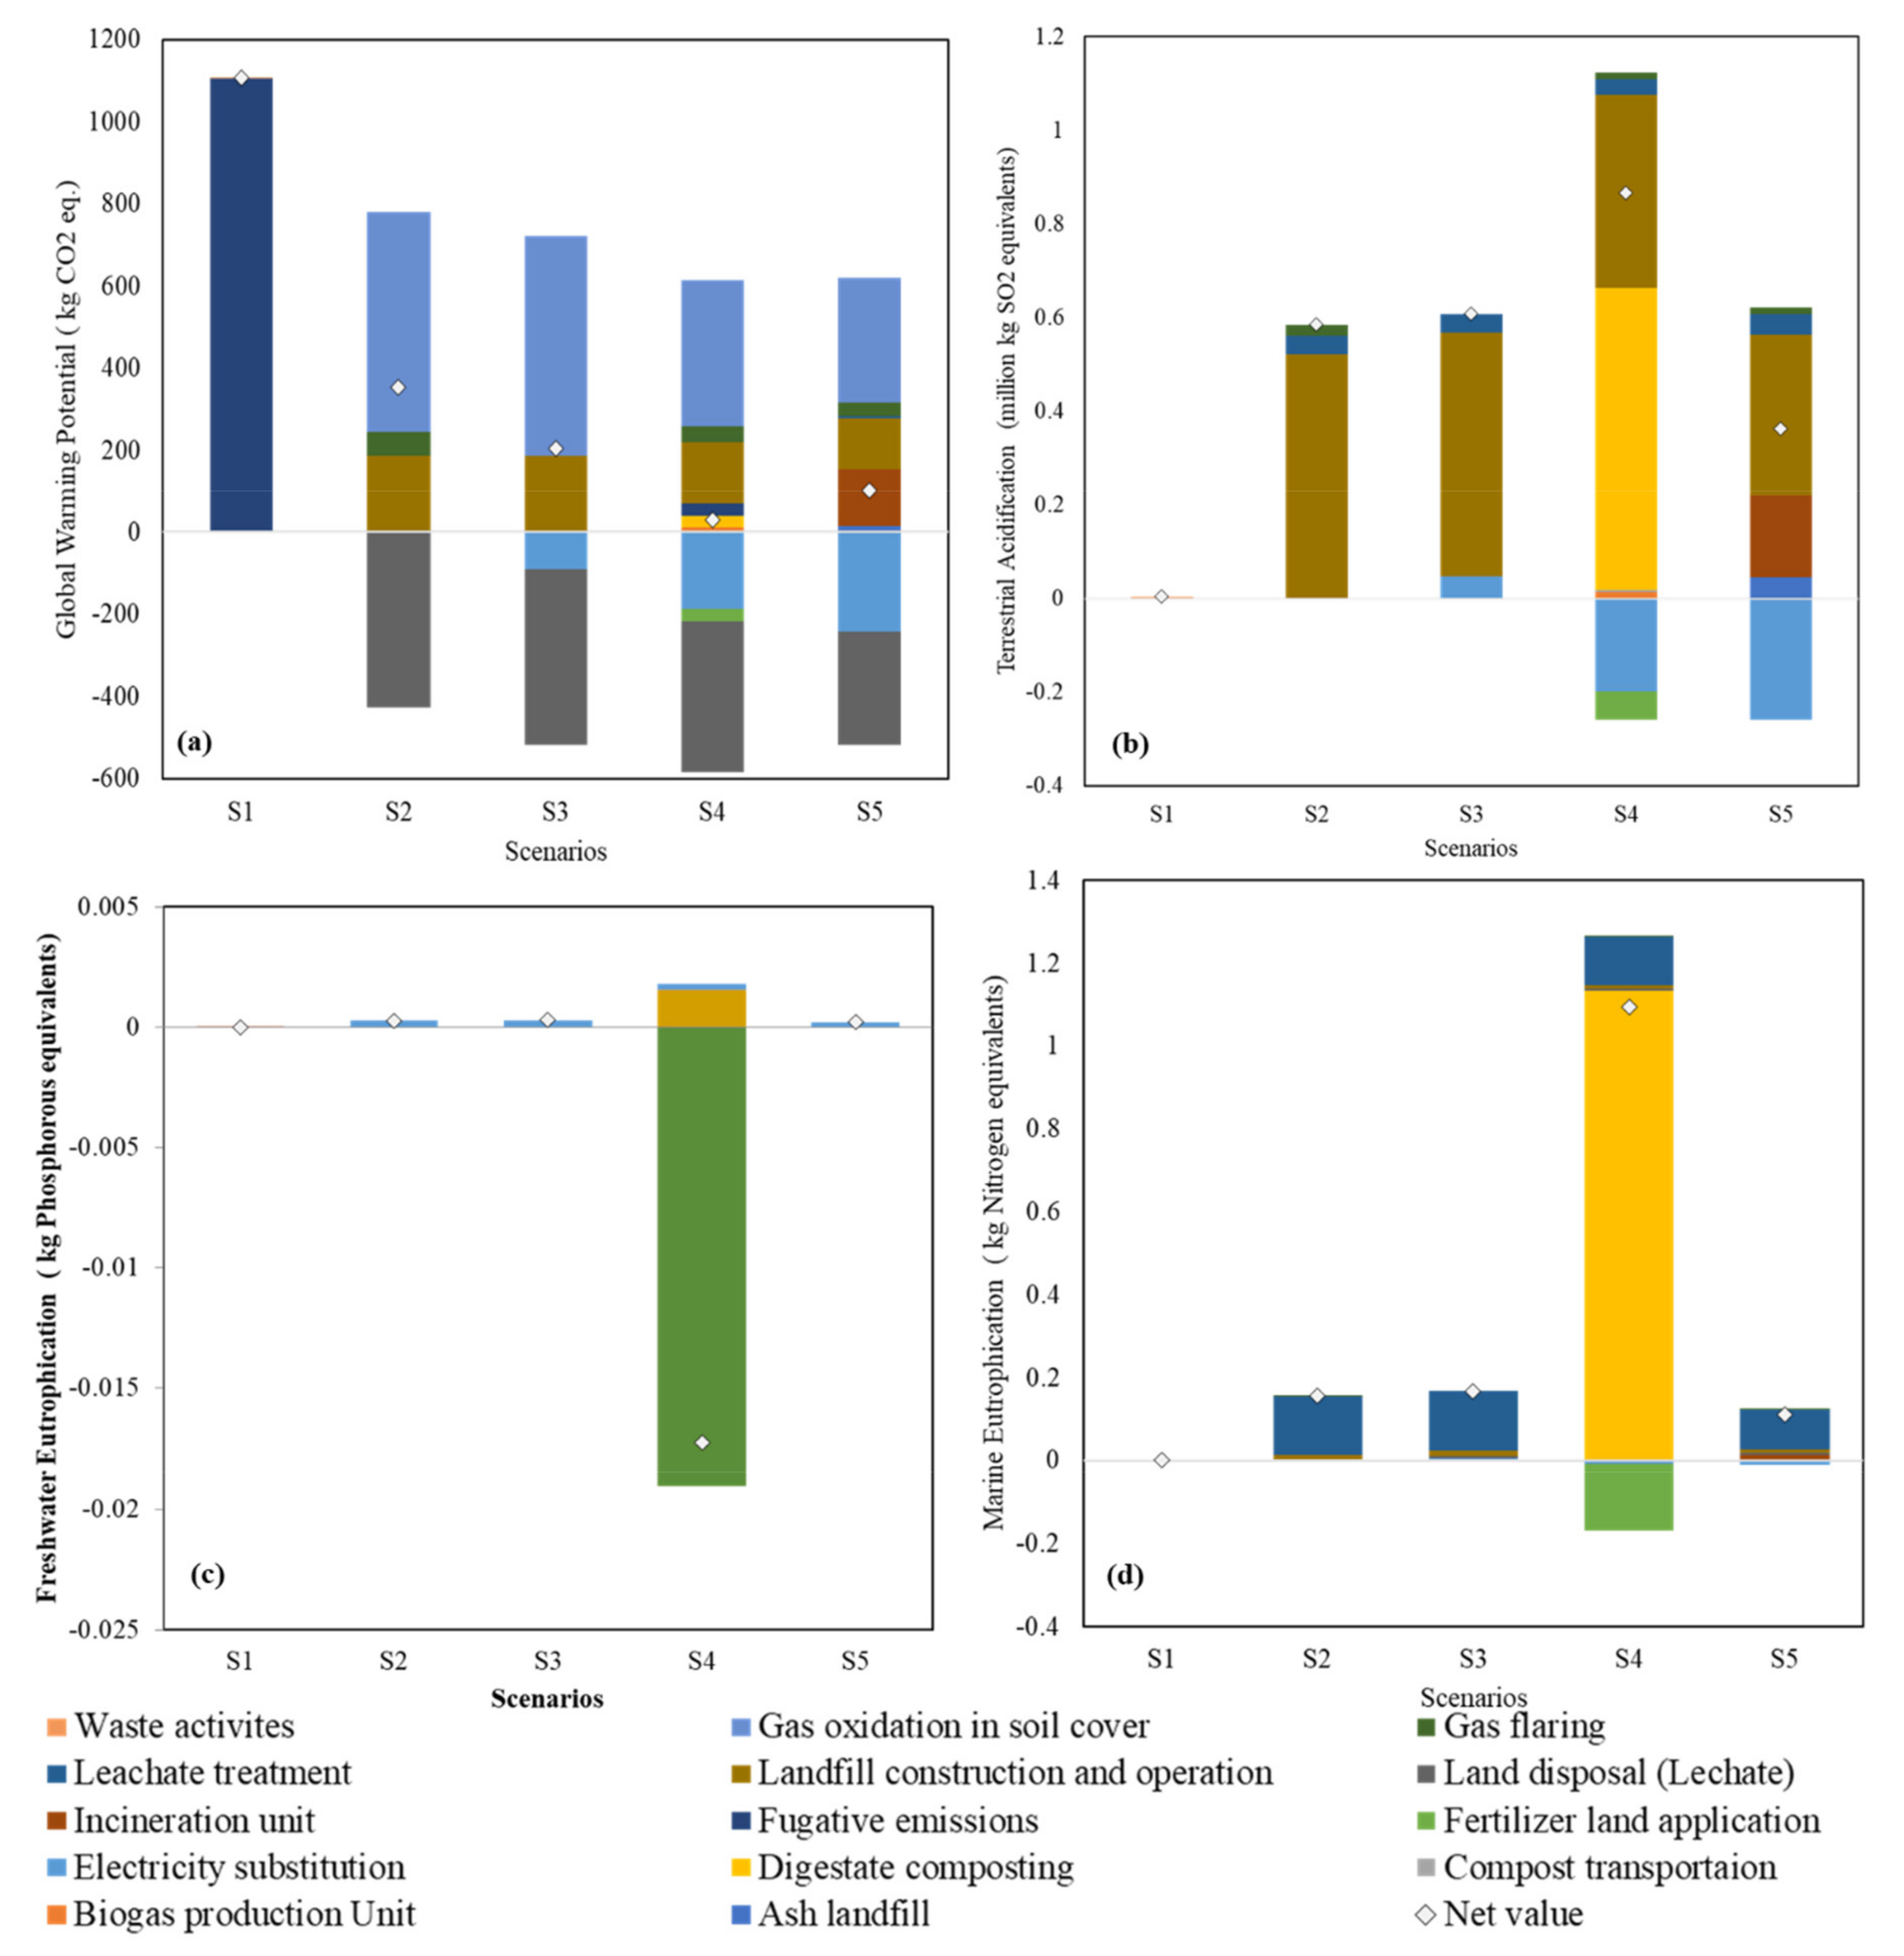
3.2.1. Global Warming Potential

Environmental impacts associated with GWP are quantified in terms of kg CO2 equivalent, are shown in Figure 4a. The baseline scenario (S1) has the highest global warming potential with a net value of 1107 kg CO2 eq. About 99% of the total emissions are due to fugitive emissions. The continuous release of methane into the atmosphere due to the anaerobic decomposition of waste contributes to the impact category’s environmental emissions. The remaining 1% of emissions are due to waste leveling, compaction, and transportation (within landfill facility) activities. Compared to scenario S1, the reduction in GHG emissions in S2 is by 68.2%, in S3 by 81.5%, in S4 by 98.2%, and in S5 by 94.5%. Landfill construction and operation, leachate collection, and management processes contribute to GHG in S2 and S3. The collection and transportation of MSW to the integrated waste facility contributes to 9.393 kg CO2 eq.
In Scenario S2, the net GWP is 352.6 kg CO2 eq. The waste process contribution to the emissions in this impact category is oxidation of gas in landfill (68.7%), landfill construction activities (23.8%), and gas flaring (7.4%). The major contributing gases in this scenario include methane (76.3%), carbon dioxide (23.5%), and nitrous oxide (0.2%). The disposal of treated leachate onto land is an emission-offsetting parameter due to the sequestering of carbon and heavy metals. In Scenario S3, net GWP is 204.8 kg CO2 eq. The waste process contribution to the emissions in this impact category is gas oxidation in landfills (74.3%) and landfill construction activities (25.7%). The major contributing gases in this scenario include methane (74.6%), carbon dioxide (25.3%), and nitrous oxide (0.1%). The disposal of treated leachate onto land reduces emissions by 82.6%, while the substitution of grid electricity with LFG electricity reduced the emissions by 17.4%. In addition, the utilization of landfill gas (i.e., methane, which is 28 times stronger than CO2 in causing global warming) for energy substitution further reduced the GHG emissions compared to S2, which flared this methane gas.
In Scenario S4, net GWP is 30.11 kg CO2 eq. This scenario is a combination of anaerobic digestion and landfill without energy recovery. The former contributes to environmental savings (−145.6 kg CO2 eq.) while the latter contributes to environmental emissions (175.7 kg CO2 eq.). The waste process contribution to the emissions includes oxidation of gas in landfill (58.2%), landfill construction activities (24%), gas flaring (6.4%), digestate fugitive emissions (4.9%), composting (4.7%), and biogas unit (1.8%). The major contributing gases include methane (72.6%), carbon dioxide (25%), and nitrous oxide (2.4%). The anaerobic digestion unit process contributes to methane (67.8% of overall emissions), nitrous oxide (30.7%), and carbon dioxide (1.5%). Composting of digestate obtained from the anaerobic digestion process is a major contributing process to nitrous oxide. The disposal of treated leachate onto land, grid electricity substitution, and the land application of compost accounted for emissions reductions in S3 of 62.9%, 31.8%, and 5.3%, respectively. The emissions associated with biogenic carbon during compost land application are not included. Utilization of biogas generated from anaerobic degradation of organic matter as electricity substitution contributes to environmental savings of 185.7 kg CO2 eq. per ton. However, the biogas unit’s electricity consumption and fugitive emissions (methane leakage) contributed to 10.5 kg CO2 eq. and 30.1 kg CO2 eq., respectively. The composting process for the treatment of digestate contributes to environmental emissions by 28.9 kg CO2 eq., while land application of compost reduces the emissions by 30.7 CO2 eq.
In Scenario S5, net GWP is 101.4 kg CO2 eq. This scenario is a combination of incineration and landfill without energy recovery. The former process contributes to 139 kg CO2 eq. and later contributes to 183.3 kg CO2 eq. emissions. The waste process contribution to the emissions includes landfill construction activities (22.4%), oxidation of gas in landfill (46.6%), incineration unit (24.8%), gas flaring (5%), and leachate treatment (1.2%). The major contributing gases include methane (52.3%), carbon dioxide (47.6%), and nitrous oxide (0.1%). Gas flaring systems in the landfill unit process is the major contributing process for methane. The disposal of treated leachate onto land and grid electricity substitution contributes to 46.6% and 53.4% of emissions reductions, respectively.
Based on the GWP impact category, the order of scenarios contributing to GHG emissions is S2, S3, S5, and S4. Anaerobic digestion and landfill without energy recovery have been found to be best GHG-reducing option.

3.2.2. Terrestrial Acidification

The environmental impacts associated with TA quantified in terms of kg SO2 equivalents are shown in Figure 4b. In the baseline scenario (S1), the net value of TA is 0.004 kg SO2 eq. Waste handling activities (compacting, leveling, and internal transport) at the dumping site contribute to environmental emissions. In scenario S2, the net value for the TA impact category is 0.584 kg SO2 eq. The major emission-contributing waste processes are construction and the operation of the landfill (89.1%), leachate treatment (6.8%), and gas flaring (4.1%). In this scenario, nitrogen oxide (60%), sulfur dioxide (39.8%), and ammonia (0.2%) are the main TA-contributing gases. In scenario S3, the TA impact category’s net value is 0.017 PE (0.610 kg SO2 eq.). The waste processes contributing to TA are the construction and operation of landfills (85.7%), energy conversion systems (7.7%), and leachate treatment (6.6%). In this scenario, sulfur dioxide (67.6%) and nitrogen oxides (32.4%) are the dominant TA-contributing gases. In scenario S4, the net value for the TA impact category is 0.865 kg SO2 eq. The major emission-contributing processes include construction and operation of landfill (36.8%) and digestate composting (57.4%). Compost land application and grid electricity substitution reduce emissions by 23% and 77%, respectively. Emission-contributing gases from the above unit processes are ammonia (59.7%), sulfur dioxide (25.9%), and nitrogen oxides (14.5%). The digestate composting process contributes to 81.9% of overall ammonia emissions, 17.8% of nitrogen oxide, and 0.3% of sulfur oxide emissions. In scenario S5, the net value for the TA impact category is 0.362 kg SO2 eq. The major emission-contributing waste processes include the construction and operation of landfill (48.8%) and incineration unit (33.2%). The grid electricity substitution is found to be the only emission-offsetting unit process in this scenario. Emission-contributing gases from the above processes are sulfur dioxide (42.7%), nitrogen oxides (57.2%), and ammonia (0.1%).
Based on the TA impact category, the order of scenarios is S4, S3, S2 and S5. Incineration and landfill without energy recovery have been found to be the best option for this impact category. The collection and transportation of MSW to the integrated waste facility contribute to 0.051 kg SO2 eq.

3.2.3. Fresh Water and Marine Eutrophication

Environmental impacts associated with FEW and ME are quantified in terms of kg-phosphorus, and kg-nitrogen equivalents are shown in Figure 4c,d. In the baseline scenario (S1), the net value in all the impact categories is negligible. In FEW impact categories, for scenario S2 the net value is 3.0 × 10⁻⁴ kg-P eq. The major emission-contributing waste processes are leachate treatment (99.5%) and landfill construction and operation (0.5%). In S3, the net value is 3.1 × 10⁻⁴ kg-P eq. The major emission-contributing waste processes are leachate treatment (91.8%), leachate disposal (7.7%), and construction and operation of landfill (0.5%). The electricity substitution is the emission-offsetting unit process in this scenario. In S4, net value is −1.7 × 10⁻² kg-P eq. The major emission-contributing waste processes are digestate composting (86.3%), leachate treatment (12.4%), leachate disposal, and construction and operation of landfill (1.3%). Composting activity is the major emission-offsetting strategy, while electricity substitution has a negligible impact. In S5, net value is 2.0 × 10⁻⁴ kg-P eq. The major emission-contributing waste processes are leachate treatment (86.7%), leachate disposal (7.3%), ash landfill (4.4%), incineration unit (1.2%), and construction and operation of landfill (0.4%). The electricity substitution is the main emission-reducing unit process in this scenario.
Based on the FEW impact category, the order of scenarios is as follows, S3, S2, S5 and S4. Anaerobic digestion and landfill without energy recovery have been found to be the best option. The collection and transportation of MSW to the integrated waste facility contribute to 8.1 × 10⁻⁶ units.
In the ME impact category, for scenario S2, net value is 0.163 kg-N eq. The major emission-contributing waste processes are leachate treatment (91%), construction and operation of landfill (8.3%), and gas flaring (0.7%). In S3, the net value is 0.167 kg-N eq. The major emission-contributing waste processes are leachate treatment (85.3%), construction and operation of landfill (7.8%), leachate disposal (3.8%), and electricity substitution (3.0%). In S4, the net value is 1.095 kg-N eq. Digestate composting is the single major contributor (89.5%) to ME. Compost land application (95%) and electricity substitution (5%) are the emission-offsetting unit processes. In S5, the net value is 0.012 kg-N eq. The major emission-contributing waste processes are leachate treatment (75.8%), incineration unit (12.3%), construction and operation of landfill (6.7%), leachate disposal (3.4%), ash landfill (1.3), and gas flaring (0.5%). The electricity substitution is the emission-reducing unit process in this scenario. Based on the ME impact category, the order of scenarios contributing to environmental emissions is S4, S3, S2, and S5. Incineration and landfill without energy recovery has been found to be the best option. The collection and transportation of MSW to the integrated waste facility contribute to 0.0036 units.

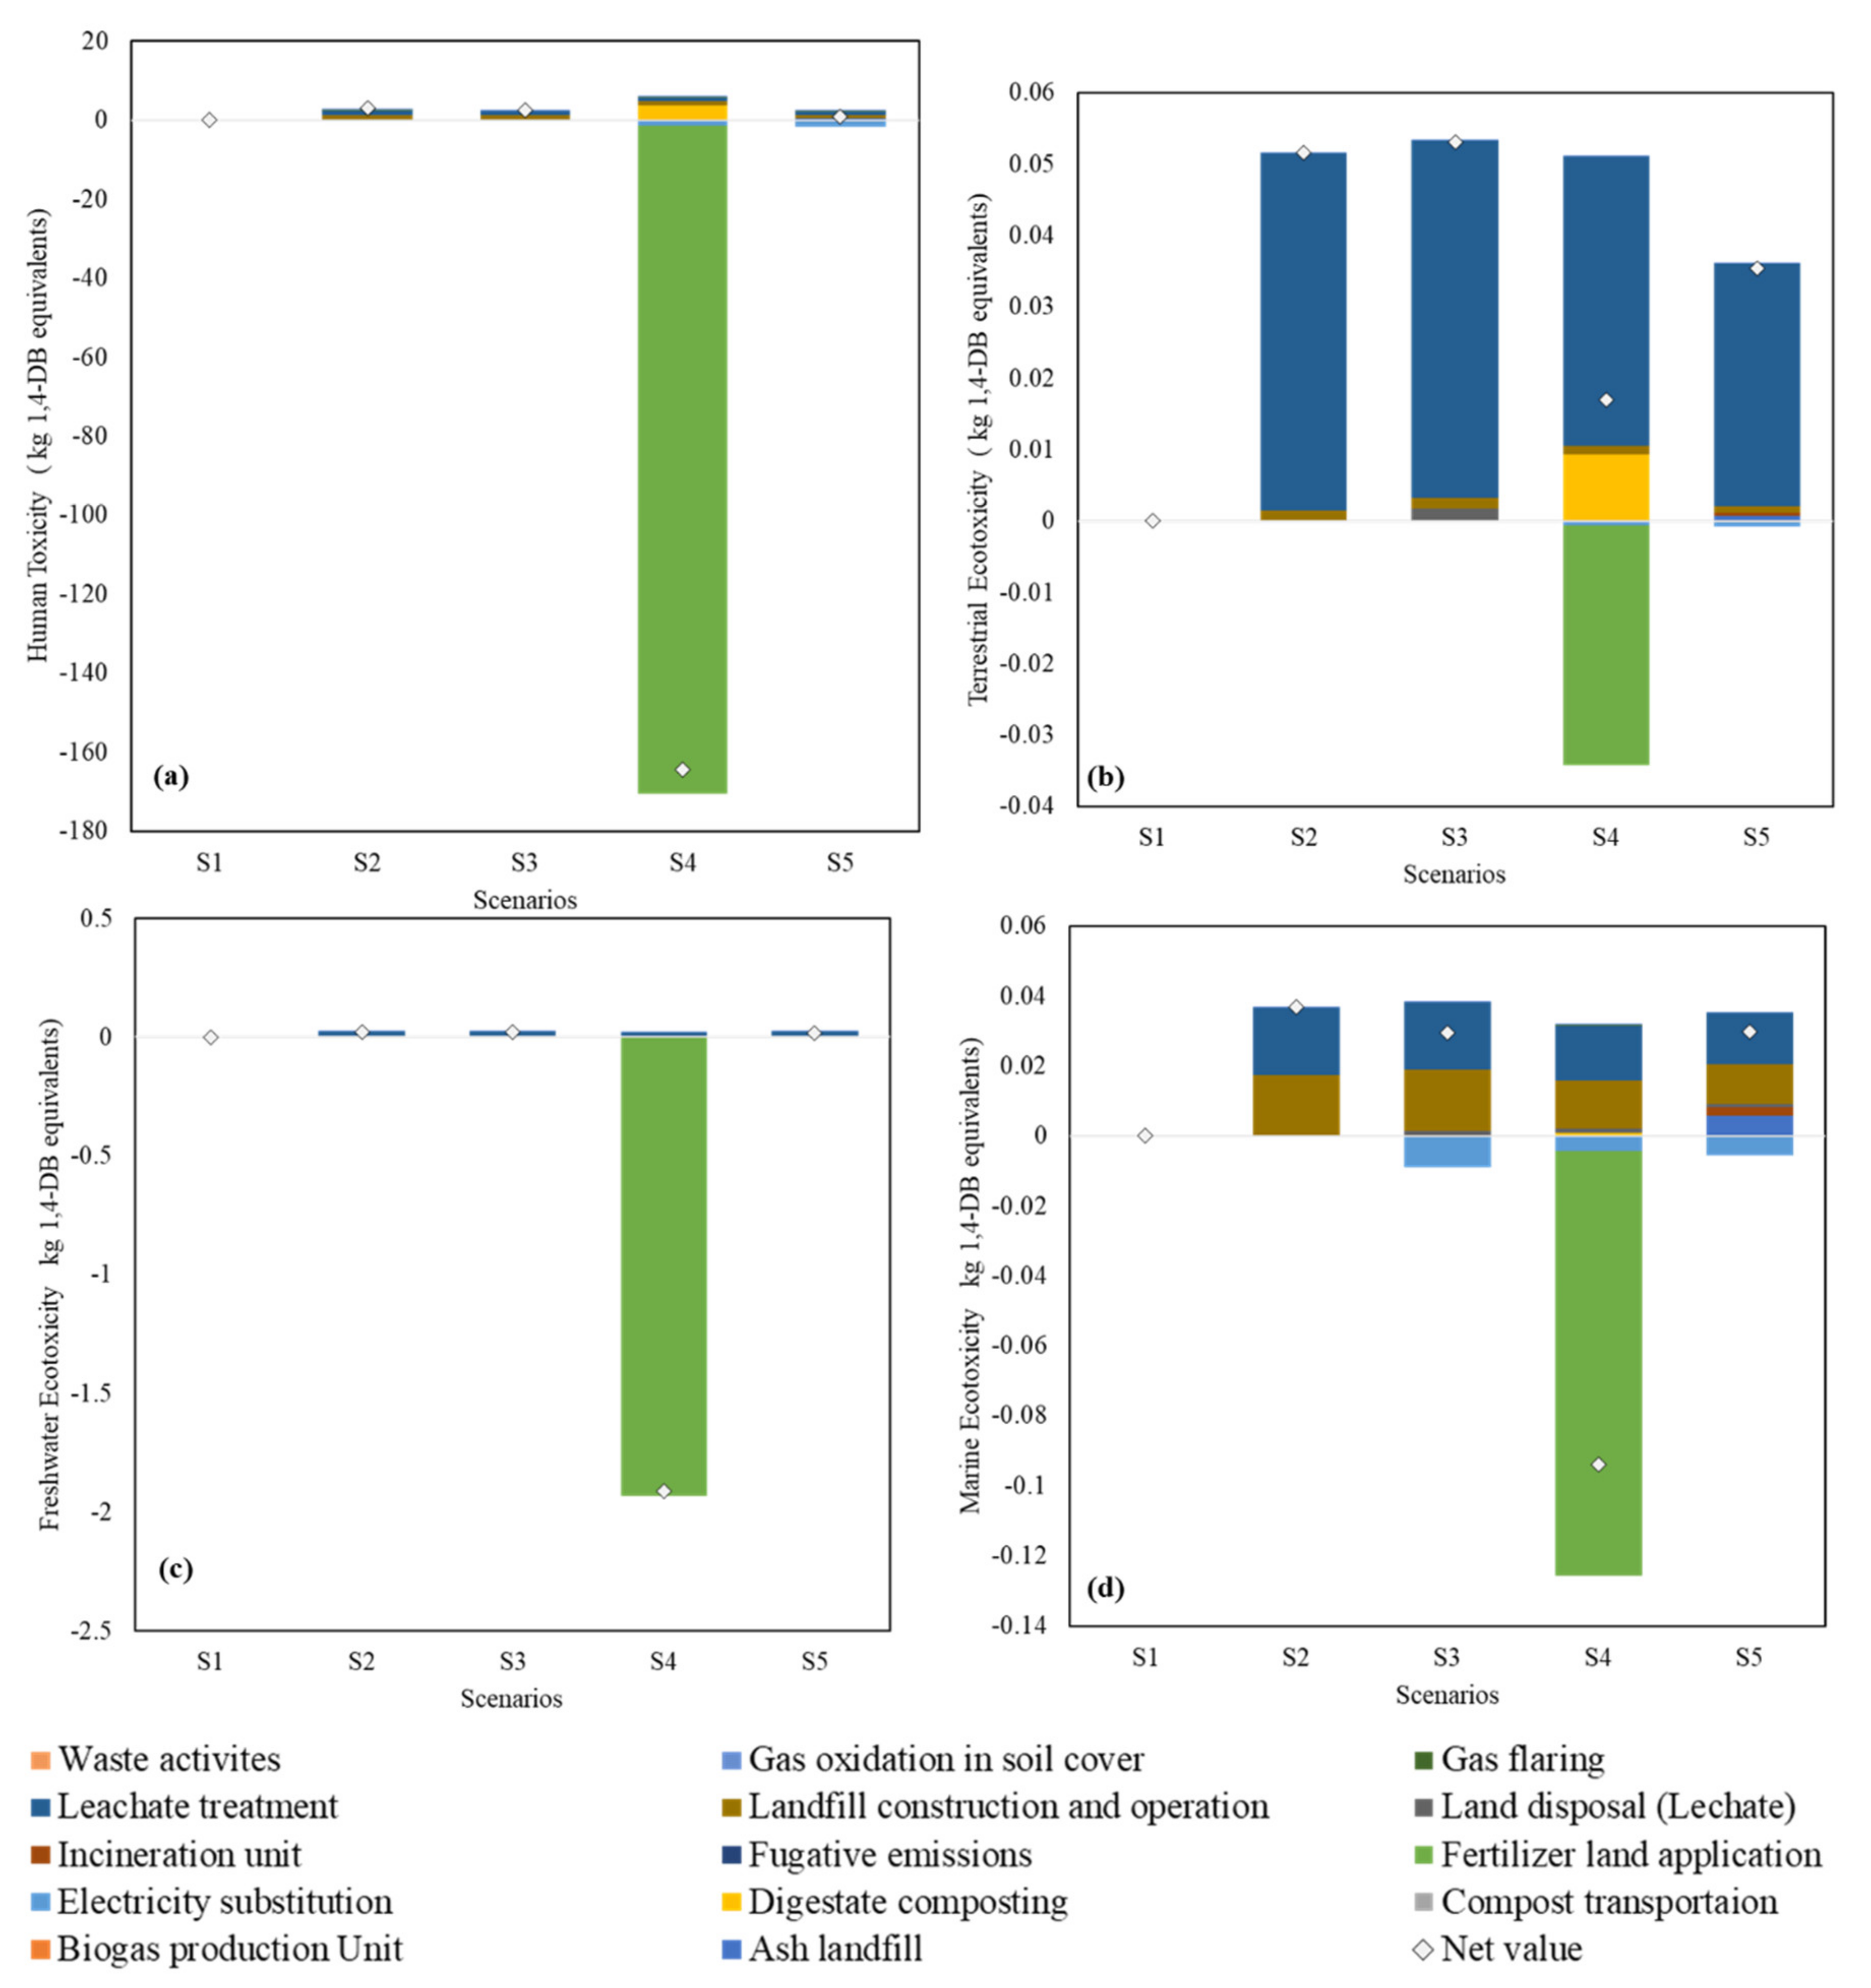
3.2.4. Toxicity Potential

The environmental impacts associated with HTP, TE, FWT, and MET are quantified in terms of kg 1,4-dichlorobenzene equivalents, and are shown in Figure 5a–d. In the baseline scenario (S1), the net value in all the impact categories is negligible. In the HTP impact category, the net value is 3.026 kg 1,4-dichlorobenzene equivalent for scenario S2. The major emission-contributing waste processes are construction and operation of landfill (44.8%), leachate treatment (31.4%), gas flaring (12.7%), and oxidation of gas in landfill (11.1%). In S3, the net value is 2.409 kg 1,4-dichlorobenzene equivalent. The major emission-contributing waste processes are the construction and operation of landfills (50.5%) and leachate treatment (35.5%). Substitution of grid electricity is the emission-reducing unit process. In S4, net value is −164.4 kg 1,4-dichlorobenzene equivalent. The major emission-contributing processes include digestate composting (60%), followed by construction and operation of landfill (17.5%), leachate treatment (12.6%), gas flaring (4.2%), oxidation in landfill (3.7%), biogas unit, and compost transportation (1.7%). The land application of compost alone reduces all of its emissions (i.e., 99%). In scenario S5, the net value is 0.739 kg 1,4-dichlorobenzene equivalent. The major emission-contributing waste processes include leachate treatment (31.8%), construction and operation of landfill (30.1%), and ash landfill (15.7%). The electricity substitution is the emission-offsetting unit process in this scenario. The collection and transportation of MSW to the integrated waste facility contribute to 0.0182 units.
In the TE impact category, the net value is 0.051 kg 1,4 DB eq. for scenario S2. The major emission-contributing waste processes are leachate treatment (97.2%) and landfill construction and operation (2.8%). In S3, the net value is 0.052 kg 1,4 DB eq. Leachate treatment is the major emission-contributing process (92.6%). Substitution of grid electricity is the emission-offsetting unit process. In scenario S4, net value is 0.017 kg 1,4 DB eq. The major emission-contributing waste processes are leachate treatment (79.4%) and digestate composting (18.2%). The land application of compost and grid electricity substitution contributed to 98% and 2% of the emission reduction, respectively. In S5, the net value is 0.035 kg 1,4 DB eq. Leachate treatment is mainly responsible for a significant portion of the total emissions (93.3%). The grid electricity substitution strategy is the emission-offsetting unit process in this scenario. The collection and transportation of MSW to the integrated waste facility contribute to 1.5 × 10⁻⁴ units.
In the FWT impact category, the net value is 0.025 kg 1,4 DB eq. for scenario S2. Leachate treatment is the single largest contributor to emissions (98.2%). In S3, the net value is 0.024 kg 1,4 DB. The single most emission-contributing process is the leachate treatment (91.1%). Substitution of electricity is the emission-offsetting unit process. The net value is −1.91 kg 1,4 DB is for scenario S4. The single most emission-contributing process is treatment (88%). The land application of compost and grid electricity substitution strategies reduce emissions by 98% and 2%, respectively. In S5, the net value is 0.019 kg 1,4 DB. The major emission-contributing waste processes are leachate treatment (67.4%) and ash landfill (25.8%). The electricity substitution is the emission-offsetting unit process in this scenario. The collection and transportation of MSW to the integrated waste facility contribute to 4.1 × 10⁻⁴ units.
In the MET impact category, the net value is 0.039 kg 1,4 DB eq. for scenario S2. The major emission-contributing waste processes are leachate treatment (52.3%) and landfill construction and operation (47.1%). In S3, the net value is 0.029 kg 1,4 DB eq. The major emission-contributing waste processes are leachate treatment (50.2%) and landfill construction and operation (45.2%). Substitution of grid electricity is the emission-reducing unit process. In S4, net value is −0.094 kg 1,4 DB eq. The major emission-contributing waste processes are leachate treatment (49.4) and landfill construction and operation (43.5%). Land application of compost and grid electricity substitution contribute to 96% and 4% of the emission offset, respectively. In scenario S5, net value is 0.296 kg 1,4 DB eq. The major emission-contributing waste processes are leachate treatment (37.8%), construction and operation of landfill (25.1%), ash landfill (18.5%), and incineration unit (15.9%). Electricity substitution is the major emission-offsetting unit process in this scenario. The collection and transportation of MSW to the integrated waste facility contributed to 1.1 × 10⁻³ units.
Overall, based on the HTP, TE, and MET impact categories, the order of scenarios contributing to environmental emissions is S2, S3, S5 and S4, while for FWT impact category S3, S2, S5 and S4. Overall, in all four toxic impact categories, anaerobic digestion and landfill without energy recovery (S4) has been found to be the best option.

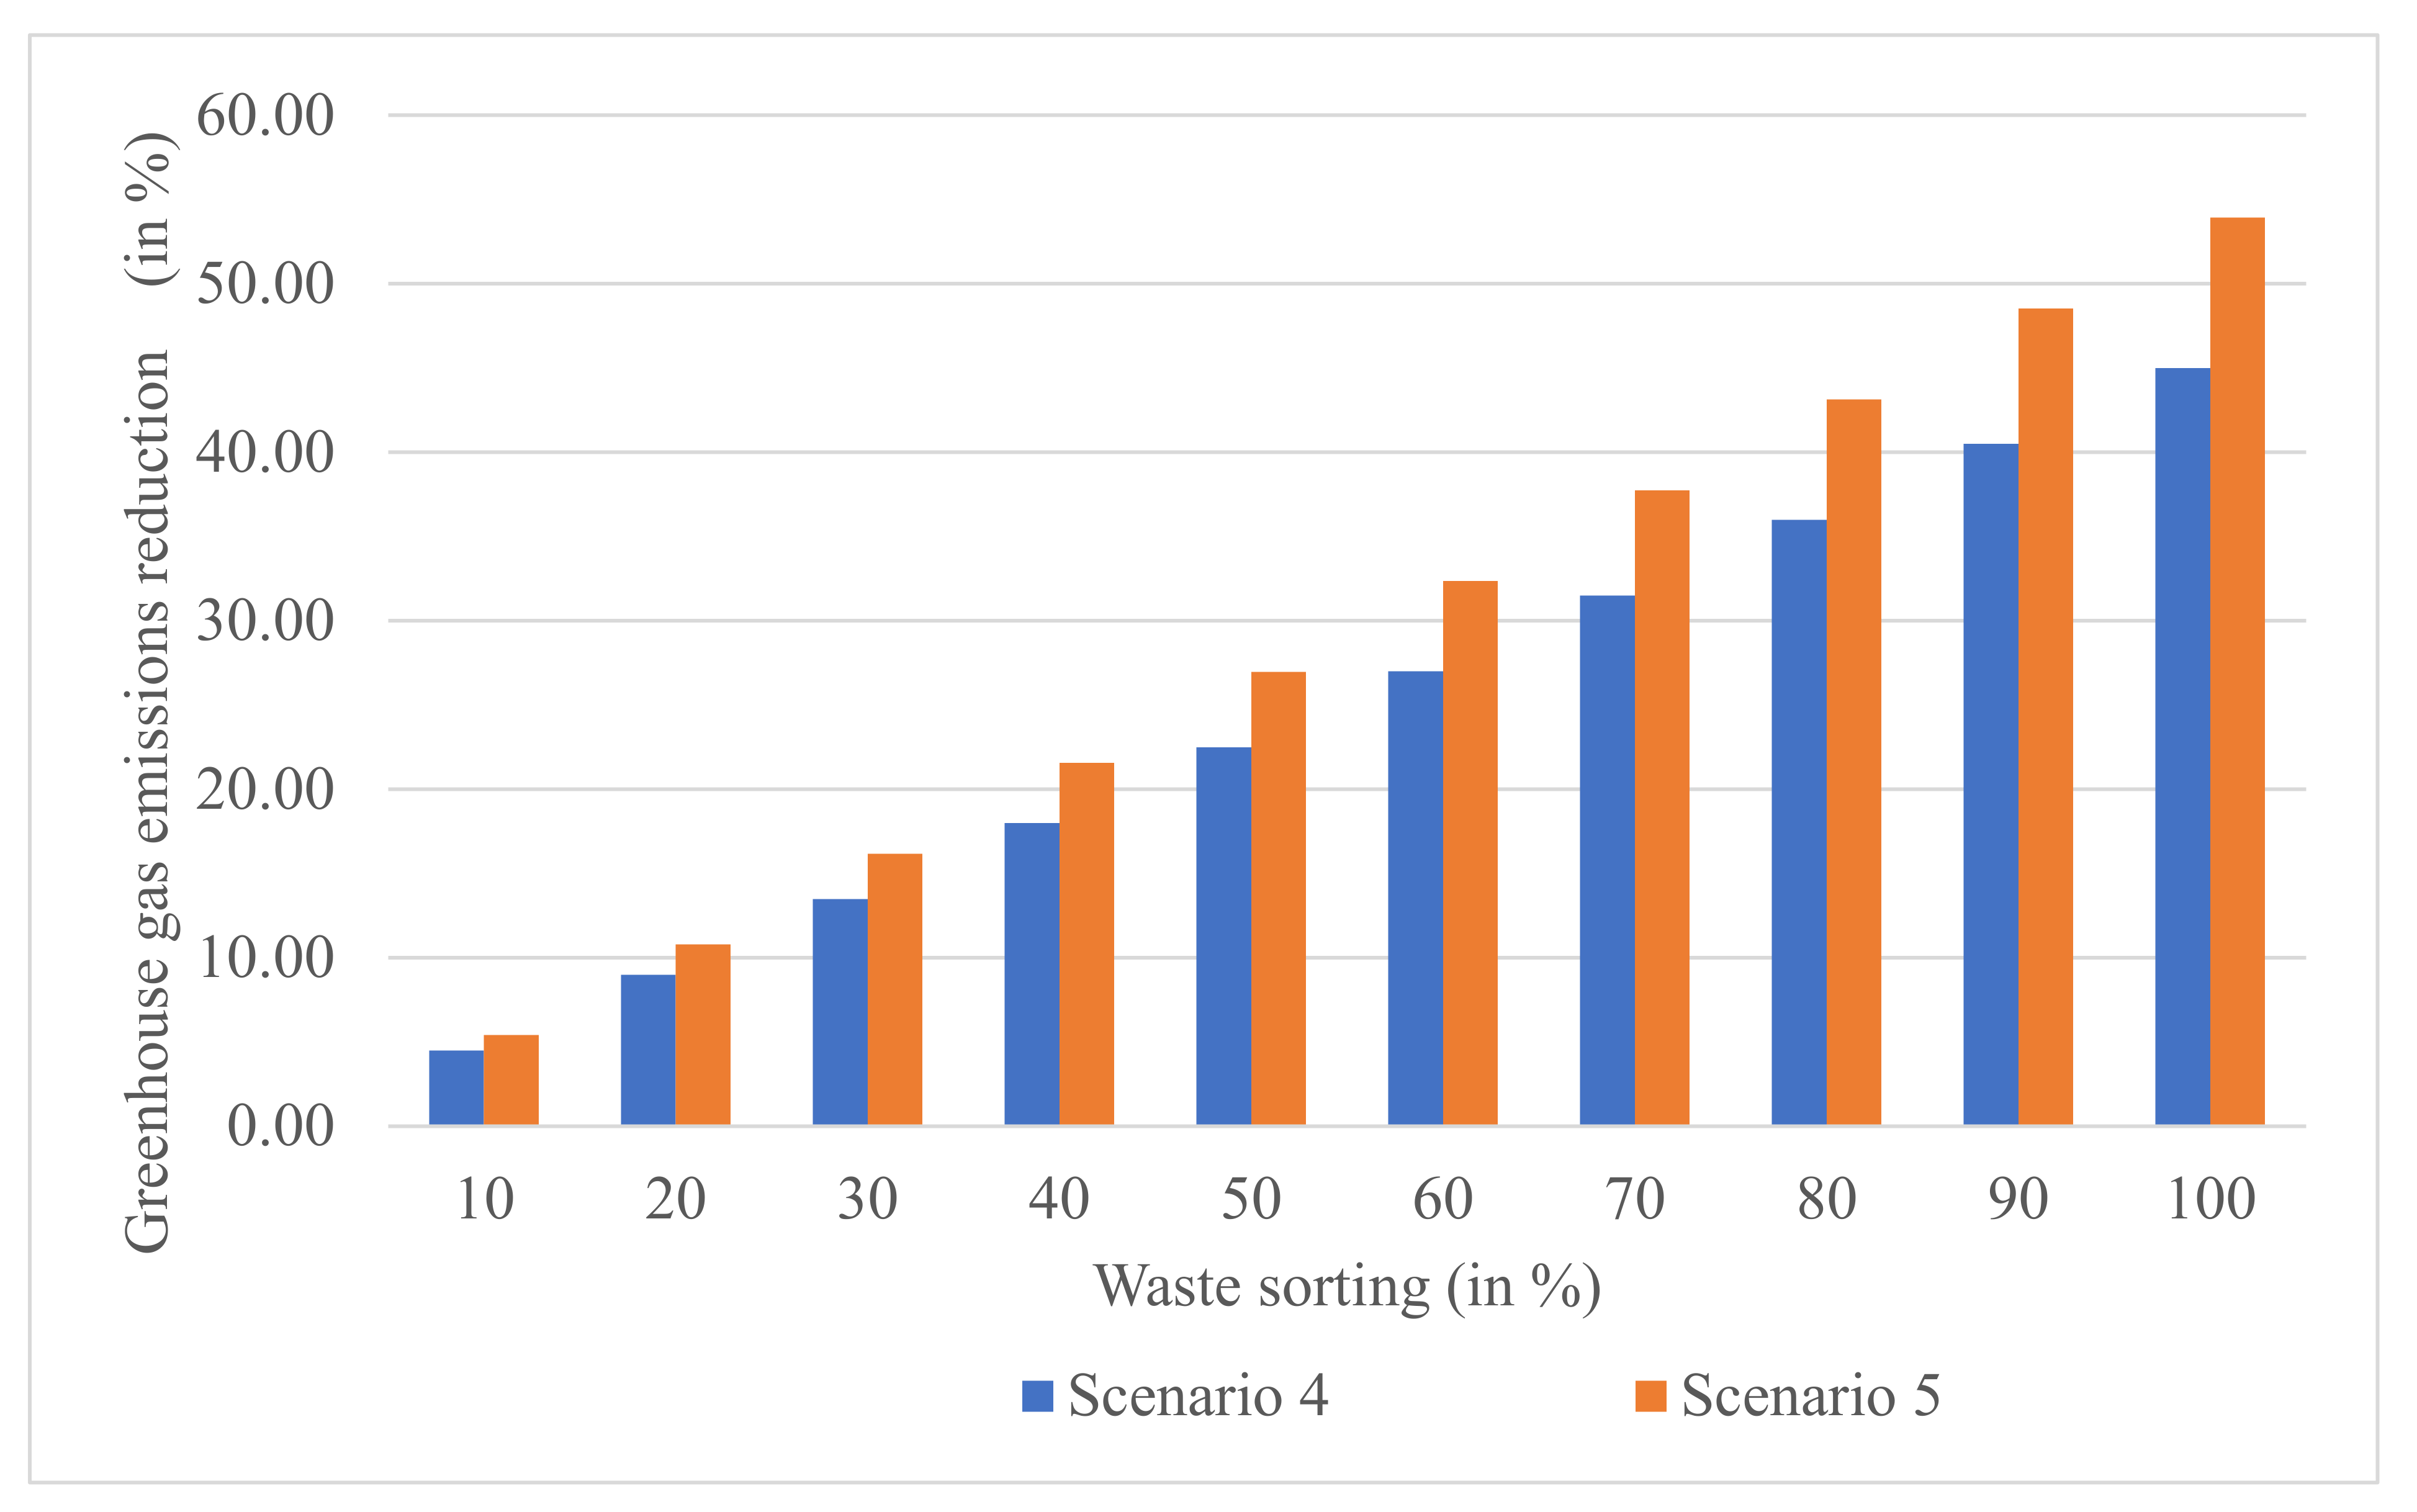
3.3. Sensitivity Analysis

Sensitivity analysis was performed for the global warming potential impact category, based on the increment of sorting efficiency in S4 and S5, ranging from 10% to 100%. Figure 6 presents the percentage of greenhouse gas reduction with sorting efficiency. As the sorting efficiency increased from 10% to 100%, the percentage reduction of greenhouse gas emissions increased from 4.48% to 44.99% in S4. The percentage reduction of greenhouse gas emissions increased from 5.40% to 53.92% in S5. This linear relation indicates that the implementation of waste sorting increases the treatment efficiency for both S4 and S5 scenarios, and reduces the global warming potential accordingly.

3.4. Uncertainty Analysis

The aforementioned environmental profiles of the waste treatment alternatives were determined based on the newly developed datasets representing India’s geographic conditions. MCS analysis was carried for 1000 iterations at a 95% confidence level to validate the LCA outcomes statistically, and to discern the level of uncertainty associated with the use of local databases. The outcomes of the uncertainty results are presented in Table 4; no significant difference was observed between mean and calculated values. In the GWP impact category, the obtained mean for S2 was 352.60 kg CO2 eq., 205.06 kg CO2 eq. for S3, 31.79 kg CO2 eq. for S4, and 101.88 kg CO2 eq. for S5. The standard deviation ranges from 5.67% to 15.98%, which is reasonable according to Clavreul et al. [54], and Hanandeh and El-Zein [55].

3.5. Comparison of Scenarios

Comparative ranking based on impact category for each treatment scenario is presented in Table 5. Based on the environmental profiles assessed, S4 is the best emission-reducing scenario in terms of GWP, FEW, HTP, TE, FWT, and MET, followed by the S5 scenario. S5 is the best emission-reducing scenario in the TA and MET impact categories, while S4 is the highest emission-contributing scenario. Both S4 and S5 alternatives are combined processes with engineered landfill without gas recovery as a common process. Comparing the environmental profiles, anaerobic digestion (S4) and incineration (S5) are identified as best treatment alternatives.
Organic waste is a major component (41%) of MSW, and so the introduction of decentralized anaerobic digestion units, and the subsequent transportation of digestate to a central composting facility, could potentially reduce overall environmental impacts [23,24,56]. Source segregation improves anaerobic digestion and incineration plant efficiency and reduces the load on landfills [23]. Utilization of biogas for energy generation and recovered digestated sludge as fertilizer in crop production will reduce environmental impacts, generate revenue and provide employment (green jobs) [57,58,59]. In this study, 50% segregation of waste is assumed, while only 15–20% of waste segregation has been achieved in the study area. Therefore, it was taken into consideration that the transition towards the decentralized treatment units with 50% of source segregation requires 5–10 years for implementation [60]. This requires additional investment in infrastructure development and an increase in public participation and community awareness programs [25]. The benefit to cost ratio of AD with biogas recovery depends on technology cost, land prices, construction and operation cost, labor cost, tax incentives, quality of biogas, bio-fertilizer demand, and subsidies [61]. During this transition process, developing an incineration unit and engineered landfill is recommended. In an incineration plant, the inclusion of pre-treatment units to reduce the moisture content can reduce the additional fuel consumption [62]. The use of incinerated ash resulting from the incineration process as a construction material could replace of virgin material and contribute to the reduction in overall impacts [63]. Alternatively, incinerated ash can be used as backfilling material in underground mining projects [64,65]. Over time, a decentralized material recycling facility (MRF) needs to be developed at the community level in order to recover the valuables [24]. The mining waste strategy could enable the recovery of precious materials from MSW without burning them unnecessarily during the incineration process [2,19]. A policy directive needs to be formulated in order to integrate the informal sector as the feeder source to MRF. Overall, based on this study’s outcomes, developing an optimum treatment alternative, by combining anaerobic digestion (small-scale units), incineration, and landfill without a gas recovery unit, is recommended.
Biogas and slurry generated from MSW through AD can help achieve a circular economy [7]. However, the biogas generated can be upgraded to biomethane (LPG grade) which is used for cooking purposes [57]. Furthermore, processed biogas i.e., after removal of sulfur dioxide, can be used as a fuel for transportation and electricity generation [59]. Digestate from the AD can be processed in a composting facility or directly applied as biofertilizer [57]. A concept of an organic waste-based circular economy model is shown in Figure 7.

4. Conclusions

In this study, the waste characterization highlights the importance of waste diagnosis for the development of regulatory norms on open dumping, converting open dumps to sanitary landfills, and the establishment of waste treatment units, material and energy recovery units. Based on the characterization study, organic waste (41%) was found to be the major ingredient of MSW, and so the adoption of anaerobic digestion was identified as an ideal treatment option. Source segregation of MSW helps in increasing anaerobic digestion plant efficiency. Citizens should be made conscious of waste sorting and recycling through education and mass awareness programs. Urban local bodies need to invest in developing the waste collection infrastructure, in which the source-segregated waste is collected separately and then taken to the waste treatment facilities.
LCA is employed to assess the current MSW management of the Visakhapatnam city of India to accelerate the smooth transition towards planning sustainable waste management systems. In this study, a base scenario (open dumping) and four other scenarios (combination of anaerobic digestion, incineration and landfilling) for MSW were considered for the Visakhapatnam city waste management. The scenarios were assessed for material and energy recovery and their impacts on the environment, such as global warming, acidification, eutrophication, human toxicity, terrestrial and aquatic toxicity. Scenario S4 (AD + LFWR) was found to have the lowest impacts for GWP, FEW, HT, TE, FWT, and MET impact categories. The investigation suggests that the sorting of waste is a critical parameter for sensitivity analysis. The current waste systems of MSW in Visakhapatnam (open dumping) contribute to substantial environmental impacts, compared to alternative scenarios (S2–S5). The study recommends that treating MSW with integrated waste management facility with combining anaerobic digestion (small-scale units), incineration, and landfill without gas recovery alternatives in Visakhapatnam is comparatively the best approach for maximizing material and energy recovery and minimizing environmental impacts.
The results indicate that the application of LCA is a useful tool for planning integrated waste management systems, as it allows the council authorities to compare the environmental impacts of the various alternative waste treatment technologies. Furthermore, investigations need to be performed to estimate normalization factors and weights for mid-point and end-point impact categories specific to the Indian context. However, this study provides an in-depth overview of the environmental impacts associated with the current waste management treatment alternatives and the potential opportunities for effective off-setting of impacts.

Author Contributions

Conceptualization, V.R.S.C. and B.D.; methodology, V.R.S.C., W.K.B. and B.D.; investigation, V.R.S.C.; data curation, M.J. and W.K.B.; writing—original draft preparation, V.R.S.C.; writing—review and editing, M.J., W.K.B. and B.D.; visualization, M.J., W.K.B. and B.D.; supervision, M.J., W.K.B. and B.D. All authors have read and agreed to the published version of the manuscript.

Funding

This research received no external funding.

Institutional Review Board Statement

Not applicable.

Informed Consent Statement

Not applicable.

Data Availability Statement

Nil.

Acknowledgments

The first author is thankful to the Ministry of Human Resources and Development, Government of India, and Australian Government (CIPRS Scholarship) for providing scholarship. Authors extend their gratitude to Sri. Hari Narayana, Commissioner and Hemanth, Chief Medical Officer of Health, Visakhapatnam for giving their permission to conduct waste characterization studies. Acknowledgements to the management and KVL Raju, Principal, MVGR college of Engineering (Autonomous) for providing the laboratory facilities during the field study. Acknowledgements to Rajesh Kola, Technical Assistant and Sandeep Prasad for supporting all throughout the laboratory testing and analysis.

Conflicts of Interest

The authors declare no conflict of interest.

Abbreviations

ADAnaerobic digestion
ADPAbiotic depletion potential
ADPEAbiotic depletion
ADPFAbiotic depletion (fossil fuels)
ASTMAmerican Society for Testing Materials
BLFBioreactor landfill
COLCollection
COMComposting
EASETECH Environmental Assessment System for Environmental TECHnologies
EBMExcel-based model
EPEutrophication potential
ETPEcotoxicity potential
FEW Freshwater eutrophication
FWTFresh water ecotoxicity
GVMCGreater Visakhapatnam Municipal Corporation
GWPGlobal warming potential
HTPHuman toxicity potential
ICImpact category
IMImpact method
INCIncineration
IPCC Intergovernmental Panel on Climate Change
LCA Life cycle assessment
LCILife cycle inventory
LCIALife cycle impact assessment
LFLandfill
LFGLandfill gas
LFGRLandfill with gas collection
LFWGRLandfill without gas collection
LPGLiquified petroleum gas
LTLeachate treatment
MAEMarine aquatic ecotoxicity
MCS Monte Carlo simulation
ME Marine water eutrophication
MET Marine ecotoxicity
MoHUAMinistry of Housing and Urban Affairs
MRFMaterial recycling facility
MSWMunicipal solid waste
OBOpen burning
ODOpen dumping
ODPOzone depletion potential
PMParticulate matter
POCPPhotochemical ozone creation potential
PYRPyrolysis
RDFRefuse-derived fuel
RECRecycling
SWSoftware tool
SWMSolid waste management
TA Terrestrial acidification
TETerrestrial ecotoxicity
TRANSTransportation

References

  1. Iyamu, H.O.; Anda, M.; Ho, G. A review of municipal solid waste management in the BRIC and high-income countries: A thematic framework for low-income countries. Habitat Int. 2020, 95, 102097. [Google Scholar] [CrossRef]
  2. Khandelwala, H.; Thallaa, A.K.; Kumar, S.; Kumar, R. Life cycle assessment of municipal solid waste management options for India. Bioresour. Technol. 2019, 288, 121515. [Google Scholar] [CrossRef]
  3. Cheela, V.R.S.; Dubey, B. Review of applications of systems engineering approaches in development of integrated solid waste management for a smart city. In Water Resources and Environmental Engineering II, 1st ed.; Rathinasamy, M., Chandramouli, S., Eds.; Springer: Singapore, 2019; pp. 159–177. [Google Scholar] [CrossRef]
  4. Cheela, V.R.S.; Shankar, U.; Dubey, B. Solid waste management: Policies, implementation and challenges. In Treatment and Disposal of Solid and Hazardous Wastes, 1st ed.; Debashish, D., Goel, S., Eds.; Springer: New Delhi, India, 2019; pp. 201–210. [Google Scholar]
  5. Kaur, R.R.; Luthra, A. Population growth, urbanization and electricity—Challenges and initiatives in the state of Punjab, India. Energy Strategy Rev. 2018, 21, 50–61. [Google Scholar] [CrossRef]
  6. Kumar, N.K.; Goel, S. Characterization of Municipal Solid Waste and a proposed management plan for Kharagpur, West Bengal, India. Resour. Conserv. Recycl. 2009, 53, 166–174. [Google Scholar] [CrossRef]
  7. Wielgosiński, G.; Czerwińska, J.; Szufa, S. Municipal Solid Waste Mass Balance as a Tool for Calculation of the Possibility of Implementing the Circular Economy Concept. Energies 2021, 14, 1811. [Google Scholar] [CrossRef]
  8. Kumar, S.; Smith, S.R.; Fowler, G.; Velis, C.; Kumar, S.J.; Arya, S.R.; Kumar, R.; Cheeseman, C. Challenges and opportunities associated with waste management in India. R. Soc. Open Sci. 2017, 4, 160764. [Google Scholar] [CrossRef] [PubMed] [Green Version]
  9. Mandal, P.; Dubey, B.K.; Gupta, A.K. Review on landfill leachate treatment by electrochemical oxidation: Drawbacks, challenges and future scope. Waste Manag. 2017, 69, 250–273. [Google Scholar] [CrossRef]
  10. Mor, S.; Negi, P.; Ravindra, K. Assessment of groundwater pollution by landfills in India using leachate pollution index and estimation of error. Environ. Nanotechnol. Monit. Manag. 2018, 10, 467–476. [Google Scholar] [CrossRef]
  11. Agarwala, R.; Shuklaa, K.; Kumar, S.; Aggarwala, S.G.; Kawamura, K. Chemical composition of waste burning organic aerosols at landfill and urban sites in Delhi. Atmos. Pollut. Res. 2020, 11, 554–565. [Google Scholar] [CrossRef]
  12. Climate Links. Document on “Greenhouse Gas Emissions Factsheet: India”. United States Agency International Development. 2019. Available online: https://www.climatelinks.org/resources/greenhouse-gas-emissions-india (accessed on 13 February 2021).
  13. GMI (Global Methane Initiative). Document on “Global Methane Emissions and Mitigation Opportunities”. 2019. Available online: https://www.globalmethane.org/documents/gmi-mitigation-factsheet.pdf (accessed on 13 February 2021).
  14. Pahuja, N.; Pandey, N.; Mandak, K.; Bandyopadhyay, C. GHG Mitigation in India: An Overview of the Current Policy Landscape; World Resource Institute: Washington, DC, USA, 2014; pp. 1–32. Available online: https://www.wri.org/research/ghg-mitigation-india (accessed on 25 March 2021).
  15. Malmir, T.; Ranjbar, S.; Eicker, U. Improving Municipal Solid Waste Management Strategies of Montréal (Canada) Using Life Cycle Assessment and Optimization of Technology Options. Energies 2020, 13, 5701. [Google Scholar] [CrossRef]
  16. Saqib, N.U.; Sharma, H.B.; Baroutian, S.; Dubey, B.; Sarmah, A.K. Valorisation of food waste via hydrothermal carbonisation and technoeconomic feasibility assessment. Sci. Total Environ. 2019, 690, 261–276. [Google Scholar] [CrossRef]
  17. Clavreul, J.; Baumeister, H.; Christensen, T.H.; Damgaard, A. An environmental assessment system for environmental technologies. Environ. Model. Softw. 2014, 60, 18–30. [Google Scholar] [CrossRef] [Green Version]
  18. Soleymani Angili, T.; Grzesik, K.; Rödl, A.; Kaltschmitt, M. Life Cycle Assessment of Bioethanol Production: A Review of Feedstock, Technology and Methodology. Energies 2021, 14, 2939. [Google Scholar] [CrossRef]
  19. Yadav, P.; Samadder, S.R. Environmental impact assessment of municipal solid waste management options using life cycle assessment: A case study. Environ. Sci. Pollut. Res. 2018, 25, 838–854. [Google Scholar] [CrossRef]
  20. Laurent, A.; Bakas, I.; Clavreul, J.; Bernstad, A.; Niero, M.; Gentil, E.; Hauschild, M.Z.; Christensen, T.H. Review of LCA studies of solid waste management systems—Part I: Lessons learned and perspectives. Waste Manag. 2014, 34, 573–588. [Google Scholar] [CrossRef] [PubMed]
  21. Srivastava, A.K.; Nema, A.K. Life cycle assessment of integrated solid waste management system of Delhi. In Towards Life Cycle Sustainability Management; Finkbeiner, M., Ed.; Springer: Berlin/Heidelberg, Germany, 2011; pp. 267–276. [Google Scholar] [CrossRef]
  22. Babu, G.L.S.; Lakshmikanthan, P.; Santhosh, L.G. Life cycle analysis of municipal solid waste (MSW) land disposal options in Bangalore city. In Proceedings of the Creating Infrastructure for a Sustainable World, International Conference on Sustainable Infrastructure, Long Beach, CA, USA, 6–8 November 2014; Hendrickson, C., Wallace, W.A., Eds.; ASCE: Reston, VA, USA, 2014. Available online: https://ascelibrary.org/doi/10.1061/9780784478745.075 (accessed on 25 March 2021).
  23. Sharma, B.K.; Chandel, M.K. Life cycle assessment of potential municipal solid waste management strategies for Mumbai, India. Waste Manag. Res. 2016, 35, 79–91. [Google Scholar] [CrossRef]
  24. Rana, R.; Ganguly, R.; Gupta, A.K. Life-cycle assessment of municipal solid-waste management strategies in Tricity region of India. J. Mater. Cycles Waste Manag. 2019, 21, 606–623. [Google Scholar] [CrossRef]
  25. Mehta, Y.D.; Shastri, Y.; Joseph, B. Economic analysis and life cycle impact assessment of municipal solid waste disposal: A case study of Mumbai, India. Waste Manag. Res. 2018, 36, 1177–1189. [Google Scholar] [CrossRef]
  26. Mali, S.T.; Patil, S.S.; Patil, D.Y. Life-cycle assessment of municipal solid waste management. Inst. Civ. Eng. Waste Resour. Manag. 2016, 169, 181–190. [Google Scholar] [CrossRef]
  27. Bohra, A.; Nema, A.K.; Ahluwalia, P. Global warming potential of waste management options: Case study of Delhi. Int. J. Environ. Technol. Manag. 2012, 15, 346–362. [Google Scholar]
  28. ASTM (American Society for Testing and Materials). D5231-92. In Standard Test Method for Determination of the Composition of Unprocessed Municipal Solid Waste; ASTM International: West Conshohocken, PA, USA, 2016. [Google Scholar]
  29. Zhan, T.L.T.; Xu, X.B.; Chen, Y.M.; Ma, X.F.; Lan, J.W. Dependence of Gas Collection Efficiency on Leachate Level at Wet Municipal Solid Waste Landfills and Its Improvement Methods in China. J. Geotech. Geoenviron. Eng. 2015, 141, 1–11. [Google Scholar] [CrossRef]
  30. Barlaz, M.A.; Chanton, J.P.; Green, R.B. Controls on landfill gas collection efficiency: Instantaneous and lifetime performance. J. Air Waste Manag. Assoc. 2009, 59, 1399–1404. [Google Scholar] [CrossRef] [Green Version]
  31. Liu, Y.; Ni, Z.; Kong, X.; Liu, J. Greenhouse gas emissions from municipal solid waste with a high organic fraction under different management scenarios. J. Clean. Prod. 2017, 147, 451–457. [Google Scholar] [CrossRef]
  32. CPCB (Central Pollution Control Board). Selection Criteria for Waste Processing Technologies. 2016. Available online: https://cpcb.nic.in/uploads/MSW/SW_treatment_Technologies.pdf (accessed on 15 April 2021).
  33. IRG. Detailed Project Report on “Development of Municipal Solid Waste Processing & Disposal Facility for NOIDA and Greater Noida Gautam Buddha Nagar”. 2015. Available online: https://www.greaternoidaauthority.in/files/attachments/Annexure_B_DPR_Greater_Noida.pdf (accessed on 19 March 2021).
  34. International Standards Organization. ISO 14040. In Environmental Management—Life Cycle Assessment—Principles and Framework; ISO: Geneva, Switzerland, 2006. [Google Scholar]
  35. International Standards Organization. ISO 14044. In Environmental Management—Life Cycle Assessments—Requirements and Guidelines; ISO: Geneva, Switzerland, 2006. [Google Scholar]
  36. Biswas, W.K. Life cycle assessment of seawater desalination in Western Australia. World Acad. Sci. Eng. Technol. 2009, 35, 369–375. [Google Scholar] [CrossRef]
  37. Frischknecht, R.; Althaus, H.J.; Bauer, C.; Doka, G.; Heck, T.; Jungbluth, N.; Kellenberger, D.; Nemecek, T. The environmental relevance of capital goods in life cycle assessments of products and services. Int. J. Life Cycle. Assess. 2007, 12, 7–17. [Google Scholar] [CrossRef]
  38. CPHEEO (Central Public Health and Environmental Engineering Organisation). Annexure on “Estimation of Landfill Capacity, Landfill Height, Landfill Area”. 2020. Available online: http://cpheeo.gov.in/upload/uploadfiles/files/annex17.pdf (accessed on 15 April 2021).
  39. Environmental Protection Agency (EPA). Report on “LFG Energy Project Development Handbook”. 2020. Available online: https://www.epa.gov/sites/production/files/2016-11/documents/pdh_full.pdf (accessed on 15 April 2021).
  40. Bassi, S.A.; Christensen, T.H.; Damgaard, A. Environmental performance of household waste management in Europe—An example of 7 countries. Waste Manag. 2017, 69, 545–557. [Google Scholar] [CrossRef] [Green Version]
  41. Bogner, J.E.; Chanton, J.P.; Blake, D.; Abichou, T.; Powelson, D. Effectiveness of Florida landfill biocover for reduction of CH4 and NMHC emissions. Environ. Sci. Technol. 2010, 44, 1197–1203. [Google Scholar] [CrossRef] [PubMed]
  42. Angelo, A.C.M.; Saraiva, A.B.; Clímaco, J.C.N.; EduardoInfante, C.; Valle, R. Life Cycle Assessment and Multi-criteria Decision Analysis: Selection of a strategy for domestic food waste management in Rio de Janeiro. J. Clean. Prod. 2017, 143, 744–756. [Google Scholar] [CrossRef]
  43. Database of Waste Management Technologies (DWMT). Article on “Dry AD Followed by Covered Windrows Composting”. 2014. Available online: http://www.epem.gr/waste-c-control/database/html/AD-01.htm (accessed on 18 March 2021).
  44. Turner, D.A.; Williams, I.D.; Kemp, S. Combined material flow analysis and life cycle assessment as a support tool for solid waste management decision making. J. Clean. Prod. 2016, 129, 234–248. [Google Scholar] [CrossRef] [Green Version]
  45. Sharma, B.K.; Chandel, M.K. Life cycle cost analysis of municipal solid waste management scenarios for Mumbai, India. Waste Manag. 2021, 124, 293–302. [Google Scholar] [CrossRef] [PubMed]
  46. Hoeve, M.; Bruun, S.; Jensen, L.S.; Christensen, T.H.; Scheutz, C. Life cycle assessment of garden waste management options including long-term emissions after land application. Waste Manag. 2019, 86, 54–66. [Google Scholar] [CrossRef]
  47. Ministry of Power (MOP). Report on “Power Sector at a Glance—All India”. 2021. Available online: https://powermin.gov.in/en/content/power-sector-glance-all-india (accessed on 24 April 2021).
  48. Delhi Electricity Regulatory Commission. Timarpura Incineration Plant, Delhi. 2015. Available online: http://www.derc.gov.in/ordersPetitions/orders/Misc/2007/Timarpur%20Waste%20management.pdf (accessed on 24 April 2021).
  49. Jain, P.; Powell, J.T.; Smith, J.L.; Townsend, T.G.; Tolaymat, T. Life-Cycle Inventory and Impact Evaluation of Mining Municipal Solid Waste Landfills. Environ. Sci. Technol. 2014, 48, 2920–2927. [Google Scholar] [CrossRef]
  50. Mistri, A.; Dhami, N.; Bhattacharyya, S.K.; Barai, S.K.V.; Mukherjee, A.; Biswas, W.K. Environmental implications of the use of bio-cement treated recycled aggregate in concrete. Resour. Conserv. Recycl. 2021, 167, 105436. [Google Scholar] [CrossRef]
  51. Huijbregts, M.A.J. Report on “Priority Assessment of Toxic Substances in the Frame of LCA—Time Horizon Dependency in Toxicity Potentials Calculated with the Multi-Media Fate, Exposure and Effects Model USES-LCA. 2000. Available online: https://www.universiteitleiden.nl/binaries/content/assets/science/cml/publicaties_pdf/new-dutch-lca-guide/priority-assessment-of-toxic-substances-draft-report.pdf (accessed on 15 April 2021).
  52. Huijbregts, M.A.J. Report on “ReCiPe 2016 A Harmonized Life Cycle Impact Assessment Method at Midpoint and Endpoint Level Report I: Characterization”. 2016. Available online: https://www.rivm.nl/bibliotheek/rapporten/2016-0104.pdf (accessed on 24 April 2021).
  53. Goedkoop, M.; Oele, M.; Leijting, J.; Ponsioen, T.; Meijer, E. Introduction to LCA with SimaPro. 2013. Available online: https://pre-sustainability.com/files/2014/05/SimaPro8IntroductionToLCA.pdf (accessed on 24 April 2021).
  54. Clavreul, J.; Guyonnet, D.; Christensen, T.H. Quantifying uncertainty in LCA-modelling of waste management systems. Waste Manag. 2012, 32, 2482–2495. [Google Scholar] [CrossRef] [PubMed] [Green Version]
  55. Hanandeh, A.E.; El-Zein, A. Life-cycle assessment of municipal solid waste management alternatives with consideration of uncertainty: SIWMS development and application. Waste Manag. 2010, 30, 902–911. [Google Scholar] [CrossRef] [PubMed] [Green Version]
  56. Seruga, P. The Municipal Solid Waste Management System with Anaerobic Digestion. Energies 2021, 14, 2067. [Google Scholar] [CrossRef]
  57. Rolewicz-Kalińska, A.; Lelicińska-Serafin, K.; Manczarski, P. The Circular Economy and Organic Fraction of Municipal Solid Waste Recycling Strategies. Energies 2020, 13, 4366. [Google Scholar] [CrossRef]
  58. Pavlas, M.; Dvořáček, J.; Pitschke, T.; Peche, R. Biowaste Treatment and Waste-To-Energy—Environmental Benefits. Energies 2020, 13, 1994. [Google Scholar] [CrossRef] [Green Version]
  59. Di Matteo, U.; Nastasi, B.; Albo, A.; Garcia, D.A. Energy Contribution of OFMSW (Organic Fraction of Municipal Solid Waste) to Energy-Environmental Sustainability in Urban Areas at Small Scale. Energies 2017, 10, 229. [Google Scholar] [CrossRef] [Green Version]
  60. Central Public Health and Environmental Engineering Organisation (CPHEEO). Manual on “Municipal Solid Waste Management Manual-Part II”. 2016. Available online: http://cpheeo.gov.in/upload/uploadfiles/files/Part2.pdf (accessed on 15 April 2021).
  61. Seruga, P.; Krzywonos, M.; Seruga, A.; Niedźwiecki, Ł.; Pawlak-Kruczek, H.; Urbanowska, A. Anaerobic Digestion Performance: Separate Collected vs. Mechanical Segregated Organic Fractions of Municipal Solid Waste as Feedstock. Energies 2020, 13, 3768. [Google Scholar] [CrossRef]
  62. National Research Council. Waste Incineration and Public Health; The National Academies Press: Washington, DC, USA, 2000.
  63. Kanhar, A.H.; Chen, S.; Wang, F. Incineration Fly Ash and Its Treatment to Possible Utilization: A Review. Energies 2020, 13, 6681. [Google Scholar] [CrossRef]
  64. Skrzypkowski, K.; Korzeniowski, W.; Młynarska, P. Binding capability of ashes and dusts from municipal solid waste incineration with salt brine and geotechnical parameters of the cemented samples. Arch. Min. Sci. 2018, 63, 903–918. [Google Scholar] [CrossRef]
  65. Korzeniowski, W.; Poborska-Młynarska, K.; Skrzypkowsk, K. The idea of the recovery of municipal solid waste incineration (MSWI) residues in Kłodawa salt mine S.A. By filling the excavations with self-solidifying mixtures. Arch. Min. Sci. 2018, 63, 553–565. [Google Scholar] [CrossRef]
Figure 1. Scenarios for the management of municipal solid waste. (a) S1: Baseline scenario (unlined landfill); (b) S2: Engineered landfill without energy recovery; (c) S3: Engineered landfill with energy recovery; (d) S4: Anaerobic digestion of food waste and residues dumped in engineered landfill without energy recovery; and (e) S5: Incineration with energy recovery and residues dumped in inert landfill.
Energies 14 03133 g001
Figure 2. Calculation of environmental impacts in different layers (Reproduced with permission from Elsevier, licensee number 5077011444375 [17]).
Energies 14 03133 g002
Figure 3. Physical characteristics of MSW.
Energies 14 03133 g003
Figure 4. Characterized impact results of the five alternative scenarios. (a) Global warming potential; (b) terrestrial acidification; (c) fresh water eutrophication; and (d) marine water eutrophication.
Energies 14 03133 g004
Figure 5. Characterization impact results of the five alternative scenarios. (a) human toxicity; (b) terrestrial ecotoxicity; (c) fresh water ecotoxicity; and (d) marine ecotoxicity.
Energies 14 03133 g005
Figure 6. Sensitivity analysis for global warming potential, based on waste sorting efficiency.
Energies 14 03133 g006
Figure 7. Concept of an organic waste-based circular economy.
Energies 14 03133 g007
Table 1. Life cycle assessment of municipal solid waste management and handling systems in India.
Functional Unit;
Location
Software; Impact Method and CategoriesScenariosOutcomesRef.
FU:1 Metric Ton;
LO: Nagpur
SW: GaBi 8.0
IM: CML
IC: GWP; TA; EP; ADP; HTP; POCP
S1: COM + LF
S2: MRF + COM + LF
S3: MRF + AD + LF
S4: MRF + COM + AD + LF
  • S4 is the best alternative among all the options
  • S1 has highest GWP (1259.69 kg CO2 eq.), while S2 has least GWP (721.79 kg CO2 eq.)
  • S4 has highest TA (4.42 × 10⁻¹ kg SO2 eq.), while S1 has least TA (1.92 × 10⁻¹ kg SO2 eq.)
  • S3 has highest HTP (8.56 × 10⁻¹ kg DCB eq.), while S2 has least HTP (4.18 × 10⁻¹ kg DCB eq.).
[2]
FU:1 Metric Ton;
LO: Dhanbad
SW: SimaPro 8.0
IM: CML
IC: GWP, ODP; HTP; FWT; MAE; TE; POCP; TA; EP; ADPC; ADPF
S1: COL + TRANS
S2: REC + OD + OB
S3: COM + LFWGR
S4: REC + COM + LFWG
  • S4 is the best alternative among all the options
  • S1 has the highest impact on marine aquatic ecotoxicity and abiotic depletion.
  • S2 has the highest impact on GWP, TA, EP, POCP and HTP
  • S3 has the highest impact on abiotic depletion, fresh water aquatic ecotoxicity, terrestrial ecotoxicity and ozone layer depletion
[19]
FU: Daily generated waste
LO: Delhi
ST: EBM
IM: NM
IC: GWP
S1: REC
S2: COM
S3: INC
S4: LF
  • S1 has the lowest GHG emission among all the waste management scenarios.
  • Effect of waste management options into soil and land resources is not considered in this study.
[21]
FU: 1 Metric Ton
LO: Bangalore
ST: EBM
IM: Eco-indicator; IPCC guideline
IC: GWP; TA; POCP; EP
S1: OD
S2: LFWGR
S3: LFGR
S4: BLF
  • S4 is the best alternative among all the options both in terms of environment and economy.
  • S1 > S2 > S3 > S4 is the order of preference based on environmental impacts (descending order)
  • Compared to S1, GWP was reduced by about five times in S4
[22]
FU:1 Metric Ton;
LO: Mumbai
SW: GaBi 6.0
IM: IPCC guideline
IC: GWP; TA; EP; HTP
S1: 31% BLF + 69% OD
S2: 3.2% REC + 96:8% LF
S3: 3.2% REC + 32% COM + 64.8% LF
S4: 3.2% REC + 32% AD + 64.8% LF
S5: 3.2% REC + 16% COM + 16% AD + 64.8% LF
S6: 3.2% REC + 8%COM + 88.8% INC
S7: 3.2% REC + 96.8%INC
  • S5 has least environmental burdens compared to other scenarios
  • S4 has the least GWP (930.01 kg CO2 eq.)
  • S3 has least EP (0.0080 kg PO4 −3 eq.) and HTP (0.42 kg 1,4-DB eq.)
  • S2 has the least TA (0.16 kg SO2 eq.)
  • In sensitivity analysis, increasing Recycling rate from 10% to 90% contributed to 11% reduction in GWP, 2.4% in TA; 21% in EP and 9% in HTP
[23]
FU: 1 Metric Ton
LO: Chandigarh (C), Mohali (M), and Panchkula (P)
ST: SimaPro 8.3
IM: Eco-indicator
IC: GWP; TA; EP; HTP
S1: OD (M and P); OD + RDF (C)
S2: MRF + LF
S3: MRF + COM + LF
S4: MRF + COM + AD + LF
S5: MRF + COM + INC
  • S1 has highest GWP while S3 has least GWP least for all the cities
  • In TA and EP, S5 has highest impacts and S3 is least for all the cities
  • In HTP, S5 has highest impacts and S3 has least in cites (C) and (M), while S1 has highest and S3 least in city (P).
  • In sensitivity analysis, increasing recycling rate from 10% to 90% contributed to about 10% for all the cities
[24]
FU: 1 Metric Ton
LO: Mumbai
ST: Open LCA 1.5
IM: ILCD 2011
IC: GWP; POP: HTP; FWT
S1: OD
S2: LF
S3: LF + LT
S4: COM + LF
  • S1 has highest GWP (1240 kg eq. CO2), while S4 has least GWP (261 kg eq. CO2).
  • S1 has highest HTP (1.23 × 10⁻⁵ total CTUh), while S3 has least GWP (4.84 × 10⁻⁶ total CTUh).
  • S1 has highest FWT (90.3 CTUe), while S4 has least FWT (32.9 CTUe).
  • S4 > S3 > S2 > S1 is the order of preference based.
[25]
FU:1 Metric Ton;
LO: Kolhapur
SW: SimaPro 7.0
IM: CML
IC: GWP; ODP; TA; EP; ETP; HTP; POCP
S1: OD
S2: COM
S3: AD
S4: PYR
  • S2 is the best alternative among all the options
  • S1 has highest GWP (6·58 × 107 kg CO2 eq.), while S3 has the least (−101 kg CO2 eq.)
  • S4 is favorable option compared to S3 in terms of energy production due to lower impacts in ETP, HTP, TA, POCP
[26]
FU: 1 Metric Ton
LO: Delhi
ST: EBM
IM: IPCC guidelines
IC: GWP
S1. 9% COM + 91% OD
S2. 22% COM + 78% LF
S3. 10% COM + 12% RDF + 78% LF
S4. 22% AD + 78% LF
S5. 12% RDF + 10% AD + 78% LF
S6. 100% LF
S7. 33% AD + 67% LF
S8. 18% AD + 15% RDF + 67% LF
S9. 22% INC + 78% LF
S10. 22% AD + 17% COM + 61% LF
S11. 11% RDF + 11% COM + 11% AD + 67% LF
S12. 16% RDF + 10% COM + 16% AD + 58% LF
  • S1 has highest GWP (1082 kg eq. CO2), while S12 has least GWP (226.92 kg eq. CO2).
  • Compared with other treatment scenarios with S6, reduction in GWP was attributed to diversion of waste form landfill.
[27]
Table 2. Life cycle inventory data for 1 ton of MSW.
ParameterValueUnitReference
Landfill
Diesel consumption2L t−1[22]
Methane generation55%[39]
LFG Collection efficiency90%[39]
LFG collected (Year 0–55)95% of generated[40]
LFG collected (Year 55–100)0% of generated[40]
LFG Top cover Oxidation36% CH4[41]
Anaerobic Digestion
Electricity (Pre-treatment)12.6kWh[42]
Electricity (Reactor)14kWh[43]
Methane emissions0.5%% of CH4[43]
Transport of compost3L t−1[22]
Electricity recovery (biogas)35%[23]
Land application
N2O-N emissions (direct)1.25% of N-tot[42]
NH3-N emissions15% of N-tot[42]
NO3-N emissions20% of N-tot[42]
Incoming N content4.85kg N-tot[42]
Incoming P content0.65kg P-tot[42]
Incoming K content1.48kg K-tot[42]
Application of digestate20MJ/t digestate[42]
Application of mineral fertilizers0.36MJ/kg N-tot[42]
Incineration
Sodium hydroxide0.24kg[44]
Hydrated Lime10kg[44]
Activated Carbon0.25kg[44]
Ammonia (NH3)0.5kg[44]
Electricity Consumption0.27MWh[43]
Table 3. Environmental impact categories evaluated in this study.
Impact CategoryUnit
Global warming potentialkg CO2 equivalent
Terrestrial acidificationkg SO2 equivalent
Freshwater eutrophicationkg-phosphorus equivalent
Marine water eutrophicationkg-nitrogen equivalent
Human toxicitykg 1,4-dichlorobenzene equivalent
Terrestrial ecotoxicitykg 1,4-dichlorobenzene equivalent
Freshwater ecotoxicitykg 1,4-dichlorobenzene equivalent
Marine ecotoxicitykg 1,4-dichlorobenzene equivalent
Table 4. Monte Carlo analysis results for waste treatment alternatives.
Scenario (↓)MeanStandard DeviationVariance
Impact CategoryGWPUnit: kg CO2 eq.
S2352.65.6732.11
S3205.068.3970.42
S431.7915.98255.56
S5101.886.9648.52
Impact CategoryTAUnit: kg SO2 eq.
S20.585.79 × 10−43.35 × 10⁻⁷
S30.611.06 × 10−31.13 × 10⁻⁶
S40.860.0152.12 × 10−4
S50.365.47 × 10−32.99 × 10⁻⁵
Impact CategoryFEWUnit: kg-P eq.
S22.98 × 10−42.57 × 10−66.6 × 10−12
S32.91 × 10−42.35 × 10−65.56 × 10−12
S4−1.7 × 10−28.38 × 10−47.03 × 10⁻⁷
S52.04 × 10−41.64 × 10−62.68 × 10−12
Impact CategoryMEUnit: kg-N eq.
S20.161.28 × 10−31.66 × 10⁻⁶
S30.171.18 × 10−31.41 × 10⁻⁶
S41.094.45 × 10−21.98 × 10⁻³
S50.118.06 × 10−46.51 × 10⁻⁶
Impact CategoryHTPUnit: kg 1,4 DB eq.
S23.038.89 × 10−37.91 × 10⁻⁵
S32.411.61 × 10−22.47 × 10⁻⁴
S4−163.577.9963.85
S50.743.81 × 10−21.45 × 10⁻³
Impact CategoryTEUnit: kg 1,4 DB eq.
S25.15 × 10−24.33 × 10−41.87 × 10−7
S35.13 × 10−23.96 × 10−41.57 × 10−7
S41.71 × 10−21.65 × 10−32.73 × 10−6
S53.53 × 10−22.82 × 10−47.96 × 10−8
Impact CategoryFWTUnit: kg 1,4 DB eq.
S22.48 × 10−22.12 × 10−44.48 × 10−8
S32.38 × 10−21.95 × 10−43.81 × 10−8
S4−1.909.23 × 10−28.52 × 10⁻³
S51.96 × 10−21.59 × 10−42.53 × 10−8
Impact CategoryMETUnit: kg 1,4 DB eq.
S23.85 × 10−21.81 × 10−43.27 × 10−8
S32.94 × 10−22.84 × 10−48.05 × 10−8
S4−9.34 × 10−26.33 × 10−34.01 × 10⁻⁵
S52.96 × 10−22.65 × 10−47.03 × 10−8
Table 5. Ranking of alternatives based on environmental offset (1 = lowest emissions and 4 = highest emissions).
ScenarioGWPTAFEWMEHTPTEFWTMETMCS
S2423244344
S3334333433
S4141411111
S5212122222
Publisher’s Note: MDPI stays neutral with regard to jurisdictional claims in published maps and institutional affiliations.

