Article

REFOS: A Renewable Energy Multi-Purpose Floating Offshore System

by
Dimitrios N. Konispoliatis
1,*,
Georgios M. Katsaounis
2,
Dimitrios I. Manolas
3,
Takvor H. Soukissian
4,
Stylianos Polyzos
2,
Thomas P. Mazarakos
5,
Spyros G. Voutsinas
3 and
Spyridon A. Mavrakos
1
1
Laboratory for Floating Structures and Mooring Systems, School of Naval Architecture and Marine Engineering, National Technical University of Athens, 9 Heroon Polytechniou Avenue, GR 157-73 Athens, Greece
2
Laboratory for Ship and Marine Hydrodynamics, School of Naval Architecture and Marine Engineering, National Technical University of Athens, 9 Heroon Polytechniou Avenue, GR 157-73 Athens, Greece
3
Laboratory of Aerodynamics, School of Mechanical Engineering, National Technical University of Athens, 9 Heroon Polytechniou Avenue, GR 157-73 Athens, Greece
4
Hellenic Centre for Marine Research, Institute of Oceanography, GR 190-13 Anavyssos, Greece
5
Department of Naval Architecture, University of West Attica, GR 122-43 Egaleo, Greece
*
Author to whom correspondence should be addressed.
Energies 2021, 14(11), 3126; https://doi.org/10.3390/en14113126
Submission received: 26 April 2021 / Revised: 18 May 2021 / Accepted: 25 May 2021 / Published: 27 May 2021

Abstract

:
The present paper deals with the development of a multi-purpose floating tension leg platform (TLP) concept suitable for the combined offshore wind and wave energy resources exploitation, taking into account the prevailing environmental conditions at selected locations along the European coastline. The examined Renewable Energy Multi-Purpose Floating Offshore System (REFOS) platform encompasses an array of hydrodynamically interacting oscillating water column (OWC) devices, moored through tensioned tethers as a TLP platform supporting a 10 MW wind turbine (WT). The system consists of a triangular platform supported by cylindrical floaters, with the WT mounted at the deck’s center and the cylindrical OWC devices at its corners. Details of the modelling of the system are discussed and hydro-aero-elastic coupling between the floater; the mooring system; and the WT is presented. The analysis incorporates the solutions of the diffraction; the motion- and the pressure-dependent radiation problems around the moored structure, along with the aerodynamics of the WT into an integrated design approach validated through extensive experimental hydrodynamic scaled-down model tests. The verified theoretical results attest to the importance of the WT loading and the OWC characteristics on the dynamics of the system.

1. Introduction

Europe added 2.9 GW of offshore capacity during 2020. This brought a total installed offshore wind capacity of 25 GW, corresponding to 5420 grid-connected wind turbines across 12 countries. The average size of offshore wind turbines (WT) amounts to 8.2 MW, 0.5 MW larger than in 2019, with an average distance to shore 52 km and an average water depth of 44 m [1]. According to [2], 323 GW of cumulative wind energy capacity would be installed in the European Union (EU) by 2030 (i.e., 253 GW onshore and 70 GW offshore) supplying up to 24% of electricity demand. These trends show that the number of offshore farms will increase rapidly, installed into deeper waters and further away from the shore. Concerning the recoverable wave energy exploitation over 0.6 MW capacity installed at the end of 2019, an increase of 25% compared to 2018 [3], whereas the ocean energy industry estimates that 100 GW of capacity can be deployed in Europe by 2050 [4].
Costs for offshore wind and wave energy exploitation continued to fall in 2019. However, the levelized cost of energy (LCOE) of offshore wave energy remained much higher (i.e., to a value of around 0.6 EUR/kWh) compared to the corresponding cost of offshore wind (i.e., 0.115 EUR/kWh) [5]. One promising alternative to reduce the cost and increase the performance of renewable technologies is the investigation of the technological and economic feasibility of hybrid systems, combining offshore wind turbines with wave energy converters (WEC) and/or hydropower plants [6,7,8] into one hub. Such systems can represent a cost-effective engineering solution by increasing the anticipated energy extraction to production cost ratio when compared to the corresponding one applicable to separate exploitation of offshore wind and wave energy sources [9]. Specifically, as the wind and wave energy converters can share common infrastructure (the floater, the electrical cable and the power transfer equipment) costs related to infrastructure, mooring, foundation, transmission, connection to the grid, operation and maintenance (O&M) are shared. In addition, the ecological footprint of a hybrid structure is expected to be lower than that of separate technologies. Also, the hybrid exploitation of offshore wind and wave energy resources is enhanced since the swells continue after the wind has declined, reducing the time periods of zero electricity production.
Although this type of hybrid system is still far from commercial use, several concepts based on the oscillating water column (OWC) principle have been reported in the marine sector in an early stage of application, e.g., [10,11,12], to name a few. Furthermore, numerous studies on hybrid systems capable of harnessing simultaneously the wind and the wave energy sources have been reported in the literature in the last few years. Aubault et al. [13] proposed a floating foundation for multi-megawatt WT combined with an OWC device and performed a numerical analysis validated through relevant experiments. Mazarakos et al. [14,15] presented a coupled hydro-aero-elastic analysis of a multi-purpose tension leg platform (TLP), encompassing three hydrodynamically interacting OWCs, suitable for supporting a 5 MW WT. The analysis concerned numerical and experimental modeling of the system. Katsaounis et al. [16] presented an experimental investigation of the hydrodynamic behavior of a TLP triangular platform supporting a 5 MW wind turbine and three OWC devices. The surge response of the platform was experimentally verified, together with the resulting pressures and air fluxes inside the OWC chamber and the dynamic mooring line tensions. Additionally, in [17] a coupled hydro-aero-elastic analysis of the latter hybrid structure was presented to incorporate properly the solutions of the diffraction and motion radiation problems around the floater and the aerodynamics of the WT in the frequency and time domain, whereas in [18] a parametric study in the frequency domain was conducted concerning the effect that the number of OWCs of the hybrid structure has on the system’s efficiency. In addition, Sarmiento et al. [19] presented an experimental work to validate the hydrodynamic performance of a floating triangular semisubmersible structure combining three OWCs with a 5 MW WT, using a conventional catenary mooring system. Contrary to the floating hybrid systems, the case of a bottom mounted hybrid system has also attracted scientists. Specifically, Perez-Collazo et al. [20,21] carried out an experimental investigation of an OWC attached to a monopile WT support structure. A mathematical model analyzing the hydrodynamics of a novel OWC consisting of a coaxial cylindrical structure forming a mono-pile in order to support a WT has been developed and experimentally validated by Michele et al. [22]. Recently, Zhou et al. [23] investigated numerically and experimentally the hydrodynamic performance of an oscillating water column WEC, integrated into a monopile-mounted offshore WT, whereas Cong et al. [24] presented a detailed numerical analysis for the case of an OWC integrated into a 5 MW WT in both regular and irregular sea states.
The Renewable Energy Multi-Purpose Floating Offshore System (REFOS) structure encompasses an array of hydrodynamically interacting OWC devices, moored through tensioned tethers as a TLP platform supporting a 10 MW WT. The system consists of a triangular platform supported by cylindrical floaters with the WT mounted on a supporting central cylinder at deck’s center and the cylindrical OWC devices at its corners. The OWC consists of two concentric cylinders, with the water entering through the subsurface opening into the annular chamber between the two cylinders that contains air. The wave action causes the captured water column to rise and fall like a piston, compressing and decompressing the air. As a result, there is an air flow moving back and forth through an air turbine coupled to an electric generator. In the center of the platform a cylindrical solid body is arranged to support the WT. The general arrangement of the floating supporting structure is depicted in Figure 1.
The main objective of the present manuscript is to present in a systematic way a frequency-domain analysis approach, along with its experimental verification for the coupled hydro-aero-elastic analysis of the REFOS hybrid structure, taking into account the prevailing environmental conditions at selected locations along the European coastline (i.e., Mediterranean and North Sea). Advanced numerical calculations are conducted to simulate the dynamic response of the floating platform under combined wind and wave loading conditions. The method represents an effective design tool for the analysis of a floating WT and multi-purpose floating solutions at the first stages of their development, offering a fast analysis methodology for the investigation of alternative design concepts. Furthermore, this work comprises the design of the experiments as well as the selection of the measuring instrumentation for the scaled down model tests.
The present manuscript is structured as follows: Section 2 defines the characteristics of the REFOS platform, whereas in Section 3 the wind and wave climate analysis for three selected potential installation locations in the European coastline (i.e., two in the Mediterranean Sea and one in the North Sea) are presented. Section 4 deals with the hydrodynamic analysis of the floating structure. The analysis is implemented in the frequency domain, under the action of regular waves, involving the hydrodynamic modeling of the floater through an analytical method composing the solutions of the diffraction, motion- and pressure- radiation problems. In addition, the formulation of the aero-elasto-dynamic problem due to the WT, and the solution of the coupled hydro-aero-elastic problem of the floating supporting structure, the WT, the OWCs and the mooring system is performed. Section 5 stands for the detailed presentation of the experiments conducted for evaluating the hydrodynamic behavior of the REFOS structure and for validating the numerical results. Final, the conclusions are drawn in Section 6.

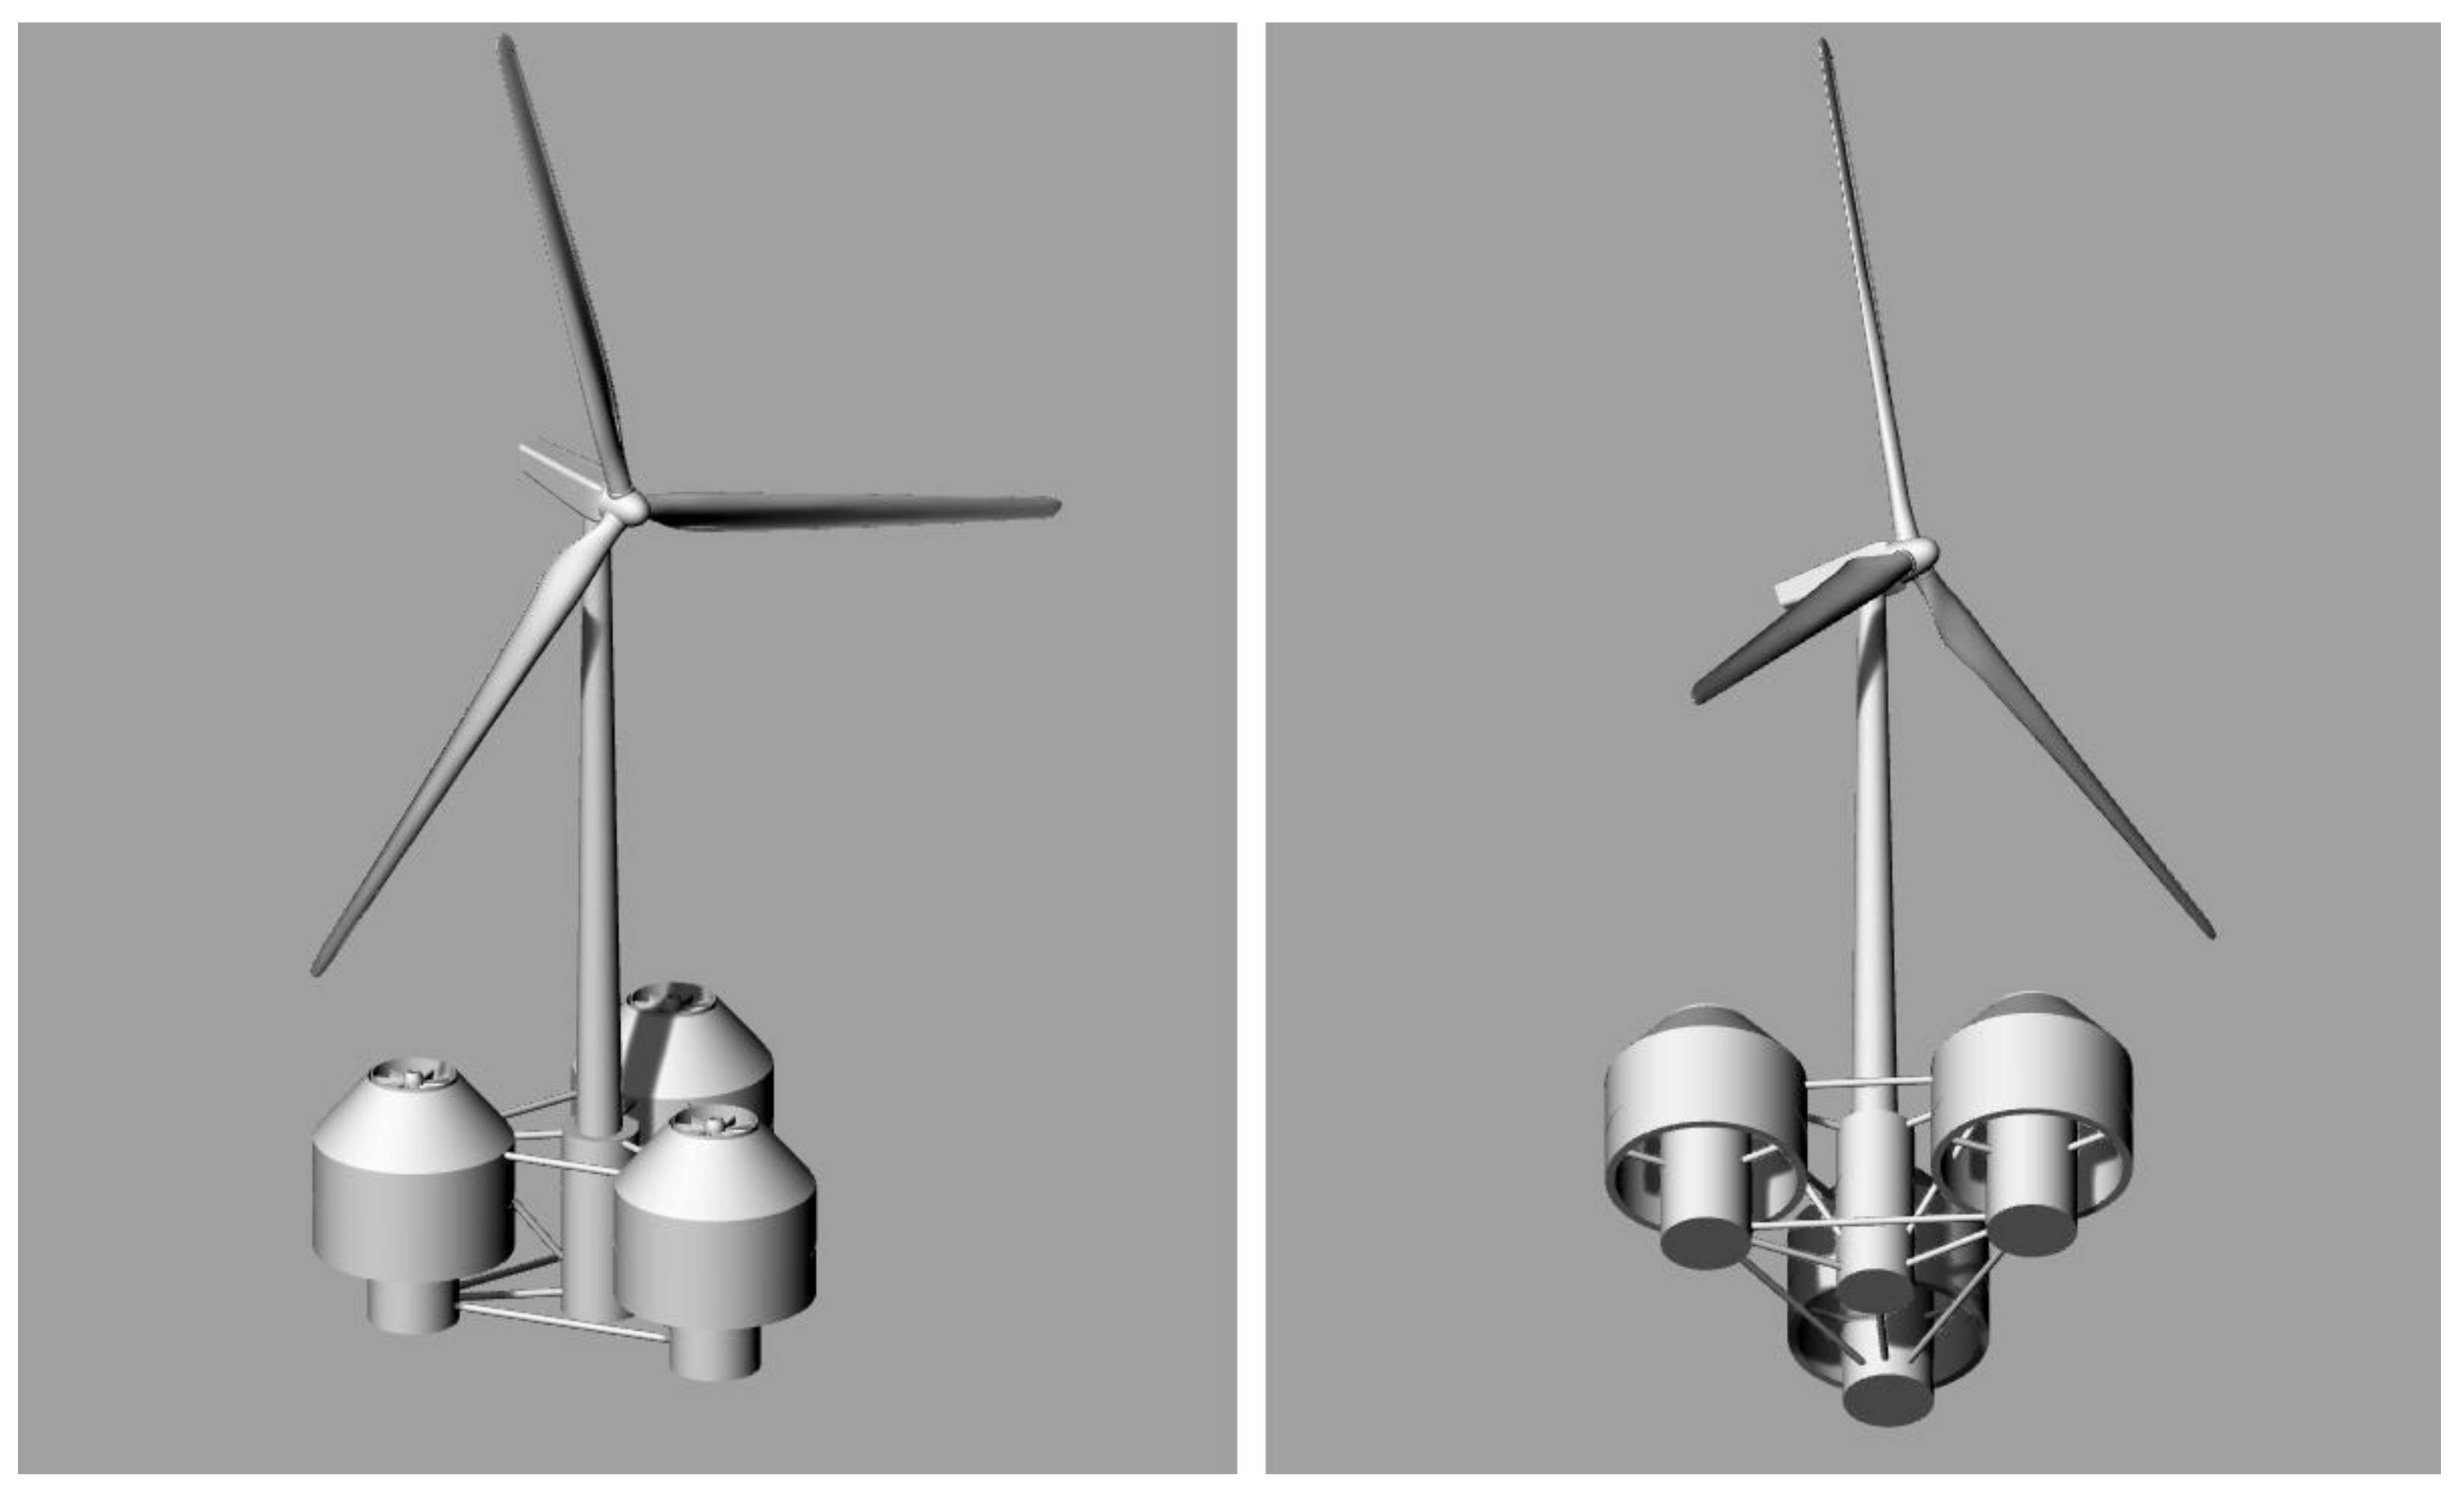
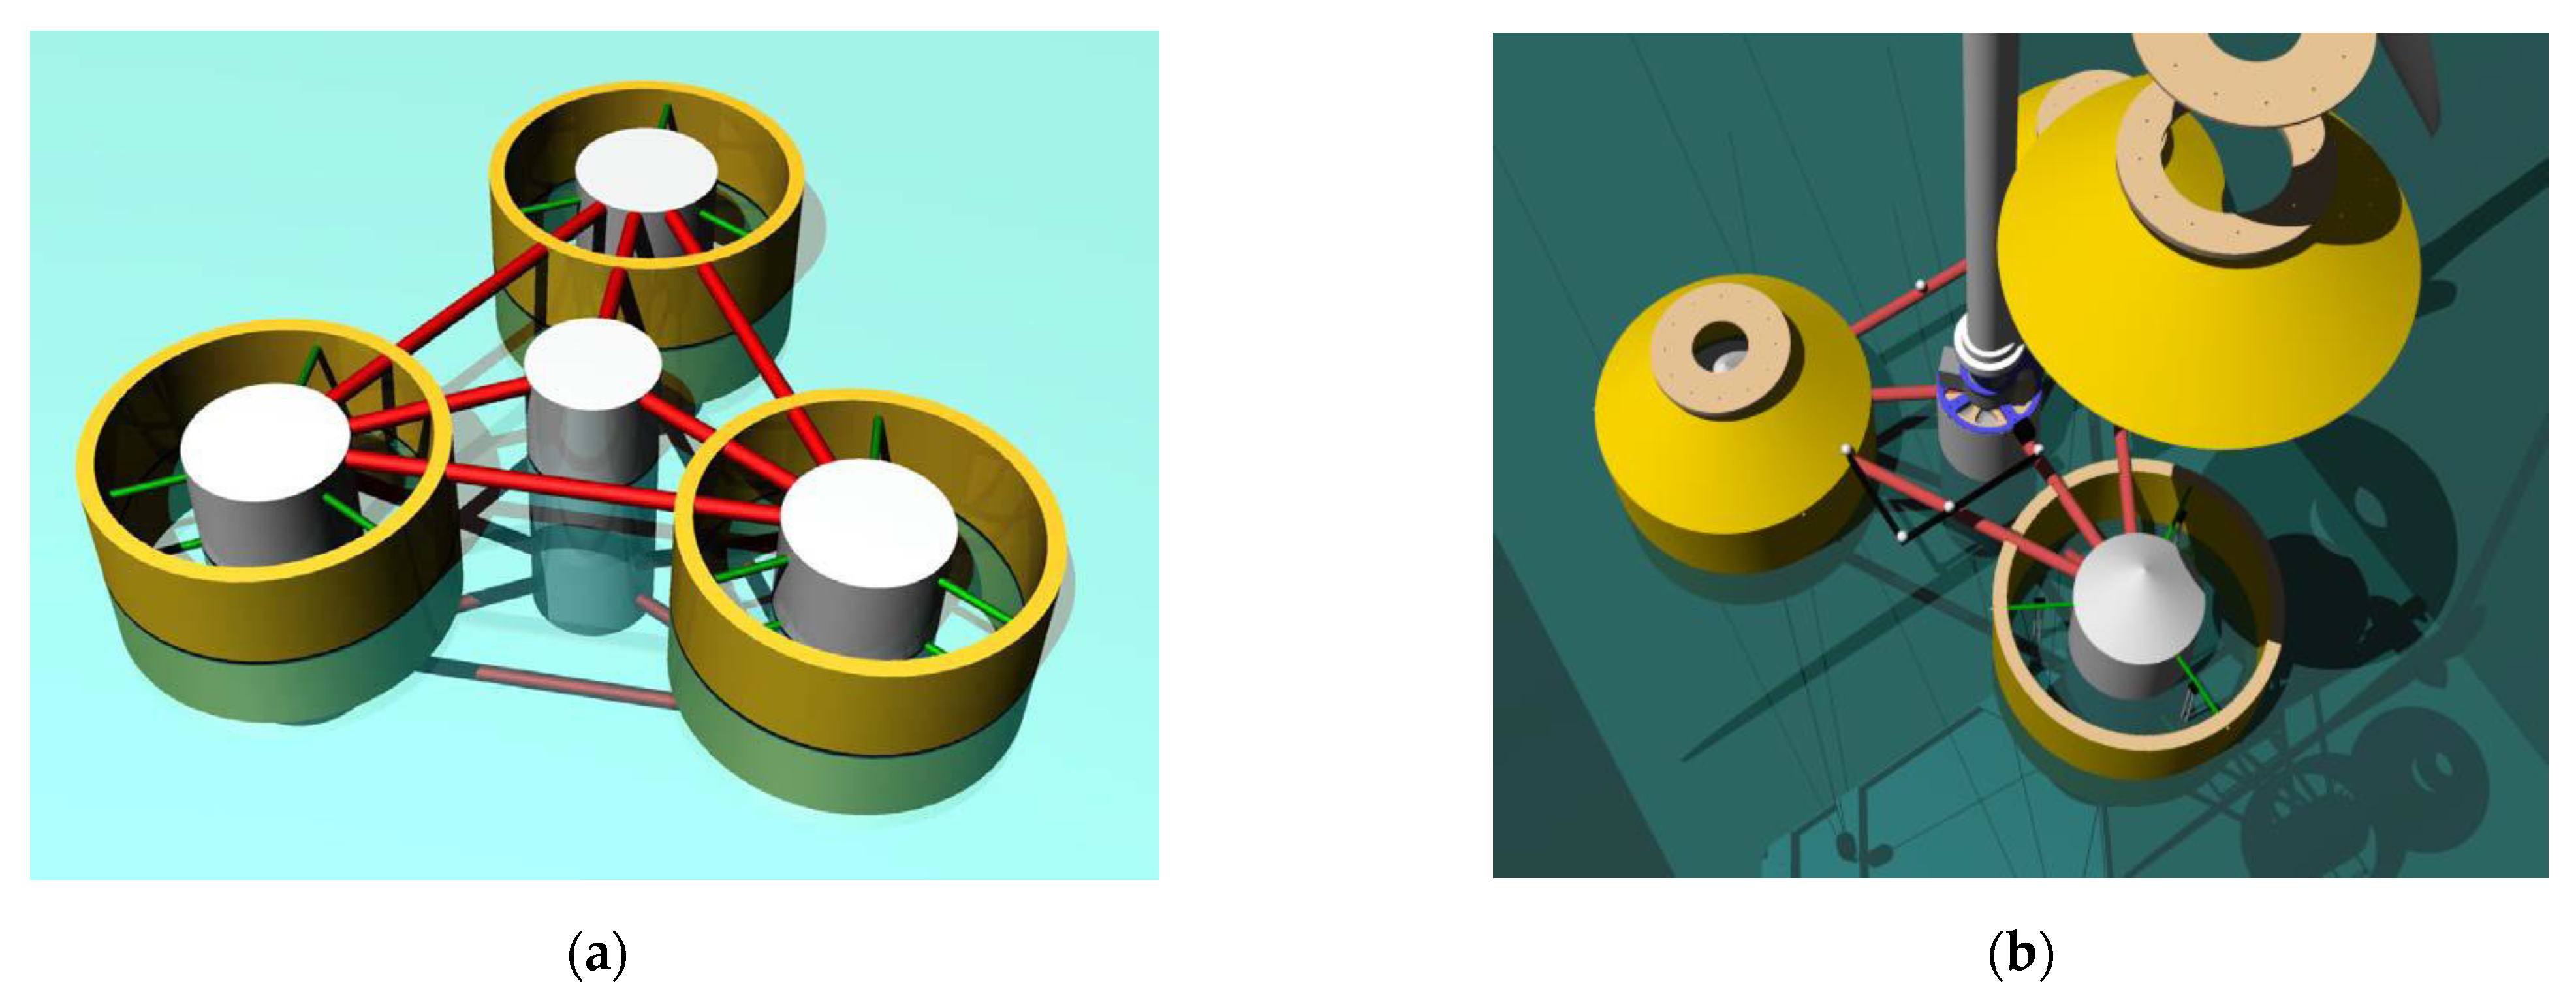
2. Description of the Renewable Energy Multi-Purpose Floating Offshore System (REFOS) Platform

The REFOS floating system has been developed for supporting the DTU 10 MW Reference WT [25]. It encompasses an array of three identical OWC devices, which can oscillate about their mean equilibrium position moving as a unit in a triangular configuration. Each OWC consists of an annular oscillating water surface enclosed between an exterior partially immersed toroidal cylindrical body and a concentric interior truncated cylinder. In the center of the platform, a solid cylindrical body is placed to support the WT (see Figure 2). A summary of the geometric characteristics of the floater, including the diameters of each of the members and the mass distribution among the constitutional parts of the platform is provided in Table 1 and Table 2. These properties are all relative to the undisturbed position of the platform. The mass, including ballast, of the floating platform is 9550 t. This mass was calculated such that the combined weight of the rotor-nacelle assembly, tower, platform, plus the applied TLP pretension and the weight of the mooring system in water, balances with the buoyancy (i.e., weight of the displaced fluid) of the platform in the static equilibrium position in still water.
To secure the platform, the floating structure is moored with a TLP mooring system of three tendons spread symmetrically about the platform Z-axis. The fairleads (body-fixed locations where the mooring tendons attach the platform) are located at the base of the offset columns, at a depth of 20 m below SWL. The anchors (fixed to the inertia frame) are located at a water depth of 180 m below SWL. Each of the three tendons has an upstretched length of 160 m. The mooring system properties are listed in Table 3. The TLP increases the vertical stiffness of the floating system, which reduces the heave period. Hence, the heave period can be shifted out of the high-energy region of the sea spectrum. From a static stability point of view, this pretension can be considered as a point mass located at the connection point of the tension leg. In addition to the resulting downward shift of the virtual center of gravity, the center of buoyancy is also moved downward in an absolute sense since additional buoyancy is required to compensate the pretension.
As far as the air turbine at the top of the oscillating chamber is concerned, it is assumed in the present contribution that a same Wells type air turbine is applied in each OWC device regardless their position to the wave impact. Assuming isentropy so that variations of air density and pressure are proportional to each other with c a i r 2 = d p i n 0 i d ρ a i r ,   c a i r being the sound velocity in air and p i n 0 i the inner pressure distribution inside the chamber of each OWC, i = 1, 2, 3, each air turbine can be represented by a pneumatic complex coefficient Λ [26,27]:
Λ i = q i p i n 0 i = [ K D ρ α i r Ν + ( i ω ) V 0 c a i r 2 ρ a i r ]  
Here, q i is the air volume flow through the air turbine of the i = 1, 2, 3 OWC device, whereas Ν is the rotational speed of turbine blades, D the outer diameter of turbine rotor, ρ α i r   the static air density and V 0   the device’s air chamber volume. The empirical coefficient K depends on the design, the setup, and the number of turbines. The real part of Λ is related to the pressure drop through the turbine, whereas the imaginary part of Λ is associated with the effect of the thermodynamics of the compressible flow inside the OWC chamber and through the air turbine.
In the REFOS case, two Wells-type air turbines were installed in each OWC. The turbines’ pneumatic admittance Λ of each OWC device equals to 343.848 m5/(kN.s) and 125.115 m5/(kN.s), for the installation locations in the Mediterranean Sea and in the North Sea, respectively. Concerning the air turbine characteristics, these were selected as presented in [28], without taking into consideration the thermodynamic effects which were out of the scope of the present contribution. An analytical description of the REFOS air turbine design is presented in [29].

3. Environmental Conditions and Design Values

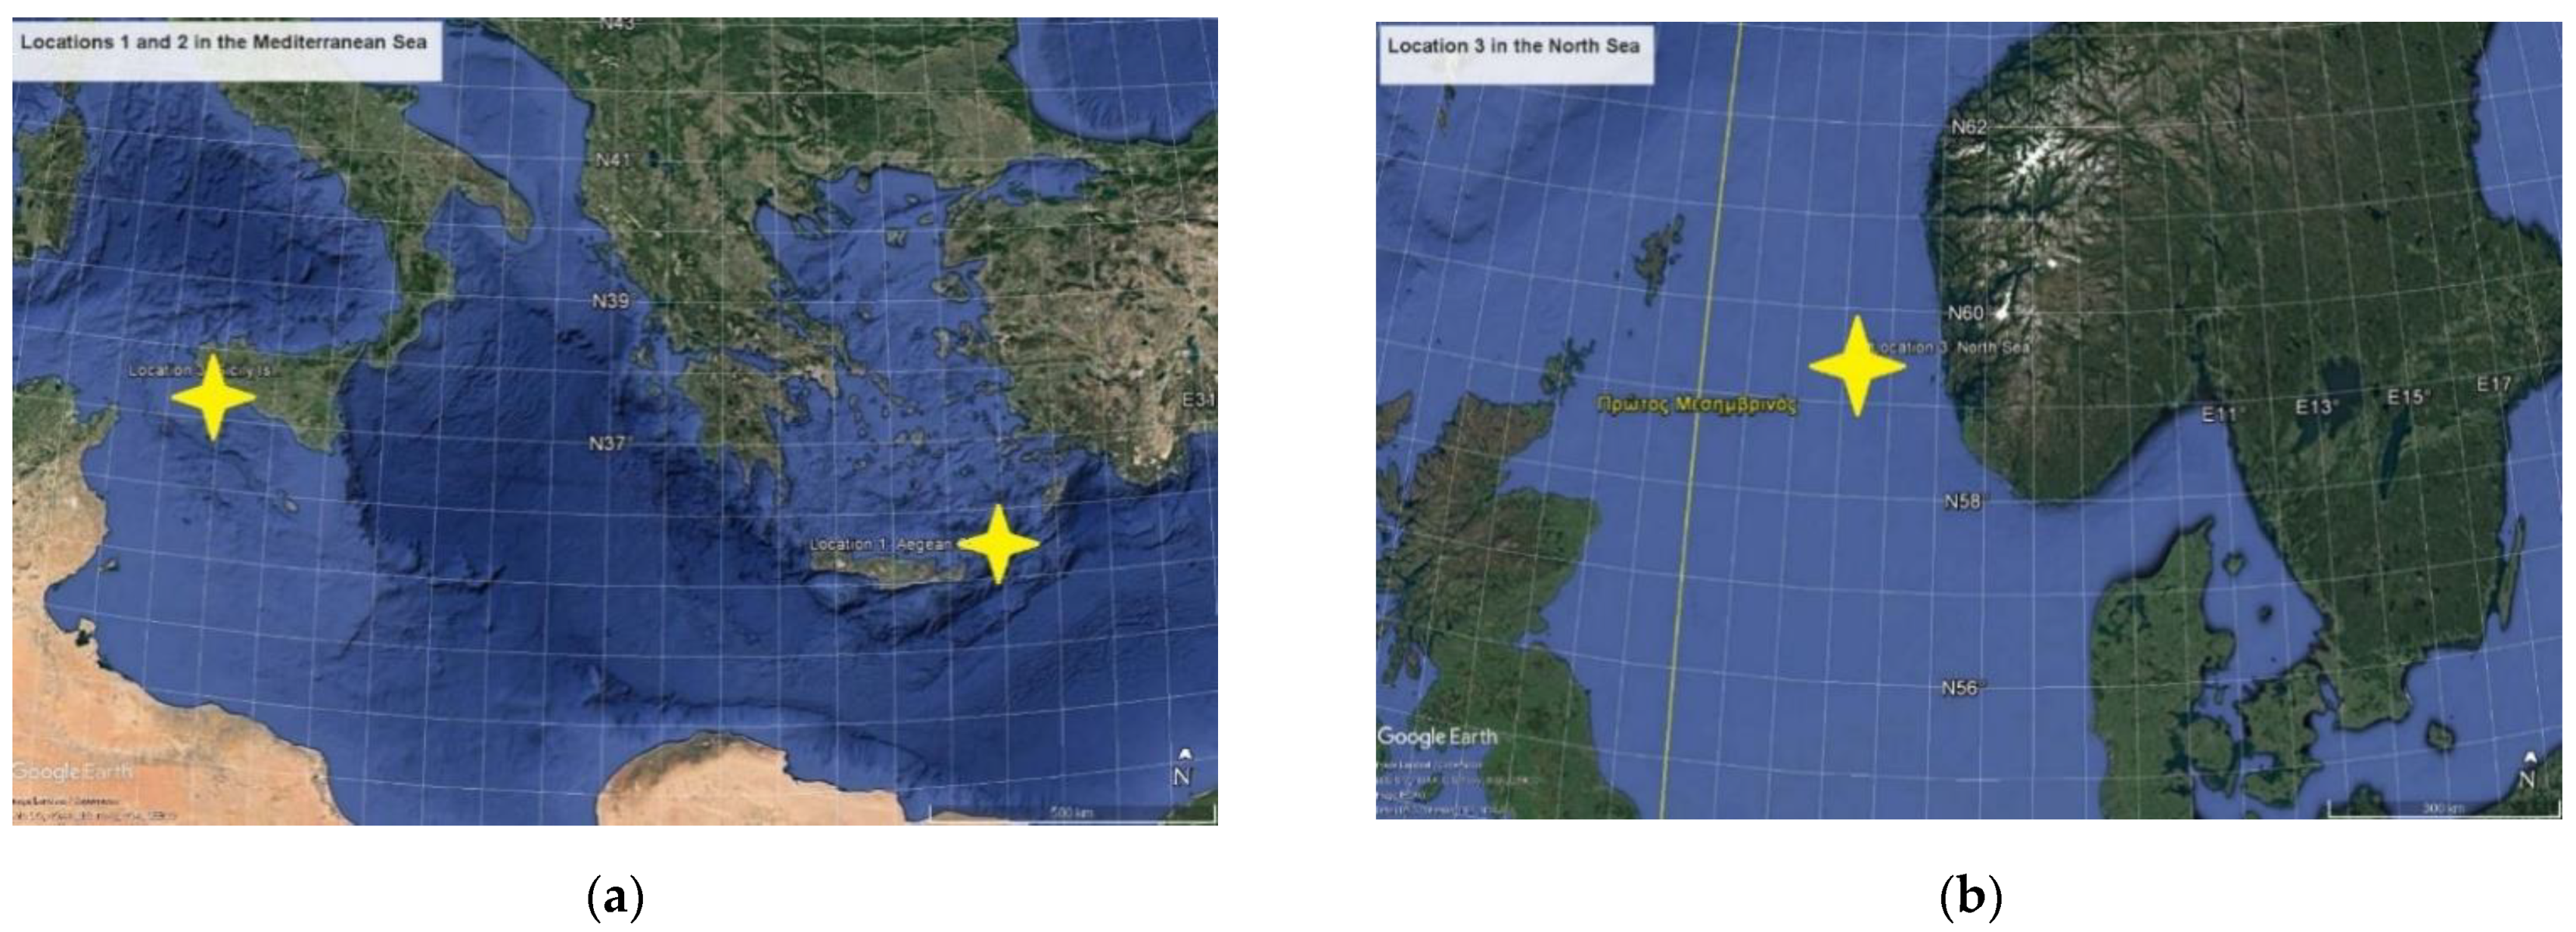
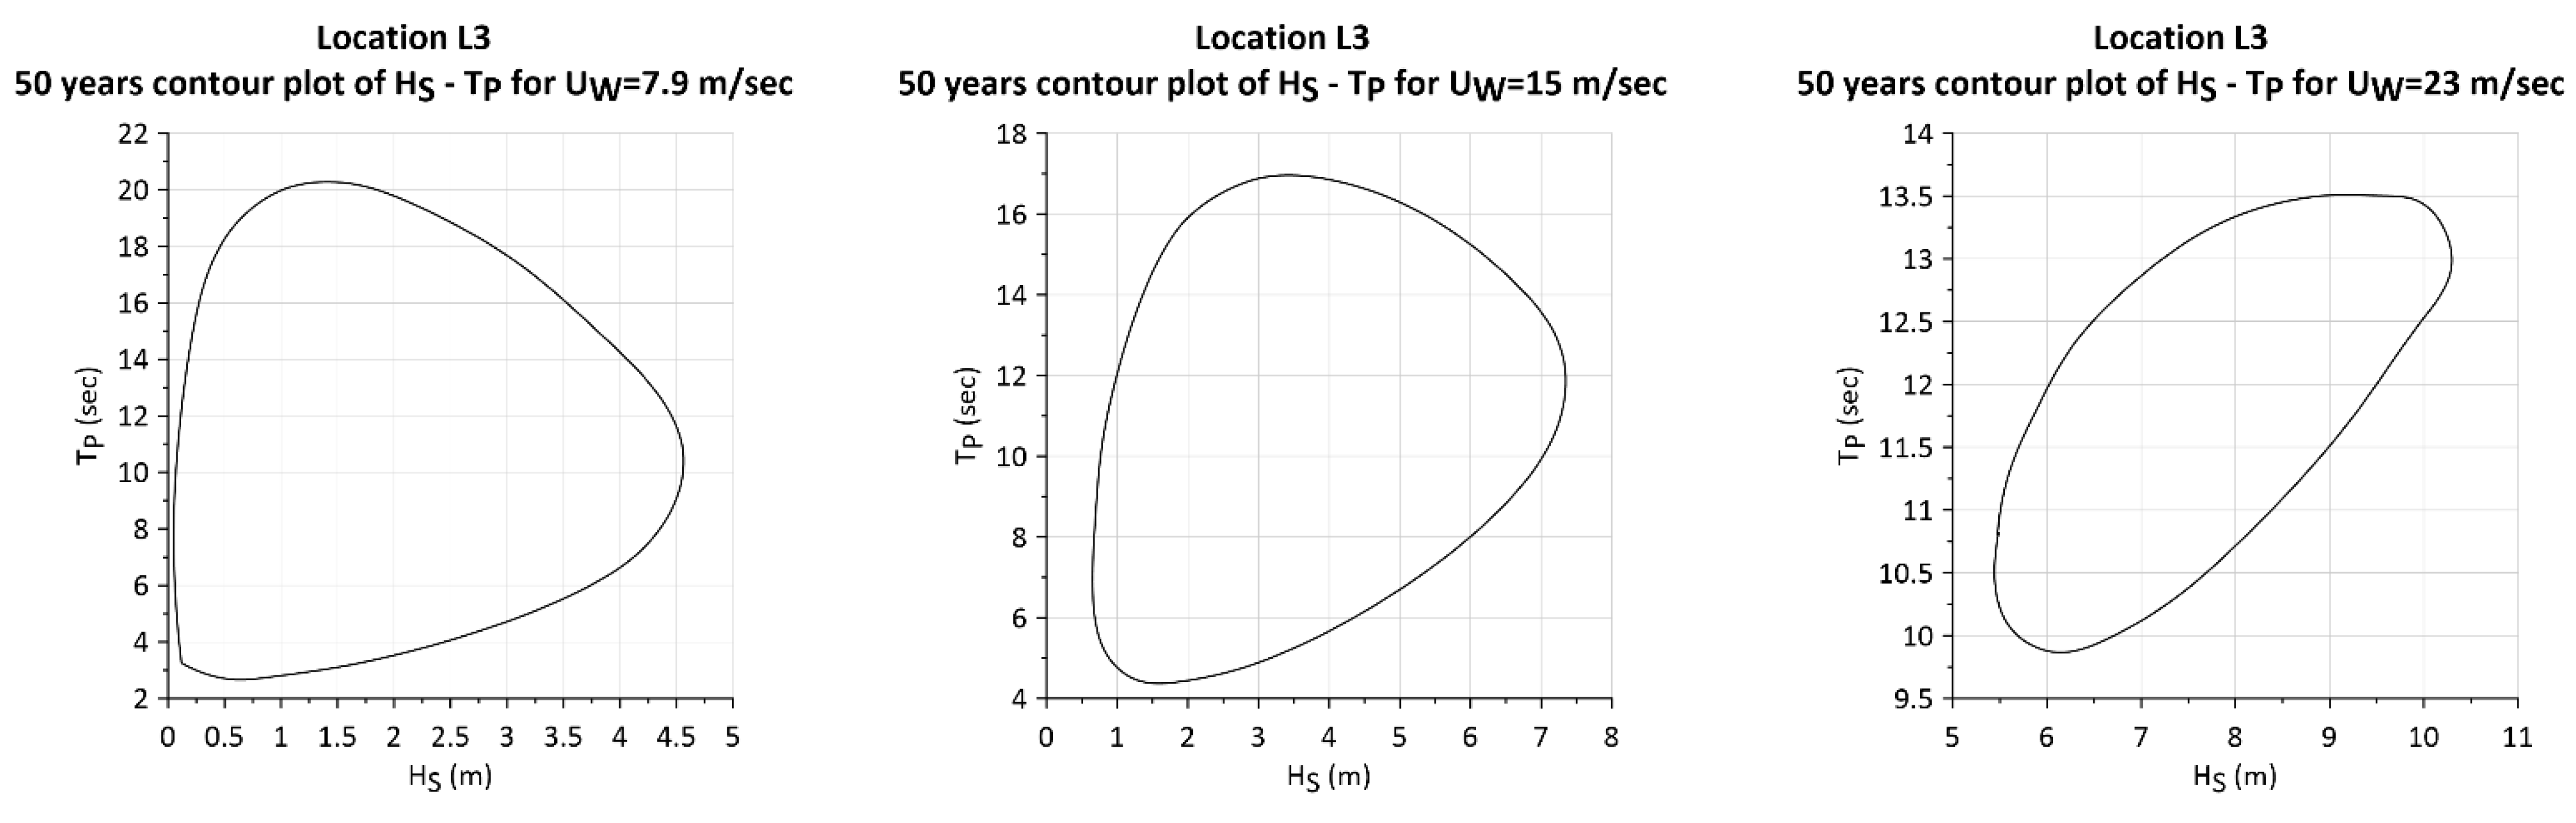
3.1. Wind and Wave Climate

Wind and wave climate analysis has been performed for three potential installation locations, i.e., two in the Mediterranean Sea (one in the Greek waters, L1, with coordinates 35.34° N, 26.80° E and the other in Italian waters, L2, with coordinates 37.30° N, 12.69° E) and one location, L3, in the North Sea (Norwegian waters) with coordinates 59.42° N, 3.40° E (see Figure 3). The examined locations correspond to water depths around 180 m. The original simulated time series extended to 111-years period (1900–2010). The analysis is based on atmospheric reanalysis results obtained by the Era-20C data set [30,31]. In order to avoid non-stationarity issues in the statistical and extreme value analysis, the last 31 years of available time series, i.e., met-ocean data covering the period 1980–2010 have been considered.
In Table 4 the basic statistical characteristics (mean value m , minimum m i n , maximum m a x , standard deviation s , coefficient of variation C V , skewness S k and kurtosis K u coefficients, along with the available sample size N ), are presented for the significant wave height H s , the spectral peak period T p and the wind speed U w , for each examined location. It can be seen that the most intense sea-state and wind conditions are encountered in location L3 (mean and overall maximum significant wave height, 1.999 m and 9.774 m, respectively, and mean wind speed 7.856 m/s). In addition, the overall maximum wind speed (23.196 m/s) occurs in location L3. The largest variability is exhibited for significant wave height at location L2 (82.809%) and the minimum for spectral peak period at location L1 (20.235%).

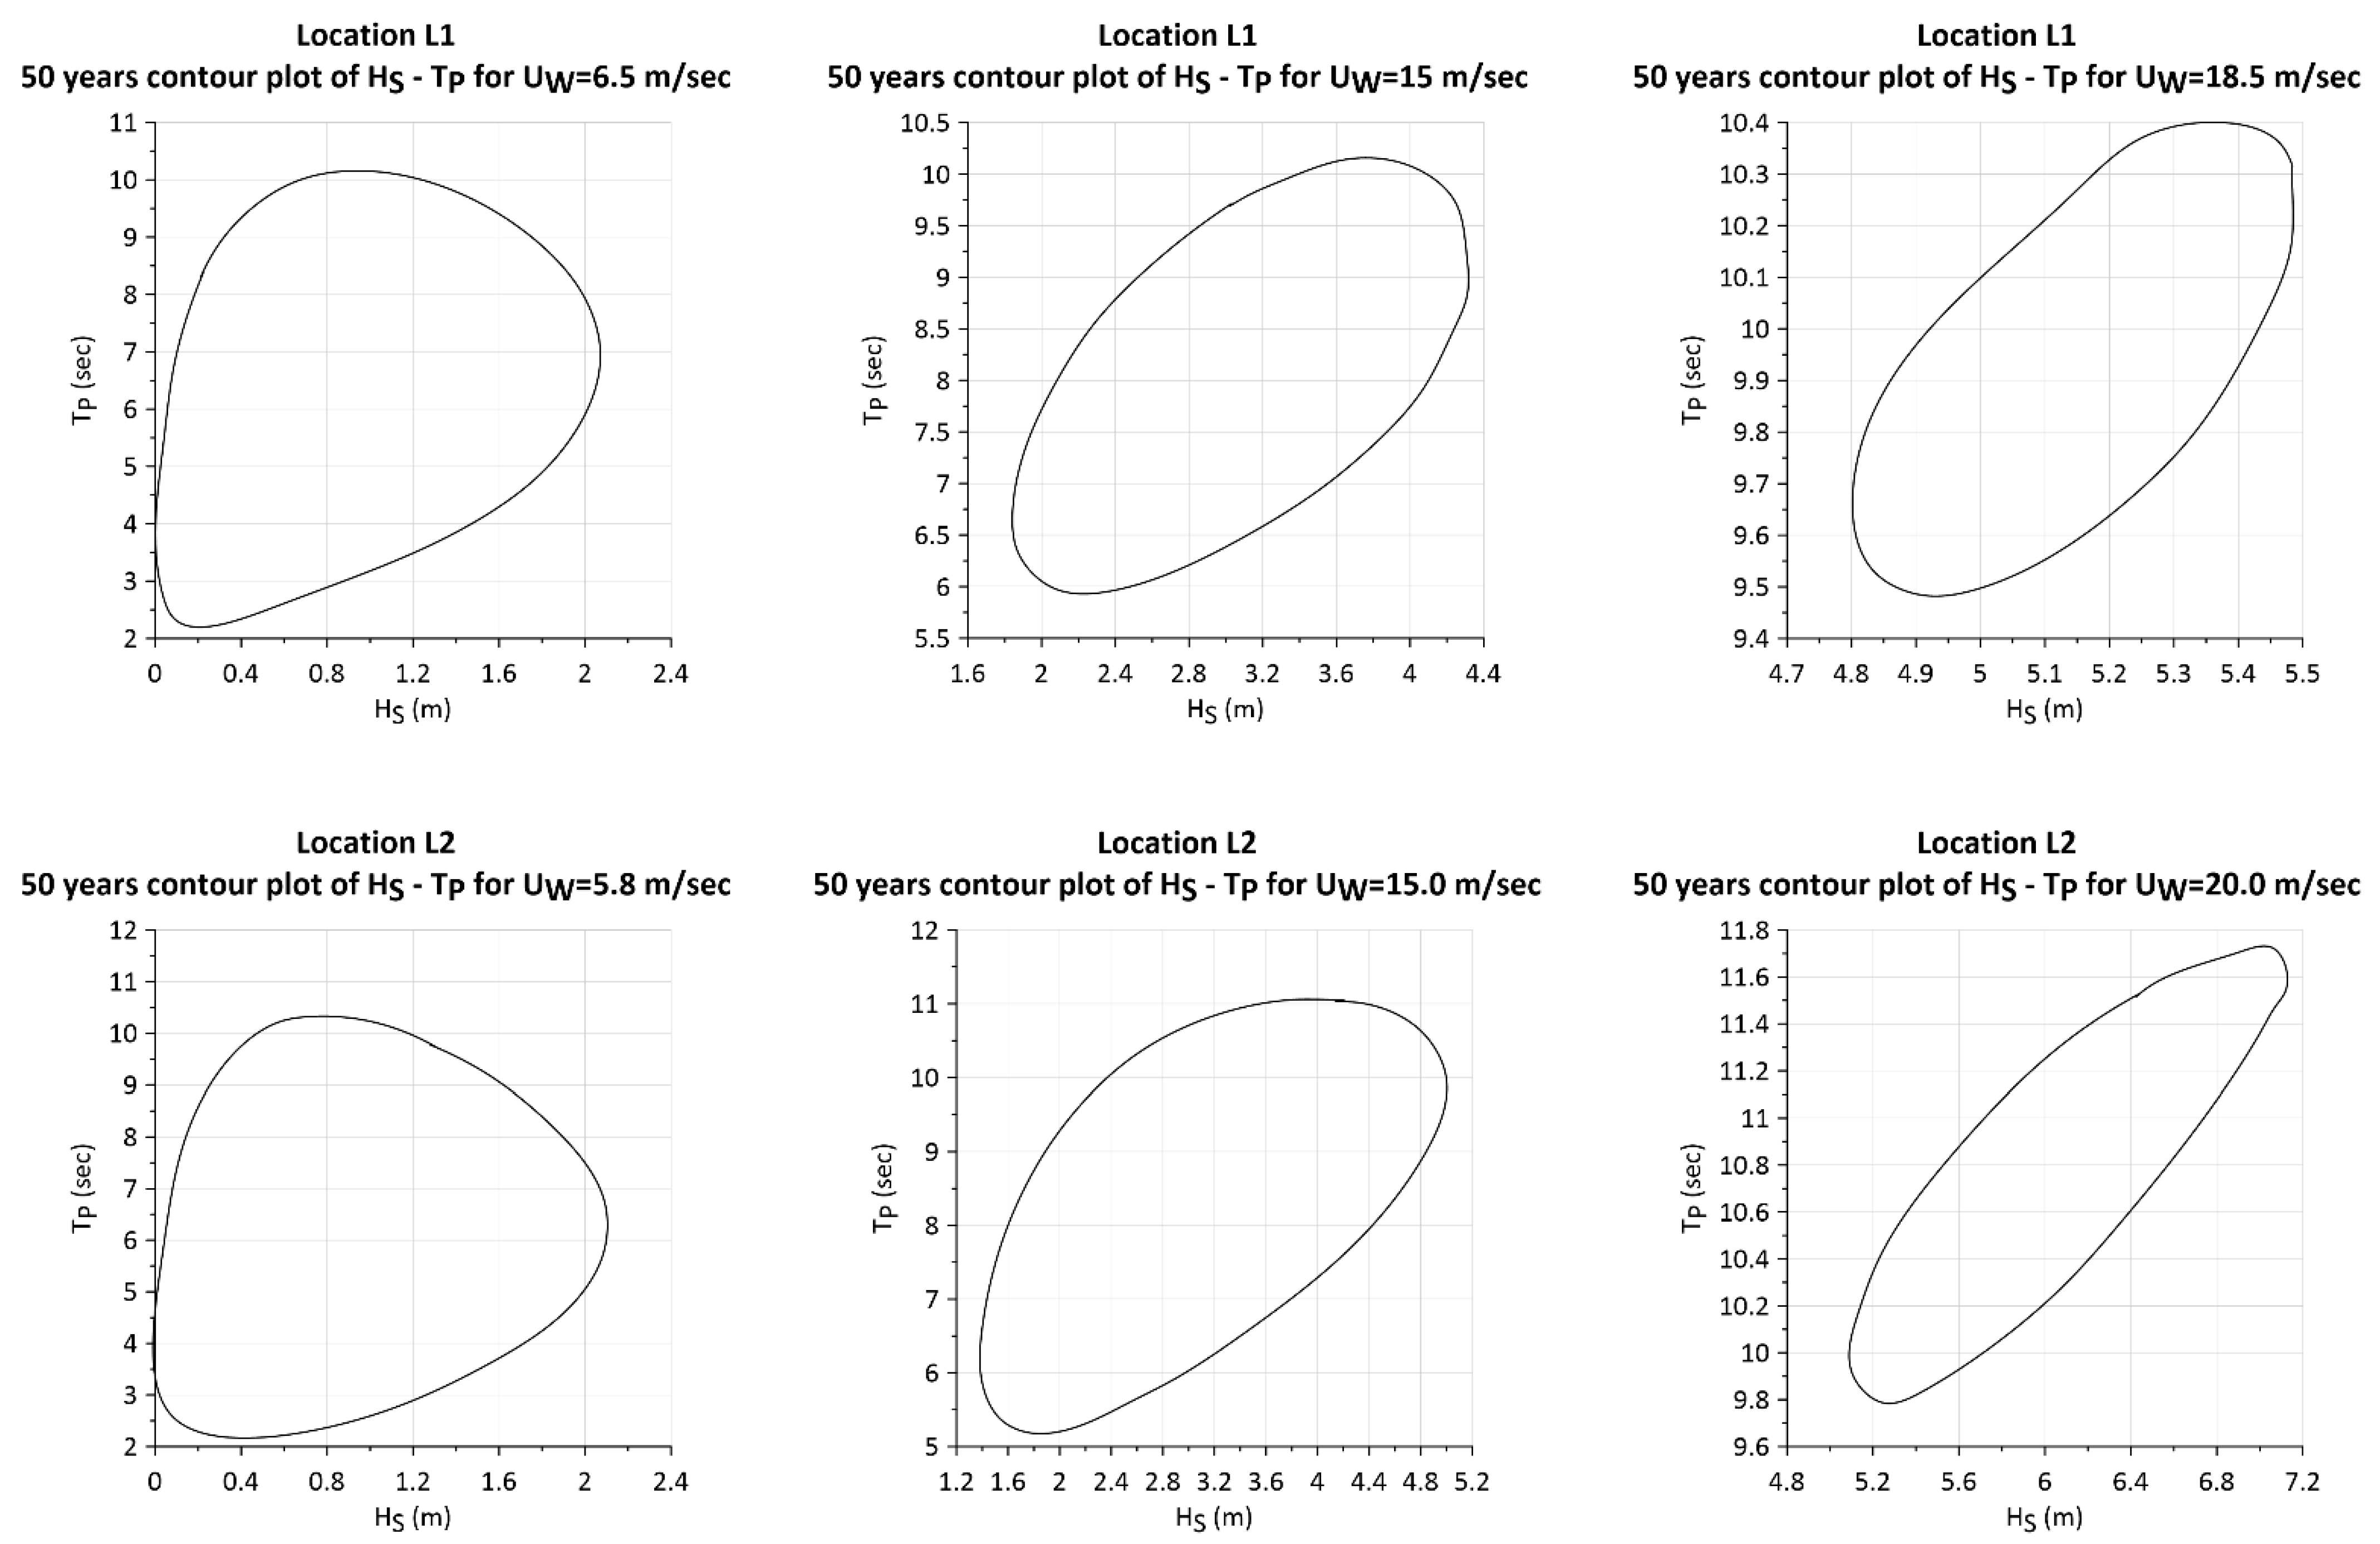
3.2. Extreme Value Analysis of Wind and Sea States

Furthermore, the univariate and multivariate design values of the significant wave height, the wind speed and the wave spectral peak period are estimated. The estimation of univariate design values of ocean environmental characteristics (significant wave height, wind speed, etc.), is a well-studied topic based on extreme value analysis principles; see e.g., [32,33,34,35]. In the context of met-ocean extreme value analysis, the directional covariate (sea-state direction, wind direction) is also of great interest, see e.g., [36,37,38].
Nevertheless, the assessment of the extreme value behavior of multivariate random variables is, in principle, an open theoretical field. In contrast to the univariate extreme case, the theory of multivariate extremes is characterized by theoretical difficulties which have not been fully resolved yet. For the assessment of this problem some alternative methods have been proposed by the ocean engineering community. These methods though, are valid under some important theoretical assumptions; however, in practice they seem to perform satisfactorily. The most well-known method is based on conditional distributions and transformations of random variables, which is used in the present manuscript for the estimation of the trivariate design values for H s ,   T p , U w . See also [39,40].
Let f U H T ( U w , H s , T p ) and F U H T ( U w , H s , T p ) denote the joint probability density function (pdf) and cumulative distribution function (cdf), respectively, of the random variables U w ,   H s ,   T p . Assuming that the T p is almost independent from the H s , f U H T ( U w , H s , T p ) can be expressed as follows:
f U H T ( u , h , t ) f U ( u ) f H | U ( h | u ) f T | H ( t | h ) ,
where, f U ( u ) denotes the marginal pdf of   U w , f H | U ( h | u ) denotes the conditional pdf of H s given U w , and f T | H ( t | h ) denotes the conditional pdf of T p given H s .
In order to evaluate the joint environmental contours (and therefrom the design values) of H s ,   T p , U w , the joint pdf in Equation (2) must be first transformed by implementing the Rosenblatt transformation in a new non-physical space, where H s ,   T p , U w will be reflected into Gaussian and independent variables,   U 1 ,   U 2 , U 3 , respectively, [41]. This approach is also described and applied for the 2-D analysis of met-ocean parameters in [42,43,44,45]. To implement the transformations the following mapping is used:
F U ( u ) = Φ ( u 1 ) ,     F H | U ( h | u ) = Φ ( u 2 ) ,     F T | H ( t | h ) = Φ ( u 3 ) ,
where Φ ( x ) stands for the standard normal distribution N ( 0 , 1 ) , i.e., the Gaussian distribution with zero mean value and unit standard deviation. For obtaining the variables U 1 ,   U 2 , U 3 the inverse relations of Equation (3) are used. Nevertheless, the estimation of the environmental contours is a very delicate procedure and depends on many decisions made by the designer in all stages of the method implementation. In the new non-physical space U 1 U 2 U 3 , the n   year return period is defined as a circle with radius r , provided by the following relation:
F ( r ) = 1 1 N n years ,
where N n years is the number of met-ocean “states” expected to occur within n-years. In the present work, the radius r has been calculated for the ultimate limit state analysis, which corresponds to 50 years. For a sampling period of 3 h, from Equation (4), it is obtained:
r = F 1 ( 1 1 365.25 · 8 · n ) .
To return back to U w ,   H s ,   T p , the following relations are used:
U w = F U 1 [ Φ ( u 1 ) ] ,     H s = F H | U = u 1 [ Φ ( u 2 ) ] ,     T p = F T | H = h 1 [ Φ ( u 3 ) ] .  
In general, for the space U 1 U 2 U 3 all the possible combinations of u 1 ,   u 2 , u 3 with return periods n-years can be obtained (i.e., the loci of points u 1 ,   u 2 , u 3 that have a distance from the u 1 u 2 u 3 axis start equal to the particular r that corresponds to 50-years). Transformation of Equation (6) provides all the possible combinations of H s ,   T p , U w with the same return period.
In order to construct the joint pdf f U H T ( u , h , t ) , the estimation of f U ( u ) ,   f H | U ( h | u ) ,   f T | H ( t | h ) , is necessary. For the marginal pdf of U w , the 2-parameter Weibull pdf is adopted that is provided by the following relation:
f U ( u ) = α β ( u β ) α 1 exp [ ( u β ) α ] ,
where α and β denote the shape and scale parameters, respectively.
Weibull pdf has been widely used for the modelling of wind speed. However, let it be noted that the selection of a (any) particular distribution for the description of the involved variables may have significant effects on the numerical results obtained by the procedure.
For the estimation of f T | H ( t | h ) , the two-parameter log-normal distribution is used, i.e.,
f T | H ( t | h ) = 1 t σ 2 π exp [ 1 2 ( log ( t ) μ σ ) 2 ] ,
where μ and σ denote the mean and standard deviation of log ( T p | H s ) .
In this respect, the H s –sample is discretized to different H s –classes (with bin size 0.5 m). The parameters m i , s i , for i = 1 , 2 , . . , K H , of the log-normal distribution of T p for the different significant wave height bins are estimated using the maximum likelihood method (MLM), where K H denotes the number of H s –bins. For conditioning spectral peak period with significant wave height, the parameters of the log-normal distribution for the different K H bins of H s should be expressed as functions of the latter variable. Following [45], the general expressions for the log-normal distribution parameters are the following:
m i = c 1 + c 2 h i c 3 ,   s i 2 = d 1 + d 2 e d 3 h i ,   i = 1 , 2 , . . . . , K H .
In Equation (9) c 1 , c 2 , c 3 and d 1 , d 2 , d 3 are the sought-for parameters, m i ,   s i 2 denote the values of the log-normal parameters for each bin of H s , and h i denotes the central bin value. For the solution of the above system, the non-linear least squares method has been implemented.
The next step is the estimation of f H | U ( h | u ) . This task is performed by discretizing the U w –domain in appropriate cells, where the estimation of the analytic form of f H | U ( h | u ) will take place. Since the high values of H s are the most interest, from [45],   f H s | U w ( h | u ) is modelled through a Weibull distribution function. In this regard, the parameters of the Weibull distribution for the different bins of wind speed are expressed as functions of the latter variable. The general expressions for the Weibull distribution parameters are the following:
α i = a 1 + a 2 u i a 3 ,   β i = b 1 + b 2 u i b 3 ,   i = 1 , 2 , . . , K U .  
Here, a 1 , a 2 , a 3 and b 1 , b 2 , b 3 are the sought-for parameters,   α i , β i denote the values of the Weibull distribution parameters for each bin of wind speed,   u i denotes the central wind speed value of the bin, and K U denotes the number of U w –bins. For the solution of the above system the non-linear least squares method has been also implemented.
By applying the procedure described above, the contour surfaces with return periods of 50 years have been estimated for the corresponding U w , H s , T p combinations. In particular, from the 3D 50 year contours of U w , H s , T p the U w ,   m a x and H s ,   m a x have been identified and the corresponding (associated) values of the other two variables (i.e., H s , T p and U w , T p , respectively) are provided in Table 5.
Then, for various threshold values of U w the corresponding 2D 50-year contours of H s , T p are also provided (see Figure 4).

4. Coupled Hydro-Aero-Elastic Formulation

4.1. Formulation of the Hydrodynamic Problem

The detailed potential theory of the hydrodynamic problem of an array of OWC devices has been reported extensively in [46,47]. For completeness, a short outline of the relevant theory is presented herein.
The group of four bodies (3 OWCs and 1 vertical cylindrical body supporting the WT) is excited by a plane periodic wave of amplitude H/2, frequency ω and wave number k, propagating in water of finite water depth d (i.e., 180 m). Small amplitude, inviscid, incompressible and irrotational flow are assumed, so that linear potential theory can be employed. A global Cartesian co-ordinate system O-XYZ with origin on the seabed and its vertical axis OZ directed positive upwards, coinciding with the vertical axis of the central cylindrical body, is used. Moreover, four local cylindrical co-ordinate systems (rq, θq, zq), q = 1, 2, 3, 4 are defined with origins on the sea bottom and their vertical axes pointing upwards and coinciding with the vertical axis of symmetry of the q body. The fluid flow around each body of the arrangement, written as:   Φ q ( r , θ , z ; t ) = Re [ φ q ( r , θ , z ) e i ω t ] can be expressed as:
φ q = φ 0 q + φ 7 q + p = 1 4 j = 1 6 x ˙ j 0 p φ j q p + p = 1 3 p i n 0 p φ p q p
In Equation (11) φ 0 q stands for the velocity potential of the undisturbed incident harmonic wave, whereas   φ 7 q is the scattered potential around the q body, when it is considered fixed in the wave train, with a zero inner air pressure head (i.e., for the OWCs). The φ j q p term denotes the motion dependent radiation potential around the q body, resulting from the forced oscillation of the p body in the j direction with unit velocity amplitude, x ˙ j 0 p . Here, the air pressure inside the OWCs is assumed equal to zero (i.e., atmospheric air pressure). The φ p q p term denotes the pressure dependent radiation potential around the q body, with a zero inner air pressure head, due to unit time harmonic oscillating pressure head p i n 0 p in the p device, p = 1,2,3. Here, the q and p bodies are considered fixed in the wave impact.
The velocity potentials φ j q (j = 0, 7; q = 1, 2, 3, 4), φ j q p (j = 1, …, 6; q, p = 1, 2, 3, 4) and φ p q p (q = 1, 2, 3, 4; p = 1, 2, 3) satisfy the Laplace equation in the fluid domain, whereas, additionally, they are subjected to the corresponding linearized boundary conditions at the outer and inner free surface, the seabed, the mean body’s wetted surface [46]. Furthermore, a radiation condition must be imposed stating the outgoing propagating disturbances. In order to evaluate the   φ j q , φ j q p , φ p q p potentials, the method of matched axisymmetric eigenfunction expansions is applied. Hence the flow field around each body of the hybrid platform can be subdivided in coaxial ring-shaped fluid regions in which different velocity potential expansions are made. The latter are then matched by continuity requirements of the velocity potentials and their radial derivatives along the vertical boundaries shared by adjacent fluid regions. The diffraction φ D q = φ 0 q + φ 7 q , the motion-radiation φ j q p and the pressure-radiation φ p q p , potentials in each fluid domain of the q body, q = 1, 2, 3, 4, expressed in its co-ordinate system can be written as:
φ D q ( r q , θ q , z ) = i ω H 2 m = i m Ψ m , D q ( r q , z ) e i m θ q
φ j q p ( r q , θ q , z ) = i ω m = Ψ m , j q p ( r q , z ) e i m θ q
φ P q p ( r q , θ q , z ) = 1 i ω ρ m = Ψ m , P q p ( r q , z ) e i m θ q
Here, the functions Ψ m , D q , Ψ m , j q p ,   j = 1 , 2 , , 6 , P are the principal unknowns of the problem.
In order to evaluate the velocity potentials as expressed in Equations (12)–(14) the multiple scattering approach is implemented. The method accounts for the hydrodynamic interaction phenomena among the bodies of the hybrid structure by superposing to the isolated body potential flow solution various orders of scattered/radiated wave fields emanating from the rest of the bodies. The implementation of the multiple scattering formulation for the solution of the diffraction, the motion- and the pressure-radiation problems around arbitrary shaped floating vertical axisymmetric bodies has been extensively reported in the literature [44,47,48,49]. Hence, it is not further elaborated here.
Having determined the velocity potentials in each fluid region, the hydrodynamic forces on the hull of the REFOS floater (exciting forces at the i-th direction, f i T ,   i = 1 , , 6 ; hydrodynamic added mass and damping coefficients, A i , j , B i , j ; pressure hydrodynamic forces at the i-th direction, f P , i T ,   i = 1 , , 6 ) can be calculated [50,51].

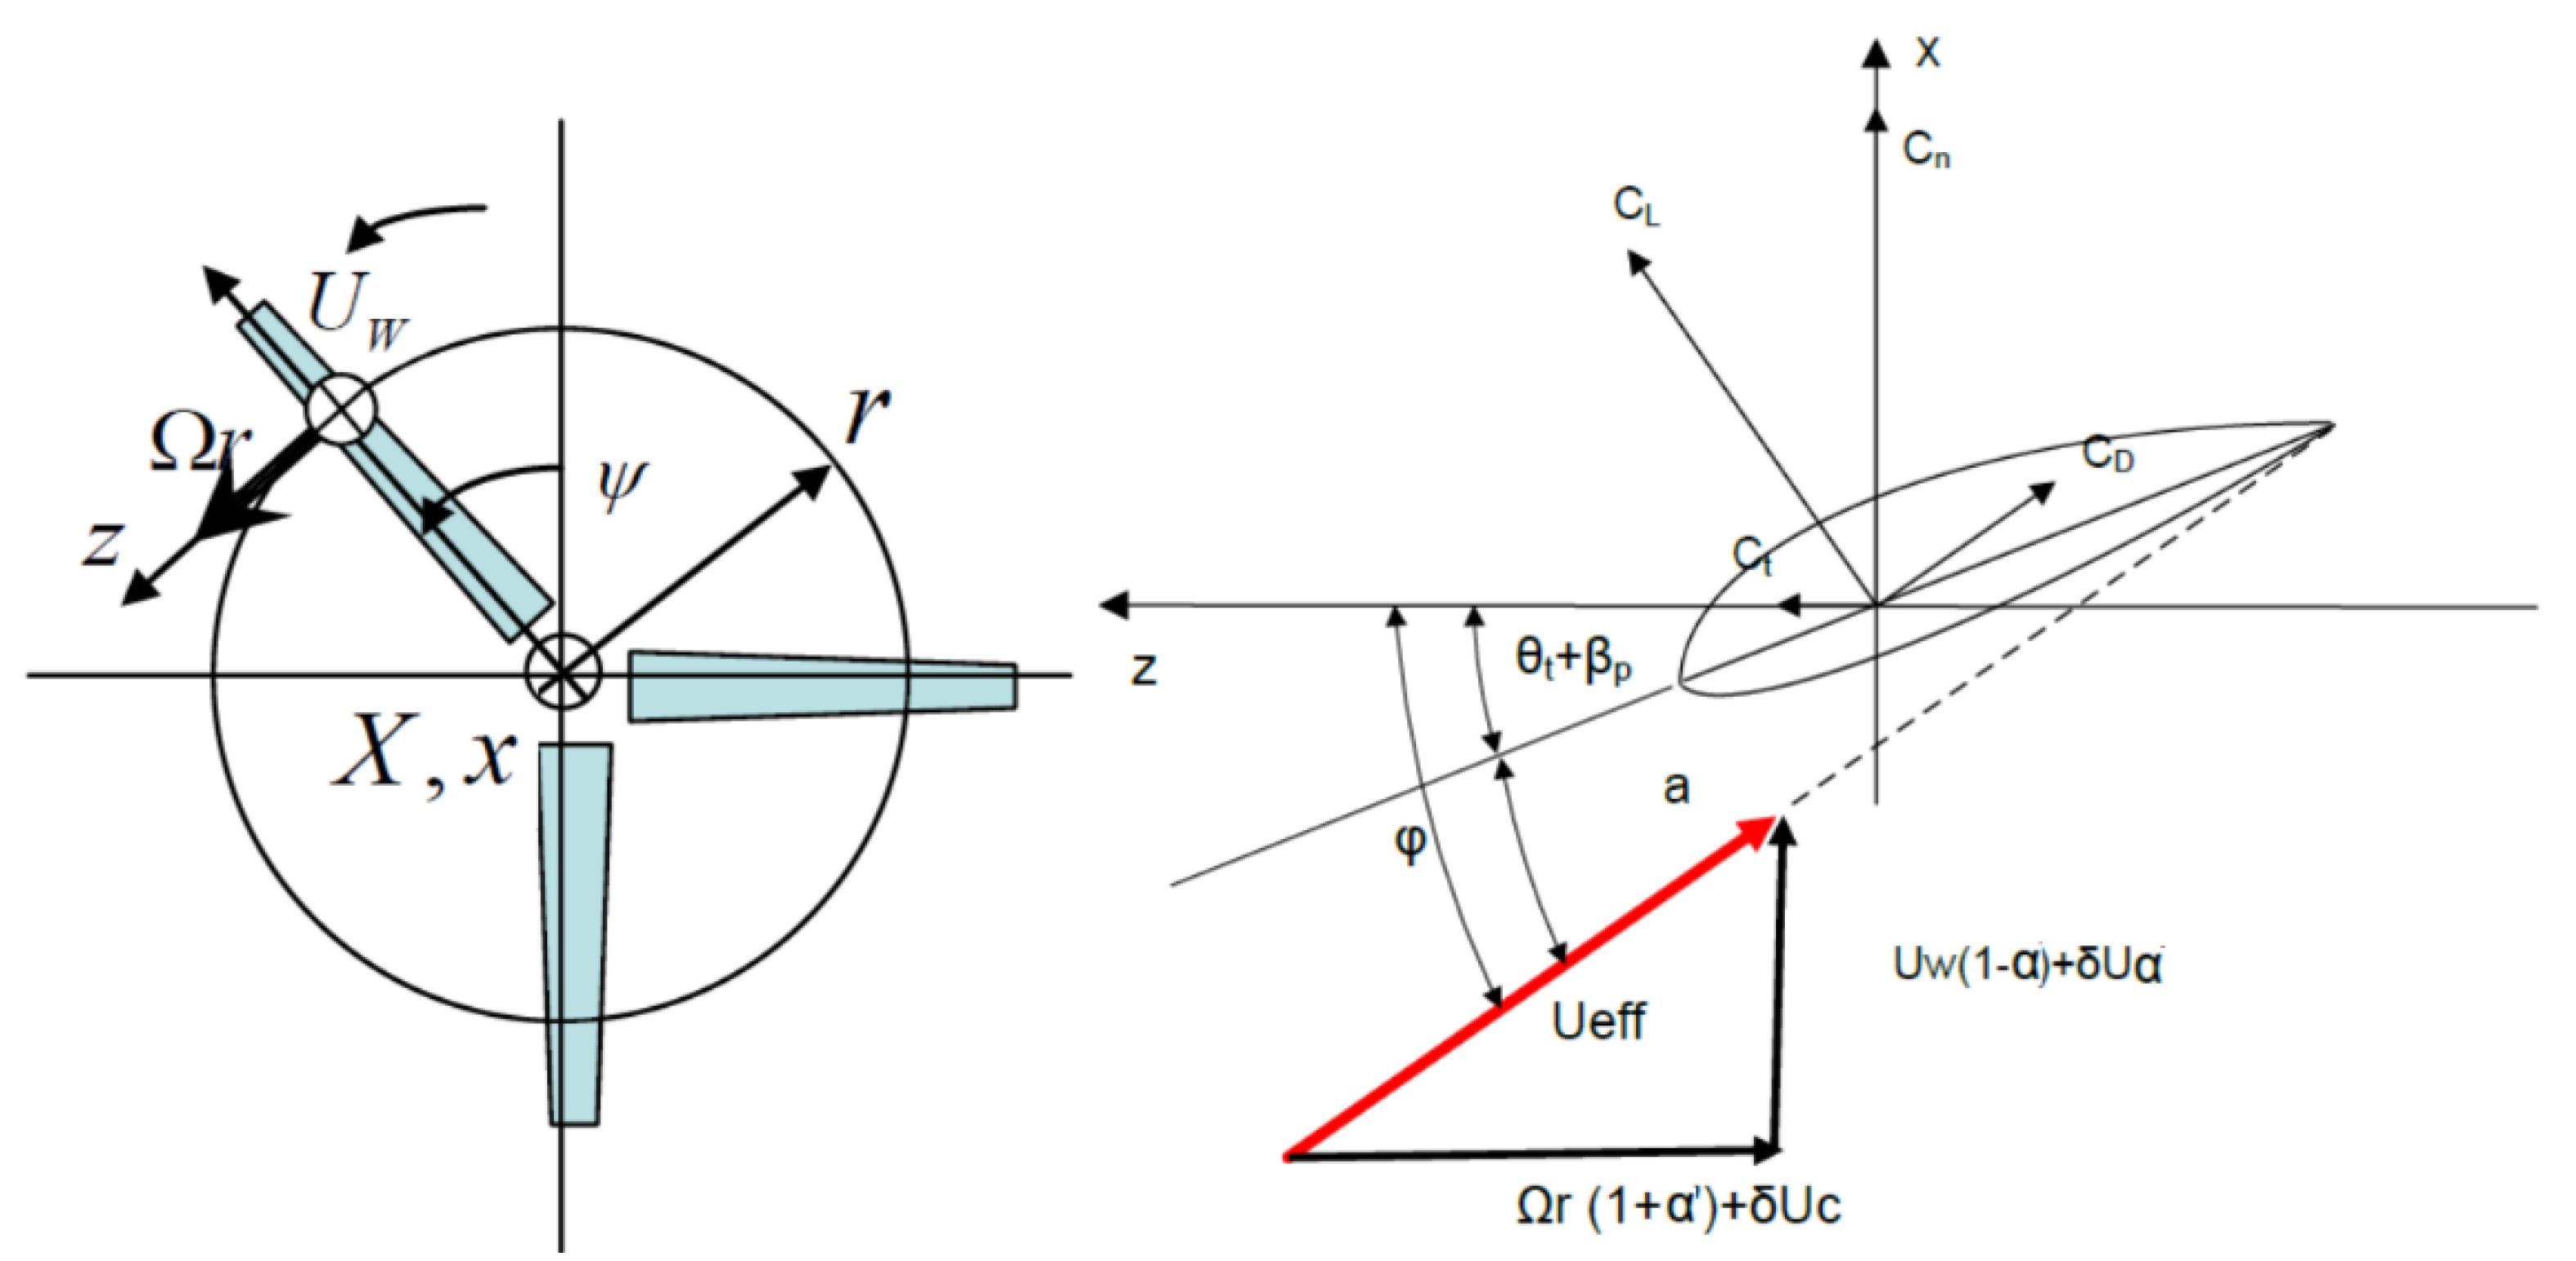
4.2. Formulation of the Aero-Elasto-Dynamic Problem

The aero-elasto-dynamic problem is formulated in the context of Hamiltonian dynamics. The Lagrange equations describe the behavior of mechanical systems in terms of generalized degrees of freedom (dofs) and loads. Specifically, appropriate generalized coordinates of degrees of freedom qj are selected that define the position r of any material point. Hence, following the formalism of analytic mechanics, the system equations take the form,
d d t ( L q ˙ j ) ( L q j ) = Q j = i = 1 6 ( f i r i ) q j
In Equation (15) the Lagrangian L = T – U, where T is the kinetic energy and U the potential or internal energy. Term Q j stands for the generalized loads corresponding to the external loads f i (assumed as concentrated forces and moments). The external loads include: (a) the aerodynamic loading on the rotor; (b) the gravitational loading; and (c) the hydrostatic/hydrodynamic loading on the floater.
In the followed analysis, dofs are introduced for all the components of the REFOS structure. Specifically, the considered dofs are: two rotation dofs per blade at the root corresponding to the two bending directions; two dofs at the drive train for the torsion deformation and for the rigid body rotation respectively; three dofs at the tower base corresponding to the two bending directions and the torsion in yaw; and six dofs for the floater’s rigid body motions.
Furthermore, the examined system (i.e., the floater, the mooring lines, the blades, the drive train and the tower) is considered as a collection of concentrated masses. Each component is considered at most as a 1-D structure either modelled as rigid or as flexible beam undergoing bending, tension and torsion. Mass as well as stiffness properties can be locally integrated and concentrated properties (i.e., concentrated masses, inertias, and linear or rotation springs) are defined, which are important for simplified modelling. Their definition should ensure accurate prediction of the first natural frequencies of the system.
The aerodynamic loading is defined within the context of Blade Element Momentum theory [52,53]. Hence, two nonlinear equations are applied for the induction factors a and a that specify the effective angle of attack a and the effective relative velocity U e f f (see Figure 5), i.e.,:
N ( C L ( a ) c o s φ + C D ( a ) s i n φ ) c = 8 π U W 2 U e f f 2 a ( 1 a ) r
N ( C L ( a ) s i n φ C D ( a ) c o s φ ) c = 8 π U W Ω r U e f f 2 a ( 1 a ) r
Here, N denotes the number of the blades (i.e., 3 for the considered 10 MW WT); C L ,   C D are the lift and drag coefficients provided in tabulated form as a function of the effective angle of attack; U W is the magnitude of the undisturbed wind velocity; φ is the angle between the effective velocity and the rotor plane, r is the radial position of each blade element, c is the local chord length and Ω the rotational speed.
For the effective relative velocity U e f f and the angle φ, it holds that:
U e f f = ( U w ( 1 a ) ) 2 + ( Ω r ( 1 + a ) ) 2
t a n φ = U W ( 1 a ) + δ u a Ω r ( 1 + a ) + δ u c
In Equation (19) the terms δ u a , δ u c correspond to additional velocity contribution due to deformation and rigid body motions (i.e., floater’s motions) in the axial and circumferential direction, respectively.
The angle of attack a, needed to define the coefficients C L ,   C D equals:
a = φ ( θ t β p )
where θ t ,   β p denote the local twist and blade pitch angle, respectively.
Once the solution of Equations (16) and (17) converges, the lift and drag forces, F L ,   F D along the blade span are determined by:
F i ( r , a ) = 1 2 ρ a i r C i ( r , a ) U e f f 2 c d r ,   i = L , D
Here, ρ a i r denotes the air density and d r the length of the annulus tube per blade element strip.
Equations (16) and (17) that determine the induction factors a and a , are nonlinear and should be solved with the rest of the dynamic equations, namely the structural equations of the complete system and the equations of motions for the floater. Hence, linearization of the problem is introduced by considering a reference state with respect to which all additional perturbations are considered small and eliminating part of the problem by assuming all relevant dofs fixed (i.e., the elastic dofs of the WT).
A static solution can be formed by defining the position of the floater from the mass distribution of the system, the thrust and moment at the rotor hub, the buoyancy and the stiffness that are associated to the 6 dofs of the floater. In the latter, all components are assumed rigid, the wind uniform and steady, the yaw misalignment and the inclination are zero and the rotational speed and blade pitch are fixed.
Choosing as reference state the static positioning of the system at the specific wind speed without wave loading, linearization consists of assuming:
Q = Q 0 + q Q 0 q f l + q ˙ Q 0 q ˙ f l + q ¨ Q 0 q ¨ f l
The derivatives i Q 0 ,   i = q , q ˙ , q ¨ define in fact the additional stiffness, damping and mass matrices in the floater equations. It should be also noted that i Q 0 depends on the static position of the floater as well as the reference operation conditions of the rotor (i.e., the wind speed, the rotational speed, and the blade pitch).
Let a0(r) denote the effective angle of attack of the reference state at a specific radial position r. The corresponding lift and drag coefficients C L 0 ( r ) ,   C D 0 ( r ) for this angle are obtained from the tabulated polar input. Linearization of lift and drag coefficients gives:
C i ( r , a ) = C i 0 ( r ) + C i 0 δ a , i = L , D
where δ a = a a 0 corresponds to a small perturbation of the angle of attack due to the floater’s motion, so that:   δ a = δ a ( q f l , q ˙ f l ) . Hence, from linearization of δ a it holds that:
δ a ( q f l , q ˙ f l ) = δ a q ¯ · q f l + δ a d q ¯ · q ˙ f l
Similarly,
δ u i ( q f l , q ˙ f l ) = δ u i , q ¯ · q f l + δ u i , d q ¯ · q ˙ f l ,     i = a , c
The overbar in the above expressions denotes that the derivatives are estimated at the reference state. By introducing the above expressions in Equation (15) and eliminating higher order terms, a linearized expression of the aerodynamic loading with respect to the floater dofs derives.
Finally, by integrating along the blade span and applying Coleman’s transformation [54] the loads are expressed in the coordinate system of the floater. The resulting dynamic equations are provided for the six dofs of the floater x j 0 , i.e.,
j = 1 6 [ ω 2 ( M i , j W T + i ω B i , j W T ) + C i , j W T ] x j 0 = Q
The right hand side contains gravity, buoyancy and aerodynamics that correspond to the reference state, while the mass matrix M i , j W T includes the WT inertia (including the gyroscopic effects due to the rotation), the damping matrix B i , j W T includes the WT damping due to rotation and aerodynamics and finally the stiffness matrix C i , j W T includes the contribution from both aerodynamics and gravity.

4.3. Coupled Hydro-Aero-Elastic Formulation

The investigation of the dynamic equilibrium of the forces acting on the REFOS structure leads to the following system of differential equations of motion, describing the couple hydro-aero-elastic problem in the frequency domain:
j = 1 6 [ ω 2 ( Μ i , j + M i , j W T + A i , j + i ω Β i , j + i ω B i , j W T ) + C i , j T + C i , j W T ] x j 0 f P , i T = f i T ,   i = 1 , , 6
Here, A i , j , B i , j   are the hydrodynamic mass and potential damping coefficients of the platform; f i T and f P , i T , are the exciting- and the pressure hydrodynamic- forces acting on the platform; x j 0 is the motion component of the REFOS system in the j-th direction with respect to a global co-ordinate system; Μ i , j is the platform’s mass matrix; whereas C i , j T is the total restoring stiffness matrix, which for a TLP type mooring arrangement consists of three parts [47,55], namely, the conventional mooring line stiffness; the platform hydrostatic restoring stiffness and the tendon geometric stiffness, i.e.,
C 1 , 1 T = C 2 , 2 T = n = 1 3 T n L ,   C 3 , 3 T = ρ g A W L + E A L ,   C 4 , 4 T = ρ g I W L X + U z B Q z G n = 1 3 T n z n + E I x x L C 5 , 5 T = ρ g I W L Y + U z B Q z G n = 1 3 T n z n + E I y y L C 6 , 6 T = n = 1 3 T n L ( x n 2 + y n 2 ) ,     C 1 , 5 T = C 5 , 1 T = C 2 , 4 T = C 4 , 2 T = C 1 , 1 T z n
In Equation (28) A W L , I W L X , I W L Y , are the platform’s water plane area and its moments of inertia about x and y axis, respectively; U and Q are the buoyancy and weight of the platform, respectively; z B , z G are the vertical coordinates of buoyancy and gravity center, respectively, which for the REFOS design are equal to z B = 8.651   m ;   z G = 3.180   m , respectively; ρ is the water density and g the gravitational acceleration constant. The T n are the tendon pretension forces and x n , y n , z n are the horizontal and vertical coordinates of the attaching point of the tendon with respect to the platform’s global reference point of motion and L is the tendon’s length. The   z B , z G have negative values denoting those that are placed below the free surface. The mass moments of inertia are depicted in Table 2.
The elements of the (6 × 6) square stiffness matrix C i , j T , are depicted in Table 6.
The hydrodynamic analysis of the bodies in the REFOS structure is conducted in the frequency domain, applying the HAMVAB software [56] based on the above analytical computation procedure. The software does not require a large RAM or computation time. Specifically, the central processing unit (CPU) time for each wave frequency related to the overall problem solution (diffraction, motion- and pressure-radiation) is about 56 s (i.e., for 7 interactions between the bodies of the structure and azimuthal modes m = ±7), hence representing an efficient alternative tool in the early design phases of such floating structures.

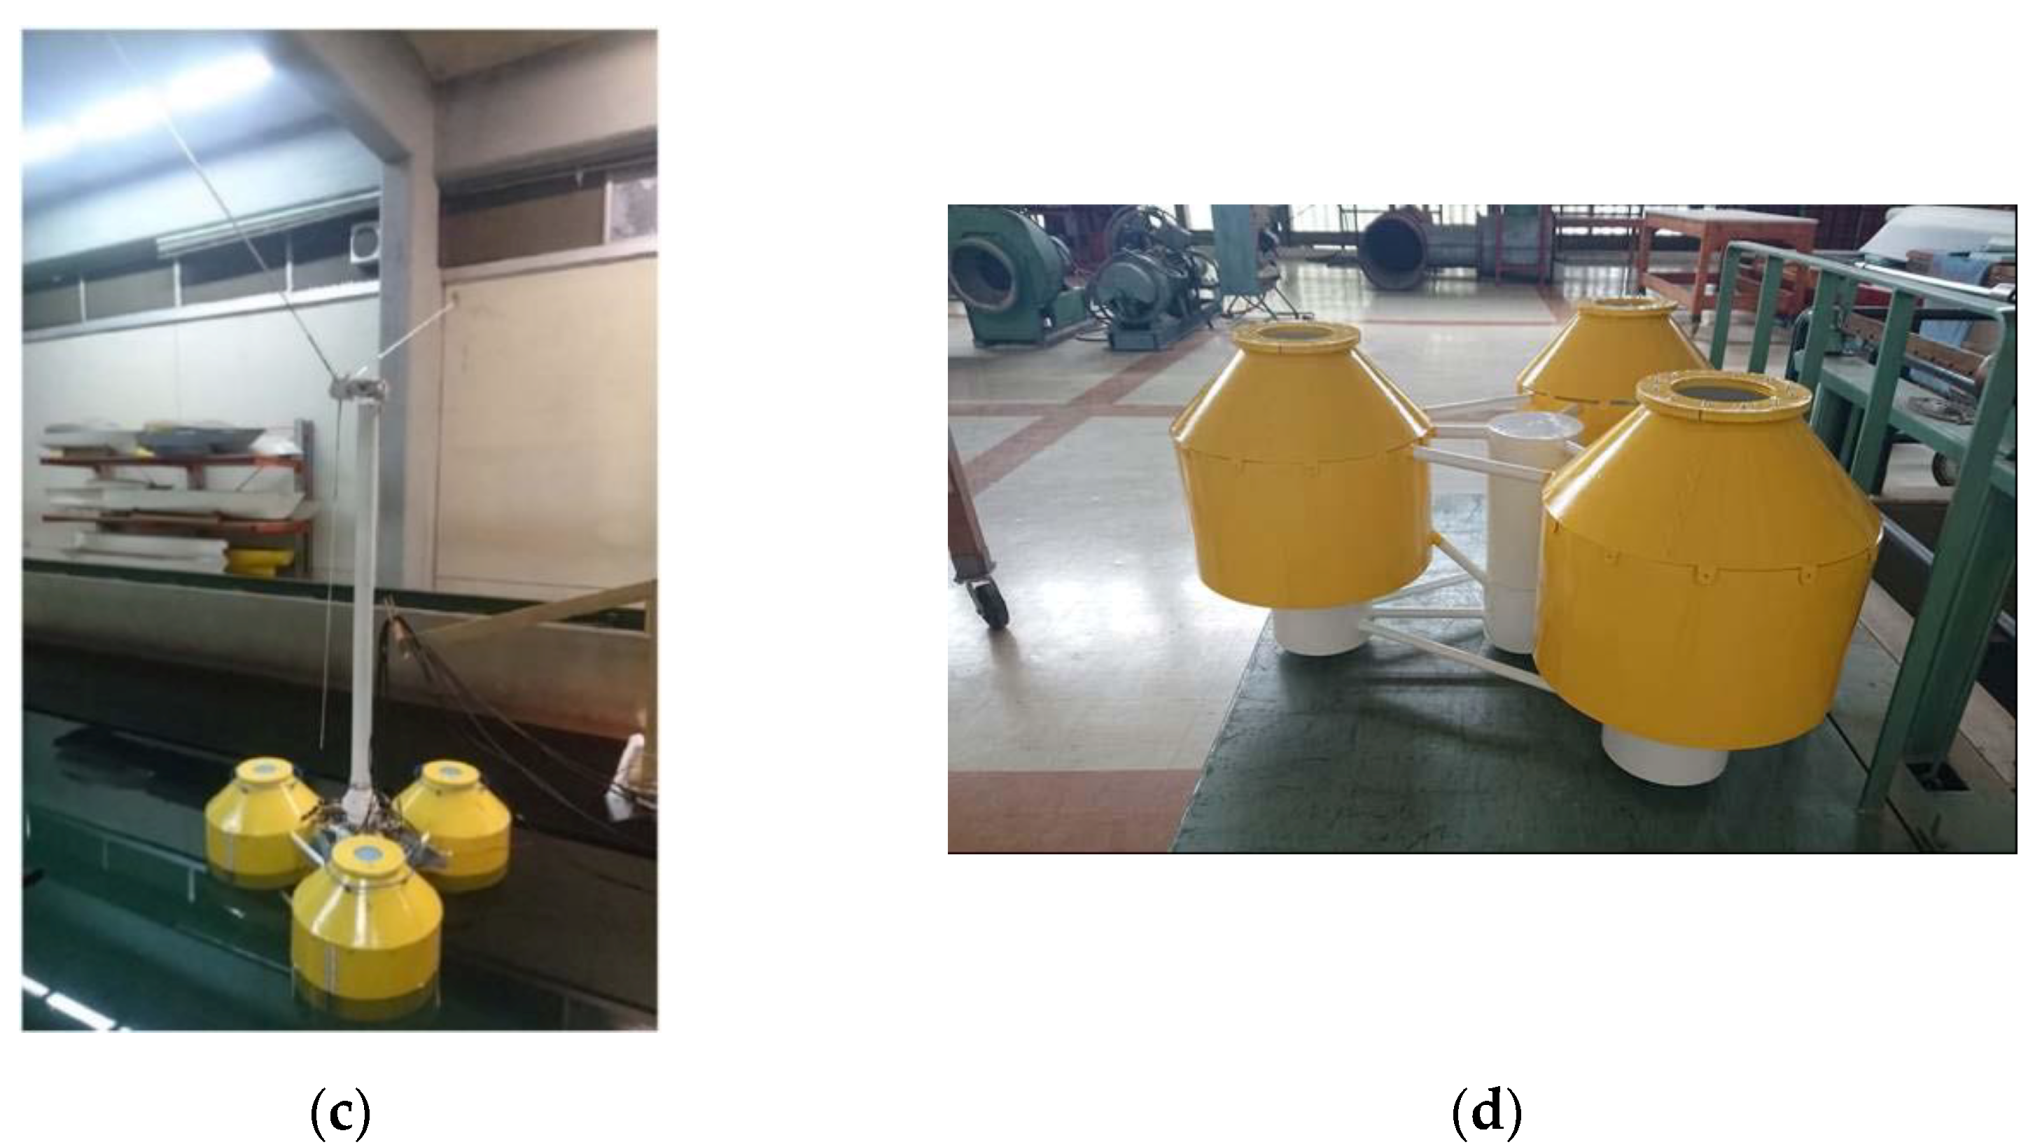
5. Wave Tank Experimental Analysis
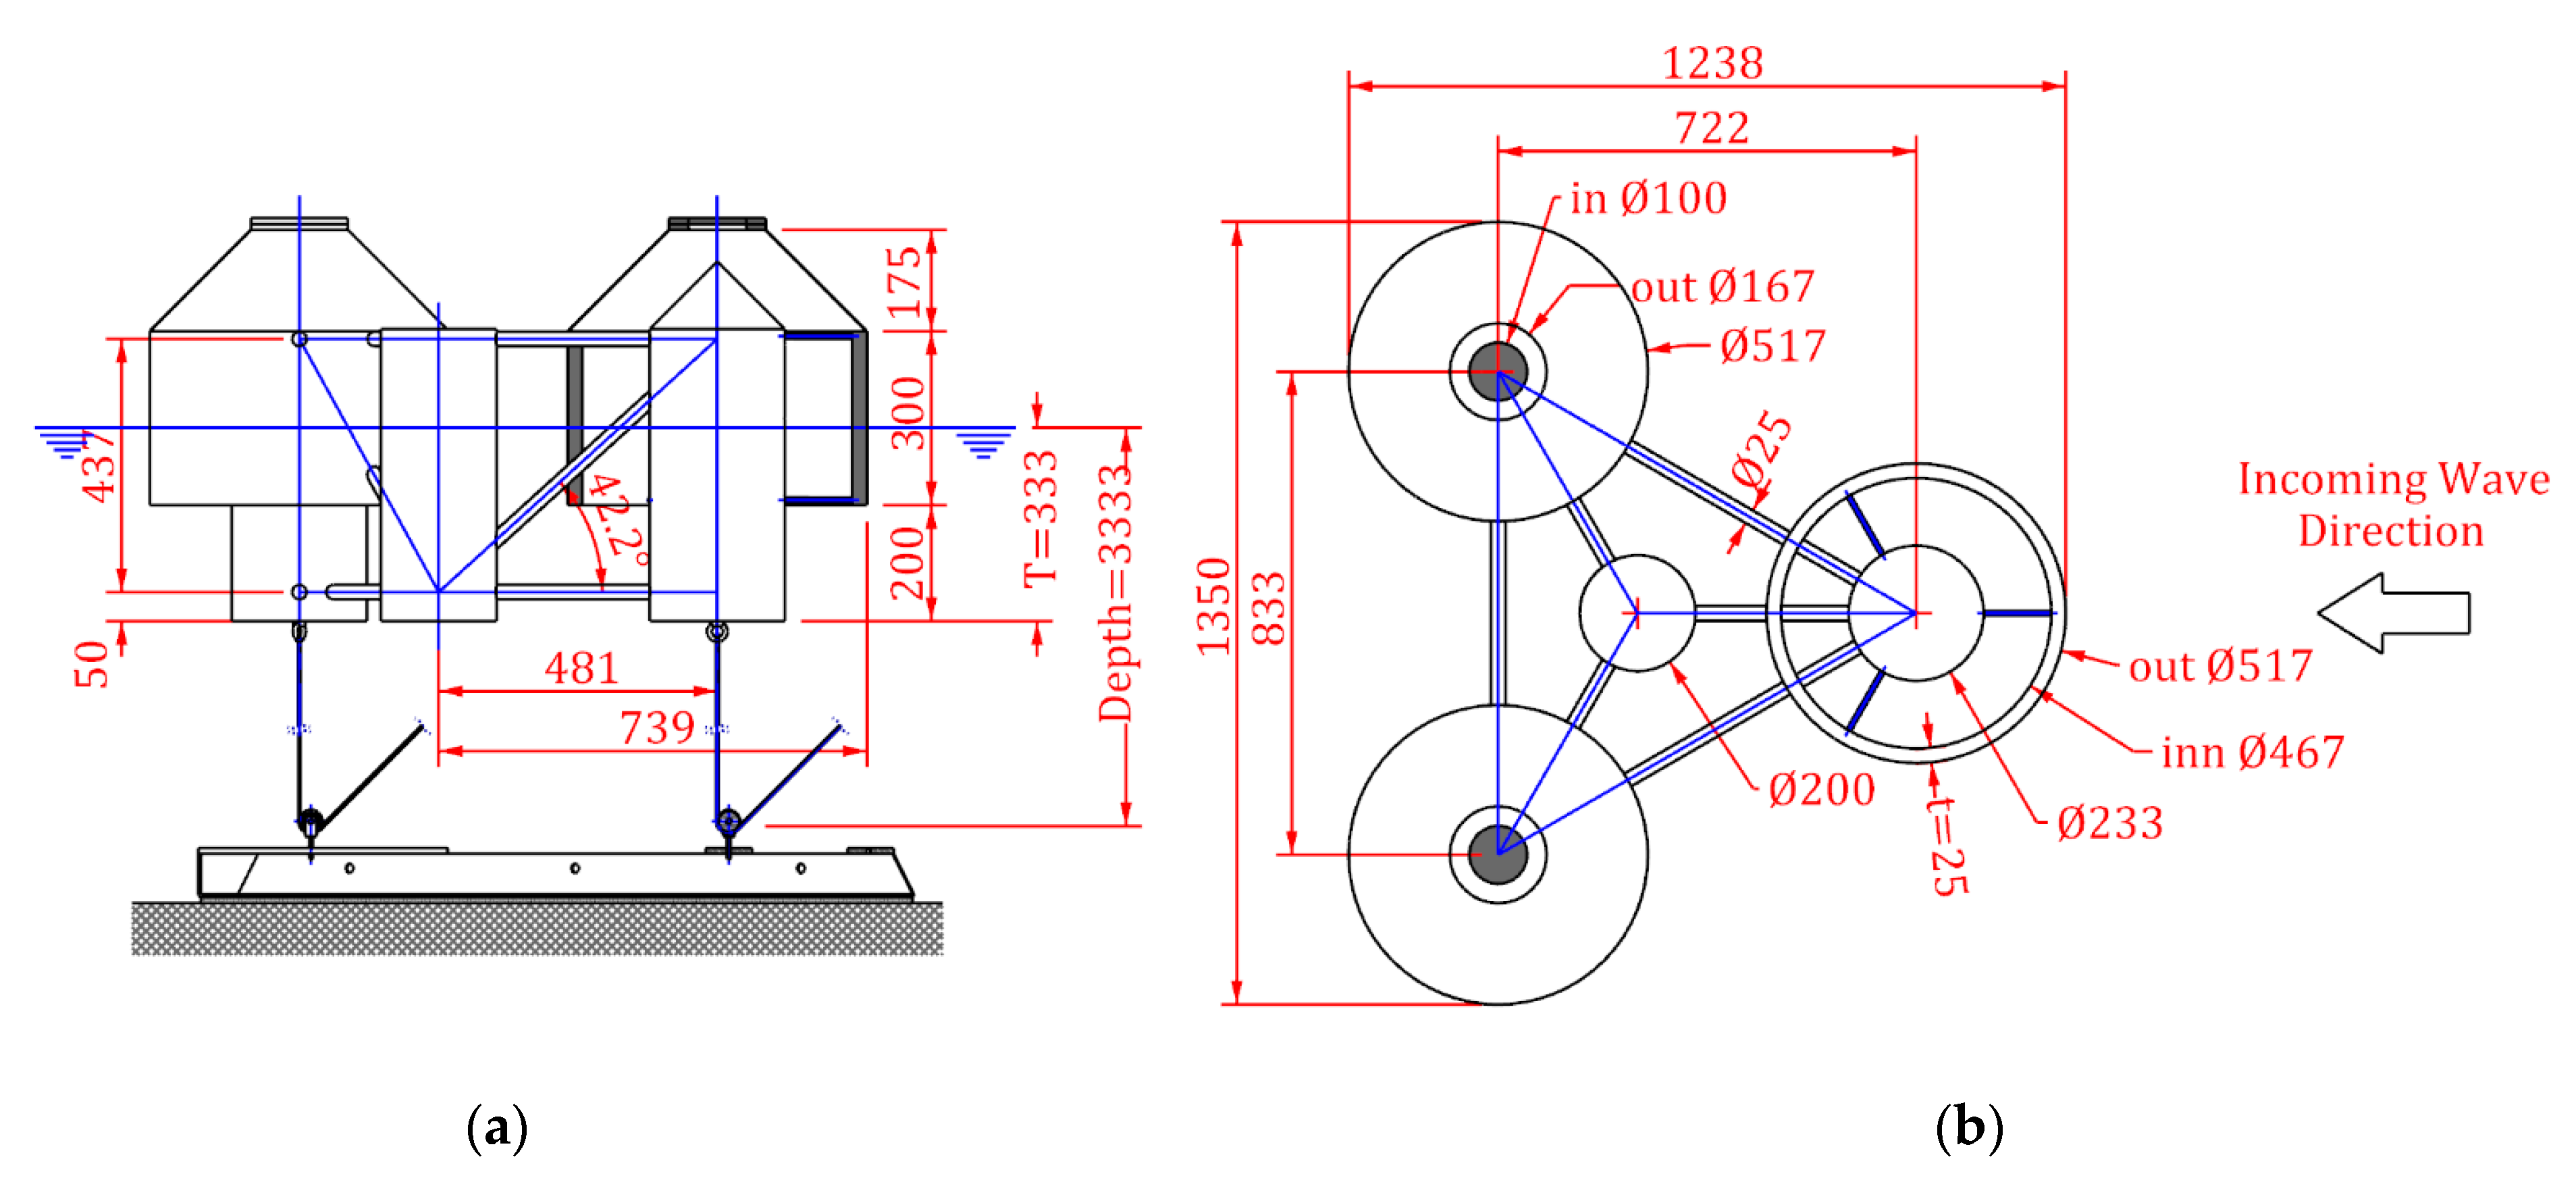
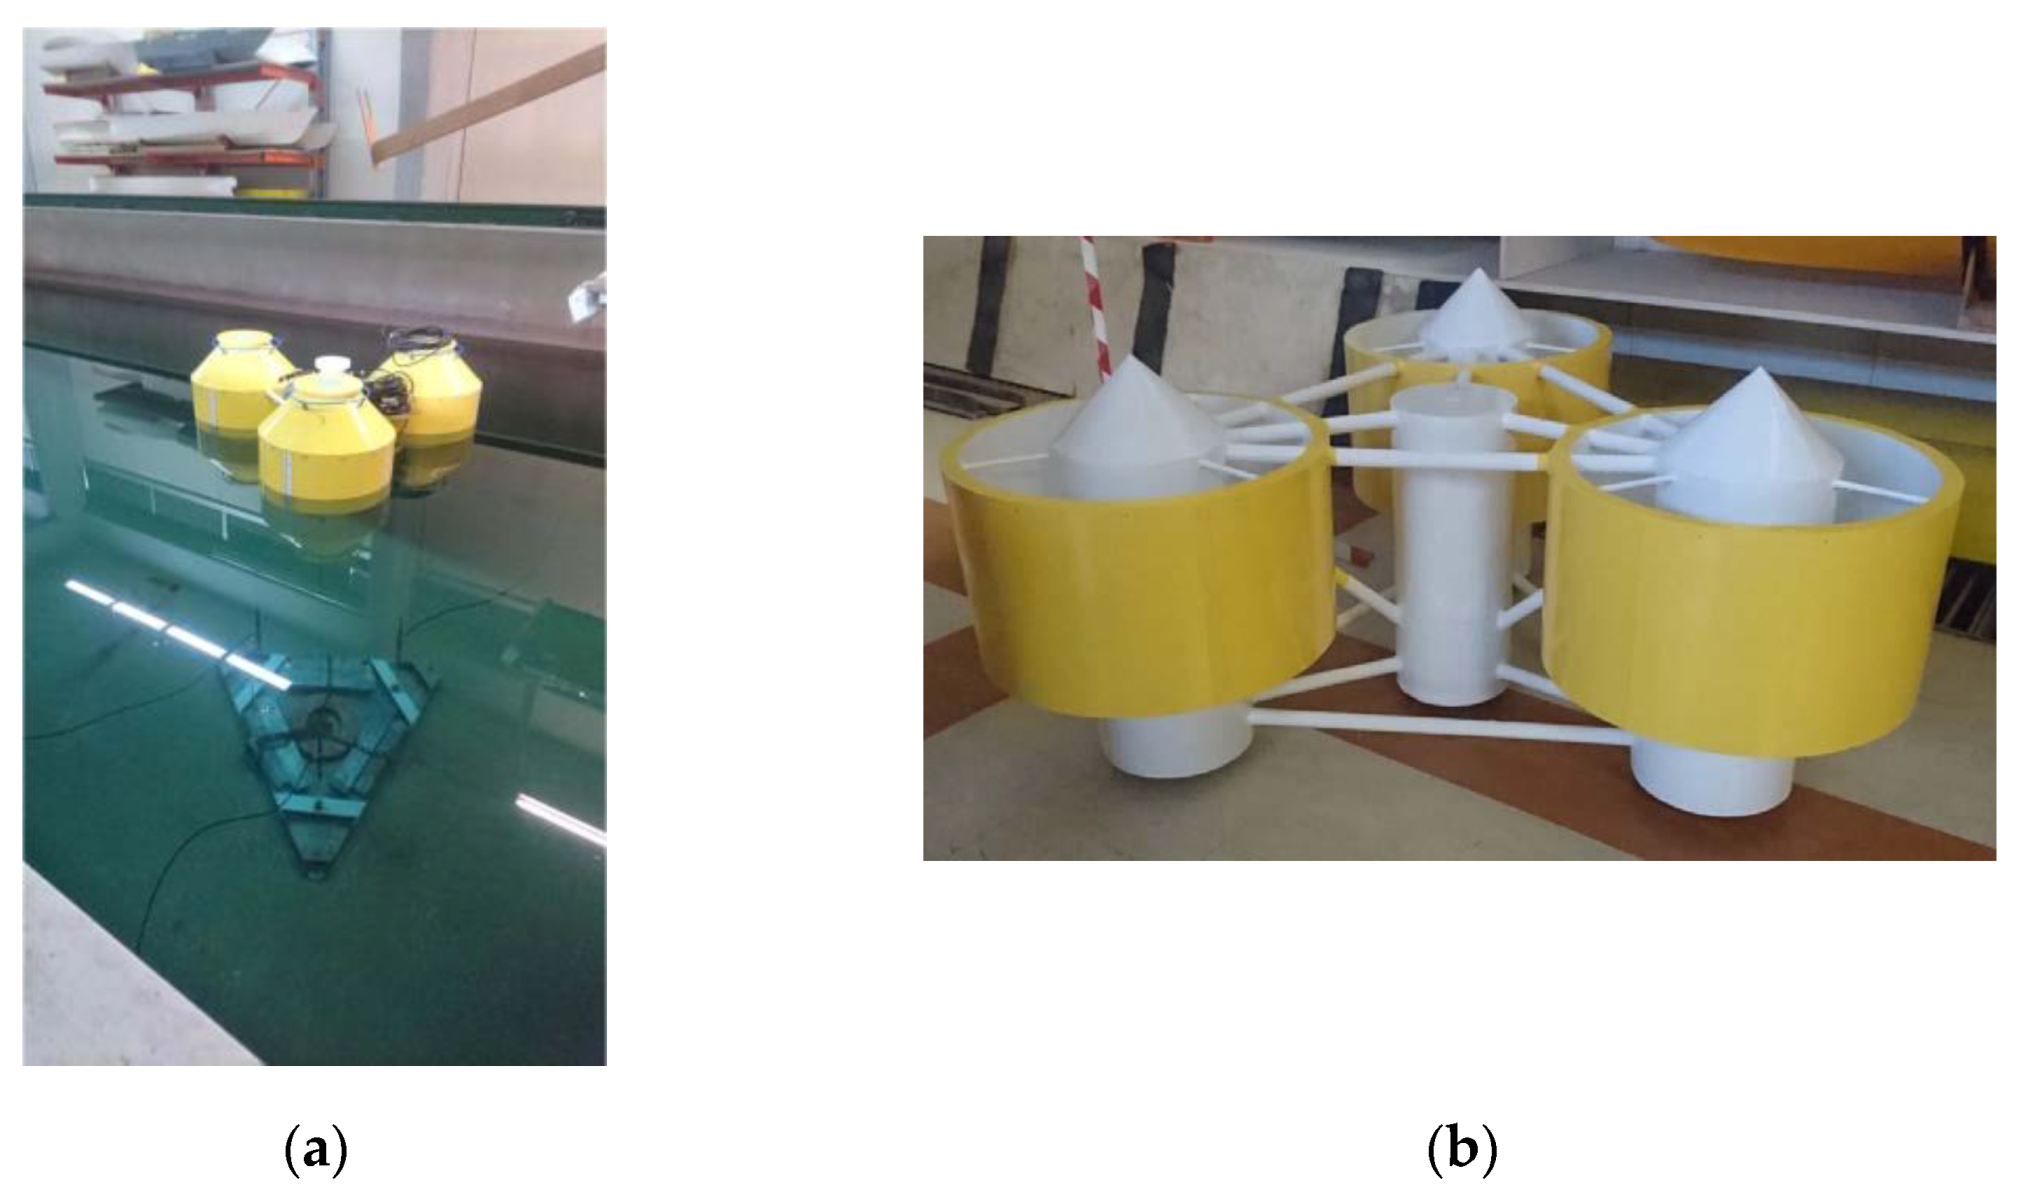
5.1. Model Scale

For the simulation of the seakeeping performance of the platform, a 1:60 scaled down model of the real structure has been constructed according to the Froude scaling law (see Figure 6). The model is composed of: (a) three vertical cylinders at the corners of the triangular platform, forming the main buoyancy hull; (b) a cylinder at the center of the triangle supporting the WT; (c) horizontal and diagonal bracing elements; (d) the cylindrical OWC chamber walls; (e) the OWC air chamber conic domes; (f) the WT tower and the tower base; (g) the WT nacelle assembly; (h) the WT rotor; (i) TLP tendons and (g) a bottom base for the tension leg connections see Figure 7.
Froude similitude law, requires preservation the following parameter (i.e., Froude number F n ):
F n = U F g L F = U M g L M
where subscript F denotes the full scale and subscript M the model scale. The term U denotes the characteristic velocity (i.e., velocity of the platform motion or of the sea surface elevation in seakeeping) and L being a characteristic length and g the gravitational acceleration.
Froude law dynamic similarity (i.e., geometric similarity and similarity of forces) satisfies also the correct simulation of the ratio between the inertial and gravitational forces, since:
Inertial   forces Gravitational   forces = F i F g ρ U 2 L 2 ρ g L 3 = U 2 g L = F n 2
Hence, equality in F n between model and full scale ensures the correct modeling of the gravitational forces and, consequently, of the surface wave forces, which are gravity driven. Moreover, the inertial components of the loads are also correctly scaled, including the inertial loads of the WT. To this end, and especially for the modeling of the gyroscopic loads due to the rotational inertia of the WT rotor, it should be noted that the angular velocity of the rotor combined with the yaw velocity will produce a pitch moment (and similar when combined with pitch):
M g y r = I R ω Ω
In Equation (31) the   I R term denotes the moment of inertia of the rotor, ω is the angular velocity of the rotor and Ω is the angular velocity of yaw.
The relation between the induced moments at the model scale and full scale is:
M M g y r = M F g y r 1 λ 4
Here, λ is the scale factor. Applying Equation (32) at the model scale and considering the Froude scaling of the rotational inertia and the angular velocities, it results in:
M M g y r = I M R ω M Ω M = I F R λ 5 ω M Ω F λ = M F g y r ω M ω F   λ λ 5
Fulfillment of both, Equation (32) requires that the rotor angular velocity at the model scale should be:
ω M = ω F λ
For the considered 10 MW WT (9.6 rpm max rotor speed, scale factor 1:60), it holds that ω M = 74.4   rpm .
It should be noted that full aerodynamic simulation of the WT operation is not carried out, since this requires equality of the pertinent Reynolds numbers (Re) of the air flow. However, maintaining equality of both Re and F n numbers at the same time was not possible. Thus, for the simulation of the aerodynamic thrust, only the steady value was accounted for, by applying a pulling force, through a horizontal string attached to the nacelle height at the one end, while at the other end a weight equal to the nominal air turbine thrust load was suspended, using a suitable pulley.
Concerning the experimental simulation of the OWCs air turbines, perforated carpets have been used to create a filter plug at the top of the chambers. The filter plug diameter, the thickness and the porosity of the carpet were calibrated to achieve the linear pressure-air flux response of a Wells-type air turbine. For this reason, the perforated carpets were selected instead of simple orifices, which are known to have a quadratic response. Based on the full-scale air turbine particulars (see Section 2) the characteristics of the scaled down perforated filter plugs were properly selected, i.e., a carpet of 100 mm was used for the North Sea location, L3, whereas 150 mm was used for the Mediterranean Sea locations L1, L2. Totally open diaphragms were used for the examination of non-operating conditions of the OWC, during extreme sea states.
The targeted constant for the linear relation between pressure drop across the blade and airflow rate, which is a main characteristic of the behavior of Wells turbines, was determined by using CFD simulations. These calculations verified also the linearity in the pre-stall flow regime between volumetric flow rate and pressure drop. Prior to the wave tank experiments, the porous diaphragms had been calibrated by using a special air chamber, equipped with a reciprocating piston for the simulation of the oscillatory air flows in the range of the examined frequencies and air flow oscillatory amplitudes. Using this device, several configurations of the diaphragms (i.e., porous material, thicknesses, and membrane diameter) were tested and their performance, in terms of pressure drop versus flow rate, was compared against the target values.
Furthermore, the performance was also compared against the target values in the wave tank experiments. Figure 8 depicts the relation between Q and dp amplitudes for the case of the North Sea in model scale. Although these measurements include experimental inaccuracies, mainly due to the volumetric flow rate measurements on the basis of the wave gage readings inside the air chamber, the linear performance of the selected porous diaphragms can be concluded for the examined air flow ranges resembling similar graphs obtained by CFD methodology in [57].
It should be clarified at this point that in the instantaneous Q-dp curves a sort of hysteresis was depicted, due to a phase lag between the two parameters. It is well known that such hysteresis (i.e., different behavior during compression and inhalation phases) is a result of pertinent thermodynamic phenomena at the full and model scales, and of the inherent turbine behavior [58,59,60]. However, neither in the full-scale numerical analysis these thermodynamic phenomena have been taken into account in defining the full-scale turbine characteristic Λ, as commended in Equation (1), nor during the scaled down experiments have been specifically investigated as they were out of the scope of the present work. For this reason, elsewhere, as far as the scaling of the chamber volume is concerned, geometric similarity is used [61], instead of schemes that are proposed to account for compressibility/thermodynamic processes similitude [58].

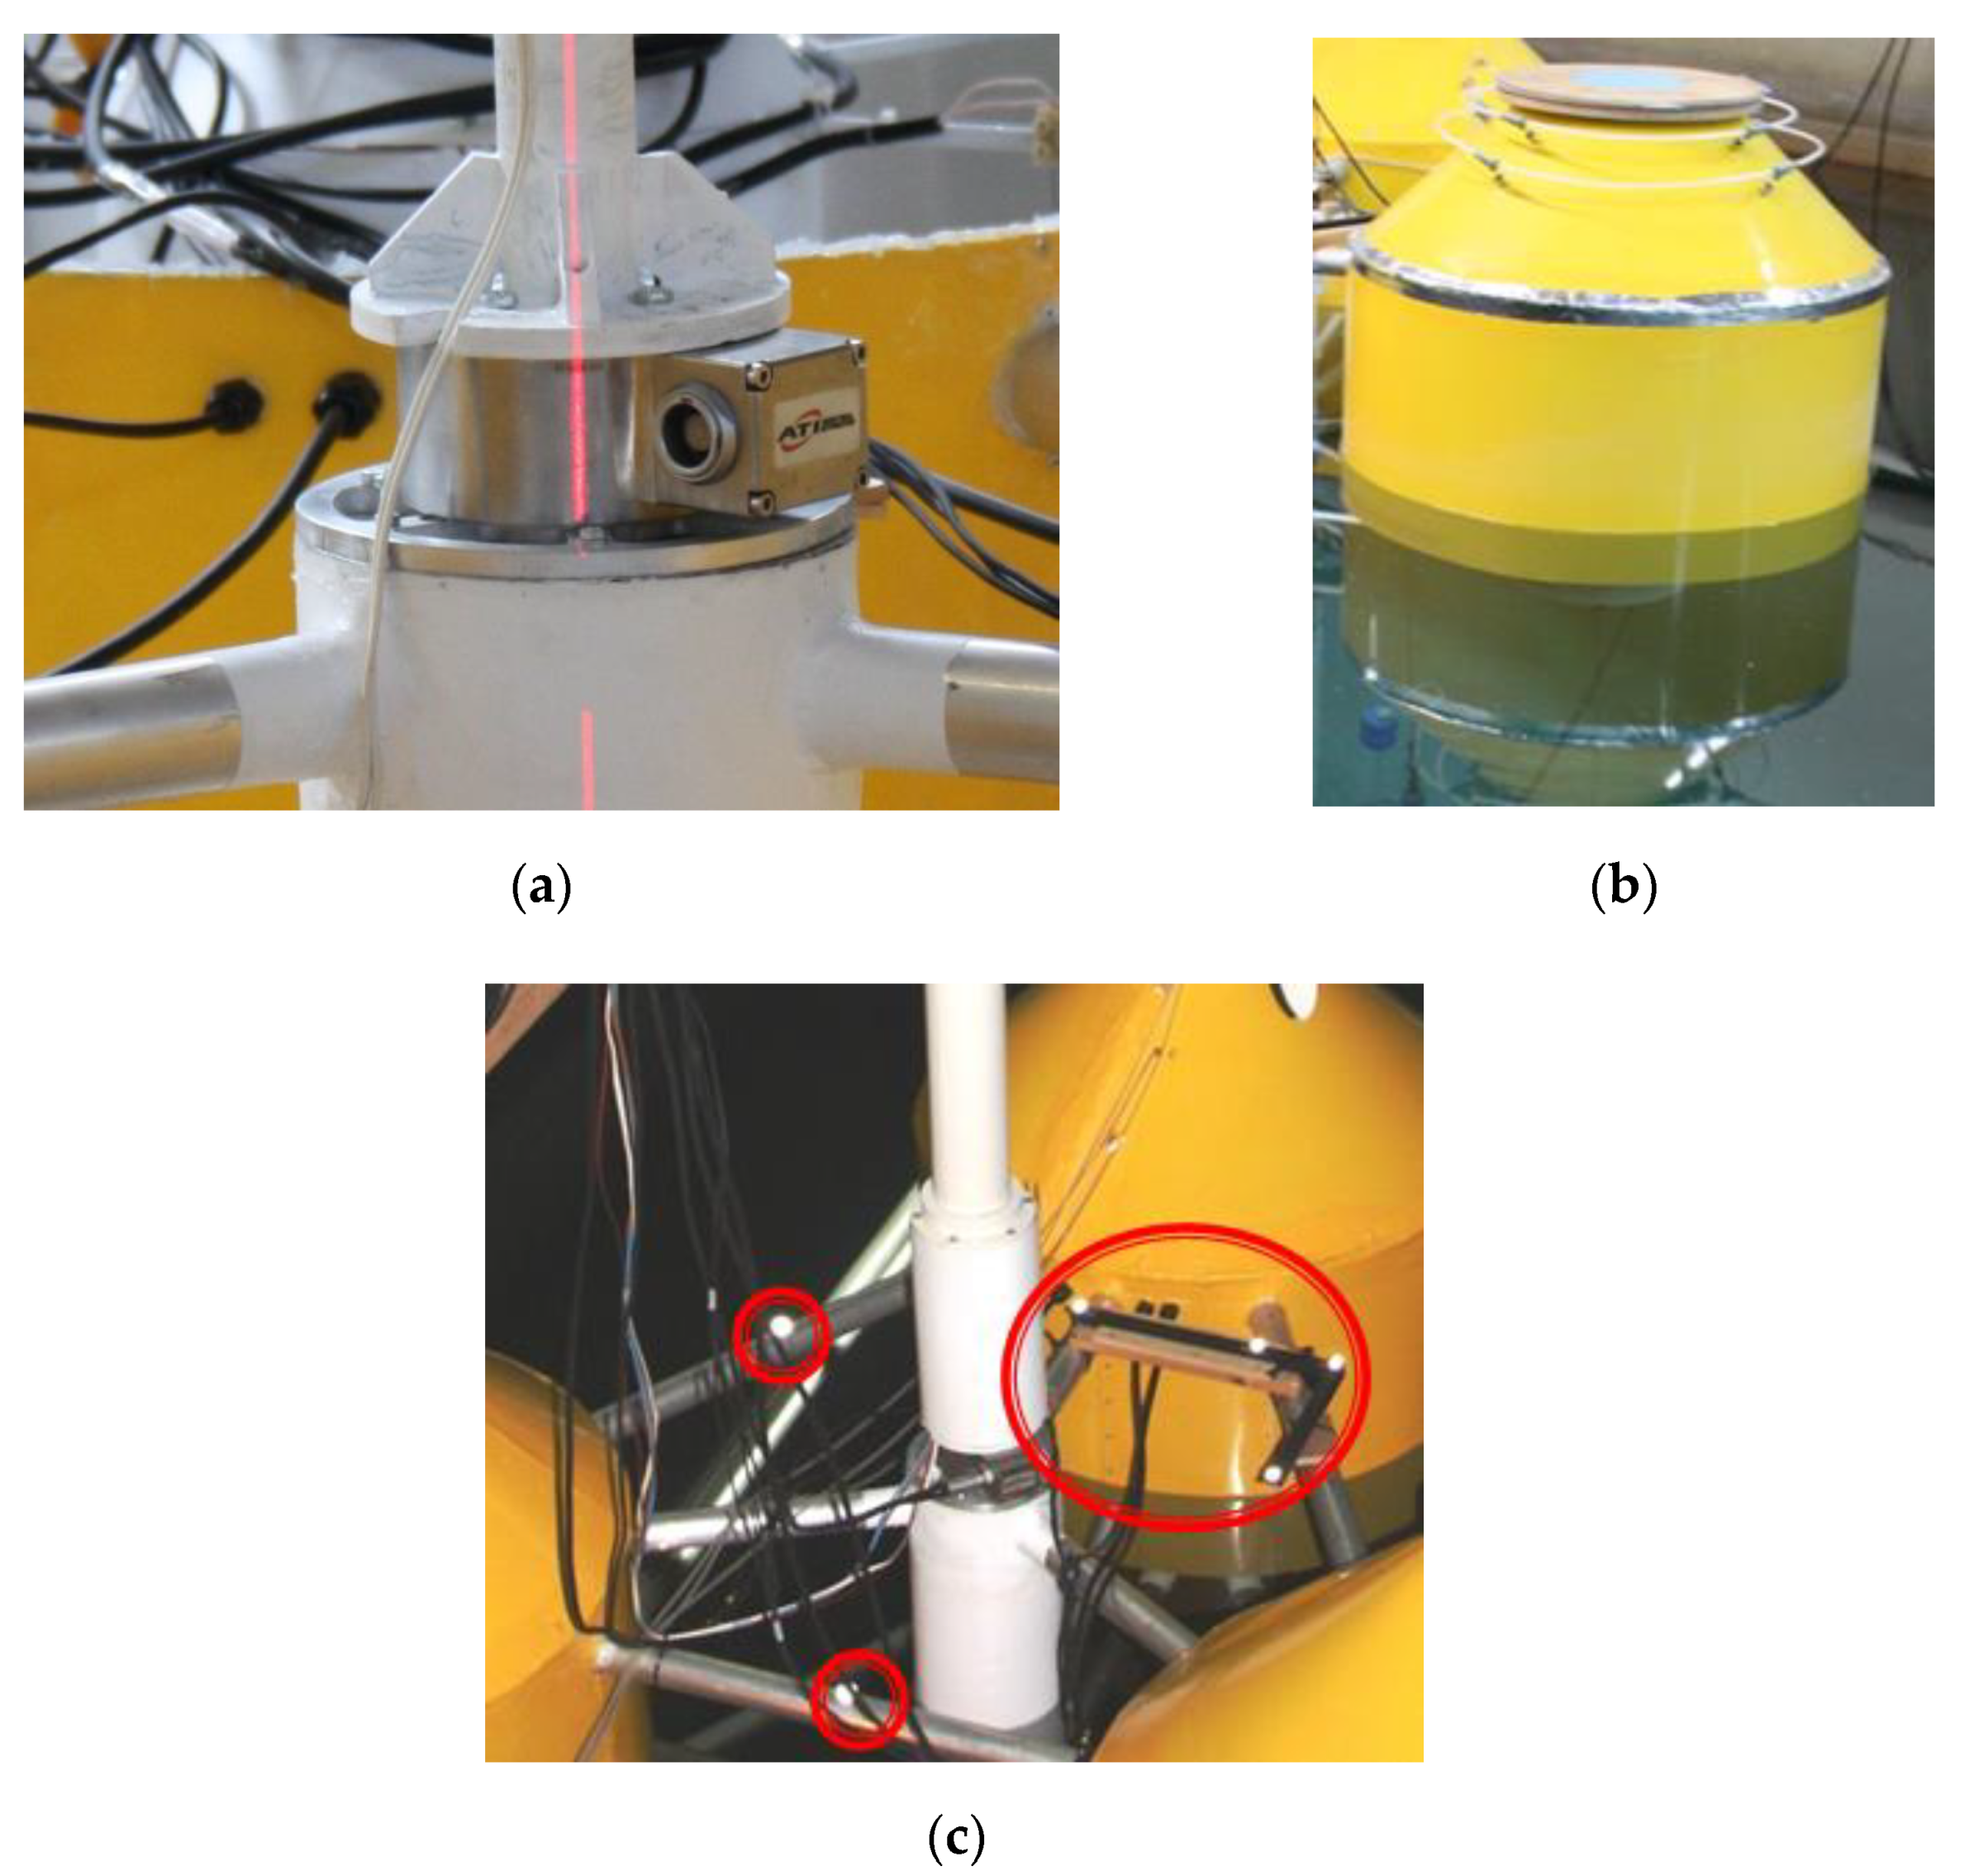
5.2. Instrumentation of the Model

An extensive set of experiments were conducted in the wave tank of the Laboratory for Ship and Marine Hydrodynamics (LSMH) of the National Technical University of Athens. A wide range of incident harmonic waves of a zero angle of impact (see Figure 6), was simulated considering the wave periods the REFOS structure is expected to encounter in the Mediterranean and the North Sea (see Section 3). The amplitudes of the waves generated by the wave maker of the tank were measured by two standard wave probes of wire type, one located near the wave maker while the other located in front of the platform. For the measurement of the wave elevation inside the OWC device, three wave probes were used, located radially in the toroidal space of the OWC air chamber, spaced 120o apart. On the basis of these measurements, the air volume flux was computed by time differentiation, taking also into account the area of the OWC net cross section. All signals were sampled at a rate of 100 Hz and subjected subsequently in digital filtering and recording.
For the measurement of the exerted loads on the base of the tower of the WT, a 6-dof load cell was inserted between the tower base and the platform (see Figure 9a). Furthermore, the accelerations of the platform were captured by accelerometers installed on the platform deck. The static and dynamic tensions along the legs of the mooring system were recorded by underwater load cells. These instruments were inserted into each anchor branch and were placed at the bottom part of them, in order to minimize their impact to the leg motions.
The pressures inside the OWC domes were measured by differential pressure gauges. The gauges were connected to the chambers using a circular end-tube averaging the air pressures of four equally spaced points located at the perimeter of the OWC dome (see Figure 9b).
The motions of the floating platform were captured by tracking the positions of eight point-targets through an optical motion capture system. Their motion was continuously monitored by infrared cameras as a rate of 500 fps. By comparing the positions of the targets in successive shots, taken from each camera, the system correlates the images and calculates the motion of the targets. Three cameras and eight targets were used for the present experiment. Four of the targets were placed in a standard “L” layout for the calibration of the system. In addition, three targets were mounted in the middle of each of the three upper peripheral tubes of the space frame and one in the middle of the WT tower (see Figure 9c).

5.3. Validation of the Numerical Models with the Experimental Results
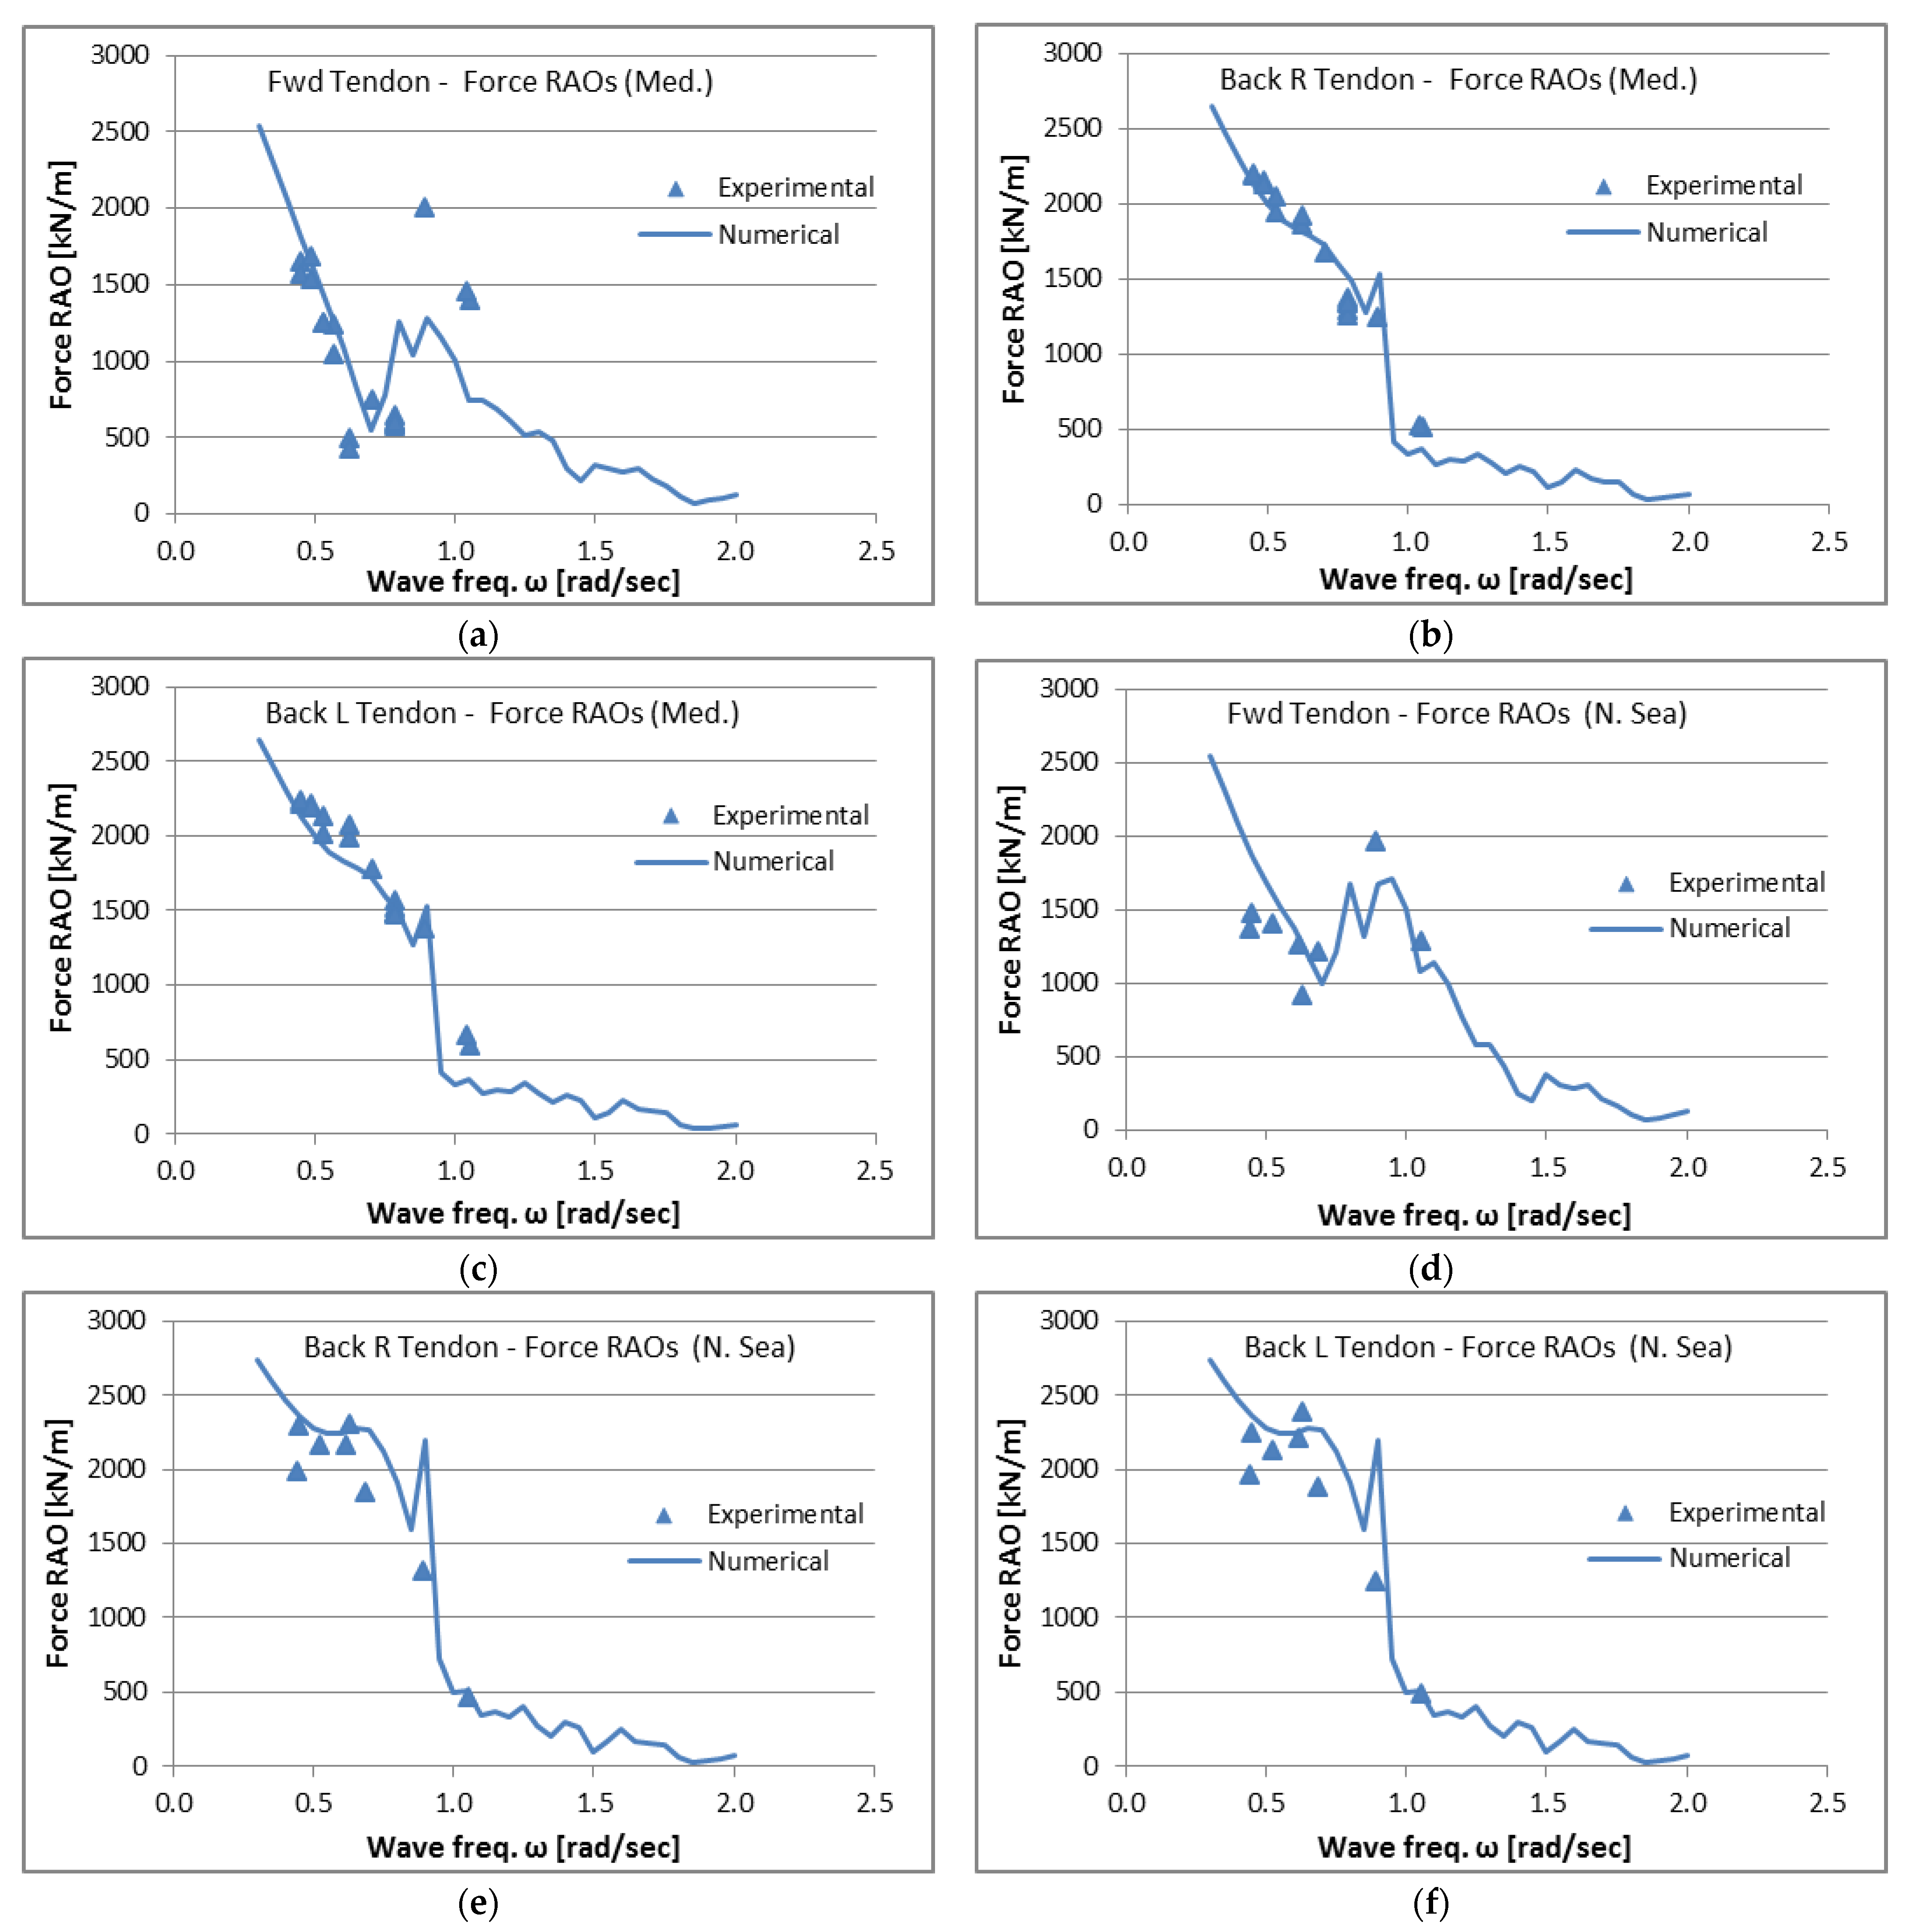
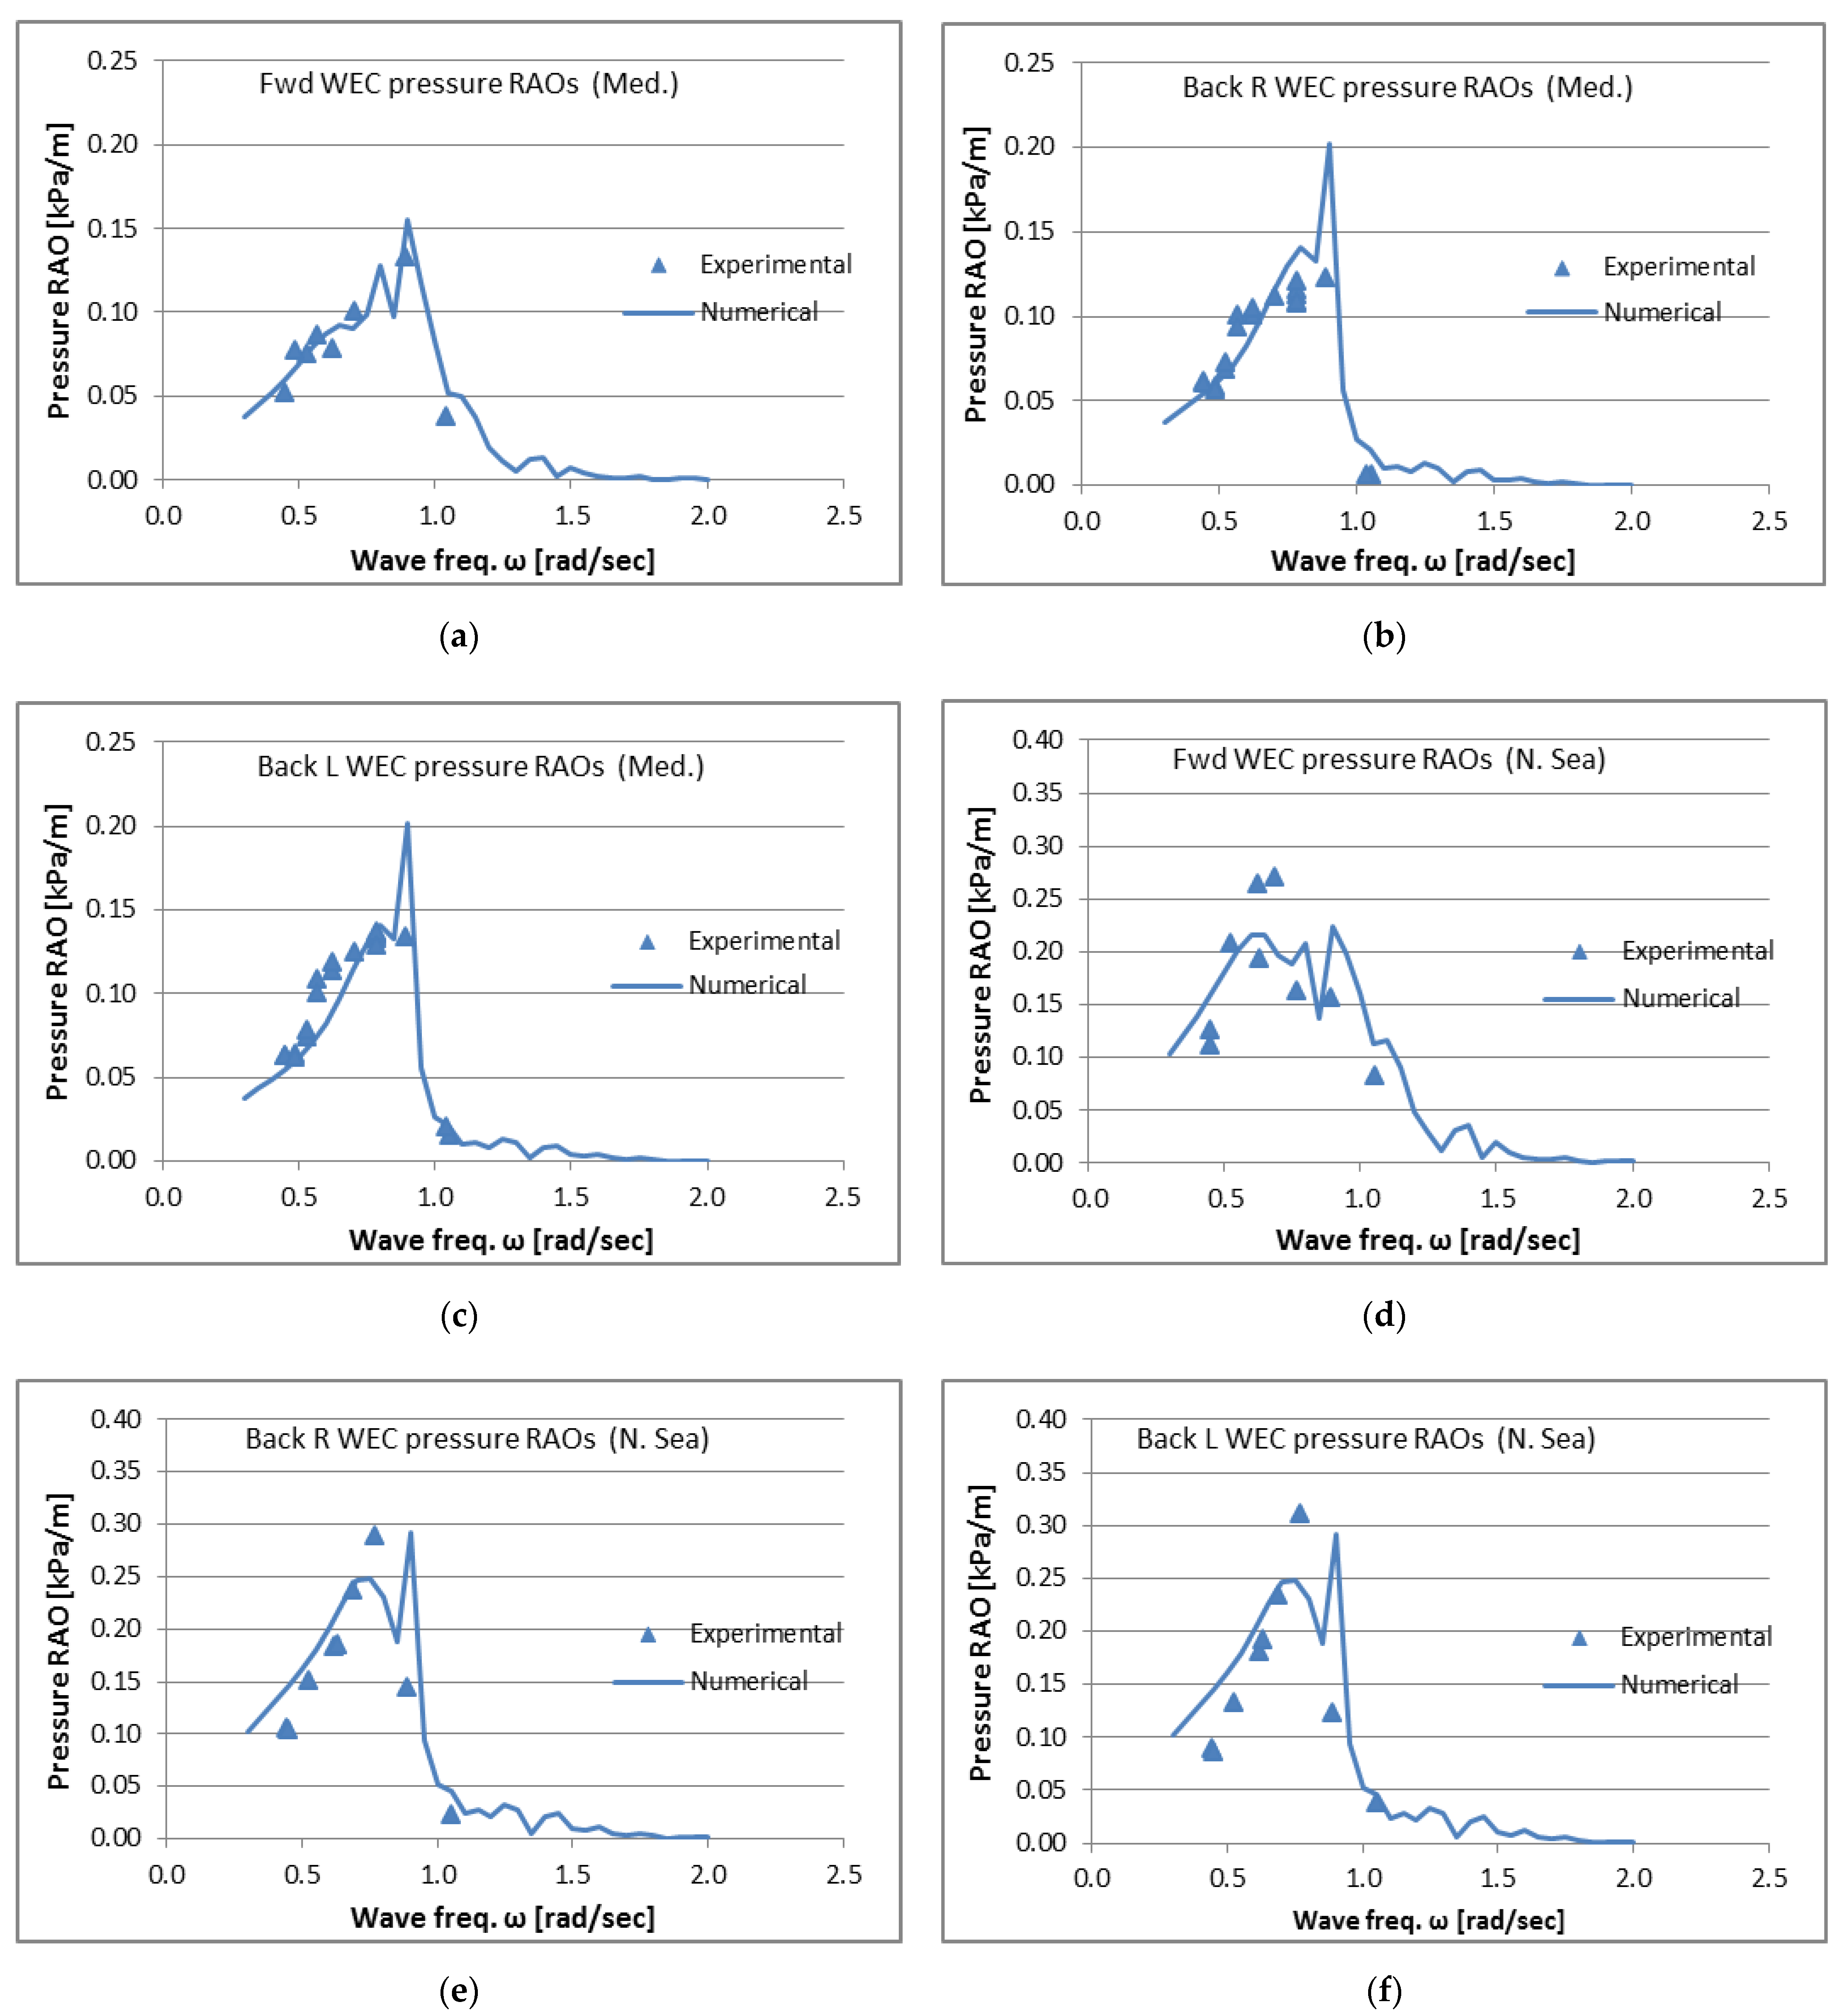
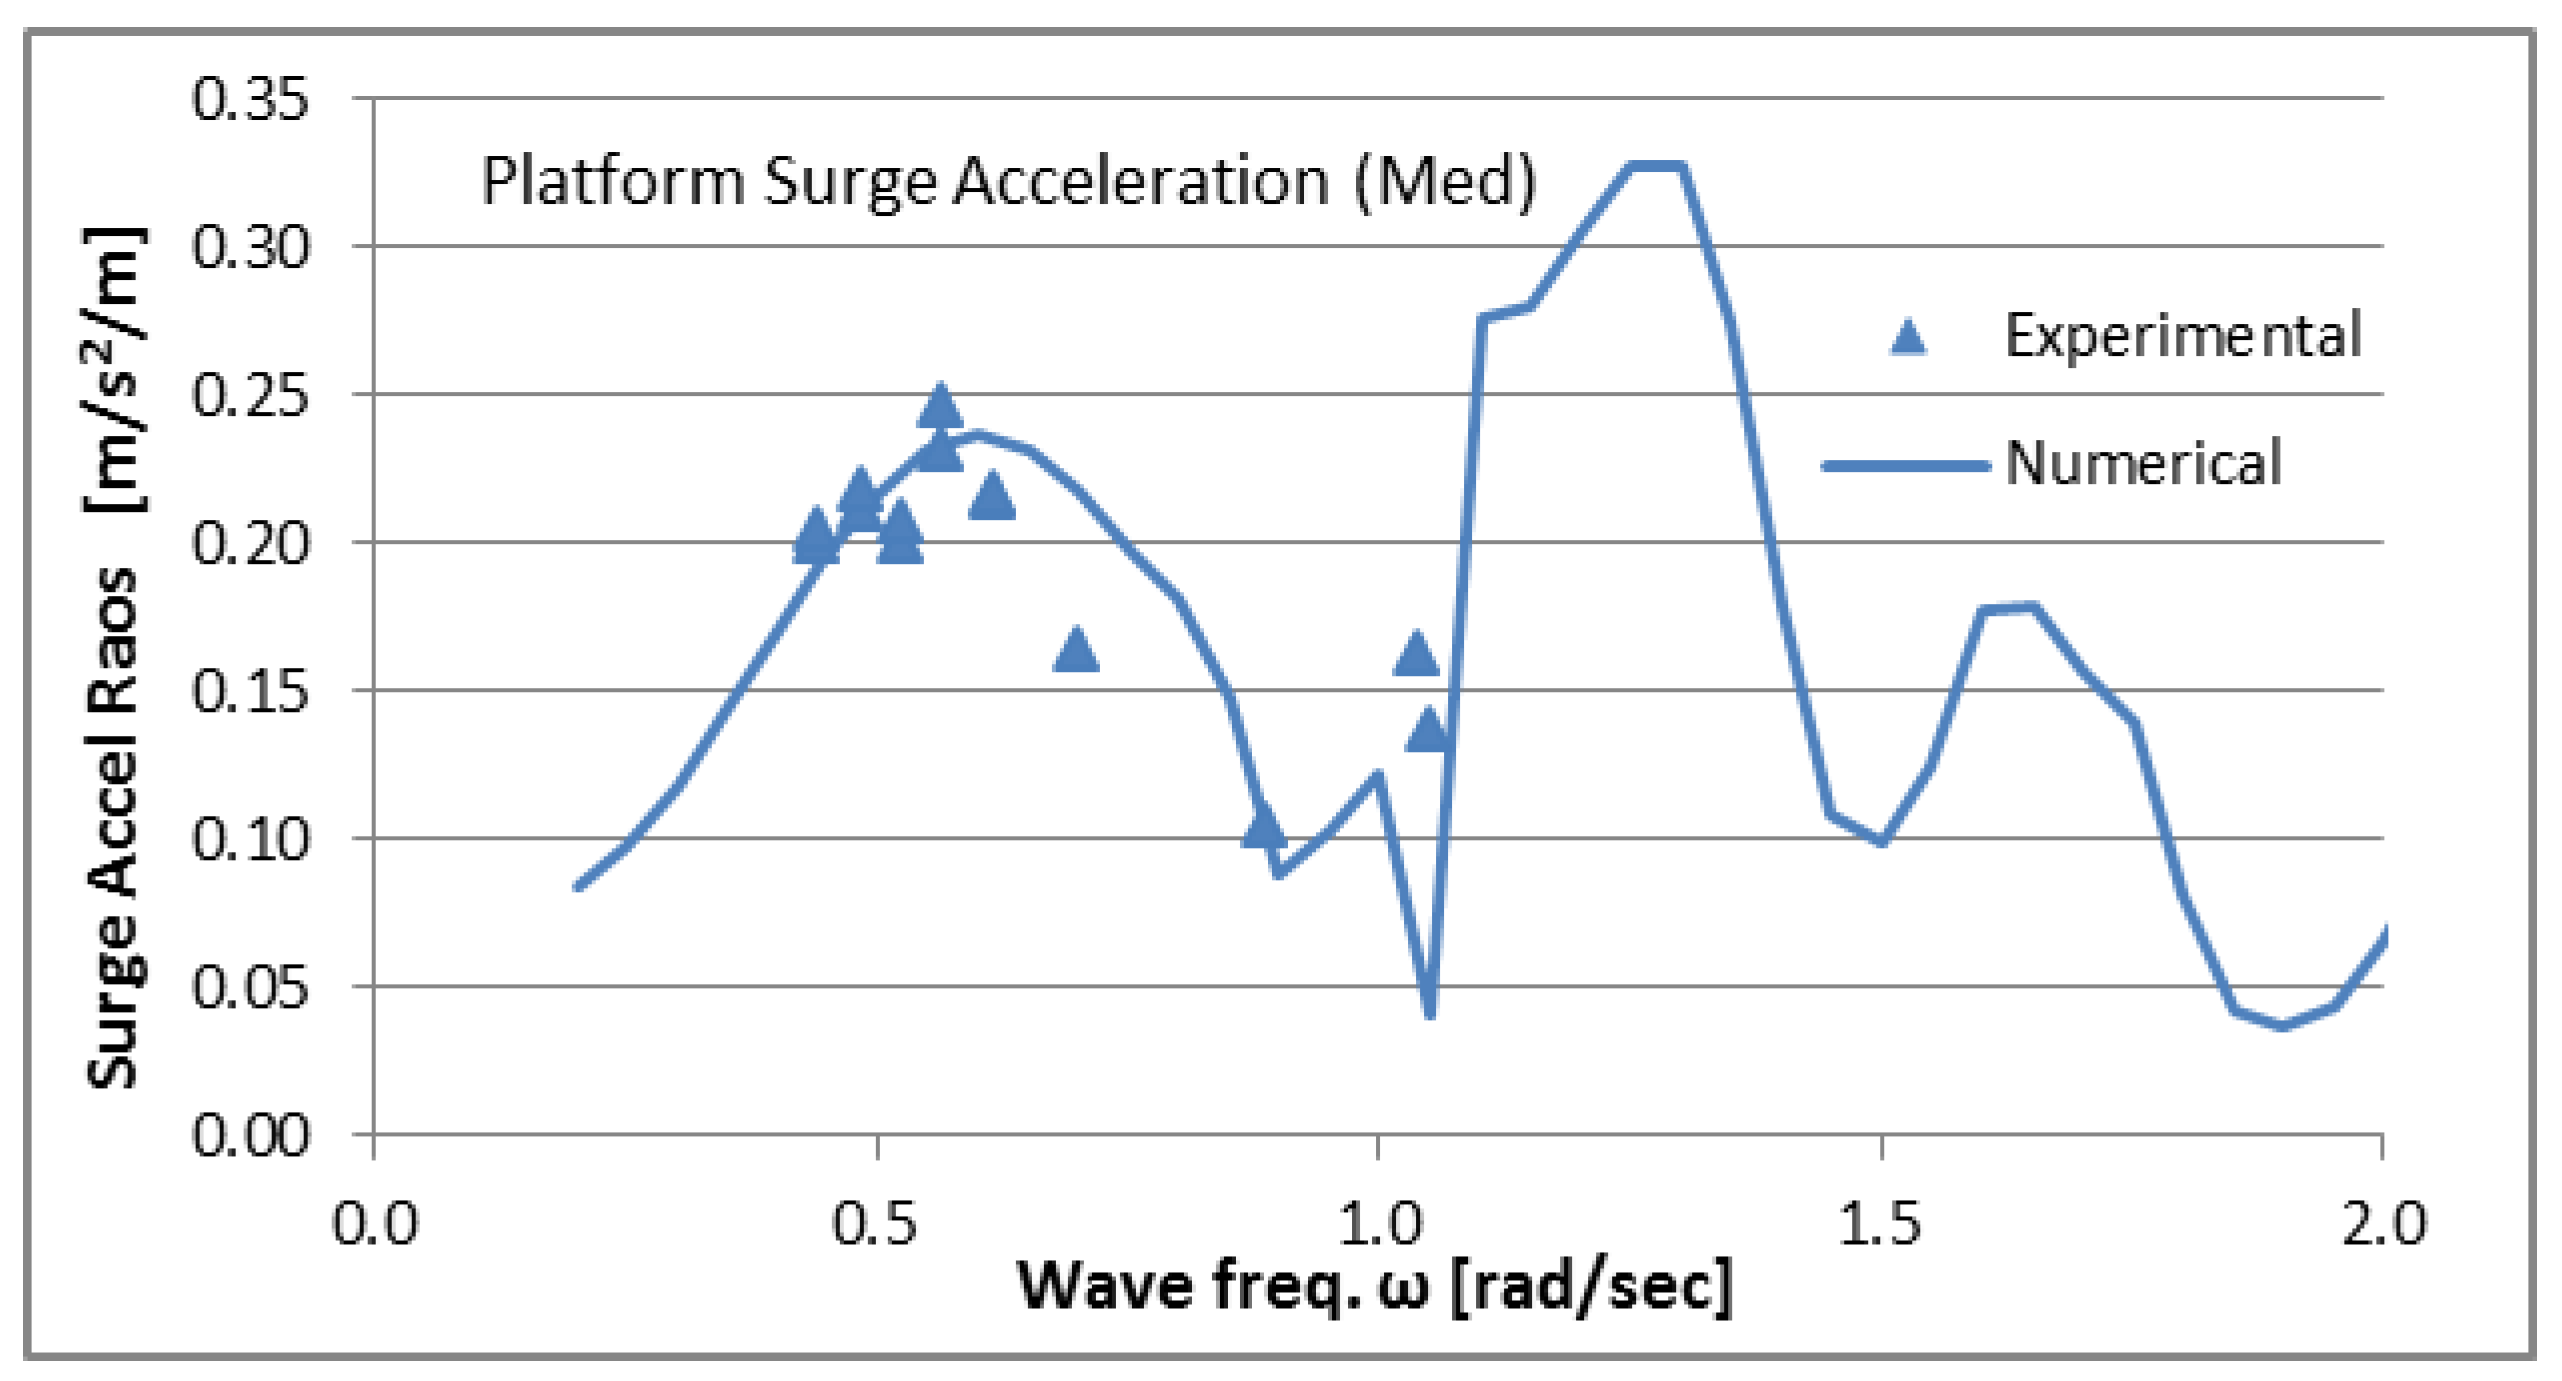
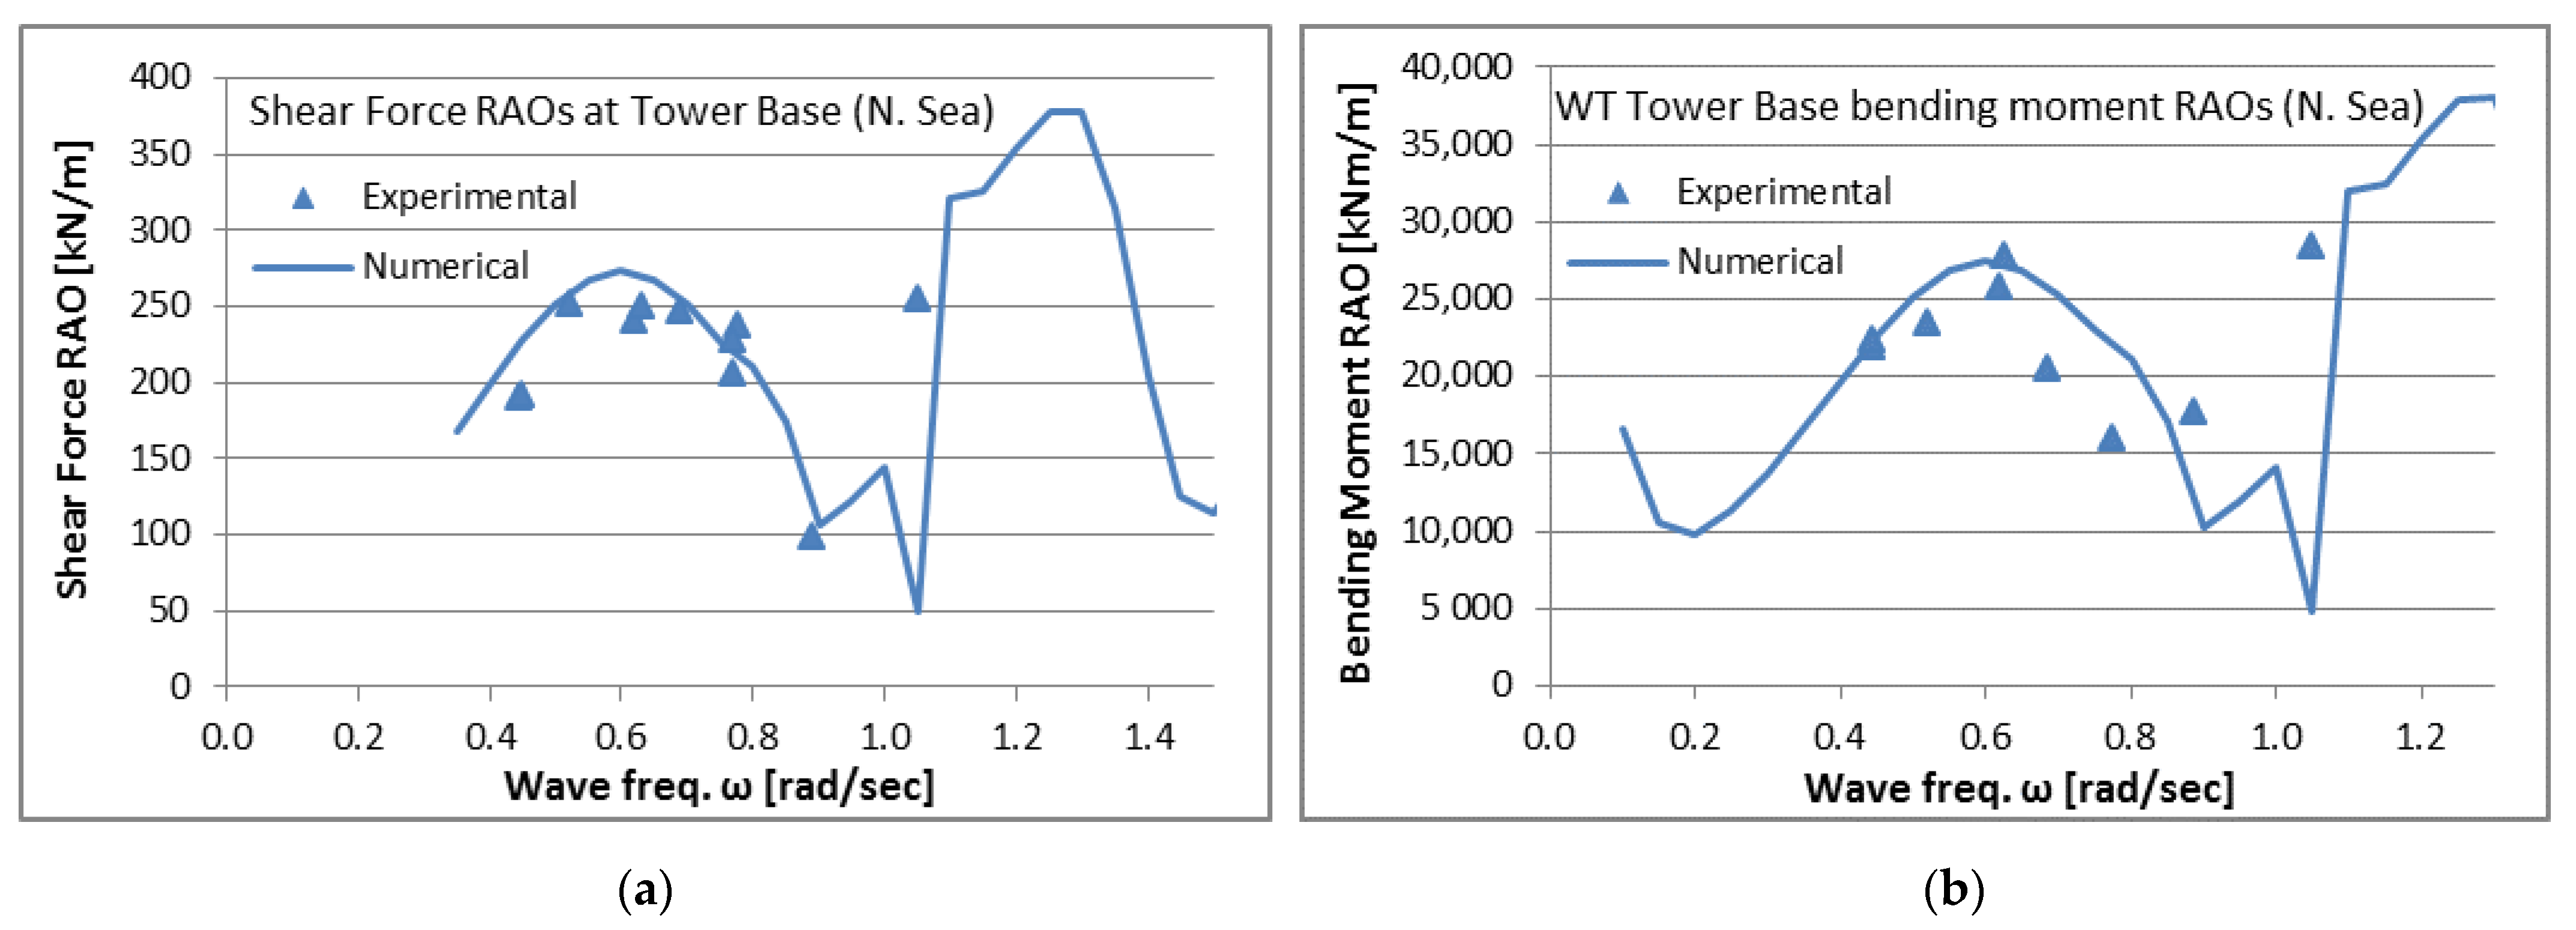
In the present subsection the outcomes of the experiments carried out with the REFOS scaled down model are presented. The experiments include measurement of: (a) the platform’s surge motions, (b) the platform acceleration, (c) the tendon tensions, (d) the WT base loads, and (e) the air pressures in the WEC domes. The obtained outcomes are compared against the results of the numerical hydrodynamic analysis presented in Section 4.
In Figure 10 the platform’s surge motions are presented for the two installation location cases i.e., Mediterranean and North Sea against the wave frequency. The figure depicts the comparisons between the measured outcomes and the numerical results. A very good agreement can be concluded between experimental and numerical results for all the examined ω in both installation locations. Although the experimental wave frequencies are in the range of (0.4–1.1 rad/s) the figures have been extended to higher frequencies (i.e., up to 2 rad/s), in order to enlighten the surge motions of the structure in this regime.
Figure 11 deals with the mooring line tension of the structure for the two installation location cases i.e., Mediterranean Sea, L1, L2, and North Sea, L3 (see Section 3). It is depicted in the graphs that the numerical results are, in general, in a good agreement with the experimental ones, with the exception of a part of the forward tendon response, namely in the range of frequencies above 0.75 rad/s. This is probably due to the performance of the WEC carpet, which was found to produce larger pressure in this area, as shown in Figure 12. In any case, this discrepancy does not influence the area of the lower frequencies, which is more important for the tendon response since it corresponds to the larger sea states. Furthermore, it is worth noting that the numerical results predict accurately the peculiar drop in the dynamic tensions in the back tendons, at frequencies above 1 rad/s.
In Figure 12 the inner air pressure head of the three OWCs is presented. A good agreement between the experimental and the numerical results can be concluded on the basis of the above figures. The results indicate a pressure drop above 1 rad/s, which is accurately captured by the numerical results.
Figure 13 depicts the comparisons between the numerical and experimental results concerning the platform’s surge accelerations. The results were recorded in a frequency range from 0.4 to 1.1 rad/s (periods 6–14 s). An overall good agreement can be observed in this wave frequency range. It is noticed that the graph with the numerical data has been extended to higher frequencies, in order to enlighten the complex nature of the accelerations in this regime.
In Figure 14 the shear forces and the bending moments at the tower base for the North Sea installation location are presented. A good correlation between the numerical and the experimental results is also observed herein. It is worth noting that the numerical results predict accurately the increase of the shear forces and bending moments at wave frequencies above 1 rad/s, which is also validated by the experimental data.
Following the experiments with harmonic waves, the REFOS platform was subjected to the action of irregular sea states, simulating the real wave environment. A range of International Towing Tank Conference (ITTC)-type spectra (Bretschneider) were simulated by the wave-making facilities of the experimental flume. The parameters of the spectra, namely the significant wave height and the peak period, were properly selected, covering of the range of the most probable wave sea states prevailing at the installation locations under examination. Both operational and extreme conditions were considered. During the first, the air turbines of the OWC devices were simulated as operational, and also the nominal thrust coming from the WT was applied to the platform. The extreme conditions corresponded to the extreme wave heights expected in the design life of the structure (see Section 3). During these conditions the OWCs were assumed to be non-operating (i.e., not producing pressure inside the devices’ domes), and the WT was also non-operating. The focus of the experiments was on the dynamic tensions produced on the tendons of the TLP system.
In Figure 15 and Figure 16 the experimental results concerning the dynamic tensions on the tendons are indicatively presented for the North Sea installation location. The results include also the corresponding numerical predictions for comparison and validation of the pertinent software tools, which were developed in the framework of the REFOS project.
Summarizing from the validation of the numerical models with the experimental results it can be concluded that:
(a)
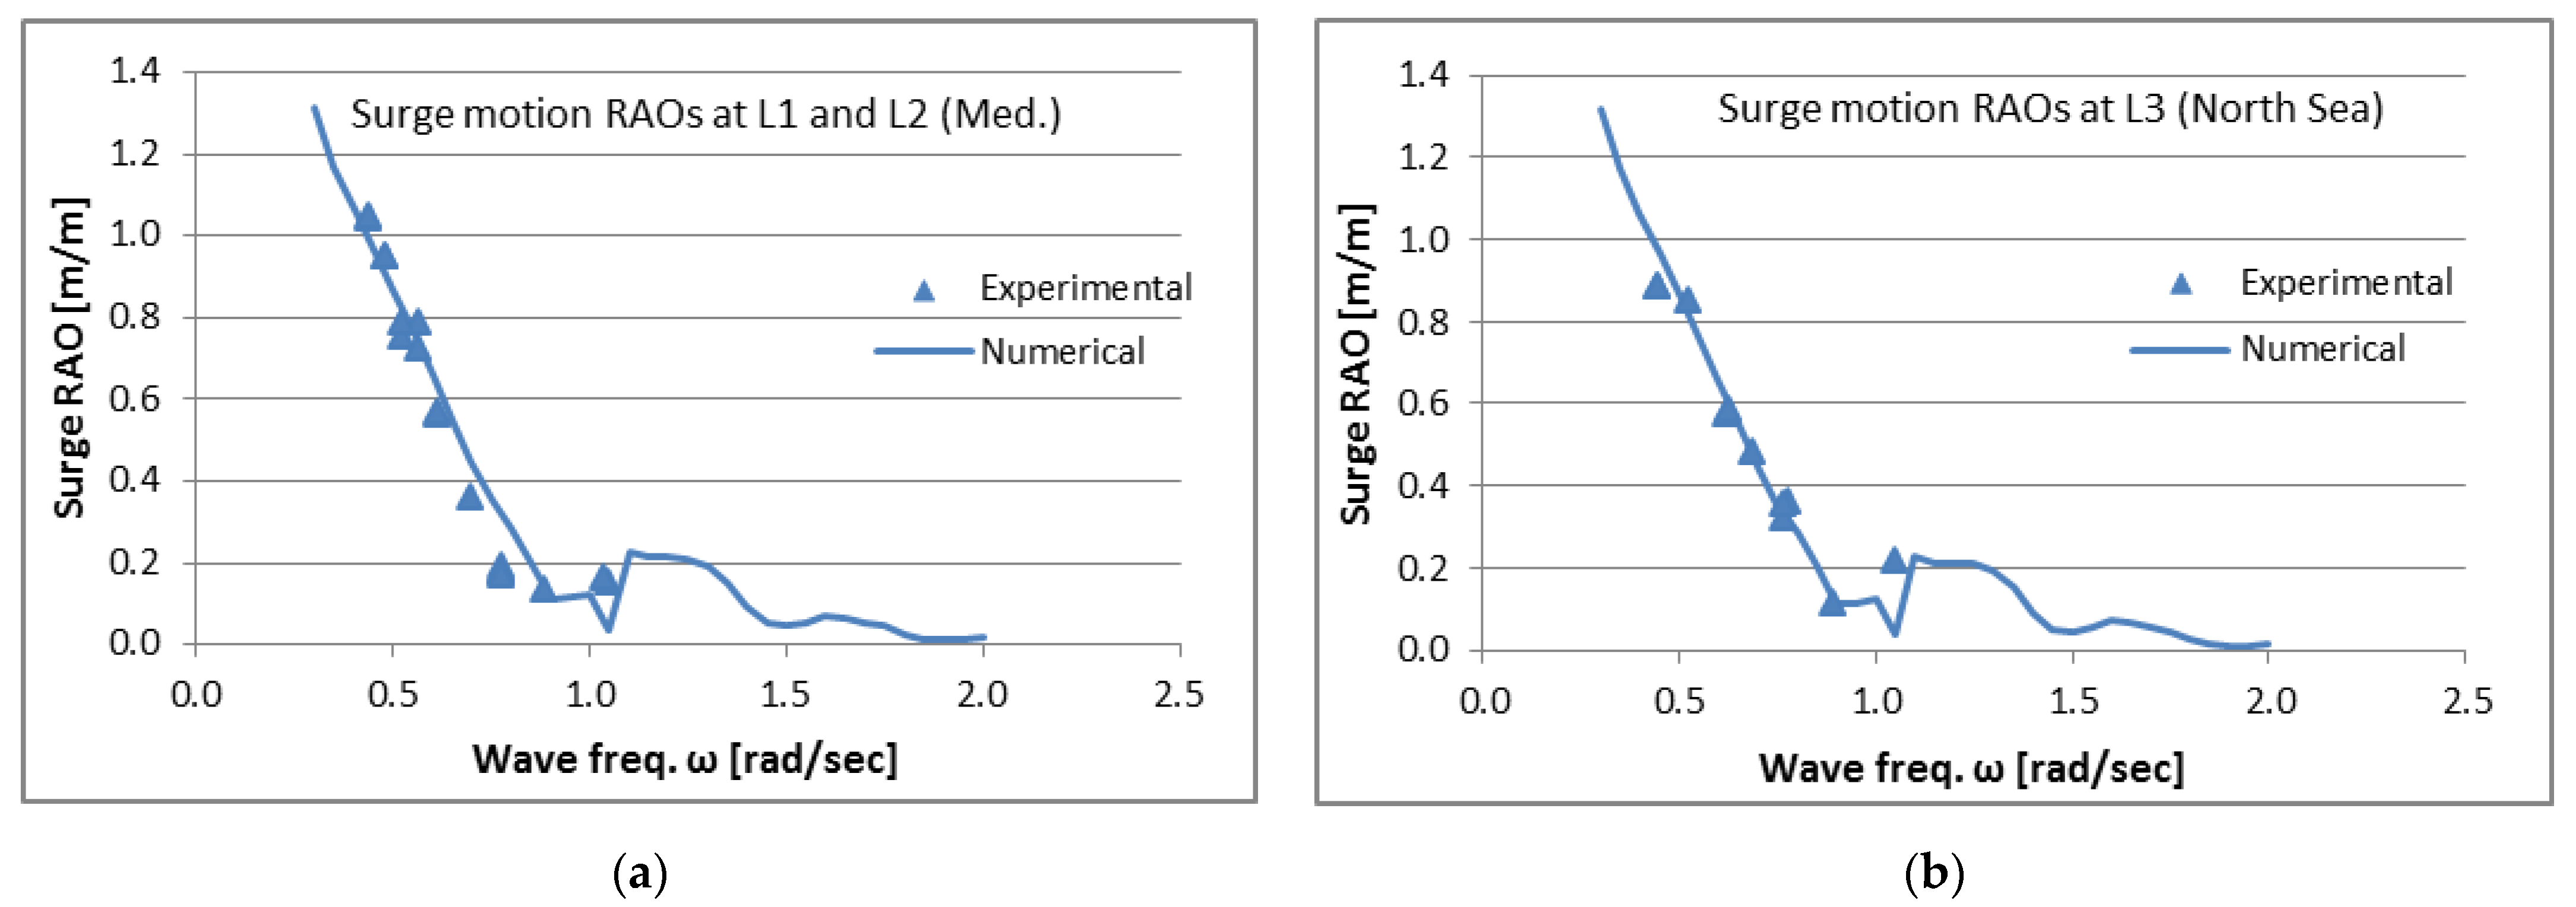
For the case of the harmonic waves, a wide range of exciting frequencies was examined, and the corresponding response amplitude operators (RAOs) were derived (the sea keeping response of the platform in surge motion; the platform’s accelerations; the dynamic tendon loads; the OWC air chamber pressure and the WT tower base loads). The obtained RAOs were found to be in very good agreement with the numerical hydrodynamic analysis presented herein. This verifies the software tools developed in the context of the project.
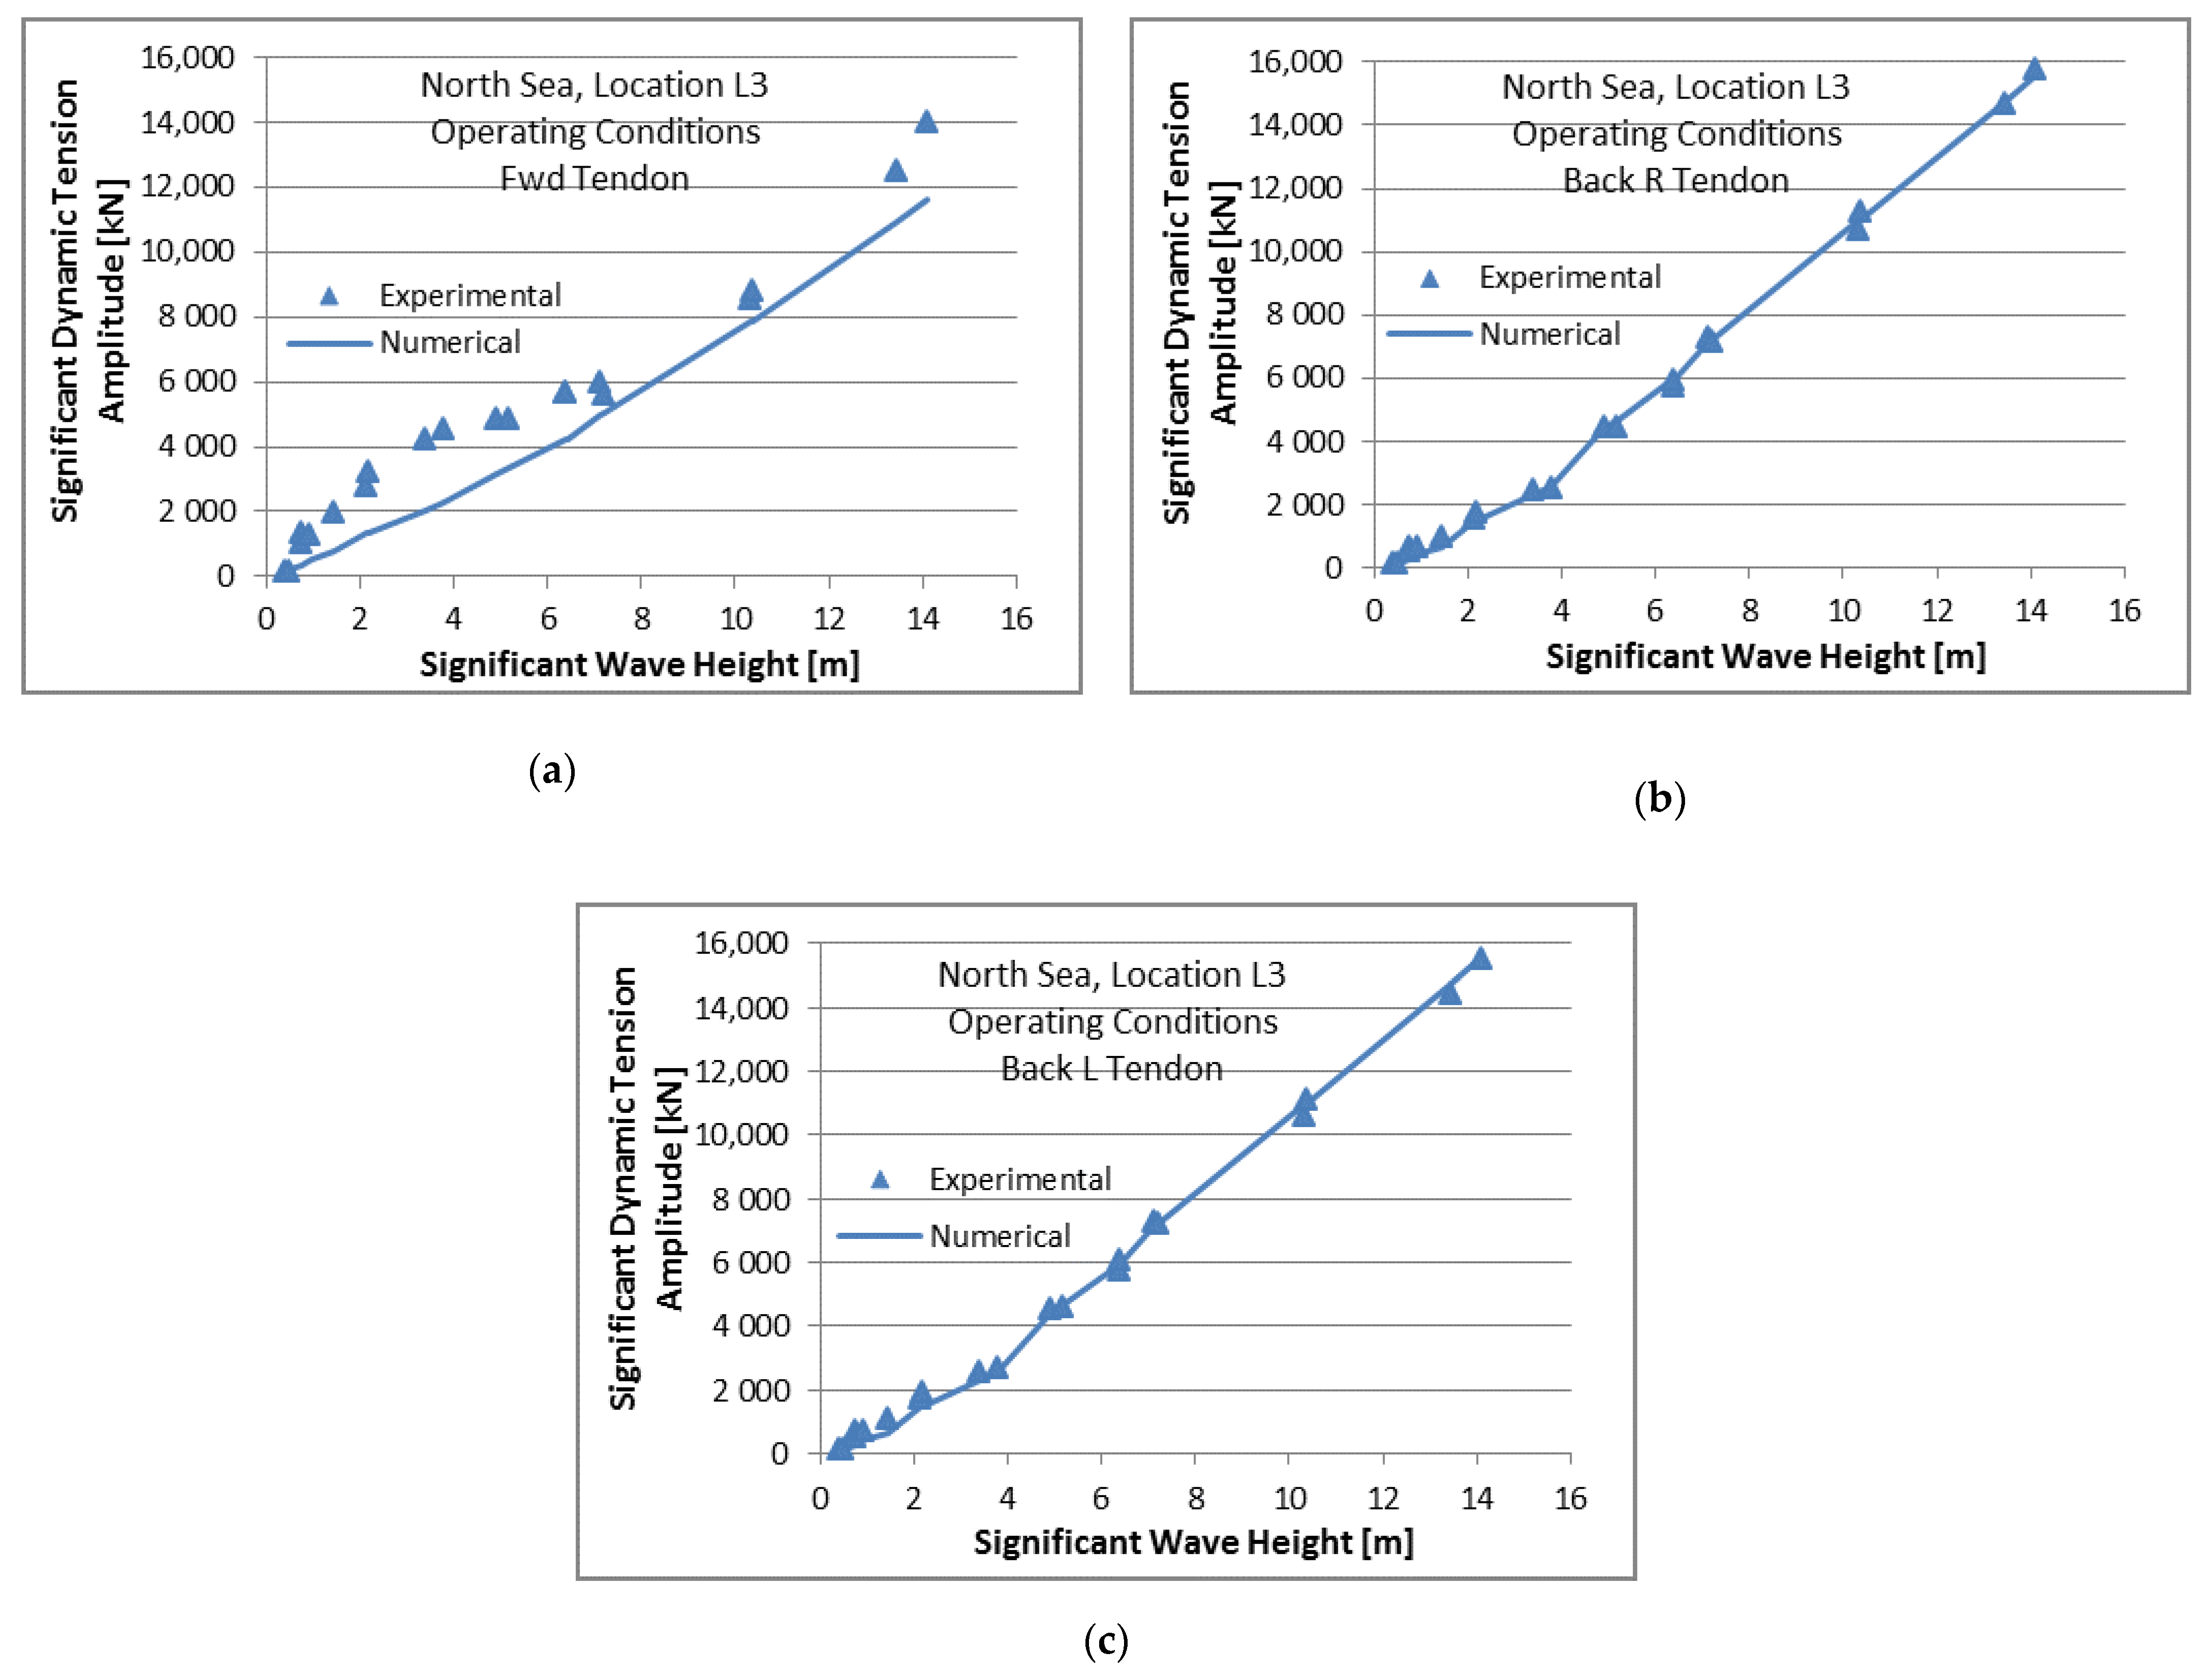
(b)
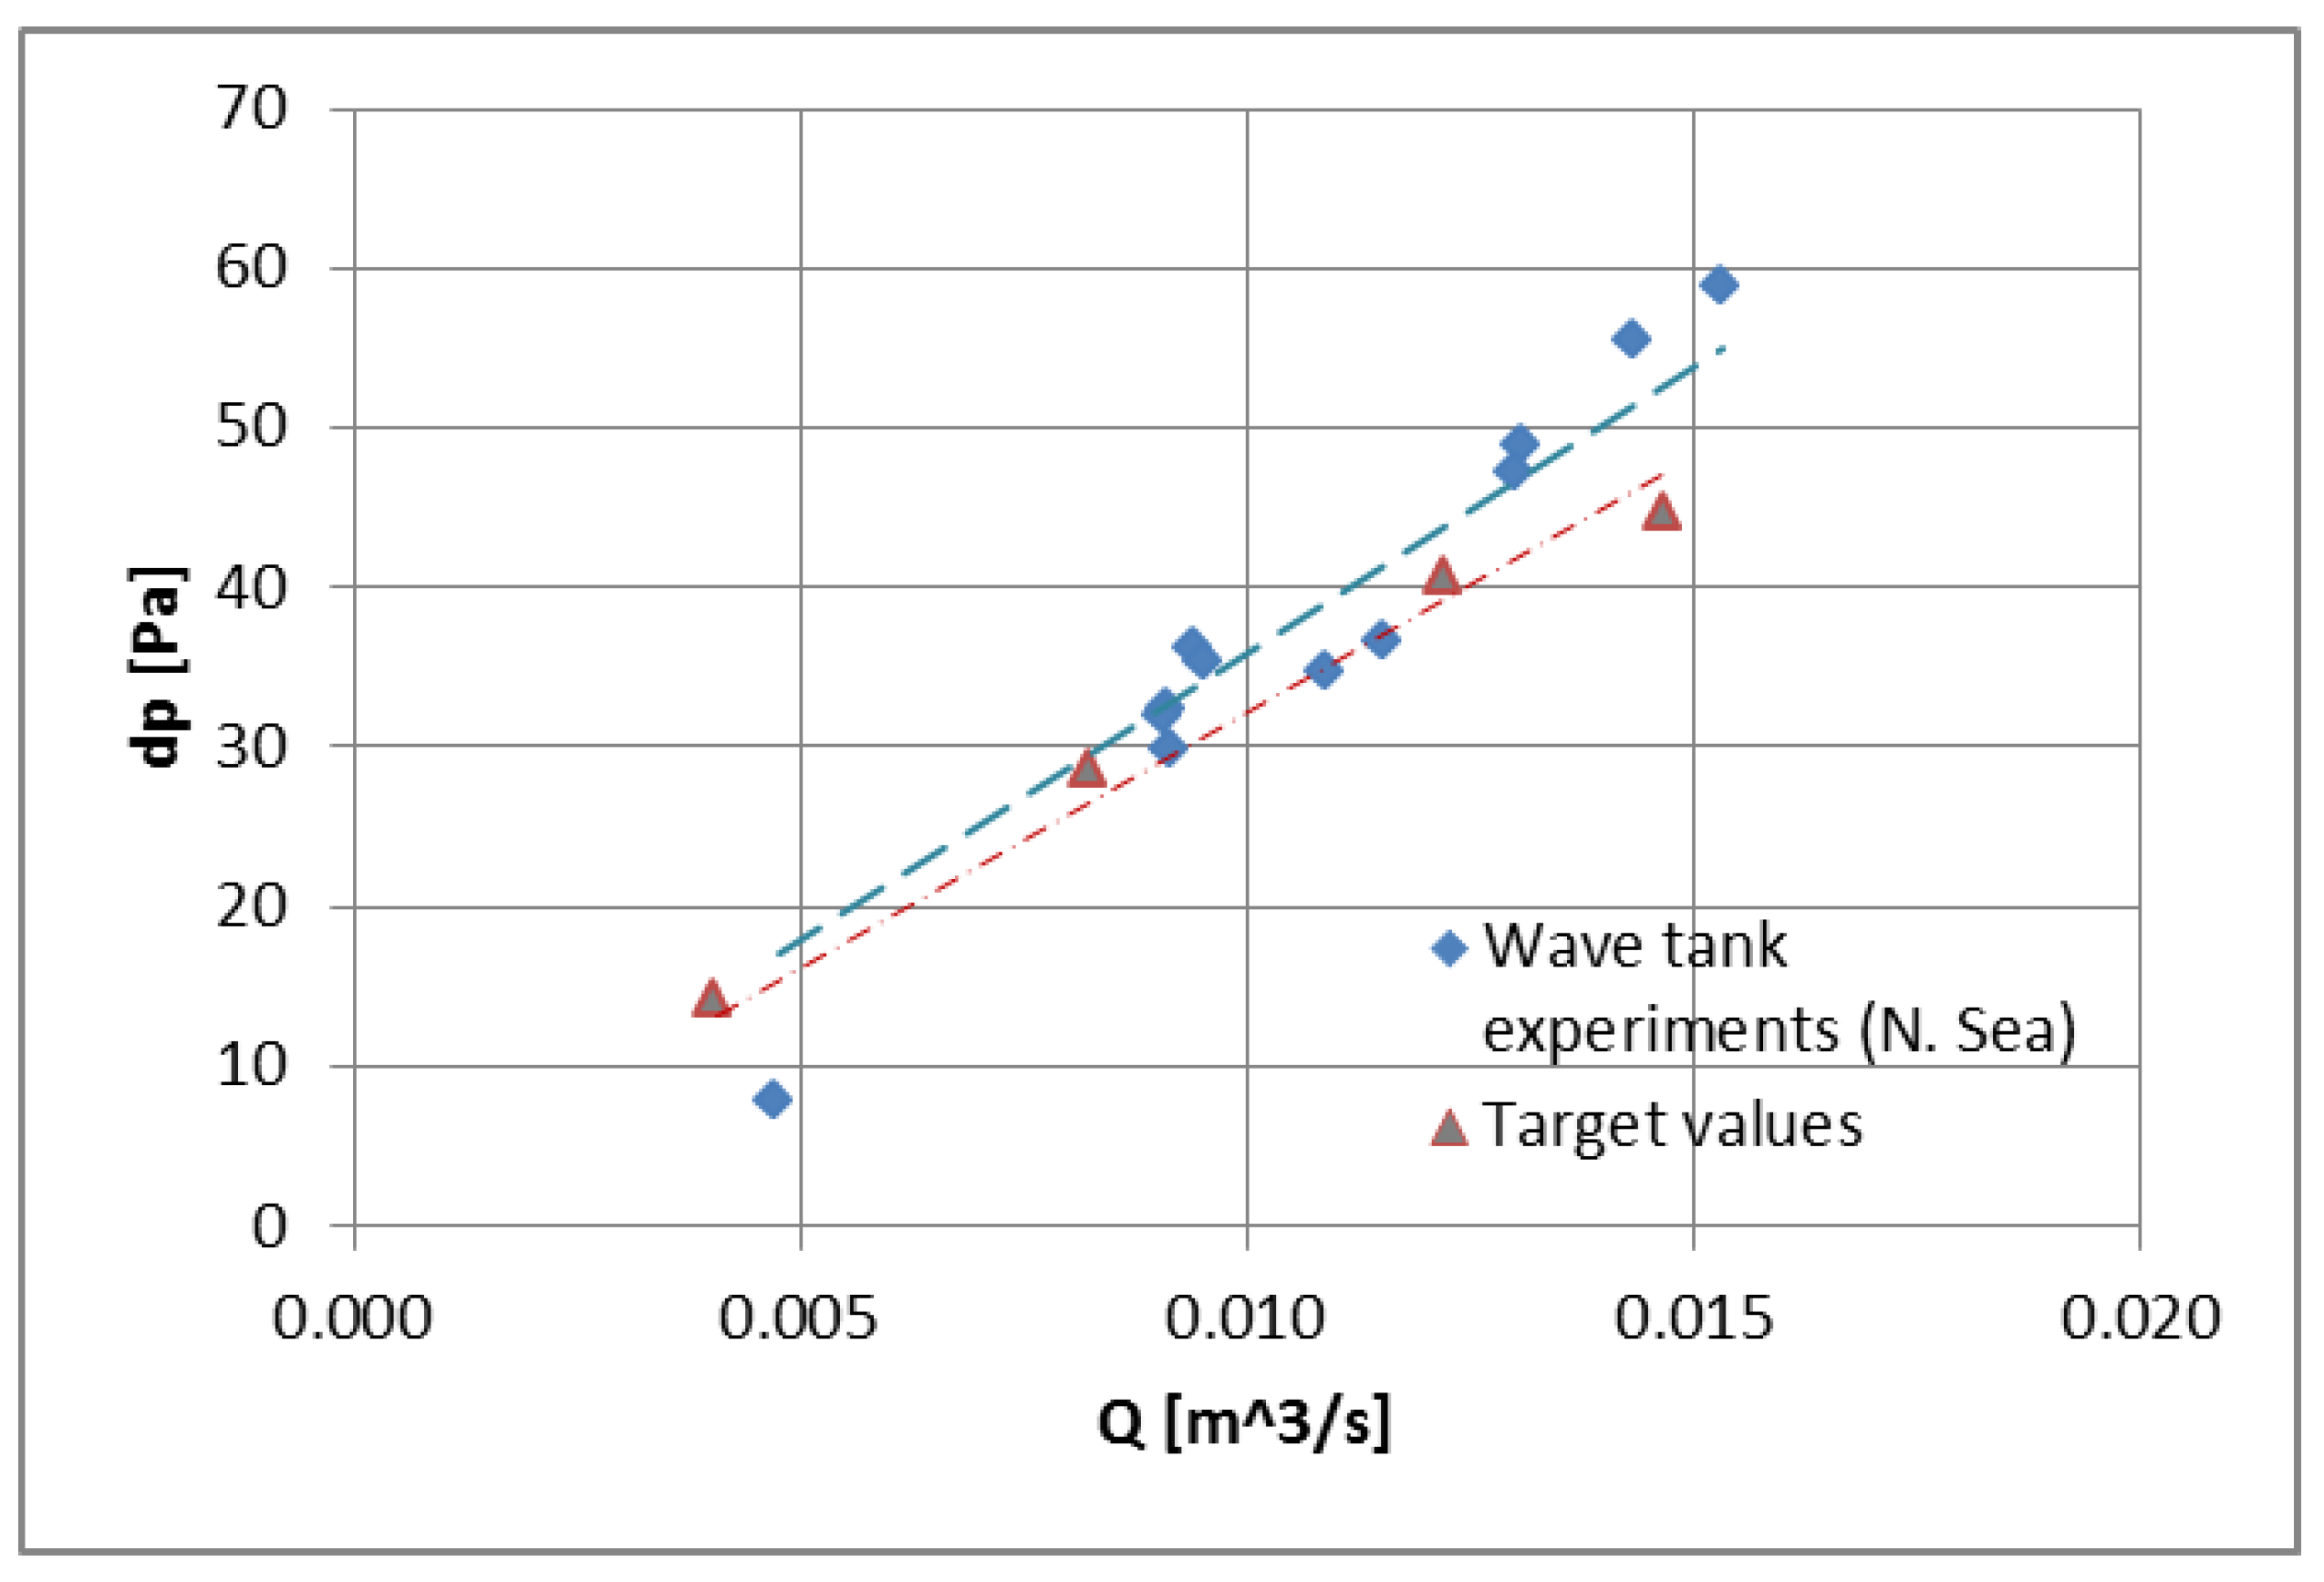
Following the harmonic waves, irregular sea states were analyzed. A wide range of productive (i.e., permitting the operation of the WT and OWC) sea conditions foreseen for the three REFOS installation locations was experimentally simulated, with the focus being at the performance of the mooring system. The experimental results verified the dynamic loads on the tendons of the mooring system. This is of great importance, considering the critical role of this system, as regards the safety of the platform.

6. Conclusions

The present paper summarized the theory behind the modelling performed to incorporate an array of OWC devices with a floating WT into the REFOS hull. The REFOS is a floating platform which encompasses an array of three hydrodynamically interacting OWC devices, moored through tensioned tethers as a TLP platform supporting a 10 MW WT. Environmental conditions for three installation locations (i.e., two in the Mediterranean Sea and one in the North Sea) were presented. Furthermore, an analytical model was developed to integrate properly the solutions of the hydrodynamic diffraction and the pressure- and motion-dependent radiation problems around the floating structure and the aerodynamics of the WT. Details on the modelling of the system were discussed and hydro-aero-elastic coupling between the floater and the WT was presented. Moreover, a scaled-down physical model of the REFOS structure was constructed and an experimental campaign was conducted in order to validate the presented theoretical formulation.
The present investigation can be extended by coupling appropriately the hydro-aero-dynamic problem of the REFOS structure with the mooring dynamics of a different type of mooring system (i.e., a conventional mooring system), aiming at examining the effect of the mooring system on the structure’s seakeeping characteristics, mooring line loads, OWCs inner air pressure, etc.

Author Contributions

Conceptualization, S.A.M., S.G.V. and G.M.K.; methodology, S.A.M. and S.G.V.; software, S.A.M., T.H.S., D.N.K., D.I.M. and G.M.K.; validation, G.M.K., D.N.K. and D.I.M.; investigation, S.A.M. and T.H.S.; writing—original draft preparation, D.N.K.; writing—review and editing, S.A.M., S.G.V., T.H.S., G.M.K. and D.I.M.; visualization, D.N.K., T.P.M., and S.P.; supervision, S.A.M. All authors have read and agreed to the published version of the manuscript.

Funding

This research has been partially financed by the European Union, Horizon 2020, the E.U. Framework Program for Research and Innovation, Research Fund for Coal and Steel, Program: REFOS (709526): Life-Cycle Assessment of a Renewable Energy Multi-Purpose Floating Offshore System.

Institutional Review Board Statement

Not applicable.

Informed Consent Statement

Not applicable.

Data Availability Statement

Not applicable.

Conflicts of Interest

The authors declare no conflict of interest.

Abbreviations

TLPTension Leg Platform
OWCOscillating Water Column
WTWind Turbine
LCOELevelized Cost of Energy
WECWave Energy Converter
O&MOperation & Maintenance
DTUTechnical University of Denmark
SWLSea Water Level
CMCenter of Mass
ODOuter Diameter
pdfJoint Probability Density Function
cdfCumulative Distribution Function
MLMMaximum Likelihood Method
dofsDegrees of Freedom
BEMBlade Element Momentum
FnFroude Number
ReReynolds Number
LSMHLaboratory for Ship and Marine Hydrodynamics
ITTCInternational Towing Tank Conference

References

  1. Wind Europe Organization. Key Trends and Statistics 2020; Report. 2020. Available online: http://windeurope.org (accessed on 2 April 2021).
  2. Wind Europe Organization. Wind Energy in Europe, Scenarios for 2030; Report. 2017. Available online: http://windeurope.org (accessed on 2 April 2021).
  3. Ocean Energy. Key Trends and Statistics; Report. 2019. Available online: http://oceanenergy-europe.eu (accessed on 2 April 2021).
  4. Badcock-Broe, A.; Flynn, R.; Sian, G.; Gruet, R.; Medic, N. Wave and Tidal Energy Market Deployment Strategy for Europe, Strategic Initiative for Ocean Energy (SI Ocean). 2014. Available online: http://www.siocean.eu/en/MarketDeployment/Market-Deployment-Strategy/ (accessed on 2 April 2021).
  5. International Renewable Energy Agency. Renewable Power Generation Costs in 2019; Report. 2019. Available online: http://irena.org (accessed on 2 April 2021).
  6. Nazir, C.P. Offshore hydroelectric plant: A techno-economic analysis of a renewable energy source. Renew. Sustain. Energy Rev. 2014, 34, 174–184. [Google Scholar] [CrossRef]
  7. Kuriqi, A.; Pinheiro, A.; Sordo-Ward, A.; Garrote, L. Water-energy-ecosystem nexus: Balancing competing interests at a run-of-river hydropower plant coupling a hydrologic-ecohydraulic approach. Energy Convers. Manag. 2020, 223, 113267. [Google Scholar] [CrossRef]
  8. Kuriqi, A.; Pinheiro, A.; Sordo-Ward, A.; Bejerano, M.D.; Garrote, L. Ecological impacts of run-of-river hydropower plants—Current status and future prospects on the brink of energy transition. Renew. Sustain. Energy Rev. 2021, 142, 110833. [Google Scholar] [CrossRef]
  9. Perez-Collazo, C.; Astariz, S.; Abanades, J.; Greaves, D.; Iglesias, G. Co-located Wave and Offshore Wind Farms: A Preliminary Case Study of a Hybrid Array. In Proceedings of the 34th International Conference in Coastal Engineering, Seoul, Korea, 16–20 June 2014; Lynett, P., Ed.; Curran Associates Inc.: New York, NY, USA, 2014. [Google Scholar]
  10. Pelagic Power AS. 2010. Available online: http://pelagicpower.no (accessed on 2 April 2021).
  11. DualSub. 2019. Available online: http://marinepowersystems.co.uk/dualsub/ (accessed on 2 April 2021).
  12. Floating Power Plant. Available online: http://floatingpowerplant.com/ (accessed on 2 April 2021).
  13. Aubault, A.; Alves, M.; Sarmento, A.; Roddier, D.; Peiffer, A. Modeling of an oscillating water column on the floating foundation WINDFLOAT. In Proceedings of the ASME 2011 30th International Conference on Ocean, Offshore and Arctic Engineering, Rotterdam, The Netherlands, 19–24 June 2011. [Google Scholar]
  14. Mazarakos, T.P.; Konispoliatis, D.N.; Katsaounis, G.; Polyzos, P.; Manolas, D.; Voutsinas, S.; Mavrakos, S.A. Numerical and experimental studies of an offshore multi-purpose floating structure supporting a wind turbine. In Proceedings of the 12th European Wave & Tidal Energy Conference, Cork, Ireland, 27 August–1 September 2017. [Google Scholar]
  15. Mazarakos, T.; Konispoliatis, D.; Katsaounis, G.; Polyzos, S.; Manolas, D.; Voutsinas, S.; Soukissian, T.; Mavrakos, S. Numerical and experimental studies of a multi-purpose floating TLP structure for combined wind and wave energy exploitation. Mediterr. Mar. Sci. 2019, 20, 745–763. [Google Scholar] [CrossRef] [Green Version]
  16. Katsaounis, G.M.; Polyzos, S.; Mavrakos, S.A. An Experimental Study of the Hydrodynamic Behavior of a TLP Platform for a 5MW Wind Turbine with OWC Devices. In Proceedings of the VII International Conference on Computational Methods in Marine Engineering, Nantes, France, 15–17 May 2017. [Google Scholar]
  17. Mazarakos, T.; Konispoliatis, D.; Manolas, D.; Voutsinas, S.; Mavrakos, S. Modelling of an offshore multi-purpose floating structure supporting a wind turbine including second-order wave loads. In Proceedings of the 11th European Wave & Tidal Energy Conference, Nantes, France, 7–10 September 2015. [Google Scholar]
  18. Mazarakos, T.; Konispoliatis, D.; Mavrakos, S. Parametric hydrodynamic analysis of a moored floating structure for combined wind and wave energy exploitation. In Proceedings of the 12th International Conference on Hydrodynamics, Egmond aan Zee, The Netherlands, 18–23 September 2016. [Google Scholar]
  19. Sarmiento, J.; Iturrioz, A.; Ayllón, V.; Guanche, R.; Losada, I.J. Experimental modelling of a multi-use floating platform for wave and wind energy harvesting. Ocean Eng. 2019, 173, 761–773. [Google Scholar] [CrossRef]
  20. Perez-Collazo, C.; Greaves, D.; Iglesias, G. A novel hybrid wind-wave energy converter for jacket-frame substructures. Energies 2018, 11, 637. [Google Scholar] [CrossRef] [Green Version]
  21. Perez-Collazo, C.; Pemberton, R.; Greaves, D.; Iglesias, G. Monopile-mounted wave energy converter for a hybrid wind-wave system. Energy Convers. Manag. 2019, 199, 111971. [Google Scholar] [CrossRef]
  22. Michele, S.; Renzi, E.; Perez-Collazo, C.; Greaves, D.; Iglesias, G. Power extraction in regular and random waves from an OWC in hybrid wind-wave energy systems. Ocean Eng. 2019, 191, 106519. [Google Scholar] [CrossRef]
  23. Zhou, Y.; Ning, D.; Shi, W.; Johanning, L.; Liang, D. Hydrodynamic investigation on an OWC wave energy converter integrated into an offshore wind turbine monopile. Coast. Eng. 2020, 162, 103731. [Google Scholar] [CrossRef]
  24. Cong, P.; Teng, B.; Bai, W.; Ning, D.; Liu, Y. Wave power absorption by an oscillating water column (OWC) device of annular cross-section in a combined wind-wave energy system. Appl. Ocean Res. 2021, 107, 102499. [Google Scholar] [CrossRef]
  25. Bak, C.; Zahle, F.; Bitsche, R.; Kim, T.; Yde, A.; Henriksen, L.C.; Natarajan, A.; Hansen, M.H. Description of the DTU 10MW Reference Wind Turbine; DTU. Wind Energy Report-I-0092; DTU Wind Energy: Roskilde, Denmark, 2013. [Google Scholar]
  26. Falnes, J. Ocean Waves and Oscillating Systems; Cambridge University Press: Cambridge, UK; New York, NY, USA, 2002. [Google Scholar]
  27. Martins-rivas, H.; Mei, C.C. Wave power extraction from an oscillating water column along a straight coast. Ocean Eng. 2009, 36, 426–433. [Google Scholar] [CrossRef]
  28. Evans, D.V.; Porter, R. Efficient calculation of hydrodynamic properties of OWC-type devices. J. Offshore Mech. Arct. Eng. 1997, 119, 210–218. [Google Scholar] [CrossRef]
  29. Konispoliatis, D.; Mazarakos, T.; Katsidoniotaki, E.; Vamiadakis, A.; Soukissian, T.; Mavrakos, S. Efficiency of an array of OWC devices equipped with air turbines with pitch control. In Proceedings of the 13th European Wave & Tidal Energy Conference, Napoli, Italy, 1–6 September 2019. [Google Scholar]
  30. European Centre for Medium-Range Weather Forecasts. Updated Daily. ERA-20C Project (ECMWF Atmospheric Reanalysis of the 20th Century). Research Data Archive at the National Center for Atmospheric Research, Computational and Information Systems Laboratory. 2014. Available online: http://dx.doi.org/10.5065/D6VQ30QG (accessed on 2 April 2021).
  31. Poli, P.; Hersbach, H.; Dee, D.P.; Berrisford, P.; Simmons, A.J.; Vitart, F.; Laloyaux, P.; Tan, D.G.H.; Peubey, C.; Thépaut, J.; et al. ERA-20C: An Atmospheric Reanalysis of the Twentieth Century. J. Clim. 2016, 29, 4083–4097. [Google Scholar] [CrossRef]
  32. Coles, S. An Introduction to Statistical Modeling of Extreme Values; Springer: Berlin/Heidelberg, Germany, 2001. [Google Scholar]
  33. Soukissian, T.H.; Kalantzi, G. Extreme value analysis methods used for wave prediction. In Proceedings of the 16th International Offshore and Polar Engineering Conference, San Francisco, CA, USA, 28 May–2 June 2006. [Google Scholar]
  34. Soukissian, T.H.; Kalantzi, G. A new method for applying the r-largest maxima model for design sea-state prediction. Int. J. Offshore Polar Eng. 2009, 19, 176–182. [Google Scholar]
  35. Soukissian, T.H.; Tsalis, C. The effect of the generalized extreme value distribution parameter estimation methods in extreme wind speed prediction. Nat. Hazards Earth System Sci. 2015, 78, 1777–1809. [Google Scholar] [CrossRef]
  36. Jonathan, P.; Ewans, K.; Forristall, G. Statistical estimation of extreme ocean environments: The requirement for modelling directionality and other covariate effects. Ocean Eng. 2008, 35, 1211–1225. [Google Scholar] [CrossRef]
  37. Soukissian, T.H. Probabilistic modeling of directional and linear characteristics of wind and sea states. Ocean Eng. 2014, 91, 91–110. [Google Scholar] [CrossRef]
  38. Karathanasi, F.; Soukissian, T.; Belibassakis, K. Directional Extreme Value Models in Wave Energy Applications. Atmosphere 2020, 11, 274. [Google Scholar] [CrossRef] [Green Version]
  39. Vanem, E. 3-dimensional environmental contours based on a direct sampling method for structural reliability analysis of ships and offshore structures. Ships Offshore Struct. 2019, 14, 74–85. [Google Scholar] [CrossRef]
  40. Vanem, E. A comparison study on the estimation of extreme structural response from different environmental contour methods. Mar. Struct. 2017, 56, 137–162. [Google Scholar] [CrossRef]
  41. Rosenblatt, M. Remarks on a multivariate transformation. Ann. Math. Statist. 1952, 23, 470–472. [Google Scholar] [CrossRef]
  42. Cheng, P.W.; van Bussel, G.J.W.; van Kuik, G.A.M.; Vugts, J.H. Reliability-based Design Methods to Determine the Extreme Response Distribution of Offshore Wind Turbines. Wind Energy 2003, 6, 1–22. [Google Scholar] [CrossRef]
  43. Baarholm, G.S.; Haver, S.; Økland, O.D. Combining contours of significant wave height and peak period with platform response distributions for predicting design response. Mar. Struct. 2010, 23, 147–163. [Google Scholar] [CrossRef]
  44. Yang, X.; Chang, Q. Joint probability distribution of winds and waves from wave simulation of 20 years (1989–2008) in Bohai Bay. Water Sci. Eng. 2013, 6, 296–307. [Google Scholar]
  45. Li, L.; Gao, Z.; Moan, T. Joint environmental data at five European offshore sites for design of combined wind and wave energy devices. In Proceedings of the 32nd International Conference on Ocean, Offshore and Arctic Engineering, OMAE2013-10156, Nantes, France, 9–14 June 2013. [Google Scholar]
  46. Konispoliatis, D.; Mavrakos, S. Hydrodynamic analysis of an array of interaction free-floating oscillating water column devices. Ocean Eng. 2016, 111, 179–197. [Google Scholar] [CrossRef]
  47. Konispoliatis, D.; Mazarakos, T.; Mavrakos, S. Hydrodynamic analysis of three-unit arrays of floating annular oscillating-water-column wave energy converters. Appl. Ocean Res. 2016, 61, 42–64. [Google Scholar] [CrossRef]
  48. Mavrakos, S.A.; Koumoutsakos, P. Hydrodynamic interaction among vertical axisymmetric bodies restrained in waves. Appl. Ocean Res. 1987, 9, 128–140. [Google Scholar] [CrossRef]
  49. Mavrakos, S. Hydrodynamic coefficients for groups of interacting vertical axisymmetric bodies. Ocean Eng. 1991, 18, 485–515. [Google Scholar] [CrossRef]
  50. Konispoliatis, D.; Mavrakos, S.; Soukissian, T. Efficiency of an array of oscillating water column devices for wave energy absorption in the Mediterranean Sea. In Proceedings of the 12th Panhellenic Symposium of Oceanography and Fisheries, Corfu, Greece, 30 May–3 June 2018. [Google Scholar]
  51. Konispoliatis, D.; Mazarakos, T.; Soukissian, T.; Mavrakos, S. REFOS: A multi-purpose floating platform suitable for wind and wave energy exploitation. In Proceedings of the 11th International Conference on Deregulated Electricity Market Issues in South Eastern Europe (DEMSEE 2018), Nicosia, Cyprus, 20–21 September 2018. [Google Scholar]
  52. Riziotis, V.A.; Voutsinas, S.G. GAST: A general aero-dynamic and structural prediction tool for wind turbines. In Proceedings of the European Wind Energy Conference, Dublín, Ireland, 6–9 October 1997. [Google Scholar]
  53. Manolas, D.I.; Riziotis, V.A.; Voutsinas, S.G. Assessing the importance of geometric non-linear effects in the prediction of wind turbine blade loads. Comput. Nonlinear Dyn. J. 2014, 10, 041008. [Google Scholar] [CrossRef]
  54. Coleman, R.P. Theory of Self-Excited Mechanical Oscillations of Hinged Rotor Blades; Technical Report NACA-WR-L-308, Langley Research Center. 1943. Available online: http://ntrs.nasa.gov (accessed on 2 April 2021).
  55. Senjanovic, I.; Hadzic, N.; Tomic, M. On the linear stiffness of tension leg platforms. Sustain. Mar. Trans. Exp. Sea Res. 2011, 108, 1081–1088. [Google Scholar]
  56. Mavrakos, S. User’s Manual for the Software HAMVAB; School of Naval Architecture and Marine Engineering, Laboratory for Floating Structures and Mooring Systems: Athens, Greece, 1995. [Google Scholar]
  57. Moñino, A.; Medina-López, E.; Clavero, M.; Benslimane, S. Numerical simulation of a simple OWC problem for turbine performance. Int. J. Mar. Energy 2017, 20, 17–32. [Google Scholar] [CrossRef]
  58. Falcão, A.F.; Henriques, J.C. Model-prototype similarity of oscillating water column wave energy converters. Int. J. Mar. Energy 2014, 6, 18–34. [Google Scholar] [CrossRef]
  59. Falcão, A.F.; Justino, P.A.P. OWC wave energy devices with air flow control. Ocean Eng. 1999, 26, 1275–1295. [Google Scholar] [CrossRef]
  60. Moñino, A.; Quiros, C.; Mengibar, F.; Medina-Lopez, E.; Clavero, M. Thermodynamics of the OWC chamber: Experimental turbine performance under stationary flow. Renew. Energy 2020, 155, 317–329. [Google Scholar] [CrossRef]
  61. Howe, D.; Nader, J.R.; Macfarlane, G. Experimental analysis of the effects of air compressibility in OWC model testing. In Proceedings of the 4th Asian wave and tidal energy conference, Taipei, Taiwan, 9–13 September 2018. [Google Scholar]
Figure 1. Renewable Energy Multi-Purpose Floating Offshore System (REFOS) structure suitable for offshore wind and wave energy exploitation: above (left side) and below (right side) sea water level (SWL).
Energies 14 03126 g001
Figure 2. Three-dimensional (3D) representation of the REFOS floater: (a) without the oscillating water column (OWC) domes; (b) with the conical OWC domes.
Energies 14 03126 g002
Figure 3. Examined installation locations (yellow stars) for the REFOS platform: (a) two locations L1, L2 in the Mediterranean Sea; (b) one location L3 in the North Sea (from Google Earth).
Energies 14 03126 g003
Figure 4. The 50-year contour surfaces of significant wave height and spectral peak period for different values of wind speed for location L1 (upper row), L2 (middle row) and L3 (lower row).
Energies 14 03126 g004aEnergies 14 03126 g004b
Figure 5. Definition of the aerodynamic set-up.
Energies 14 03126 g005
Figure 6. Two-dimensional (2-D) general views of the REFOS 1/60 model: (a) side view, (b) top view. All dimensions in mm.
Energies 14 03126 g006
Figure 7. The REFOS 1/60 model: (a) base of the TLP mooring system; (b) platform buoyant cylinders and OWC walls; (c) model in the experimental tank; (d) OWC domes outside the tank.
Energies 14 03126 g007aEnergies 14 03126 g007b
Figure 8. Performance of the porous diaphragms during wave tank experiments (model scale).
Energies 14 03126 g008
Figure 9. Instrumentation of the REFOS scaled model: (a) 6-dof load cell at the base of the tower; (b) air pipes for OWC pressure measurements; (c) optical targets of the motion capture system.
Energies 14 03126 g009
Figure 10. REFOS surge response amplitude operators’ (RAOs) comparisons for the: (a) Mediterranean and (b) North Sea installation locations.
Energies 14 03126 g010
Figure 11. REFOS mooring tensions comparisons: (a) forward tendon for the Mediterranean Sea location; (b) backward right tendon for the Mediterranean Sea location; (c) backward left tendon for the Mediterranean Sea location; (d) forward tendon for the North Sea location; (e) backward right tendon for the North Sea location; (f) backward left tendon for the North Sea location.
Energies 14 03126 g011
Figure 12. REFOS air pressure comparisons: (a) forward OWC for the Mediterranean Sea location; (b) backward left OWC for the Mediterranean Sea location; (c) backward right OWC for the Mediterranean Sea location; (d) forward OWC for the North Sea location; (e) backward left OWC for the North Sea location; (f) backward right OWC for the North Sea location.
Energies 14 03126 g012
Figure 13. REFOS surge acceleration comparisons for the Mediterranean installation location.
Energies 14 03126 g013
Figure 14. REFOS shear forces (a) and bending moments (b) comparisons for the North Sea installation location.
Energies 14 03126 g014
Figure 15. REFOS mooring dynamic tensions comparisons for operating conditions at the North Sea location: (a) forward tendon; (b) backward left tendon; (c) backward right tendon.
Energies 14 03126 g015
Figure 16. REFOS mooring dynamic tensions comparisons for extreme conditions at the North Sea location: (a) forward tendon; (b) backward left tendon; (c) backward right tendon.
Energies 14 03126 g016
Table 1. Floating platform geometry.
Oscillating Water Column (OWC) Devices
Diameter of inner concentric cylindrical body14.00 m
Draught of inner concentric cylindrical body20.00 m
Oscillating chamber thickness of each chamber1.500 m
Outer radius of the oscillating chamber of each device15.50 m
Oscillating chamber’s draught8.000 m
Spacing between columns (distance from the center of the bodies)50.00 m
Elevation of offset columns above SWL10.00 m
Central cylindrical body supporting WT
Diameter of main column12.00 m
Draught of main column20.00 m
Elevation of main column (tower base) above SWL10.00 m
Depth of platform base below SWL (total draught)20.00 m
Diameter of pontoons and cross braces1.600 m
Table 2. Mass distribution.
Mass of the Floater
Mass of each oscillating chamber (including ballast)1140 t
Mass of each concentric cylindrical body828 t
Mass of the central cylindrical body (including ballast)1218.5 t
Mass of braces408.6 t
Total mass of the floater7531.1 t
Mass of the WT
Mass of the 10 MW WT1100.0 t
Mass of the air turbine
Mass of each air turbine (including generator)3.3 t
Mass of the mooring system
Mass of each mooring tendon in water (3 tendon pipes)192 t
Total mass of the REFOS platform9550 t
Center of mass (CM) location below SWL3.180 m
Center of buoyancy below SWL8.651 m
Platform roll inertia about CM6.385 × 106 tm2
Platform pitch inertia about CM6.385 × 106 tm2
Platform yaw inertia about CM1.170 × 107 tm2
Table 3. Mooring system properties.
Number of tendons3
Depth to anchors below SWL (Water depth)180 m
Depth to fairleads below SWL20 m
Mooring line length160 m
Tendon outer diameter (OD)1.2192 m
Tendon wall0.0422 m
Equivalent mooring line mass density104 kg/m
Equivalent mooring line mass in water888.6 N/m
Mooring line stiffness kxx of each tendon104.0 kN/m
Mooring line stiffness kzz of each tendon173,533 kN/m
Pretension of each tendon18,838 kN
Yeung’s modulus of elasticity200 GPa
Yield stress482.5 MPa
Table 4. Statistical characteristics of wind and wave time series at the examined locations.
Location L1
N m m i n m a x s C V S k K u
H s [m]90,5840.9480.0615.3870.60263.4531.5483.499
T p [s]90,5845.4662.4311.1761.10620.2350.5370.464
U w [m/s]90,5846.495218.6242.66140.9710.5340.076
Location L2
N m m i n m a x s C V S k K u
H s [m]90,5840.8640.0246.490.71582.8091.8354.7
T p [s]90,5845.372.4311.0661.43826.8470.571−0.051
U w [m/s]90,5845.834220.1333.0151.5910.7910.194
Location L3
N m m i n m a x s C V S k K u
H s [m]90,5841.9990.1759.7741.18459.2371.2922.126
T p [s]90,5848.4173.4151.8752.01723.9620.5080.013
U w [m/s]90,5847.856223.1963.58945.680.465−0.333
Table 5. Environmental conditions on the 50-year contour surfaces with maximum U w or maximum H s .
ConditionParameterL1L2L3
Conditions with maximum U w U w (m/s)18.8221.8025.44
H s (m)5.447.4610.34
T p (s)10.2011.8813.56
Conditions with maximum H s U w (m/s)18.7621.5225.36
H s (m)5.487.5010.36
T p (s)10.2811.9013.56
Table 6. REFOS stiffness coefficients,   C i , j T , in [kN/m; kN.m].
312000−62400
03120624000
00530,573.4000
0624002.214 × 10800
−62400002.214 × 1080
00000259,992.4
Publisher’s Note: MDPI stays neutral with regard to jurisdictional claims in published maps and institutional affiliations.

