Article

Application of System Dynamic Modelling for Evaluation of CO2 Emissions and Expenditure for Captive Power Generation Scenarios in the Cement Industry

Department of Operations Research and Business Intelligence, Wroclaw University of Science and Technology, 50-370 Wroclaw, Poland
*
Author to whom correspondence should be addressed.
Energies 2021, 14(11), 3115; https://doi.org/10.3390/en14113115
Submission received: 8 May 2021 / Revised: 24 May 2021 / Accepted: 25 May 2021 / Published: 26 May 2021

Abstract

:
Cement manufacturing is an emission-intensive process. The cement industry is responsible for 8% of the global CO2 emissions, and produces a ton of cement uses up to 102 kWh of electrical energy, leading to a significant amount of indirect emissions depending on the emission intensity of the electricity source. Captive power generation can be potentially utilised as a mitigation approach to reduce emissions and as well as expenditure on electricity tariffs. In this study, a system dynamic simulation model is built to evaluate the impact of captive power generation on a cement plant’s net emissions and expenditure through electricity use, under different scenarios for carbon-tax, grid emission factor, and electricity tariffs. The model is then utilised to simulate a reference plant under realistic scenarios designed based on the conditions in Germany and United Arab Emirates. Furthermore, the model is utilised to calculate the payback period of investments on captive power plants under different carbon tax scenarios. The study concludes that a carbon tax policy on emissions through electricity utilisation could have an impact on incentivising the use of captive power generation and would lead to fewer emissions and expenditure during the cement plant’s lifetime.

Graphical Abstract

1. Introduction

Cement manufacturing is an energy intensive industry, which on average generated 0.61 tons of CO2 emissions for every ton of cement produced globally in 2018 [1]. While the majority of these emissions are generated during the chemical process of calcination when producing clinker, the primary constituent of cement—electricity utilisation—still accounts for sizeable amount of net plant emissions [2]. As per the self-reporting data published by the Global Cement and Concrete Association (GCCA), production of a ton of cement consumes 102 kWh of electrical energy. The resultant emissions from the electrical energy consumption depends on the CO2 emission intensity per unit of electricity generation in the regional grid system and as well as captive power generation if applicable. The global cement production was 4.1 Gt in 2019, which resulted in approximately 2.6 gigatonnes of CO2 emissions (GtCO2), out of which 0.221 GtCO2 emissions are through electricity utilisation [3]. Currently, multiple methods of captive power generation are employed in the cement industry, both renewable and non-renewable, including coal and natural-gas thermal power plants, diesel generators, the solar photovoltaic (PV) system, wind turbines and waste heat recovery (WHR). Captive power generation projects are often capital-intensive, and the decision-making is usually tied to the reliability of existing supply grid and the project payback period which is dependent on the electricity prices and applicable CO2 emission policies such as carbon tax. As 193 countries have pledged to reduce CO2 emissions as part of the Paris Climate Accord, the global cement production has come into focus as one of the most emission intensive industry responsible for 8% of the global CO2 emissions [4]. The World Business Council for Sustainable Development’s Cement Sustainability Initiative, which is a collaboration of multiple cement plants from around the world, has pledged to reduce 20–25% CO2 emissions (approximately 1 GtCO2) from the cement industry by 2030 compared to “business as usual” scenario [5]. For achieving the goal, multiple strategies are being currently explored in the cement industry such as clinker substitution, fuel substitution, carbon capture, process efficiency improvements and captive power generation. This study specifically emphasises the expenditure and emissions related to utilisation of captive power generation in cement plants.
System dynamics (SD) is a simulation modelling technique that is being increasingly utilised to study the long-term impact of policy on holistic systems with complex interconnections and cause-and-effect relationships among its constituent parameters. SD supports a quantitative approach to problem solving, and aggregating the resultant data into specific level of details would allow evaluation of aspects relevant to the stakeholders and possibly hasten the process of decision-making. Various studies have previously utilised SD approach for evaluating CO2 emissions in the cement industry such as, Nehdi et al. [6], wherein the authors studied the impact of replacing clinker with fly-ash on the plant emissions. Anasari et al. [7] analysed the carbon emissions under different policy and energy efficiency scenarios in the Iranian cement industry, and Proaño et al. [8] evaluated the use of indirect carbon emissions on the cement plant economics and emissions. Anand et al. [9] and Jokar et al. [10] estimated emissions from the regional cement industry under different policy and mitigation scenarios for India and Iran, respectively. However, the majority of the existing studies have simulated the impact of policy and mitigation at a macro level for the entire cement industry, which lacks flexibility as a decision-making input for the industry stakeholders. Moreover, these studies also ignored the financial implications of the policies, which would have assisted the stakeholders in determining the economic viability of mitigation projects under different scenarios [11]. Among the SD studies that have featured captive power generation in the cement industry, none of them have explicitly modelled the captive power generation system and rely on accommodating captive power generation techniques as a scenario. Studying the impact of captive power generation at a plant level while emphasising the details relevant to the stakeholders in the industry would facilitate informed decision-making and possibly better long-term strategic policy-planning.
SD can be effectively utilised to study the magnitude of causal relationships over time between key elements in the system such as grid emission factor—net emissions through electricity use, and grid electricity tariffs—and net expenditure on electricity use, under different policy scenarios such as carbon taxation and renewable energy subsidies. Furthermore, model boundaries can be suitably extended in the future to include more CO2 emission driving factors and feedback relationships outside of electricity utilisation in a cement plant. Therefore, the primary objective of the current study is to present a SD model specifically for captive power generation in the cement industry and analyse the impact of electricity tariffs and carbon-tax on plant emissions and expenditure related to electricity use under different policy scenarios. The study utilises real-world exemplary data curated based on historical trends and forecasts to simulate the impact of carbon tax policy and shifting electricity tariffs on a reference cement plant located in the geographical regions of United Arab Emirates (UAE) and Germany (DE). Additionally, as captive power plants are capital intensive undertakings, the payback period of the capital expenditure (CAPEX), i.e., the funds spent on setting up the power generation, is estimated for the reference plant under different carbon taxation scenarios.

2. Methodology

Among the various captive power generation techniques currently utilised in the cement industry, coal, natural gas, WHR, and solar PV are chosen for the purpose of this study based on their suitability as industrial on-site power generation options for the cement industry [12].

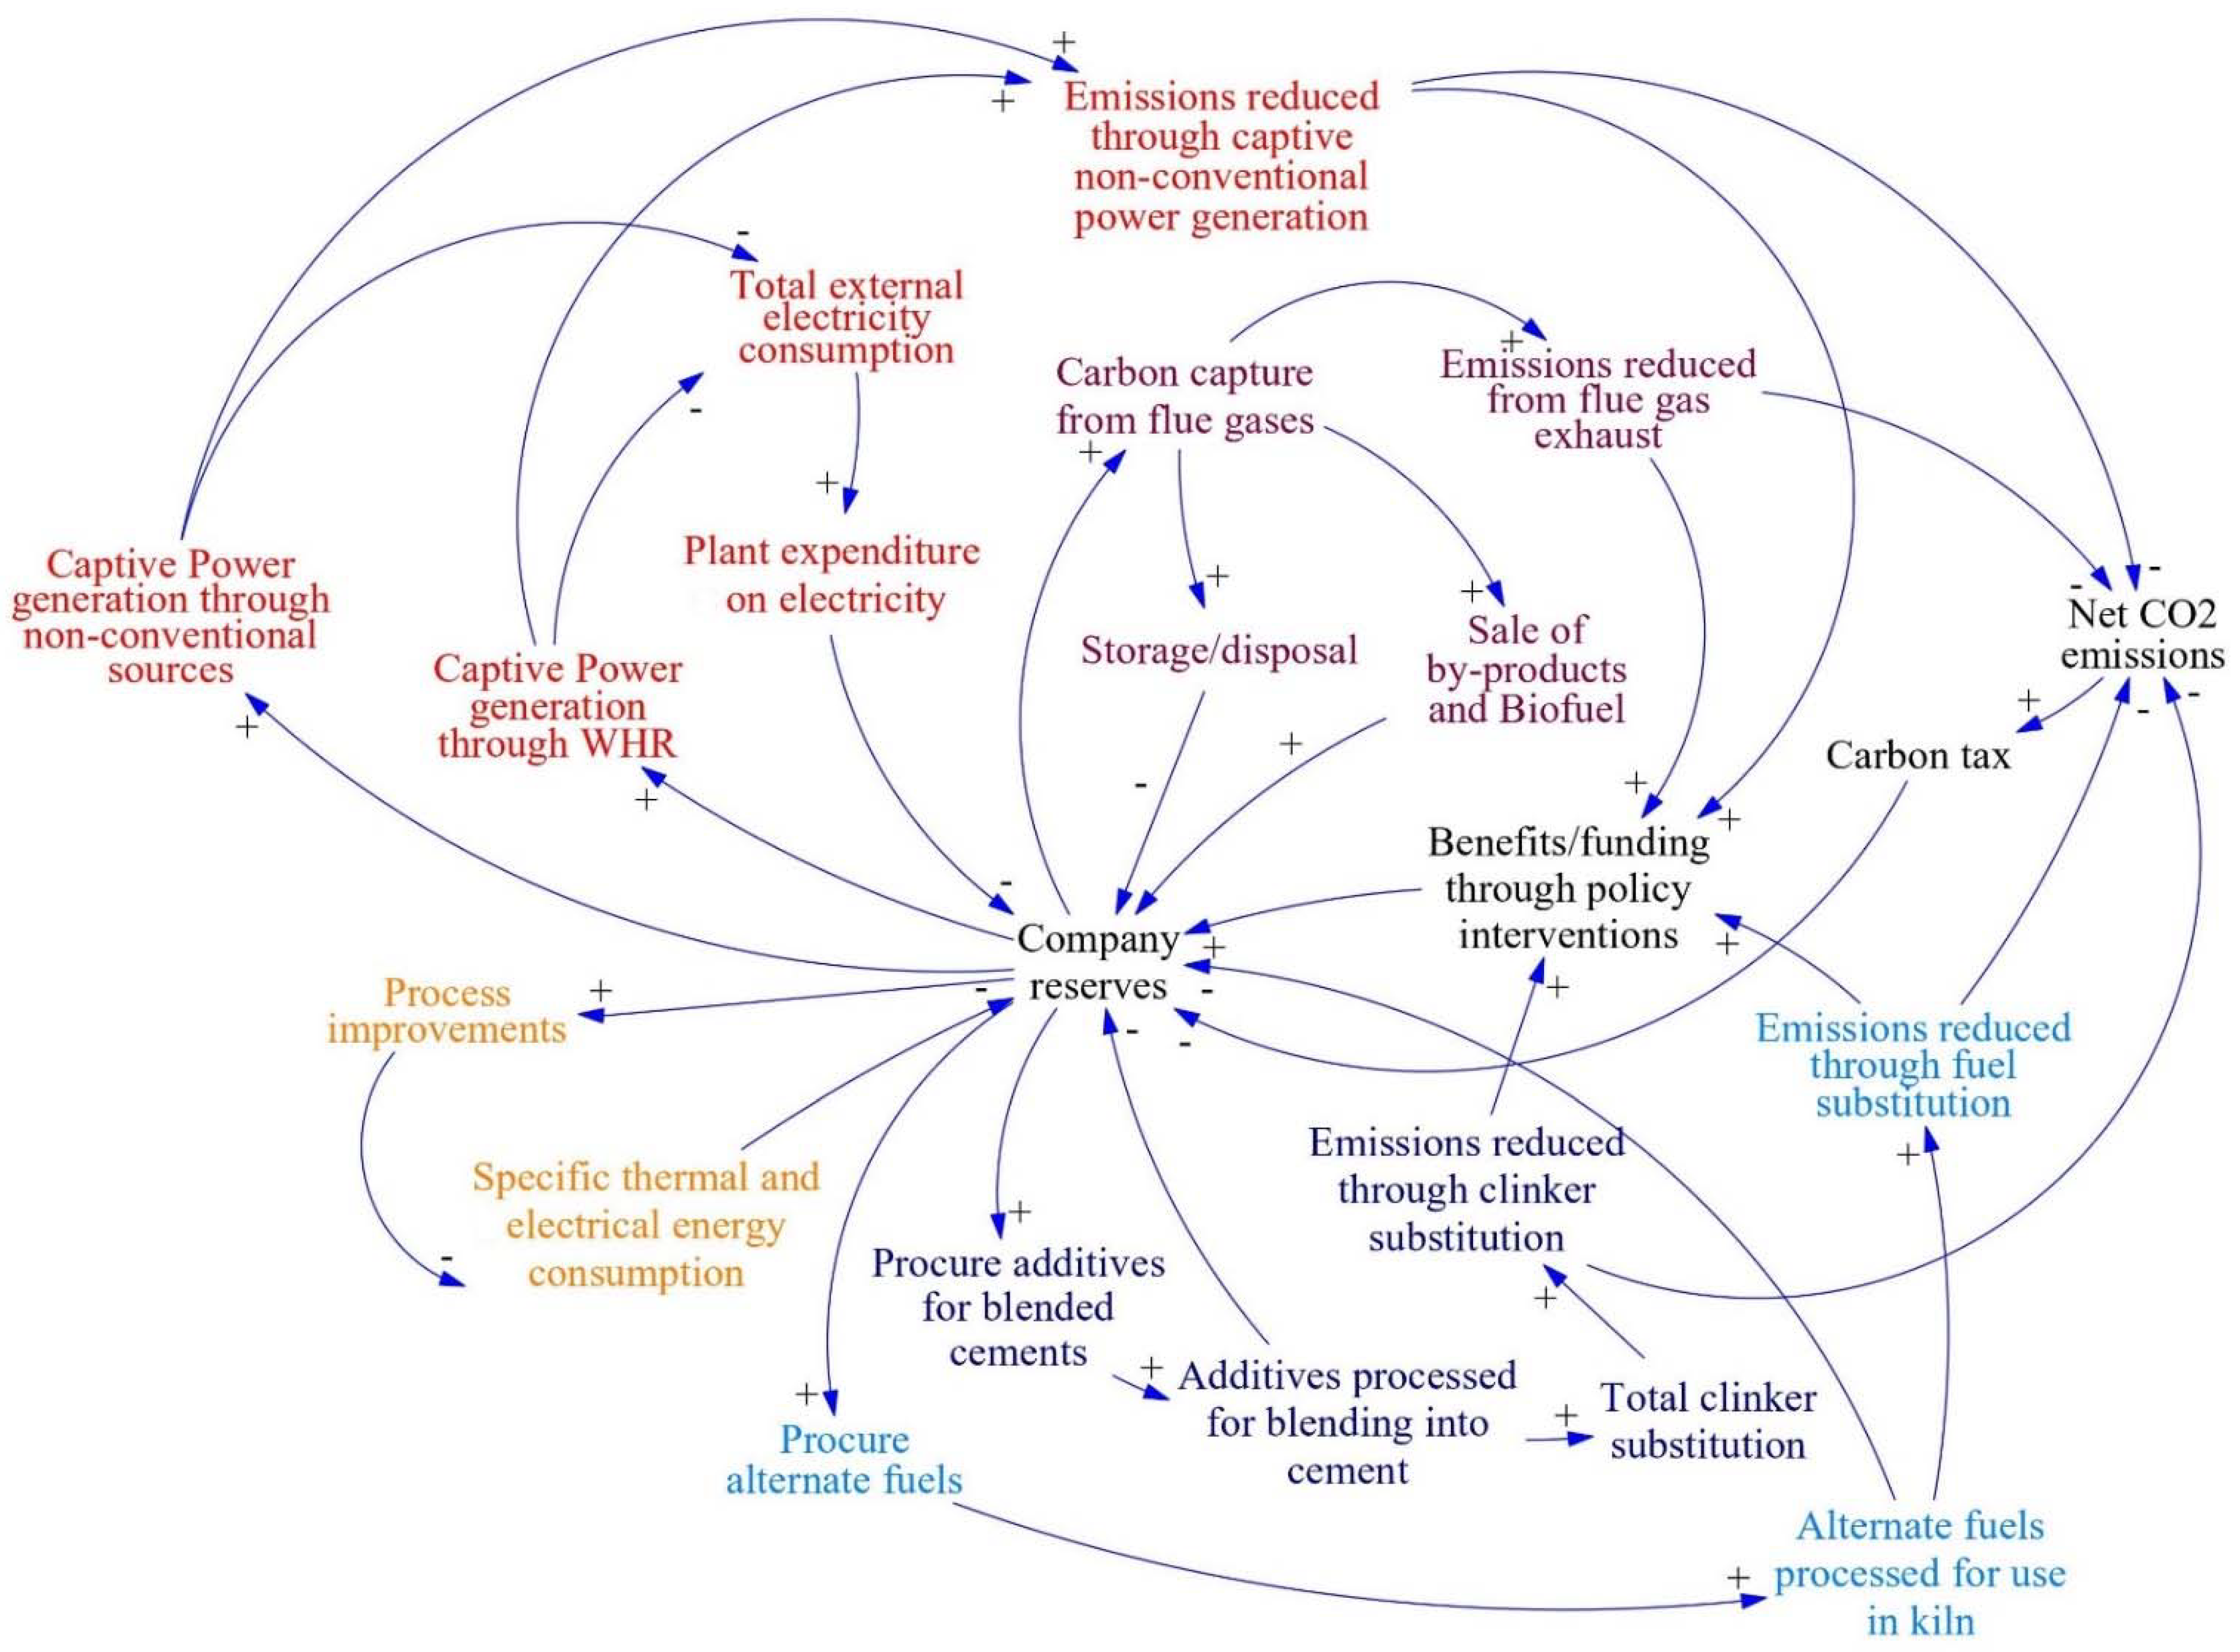
2.1. Model Conceptualisation

Captive power generation refers to the electricity generated exclusively for use within the plant, either through conventional sources like natural gas or non-conventional sources such as WHR and solar PV systems. Captive power generation allows the cement plant to purchase fewer units of electricity from the regional grid, which could lead to considerable reduction in CO2 emissions and as well as plant expenditure on electricity depending on the grid emission factor and electricity unit prices, respectively.
The causal relationships between the primary elements in the proposed system are represented in form of a causal loop diagram (CLD) in Figure 1. The cement plant will be able to commission captive power plants based on the available company reserves. The captive power generation reduces the amount of electricity that needs to be purchased from the grid, and consequently the amount of CO2 emissions under the assumption that the grid emission factor is not negligible. Captive power generation through conventional sources such as coal and natural gas will contribute to the plant’s net CO2 emissions (it would still potentially result in a decrease in emissions if the regional grid is mostly powered through coal-based thermal power plants, i.e., higher emission factor than natural gas). Captive power plants require significant capital expenditure and will subsequently result in higher plant operational costs through maintenance, which could potentially limit the company’s reserves from implementing other mitigation strategies and even captive power plant. However, the potential savings in electricity expenditure could offset the operational and maintenance costs. The changes in net plant emissions will influence the company reserves through changes in the amount of carbon tax. The model will also be able to incorporate subsidies from governmental policies for captive renewable power generation and utilisation within the cement plant, which in turn could bolster the available company reserves.

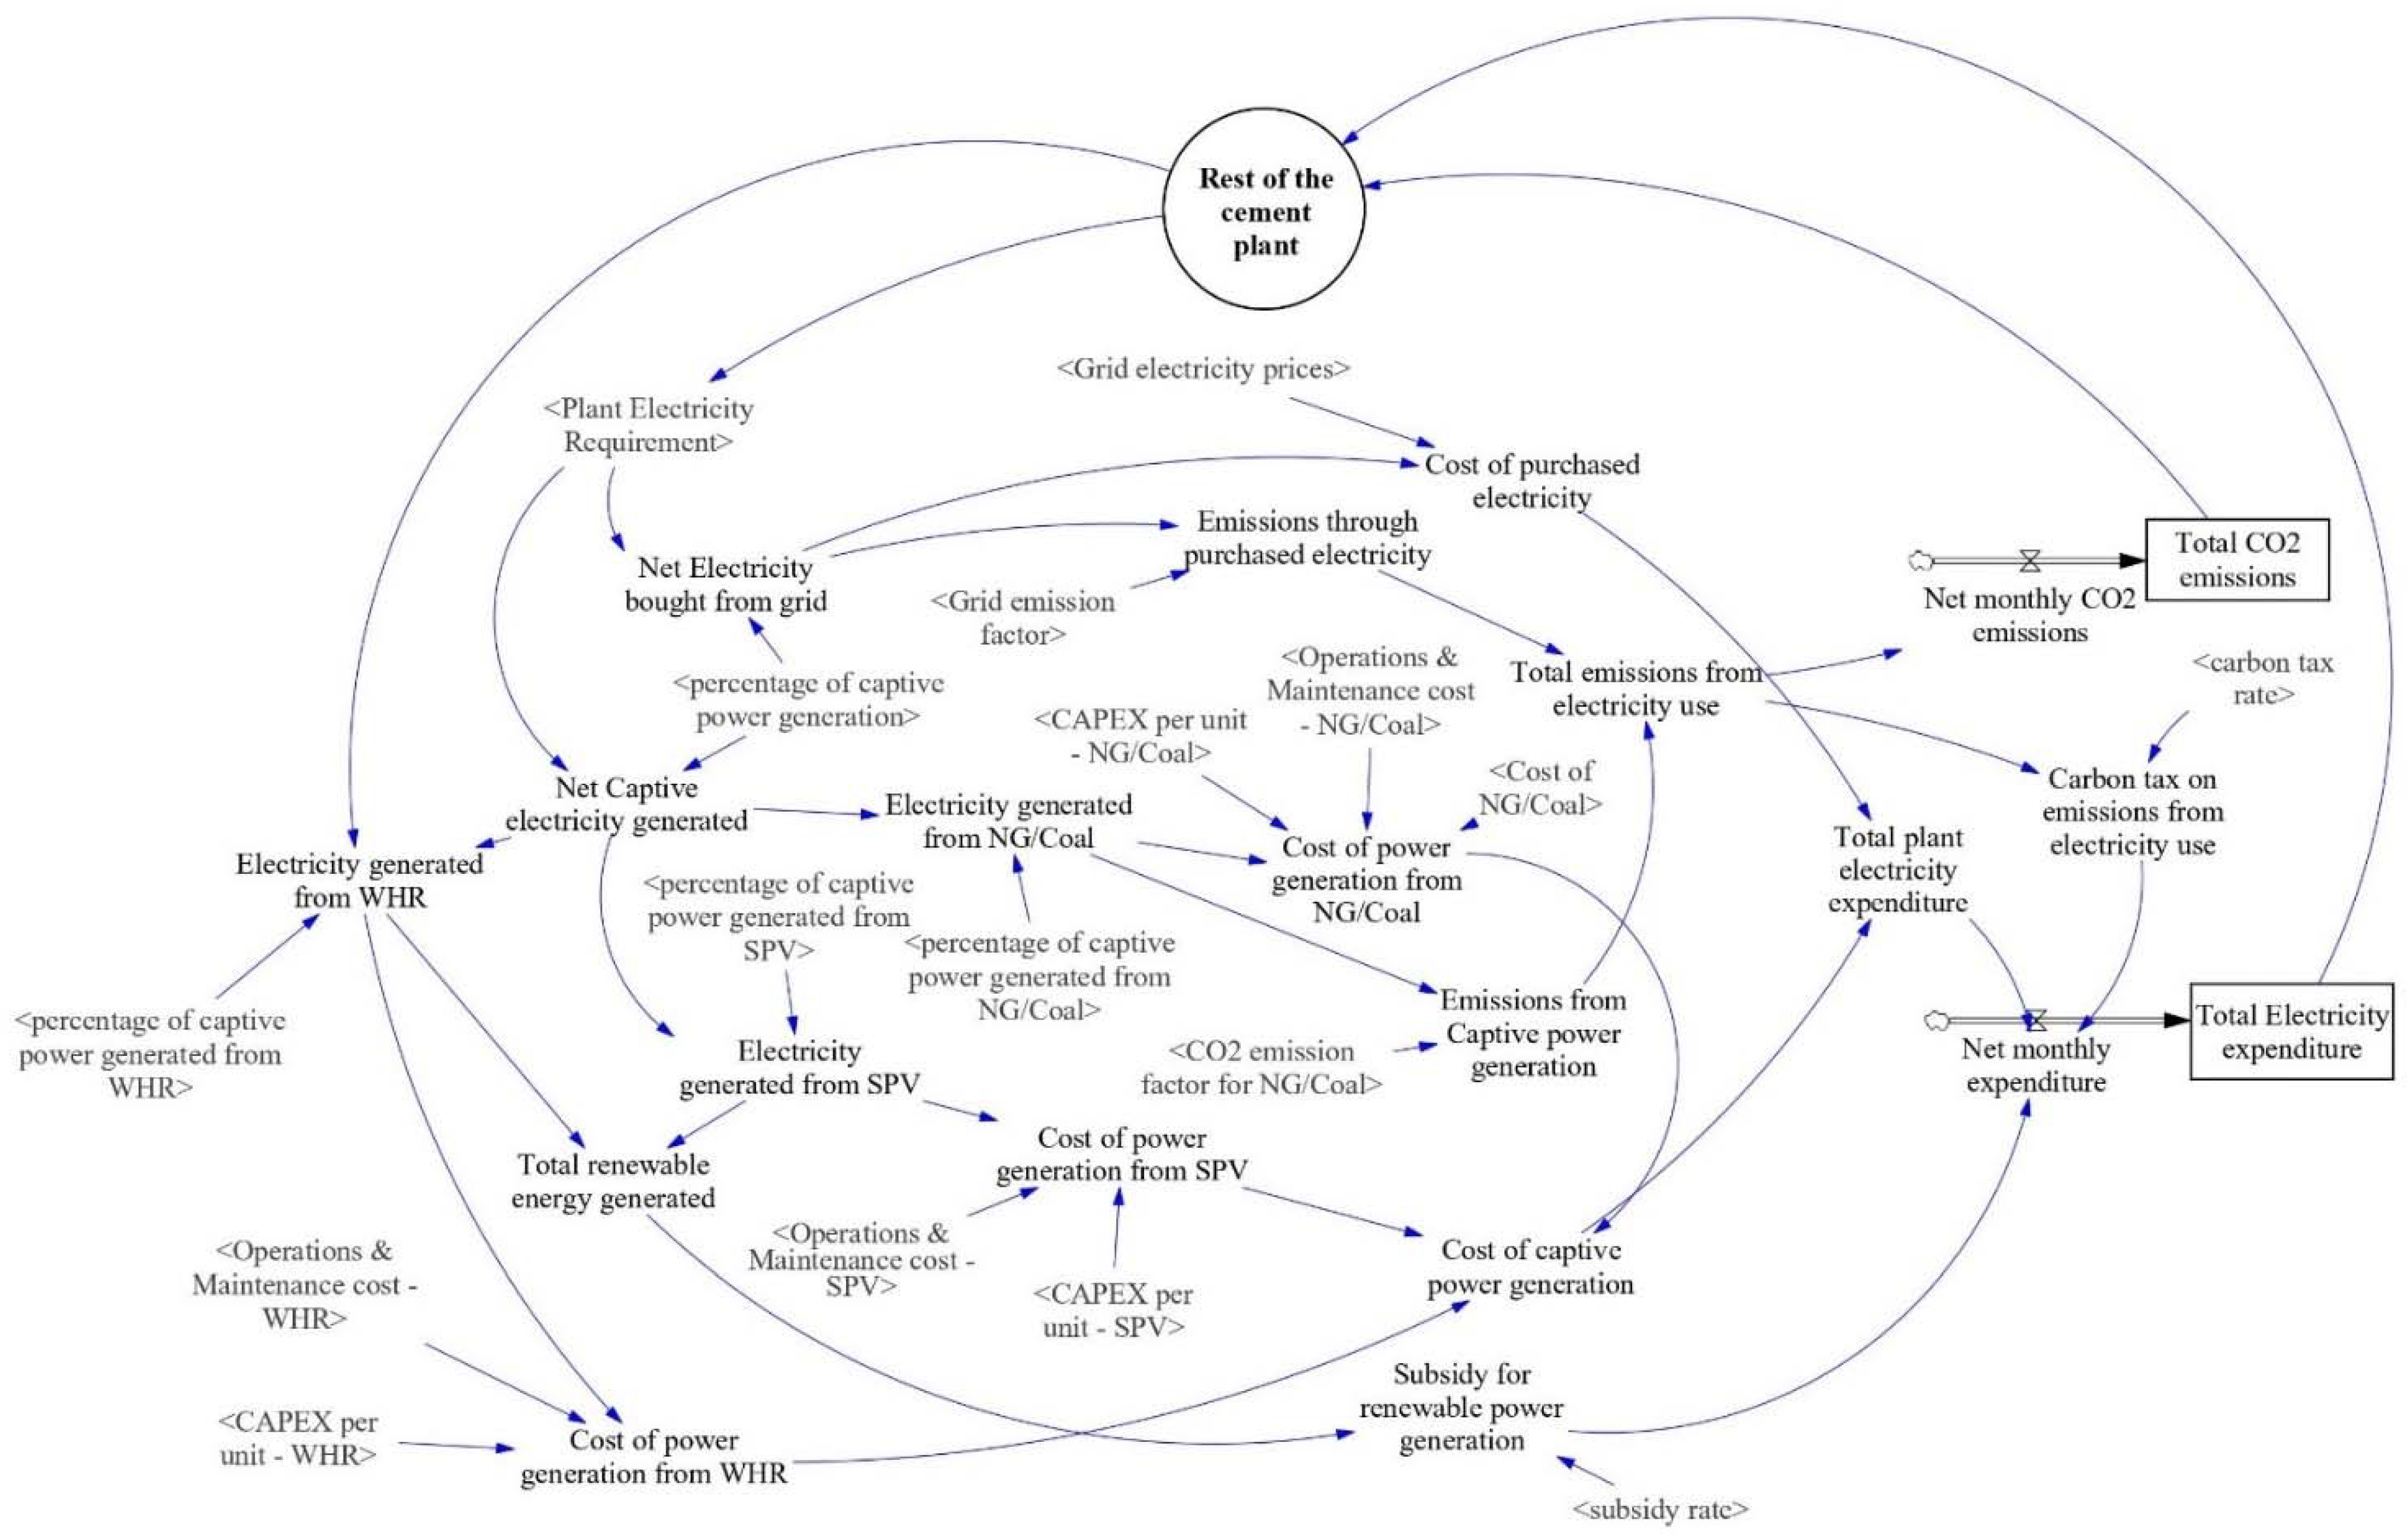
2.2. Model Construction

The proposed concept is expanded and realised as a deterministic model, with Figure 2 showcasing the structure through stock-and-flow diagram, which represents the various information flows within the model. The various elements featured in the model are described in Table 1.
The total CO2 emissions (through electricity utilisation) and electricity expenditure are modelled as stocks that accumulate the values throughout the duration of the simulation. Input parameters are utilised as per requirement to simulate various policy scenarios for cement plants of different capacities and geographical regions. The plant electricity requirement is considered as a constant for the purpose of this model. The circle notation with the label “Rest of the cement plant” is used as a reserved space for expanding the model to include rest of the cement plant modules and more mitigation options in the future. The outputs from the stocks will be used to compute the emissions from the entire plant and the subsequent company reserves that influence the possibility of implementing mitigation options in other areas of the plant. When the model is expanded in the future, inputs from other parts of the plant will be used to compute the plant electricity requirement and as well as total heat availability for WHR power generation. CAPEX represents the initial capital investment required for setting up a particular captive plant and its value is only appended once into the plant expenditure during the simulation. For the purpose of this study, the time step for the simulation is chosen as 1 month.
The information flow at each time step in the model is as follows:
  • “Net electricity bought from the grid” and “Net captive electricity generated” is calculated based on the input parameters, plant electricity requirement and percentage of captive power generation.
  • Input parameter “<percentage of captive power generated from WHR>” is utilised to calculate the amount of “Net captive electricity generated” through WHR captive plant—“Electricity generated from WHR”. Similarly, input parameters, “<percentage of captive power generated from SPV>” and “<percentage of captive power generated from NG/Coal>” are used to calculate the amount of captive electricity that is generated from solar PV system and natural gas or coal captive thermal power plant.
  • The cost of power generation using WHR, solar PV, and coal or natural gas is calculated using the input parameters for respective CAPEX and operations and maintenance costs. For calculating the cost of power generation using coal and natural gas, an additional dataset containing the cost of fuel is utilised.
  • The combined cost of captive power generation from WHR, solar PV, and coal or natural gas is calculated in “Cost of captive power generation” and is later appended into “Total plant electricity expenditure”.
  • The combined amount of power generated using renewable sources, WHR and solar PV is stored in “Total renewable energy generated” and is further utilised for calculating the subsidy based on the input parameter “<subsidy rate>”.
  • Emissions from captive power generation, specifically from thermal coal or natural gas, or a mixture of carbon-based fuels, is calculated based on the input parameter, “<CO2 emission factor for NG/Coal>”.
  • The cost of purchased electricity and emissions through purchased electricity is calculated based on input datasets for grid electricity tariffs and grid emission factor respectively.
  • The emissions through purchased electricity is then appended to “Total emissions from electricity use”, which is utilised for calculating the carbon tax based on the input parameter “<carbon tax rate>”.
  • The calculated expenditure and emissions for each time step, i.e., a month, are then stored in their respective stocks using the flows “Net monthly CO2 emissions” and “Net monthly expenditure”.

2.3. Scenario Generation and Plant Assumptions

For the purpose of the simulation, a cement plant with a constant plant utilisation rate and production capacity of 4000 tons per day is considered for all the applicable scenarios. The plant electricity requirement is calculated accordingly, which would be 17,500 KW throughout the duration of the simulation. Based on industrial inputs for a cement plant with four-stage pre-heating system, the maximum amount of waste heat recovery power generation is estimated as 30% of the net plant electricity requirement.
All the scenarios are then simulated for two different geographical regions, UAE and DE, for the years 2021 to 2045. In case of DE, the historic trends for grid emission factor, grid electricity tariffs and carbon tax are assumed to be similar throughout the simulation period.
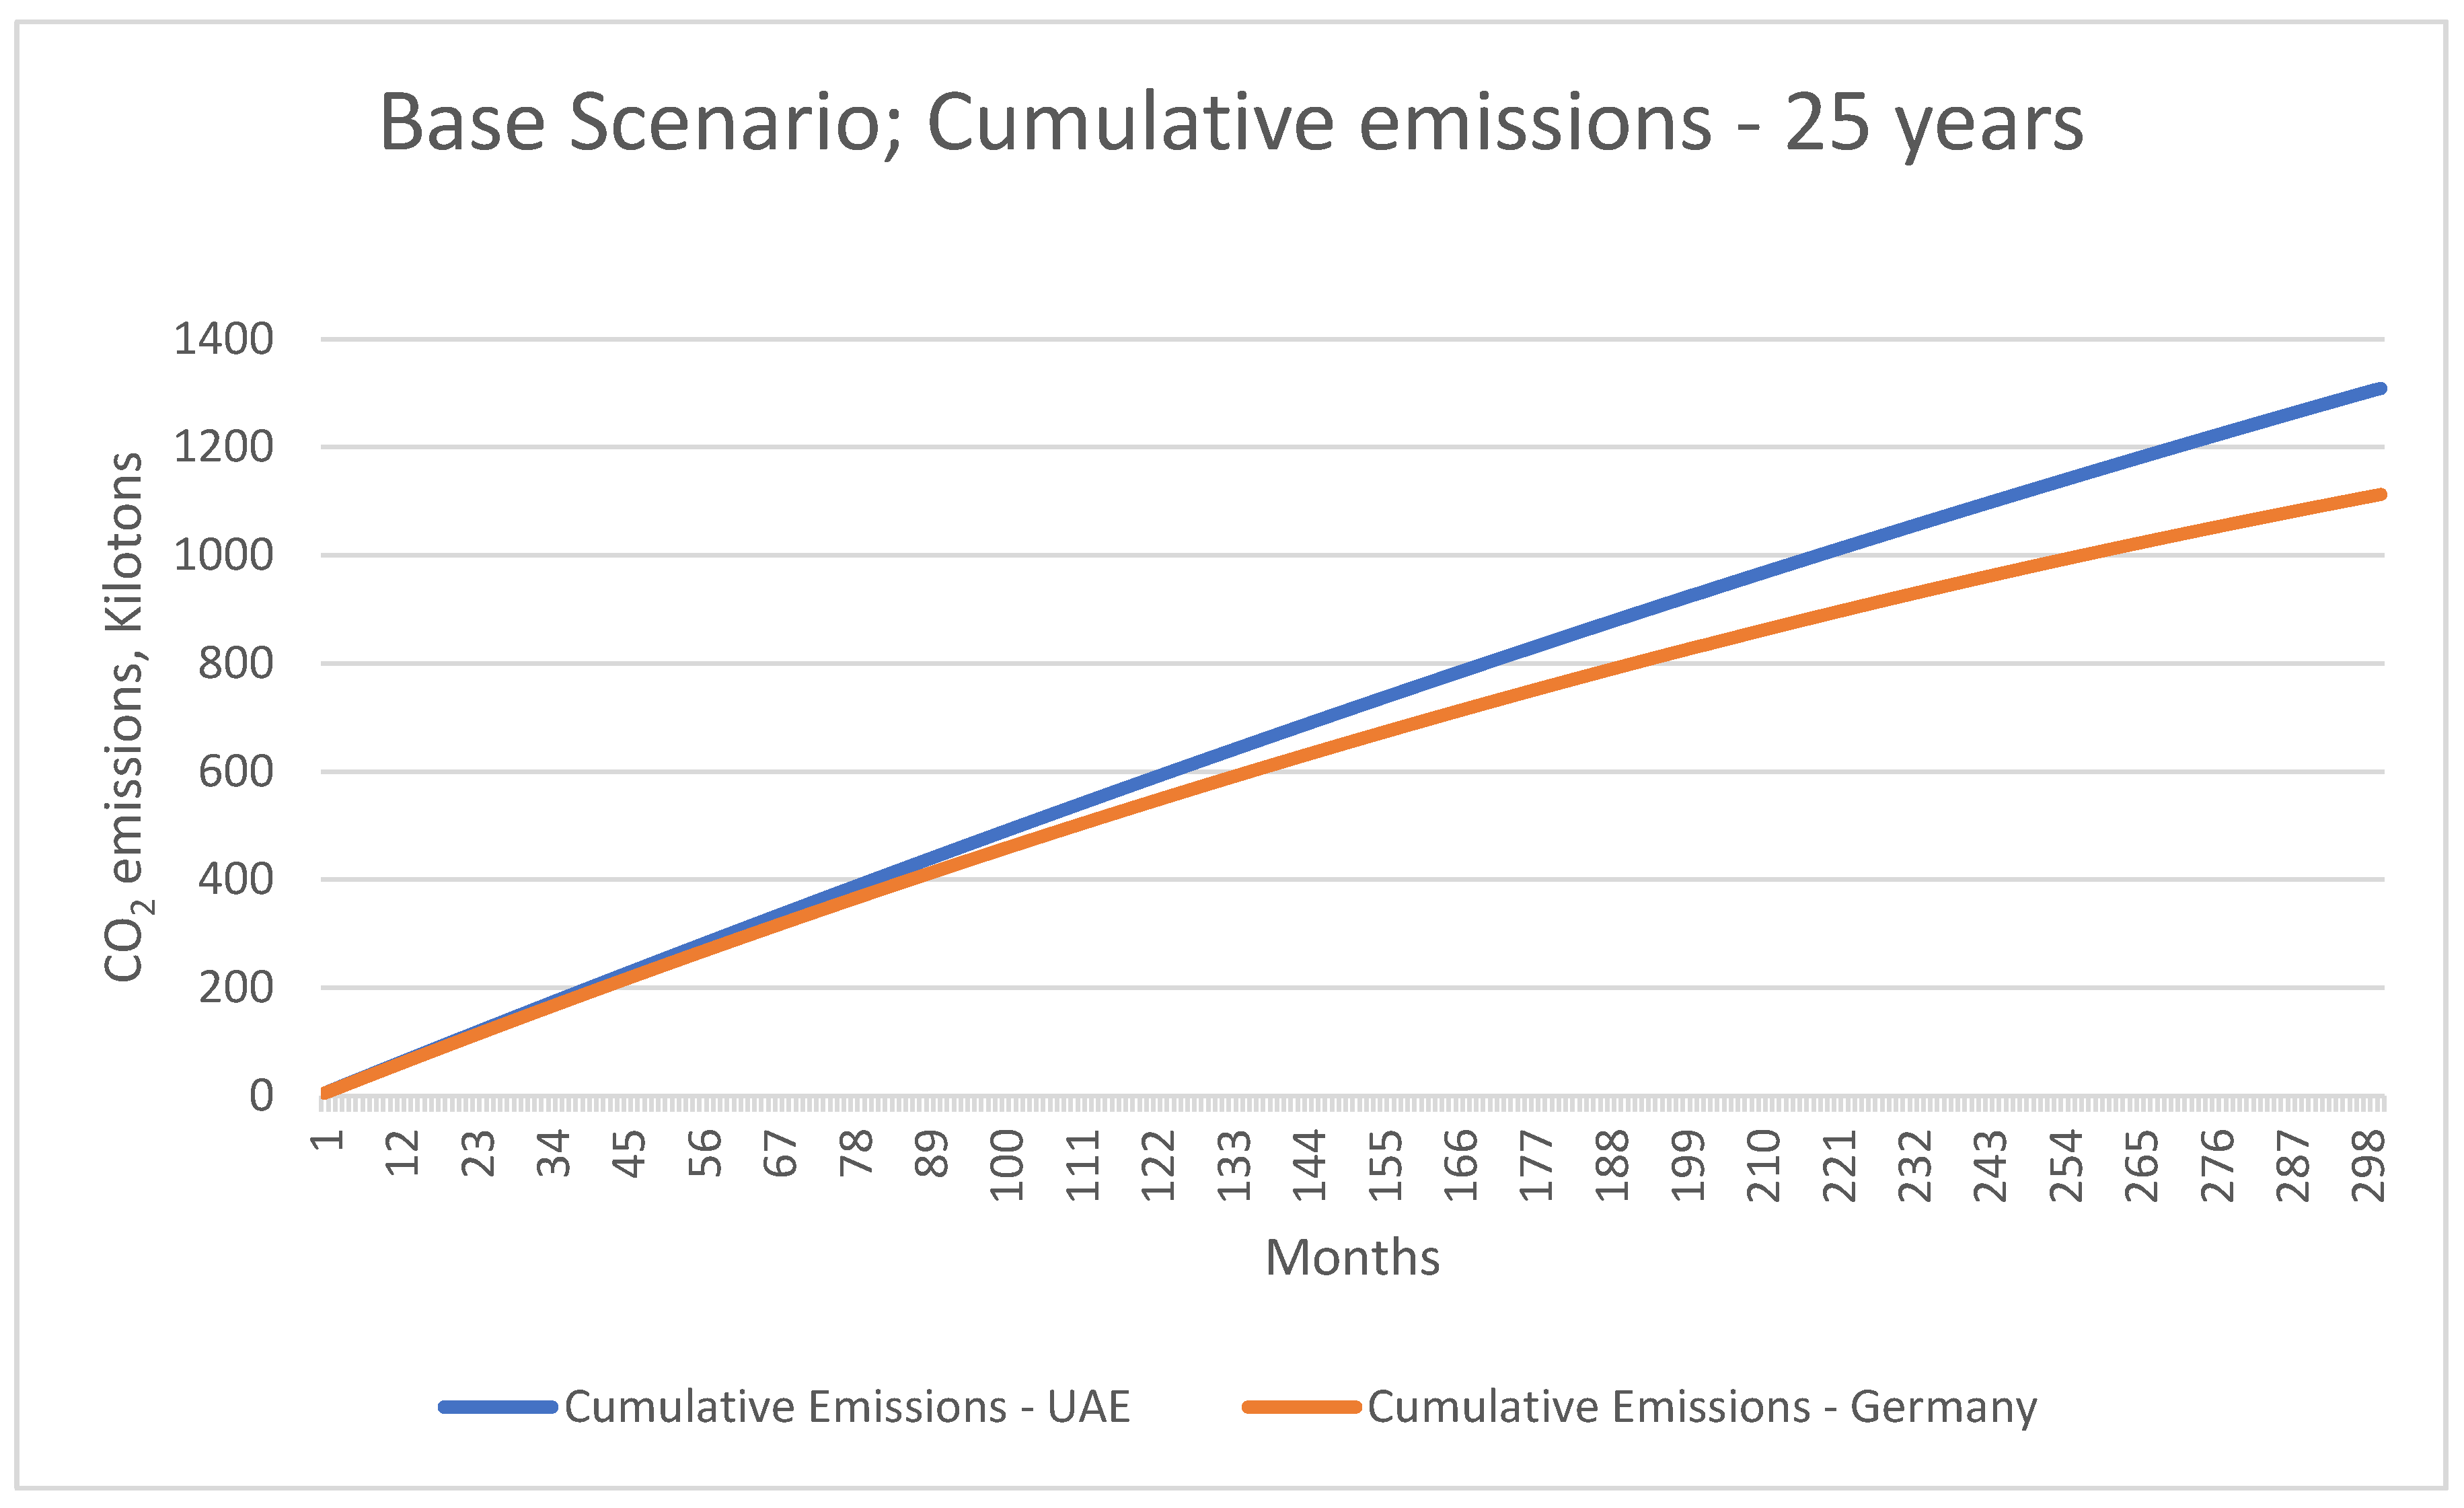
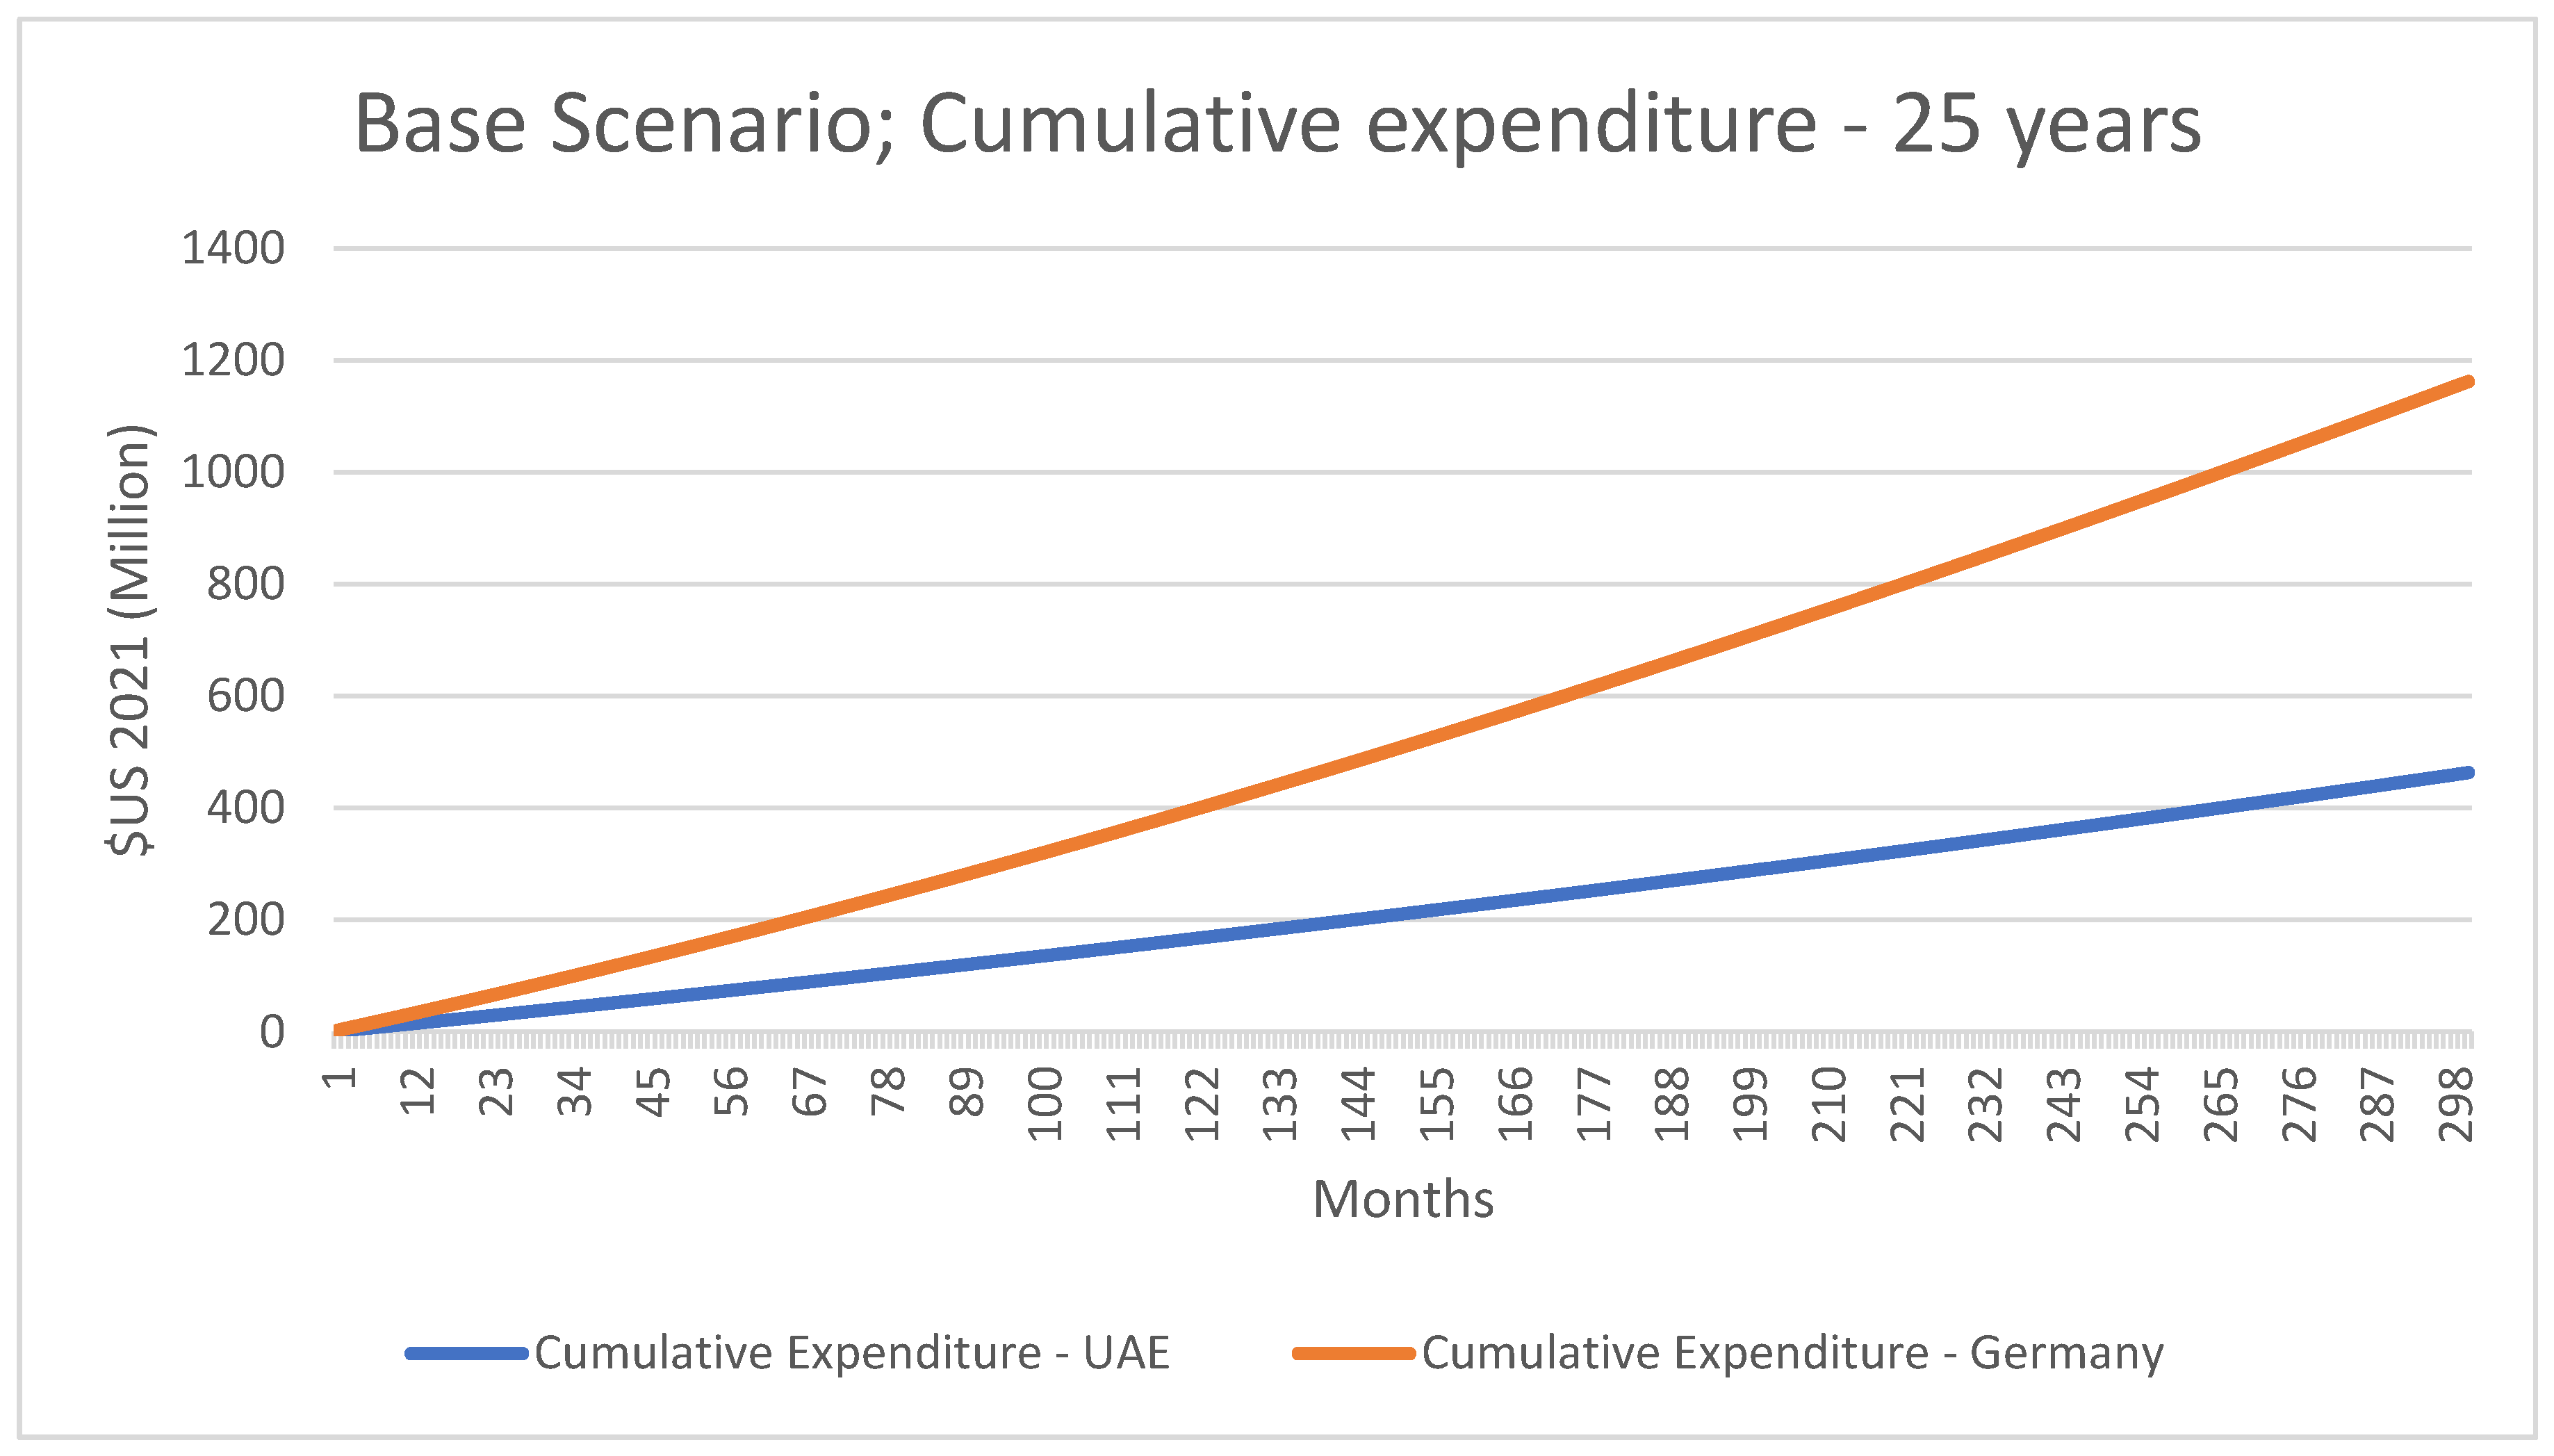
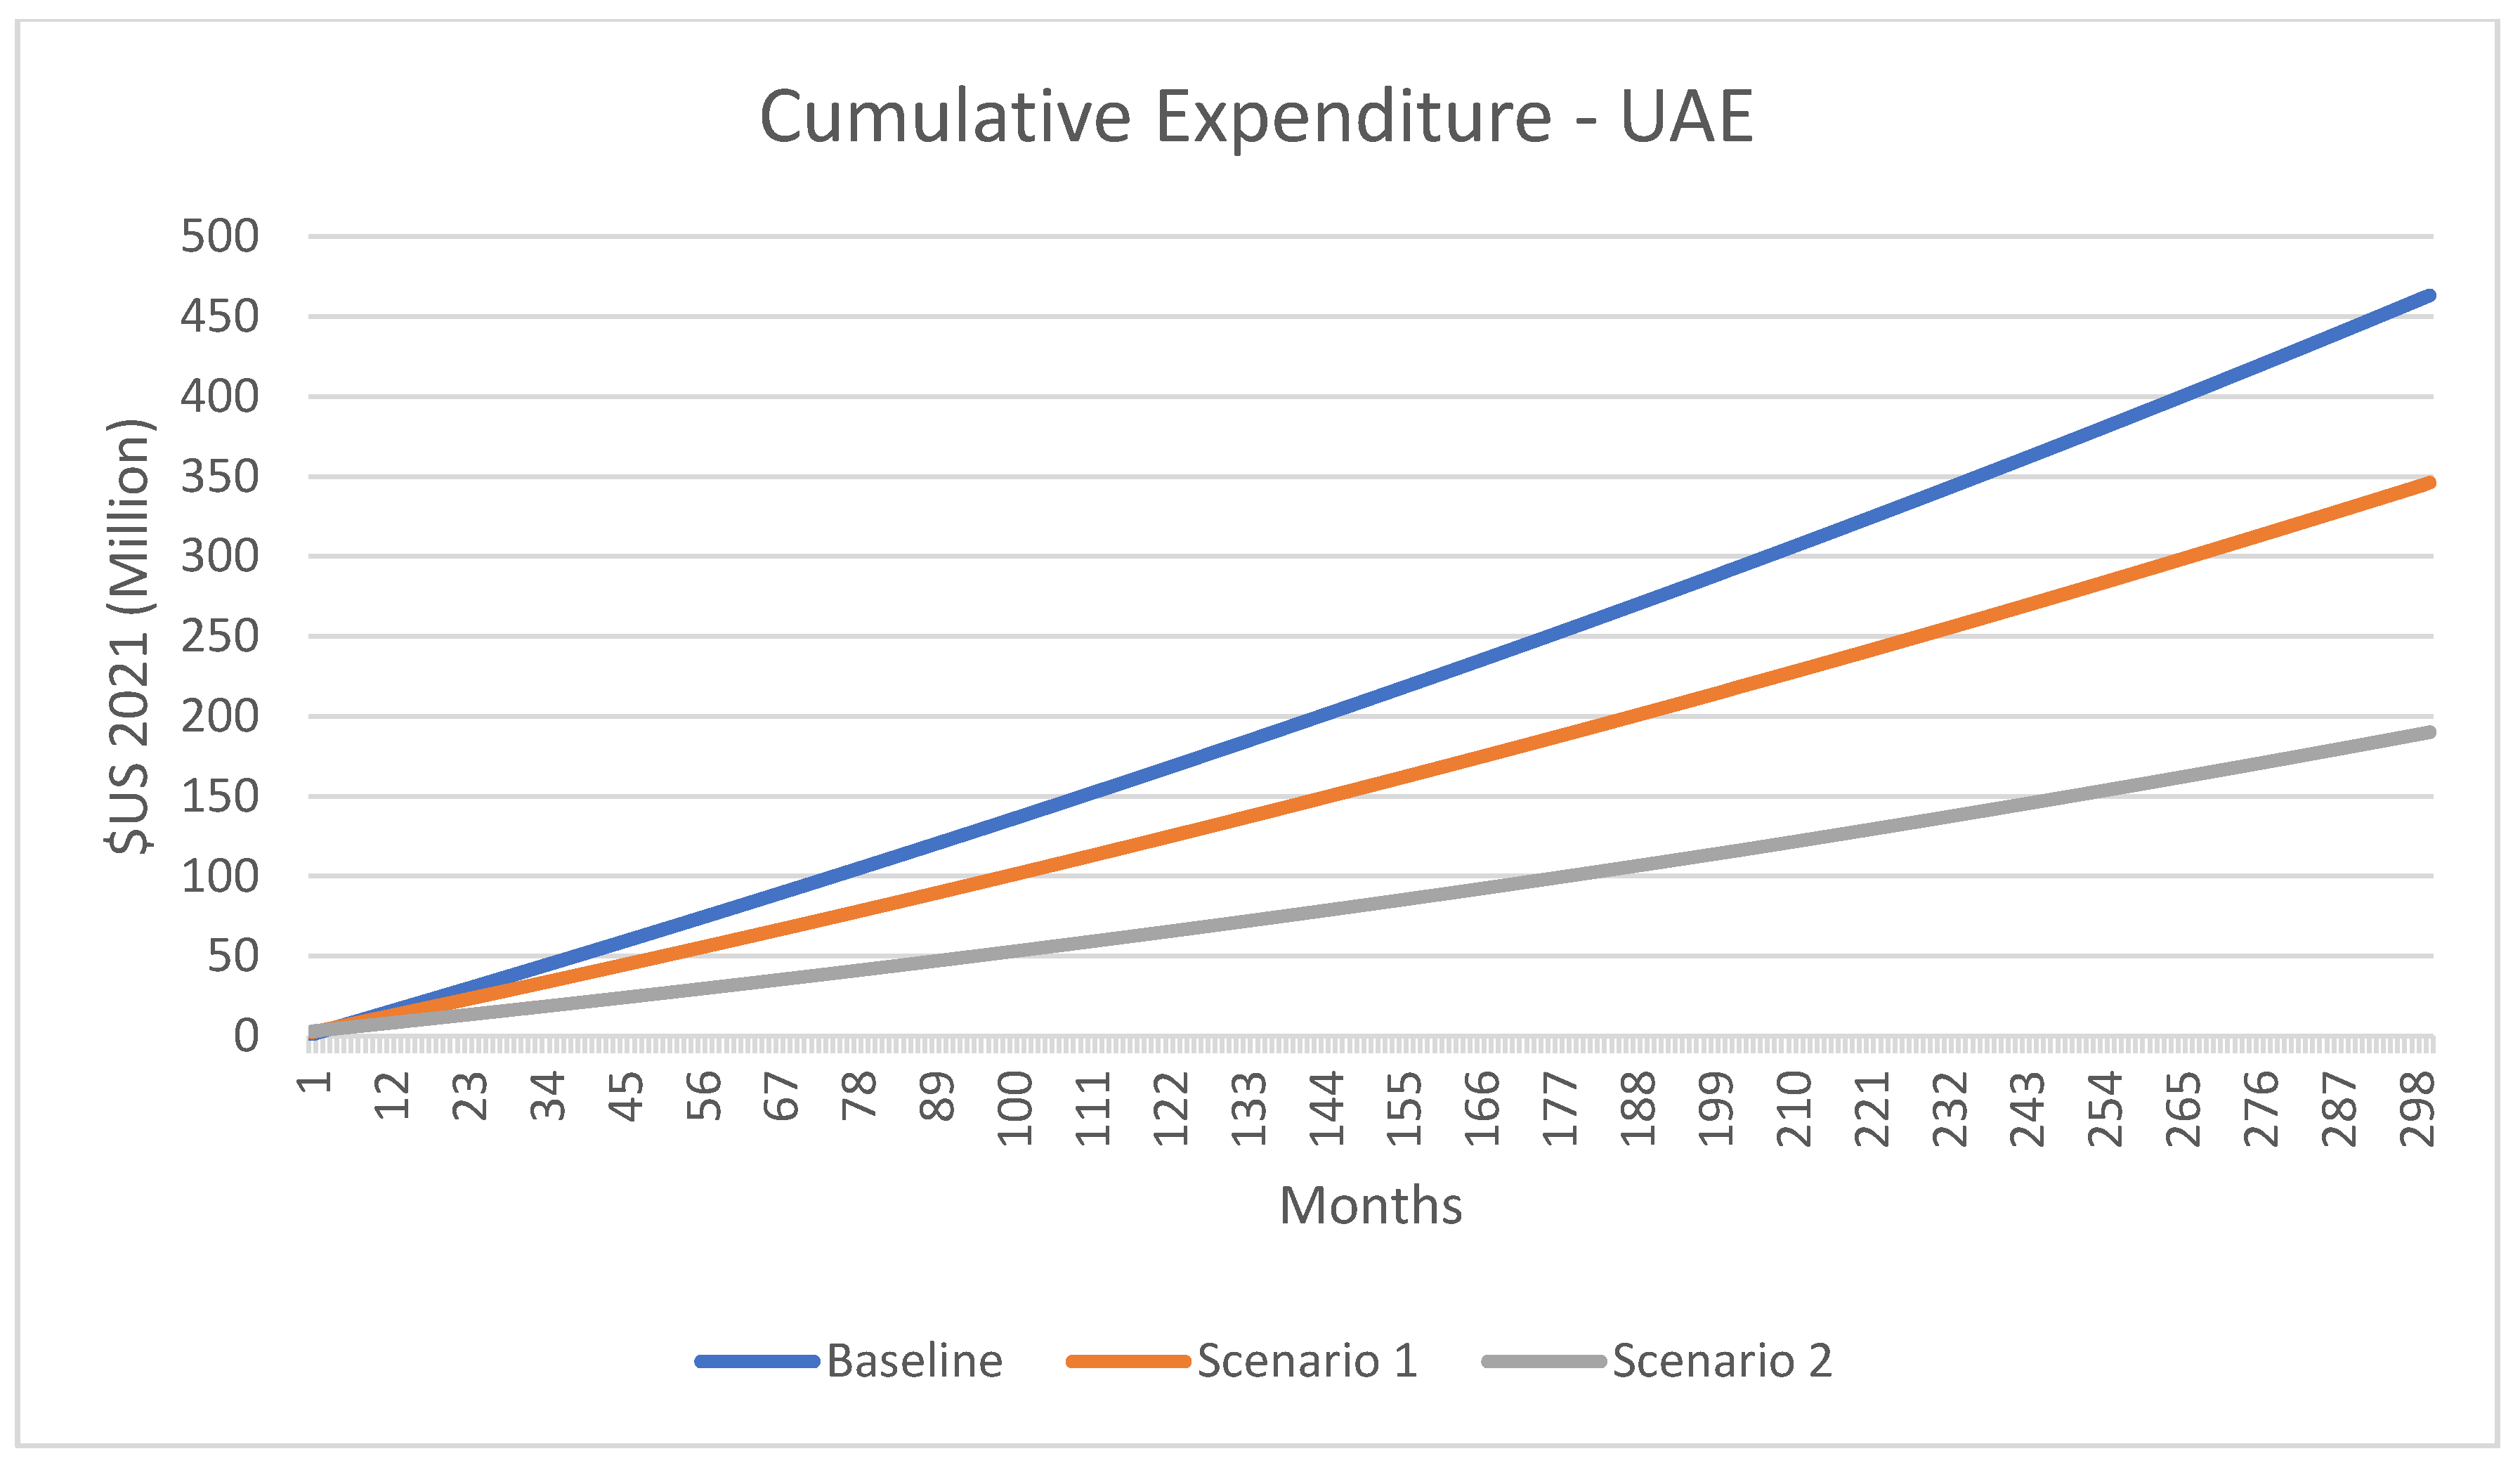
  • Base scenario: 100% of plant electricity requirement is met through electricity purchased from the grid. The emissions are calculated based on the grid emission factor, as per the existing CO2 reporting protocols applicable for the cement industry.
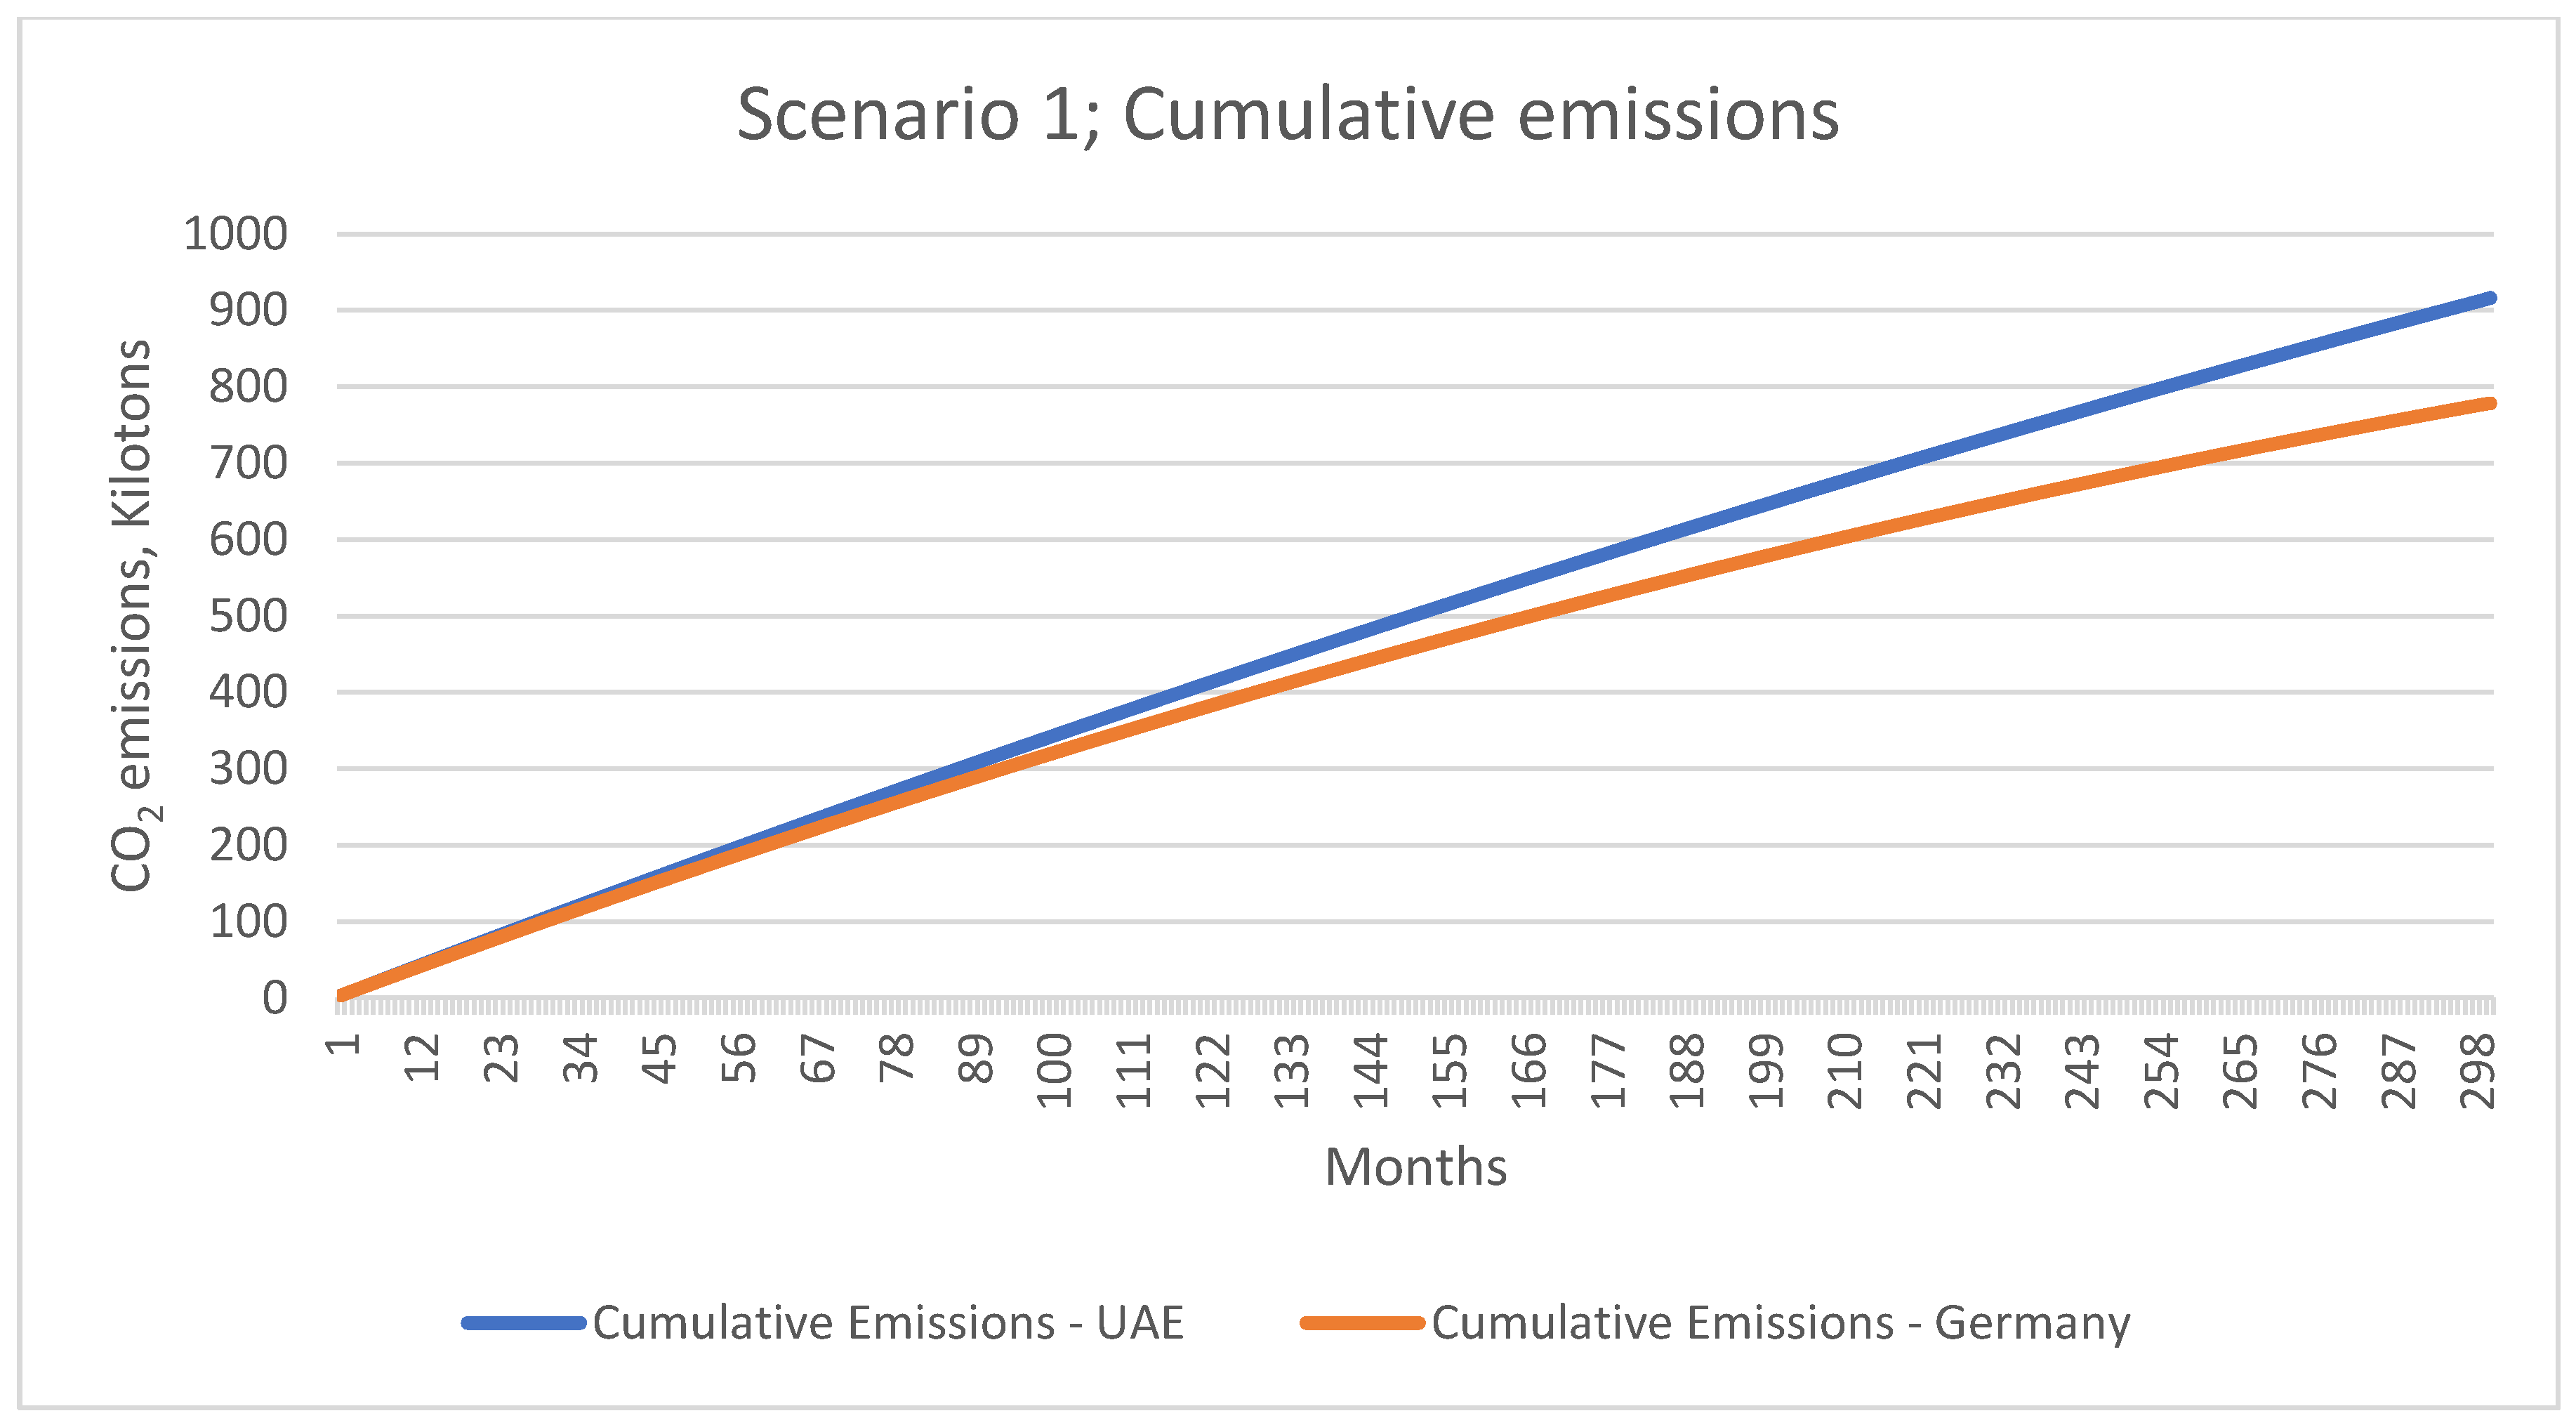
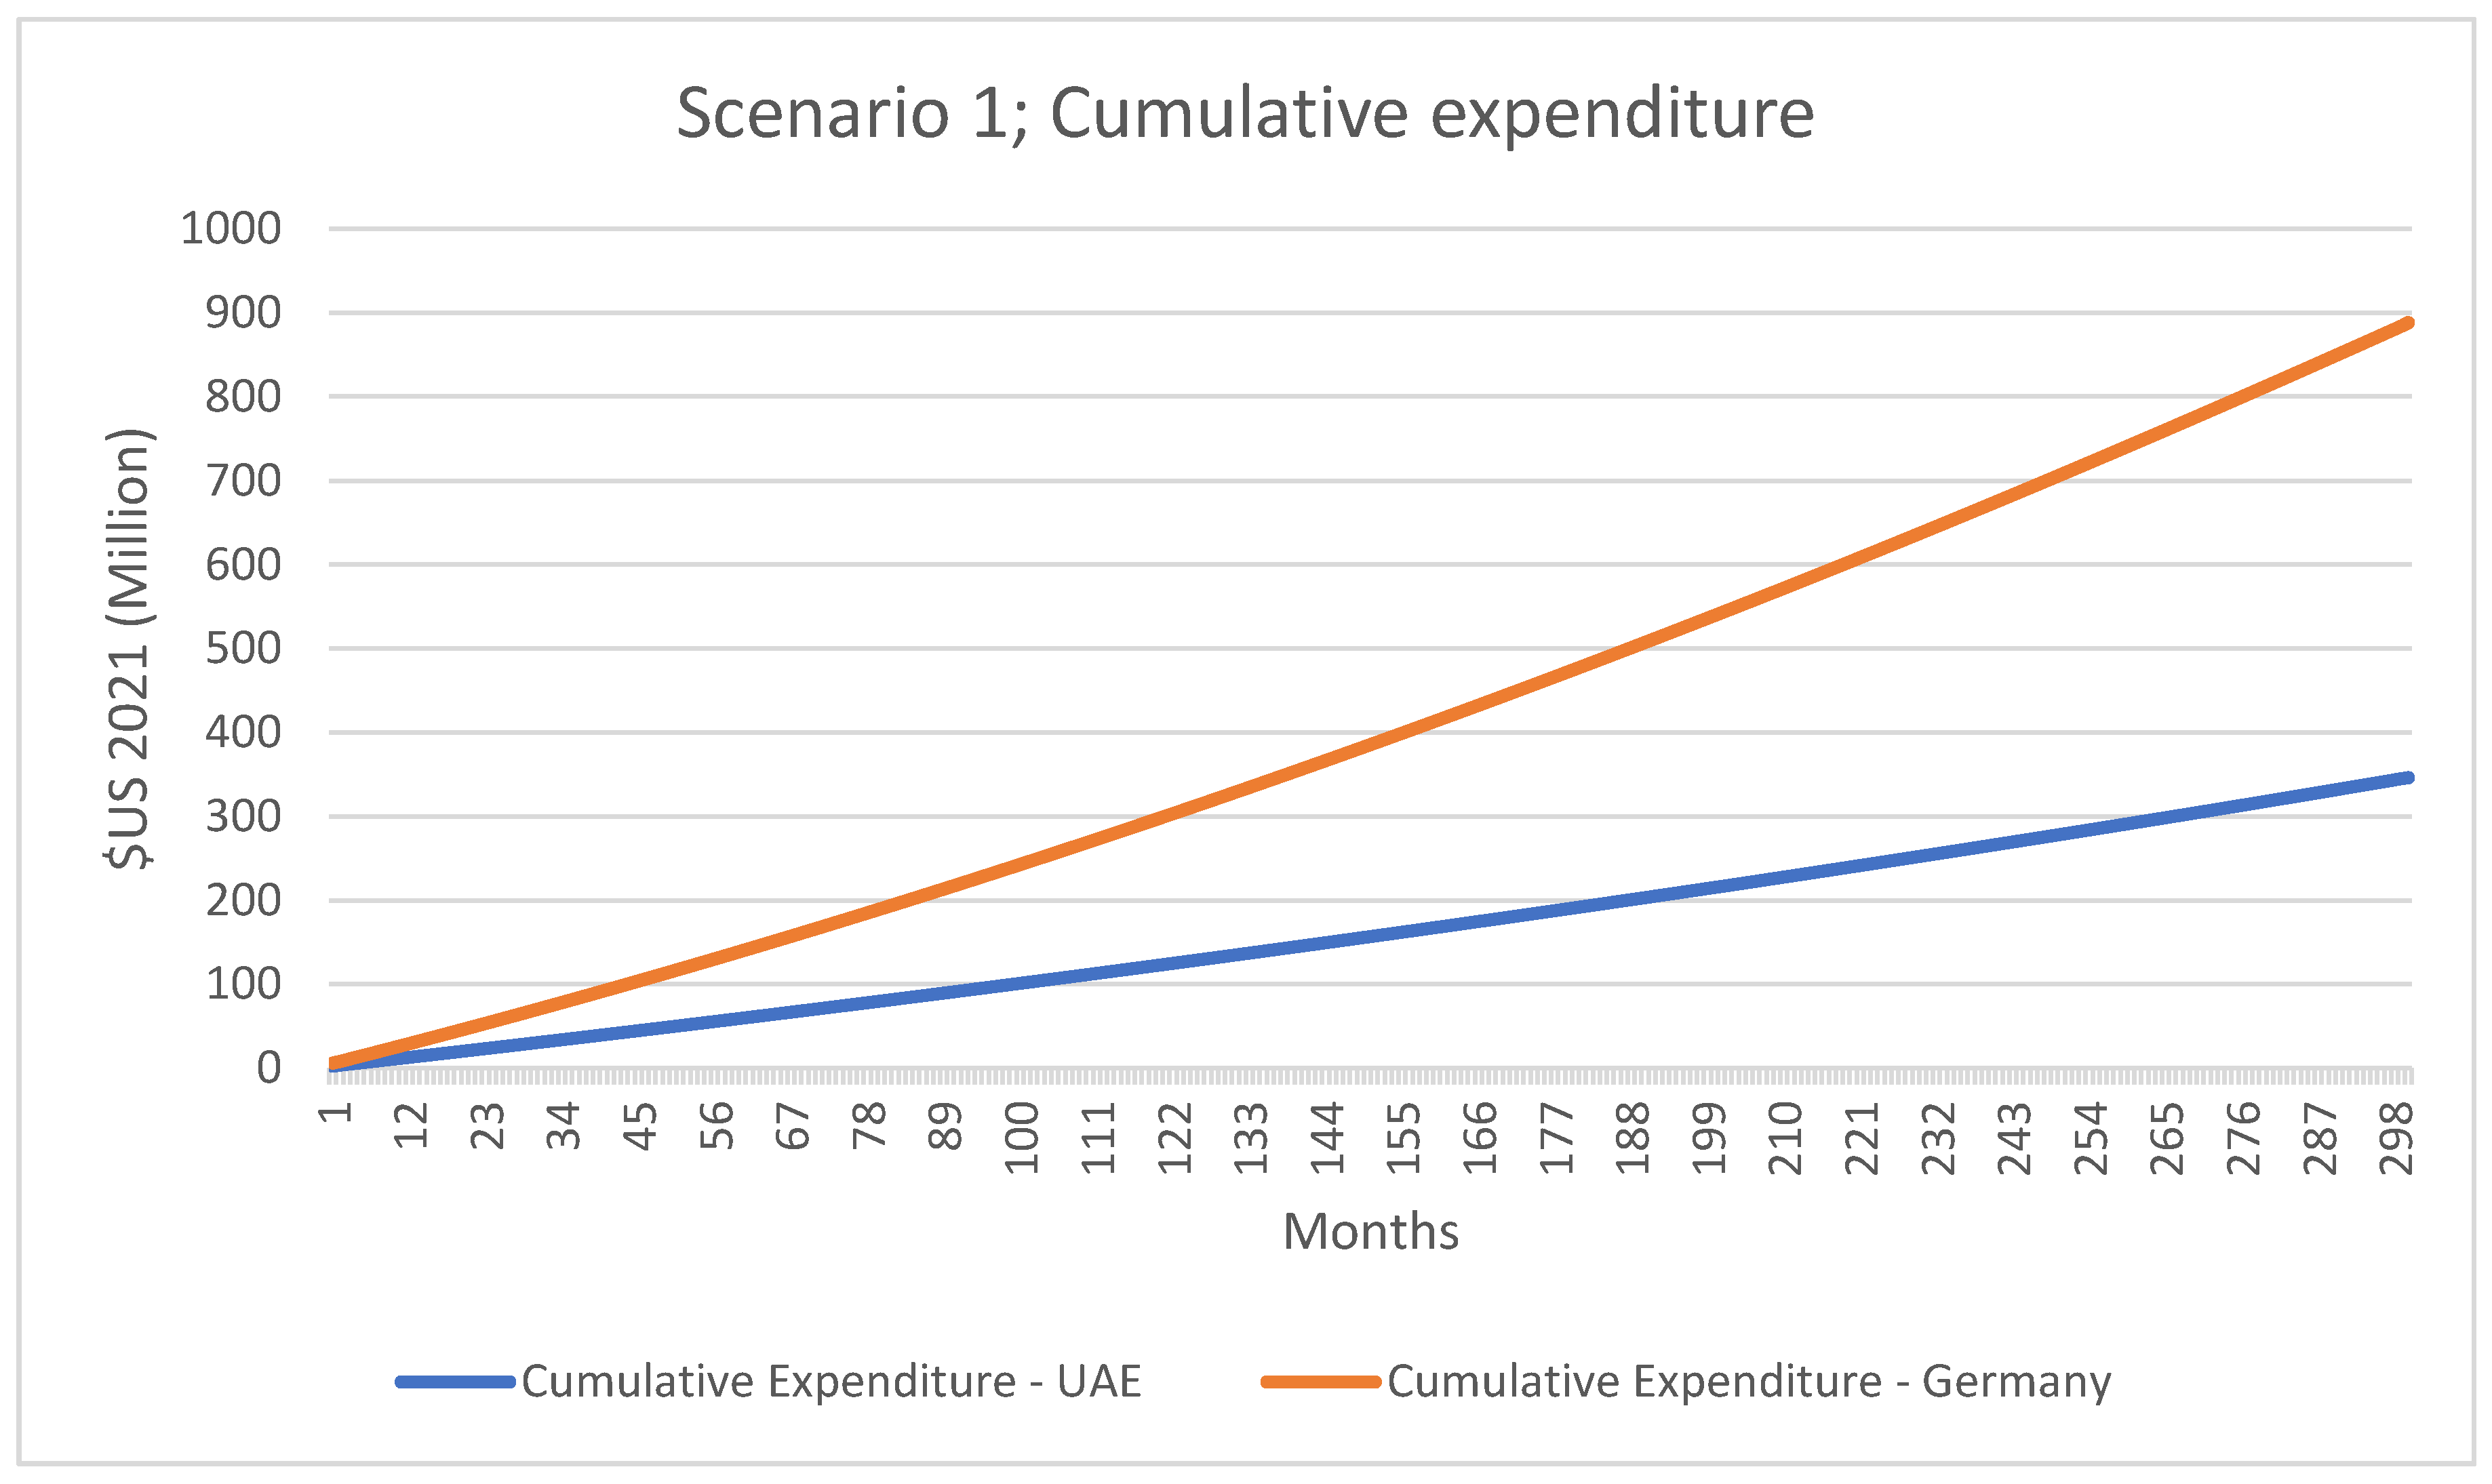
  • Scenario 1: 70% of the plant electricity requirement is met through electricity purchased from the grid. The remaining 30% of the requirement is met through captive power generation, specifically WHR. The initial capital expenditure to set up the mitigation project (WHR plant) is added to the expenditure calculation on the first time-step. Then, monthly operations and maintenance cost are calculated accordingly for different geographic regions.
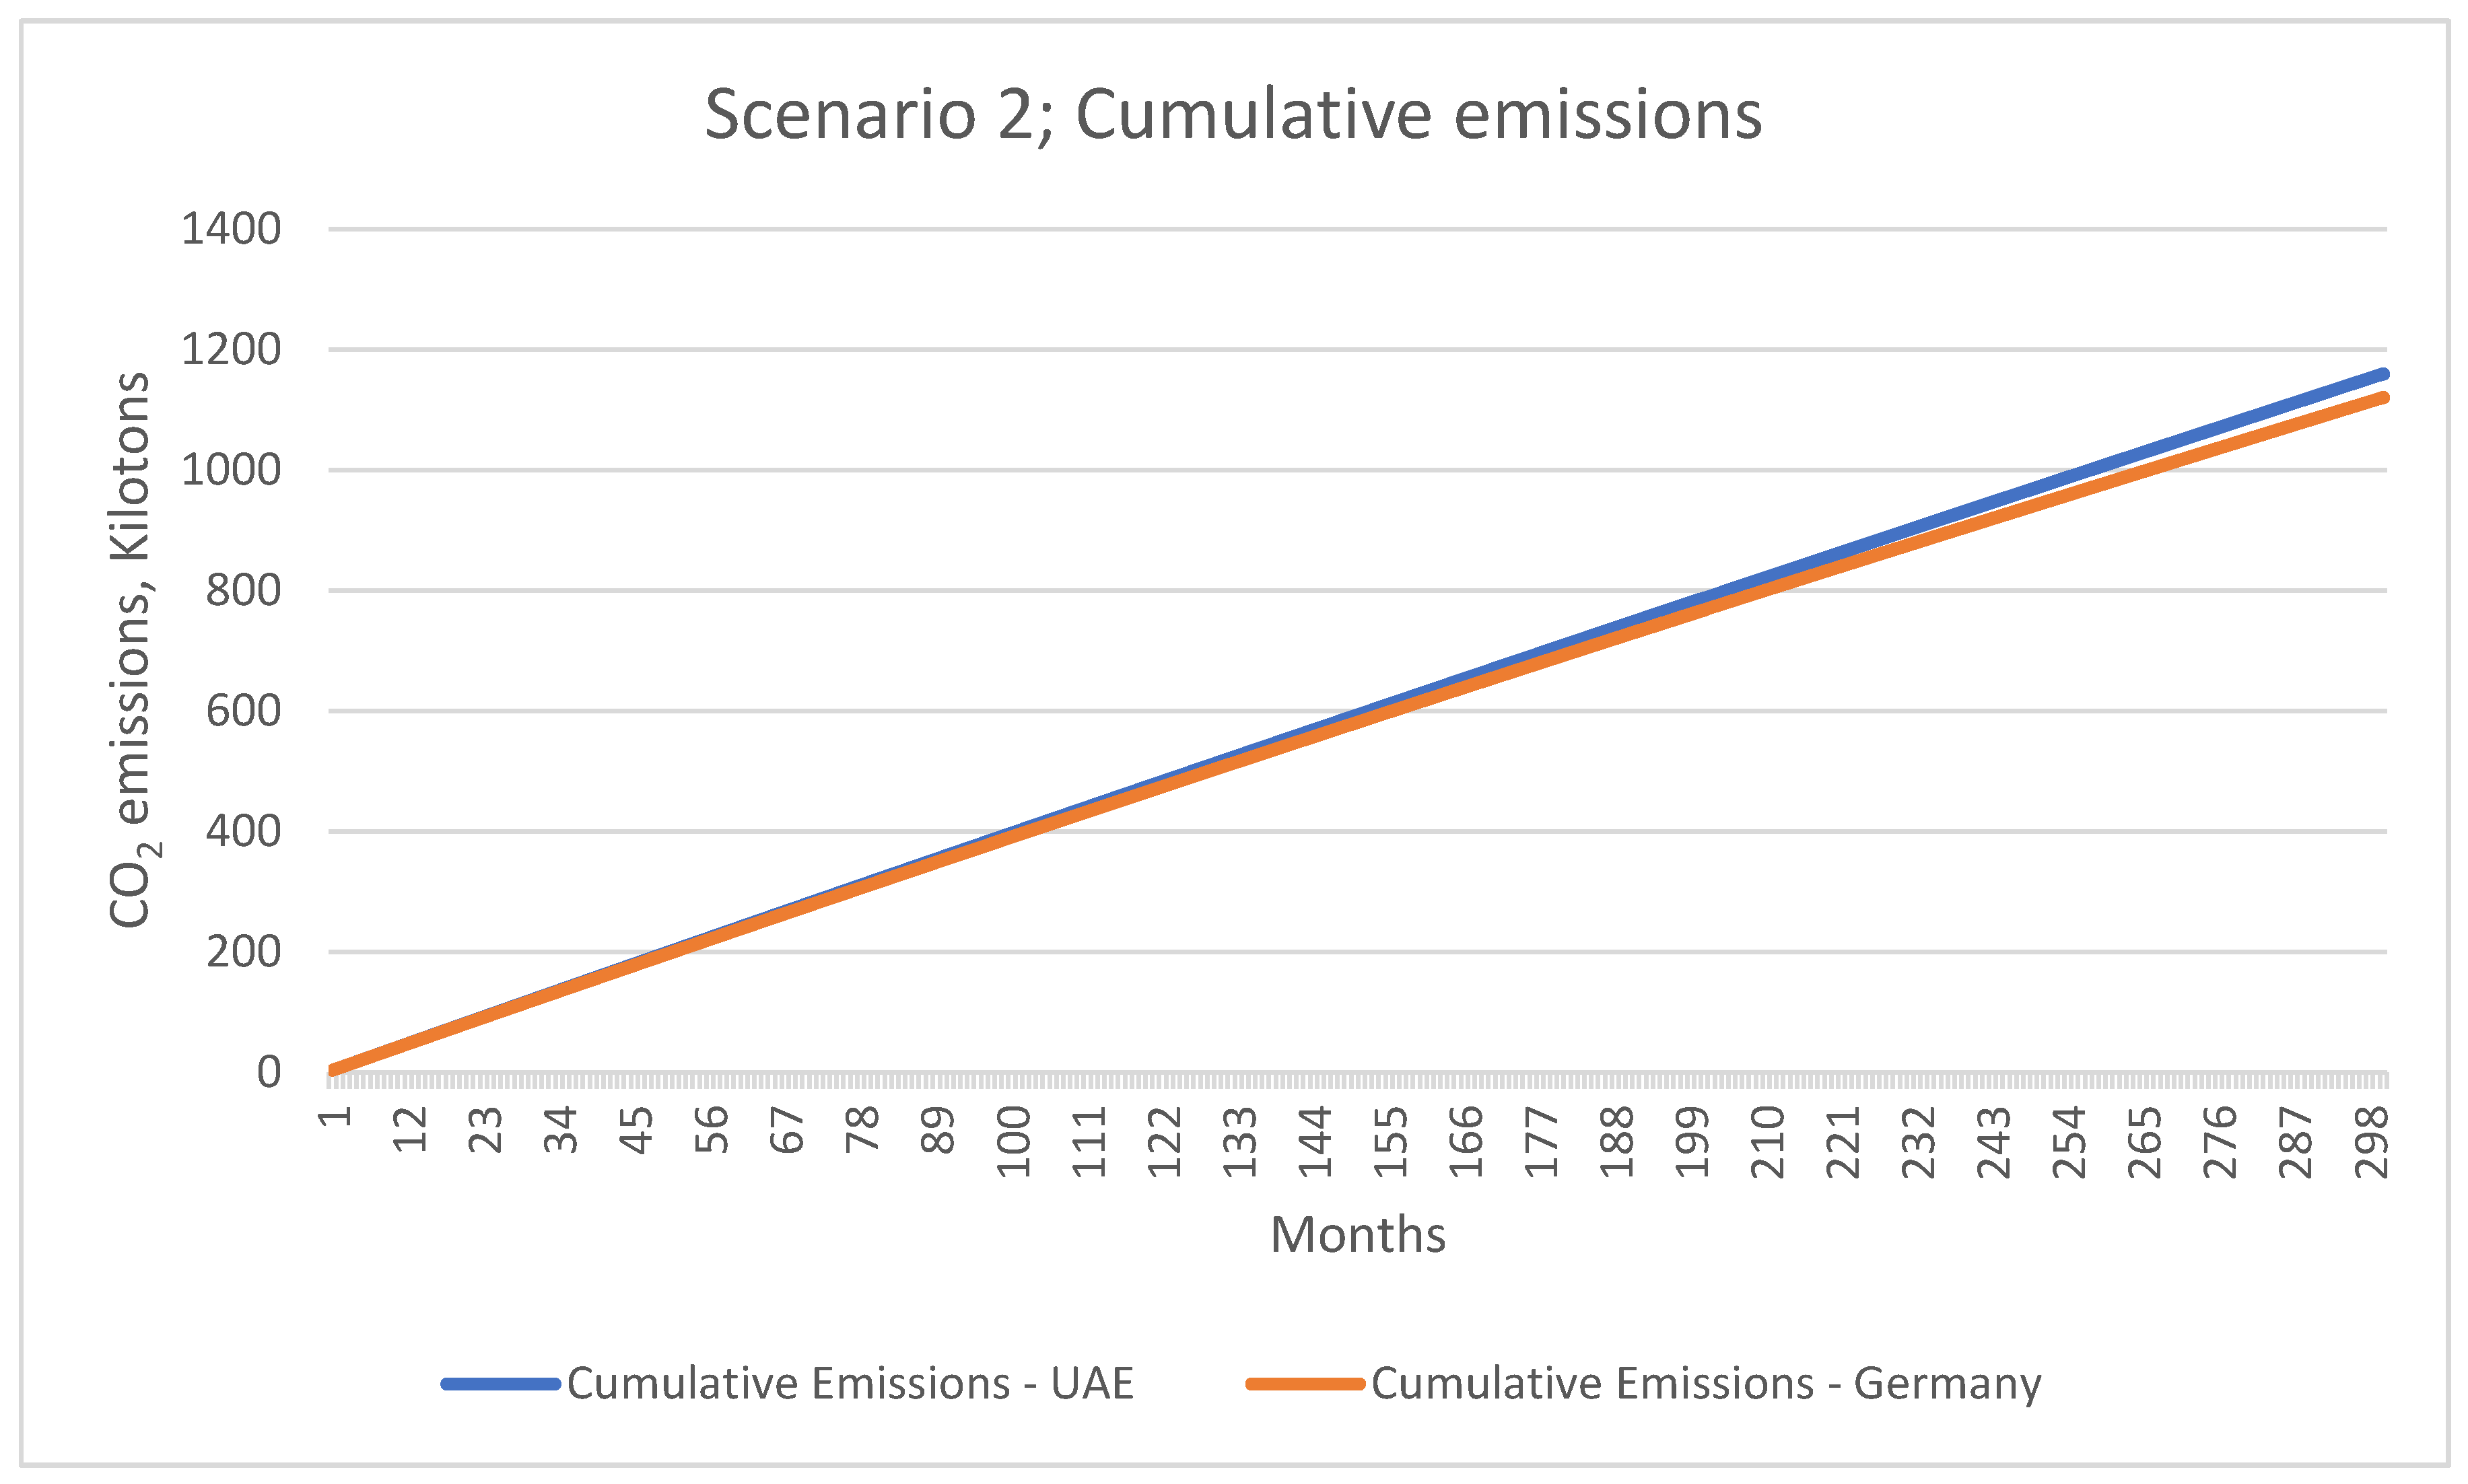
  • Scenario 2: 20% of the plant electricity requirement is met through electricity purchased from the grid. The remaining 80% of the requirement is divided between WHR—30%, Solar PV—25% and coal thermal plants—25%. The initial capital expenditure to set up the mitigation projects (WHR, solar PV, and coal plant) is added to the expenditure calculation on the first time-step.
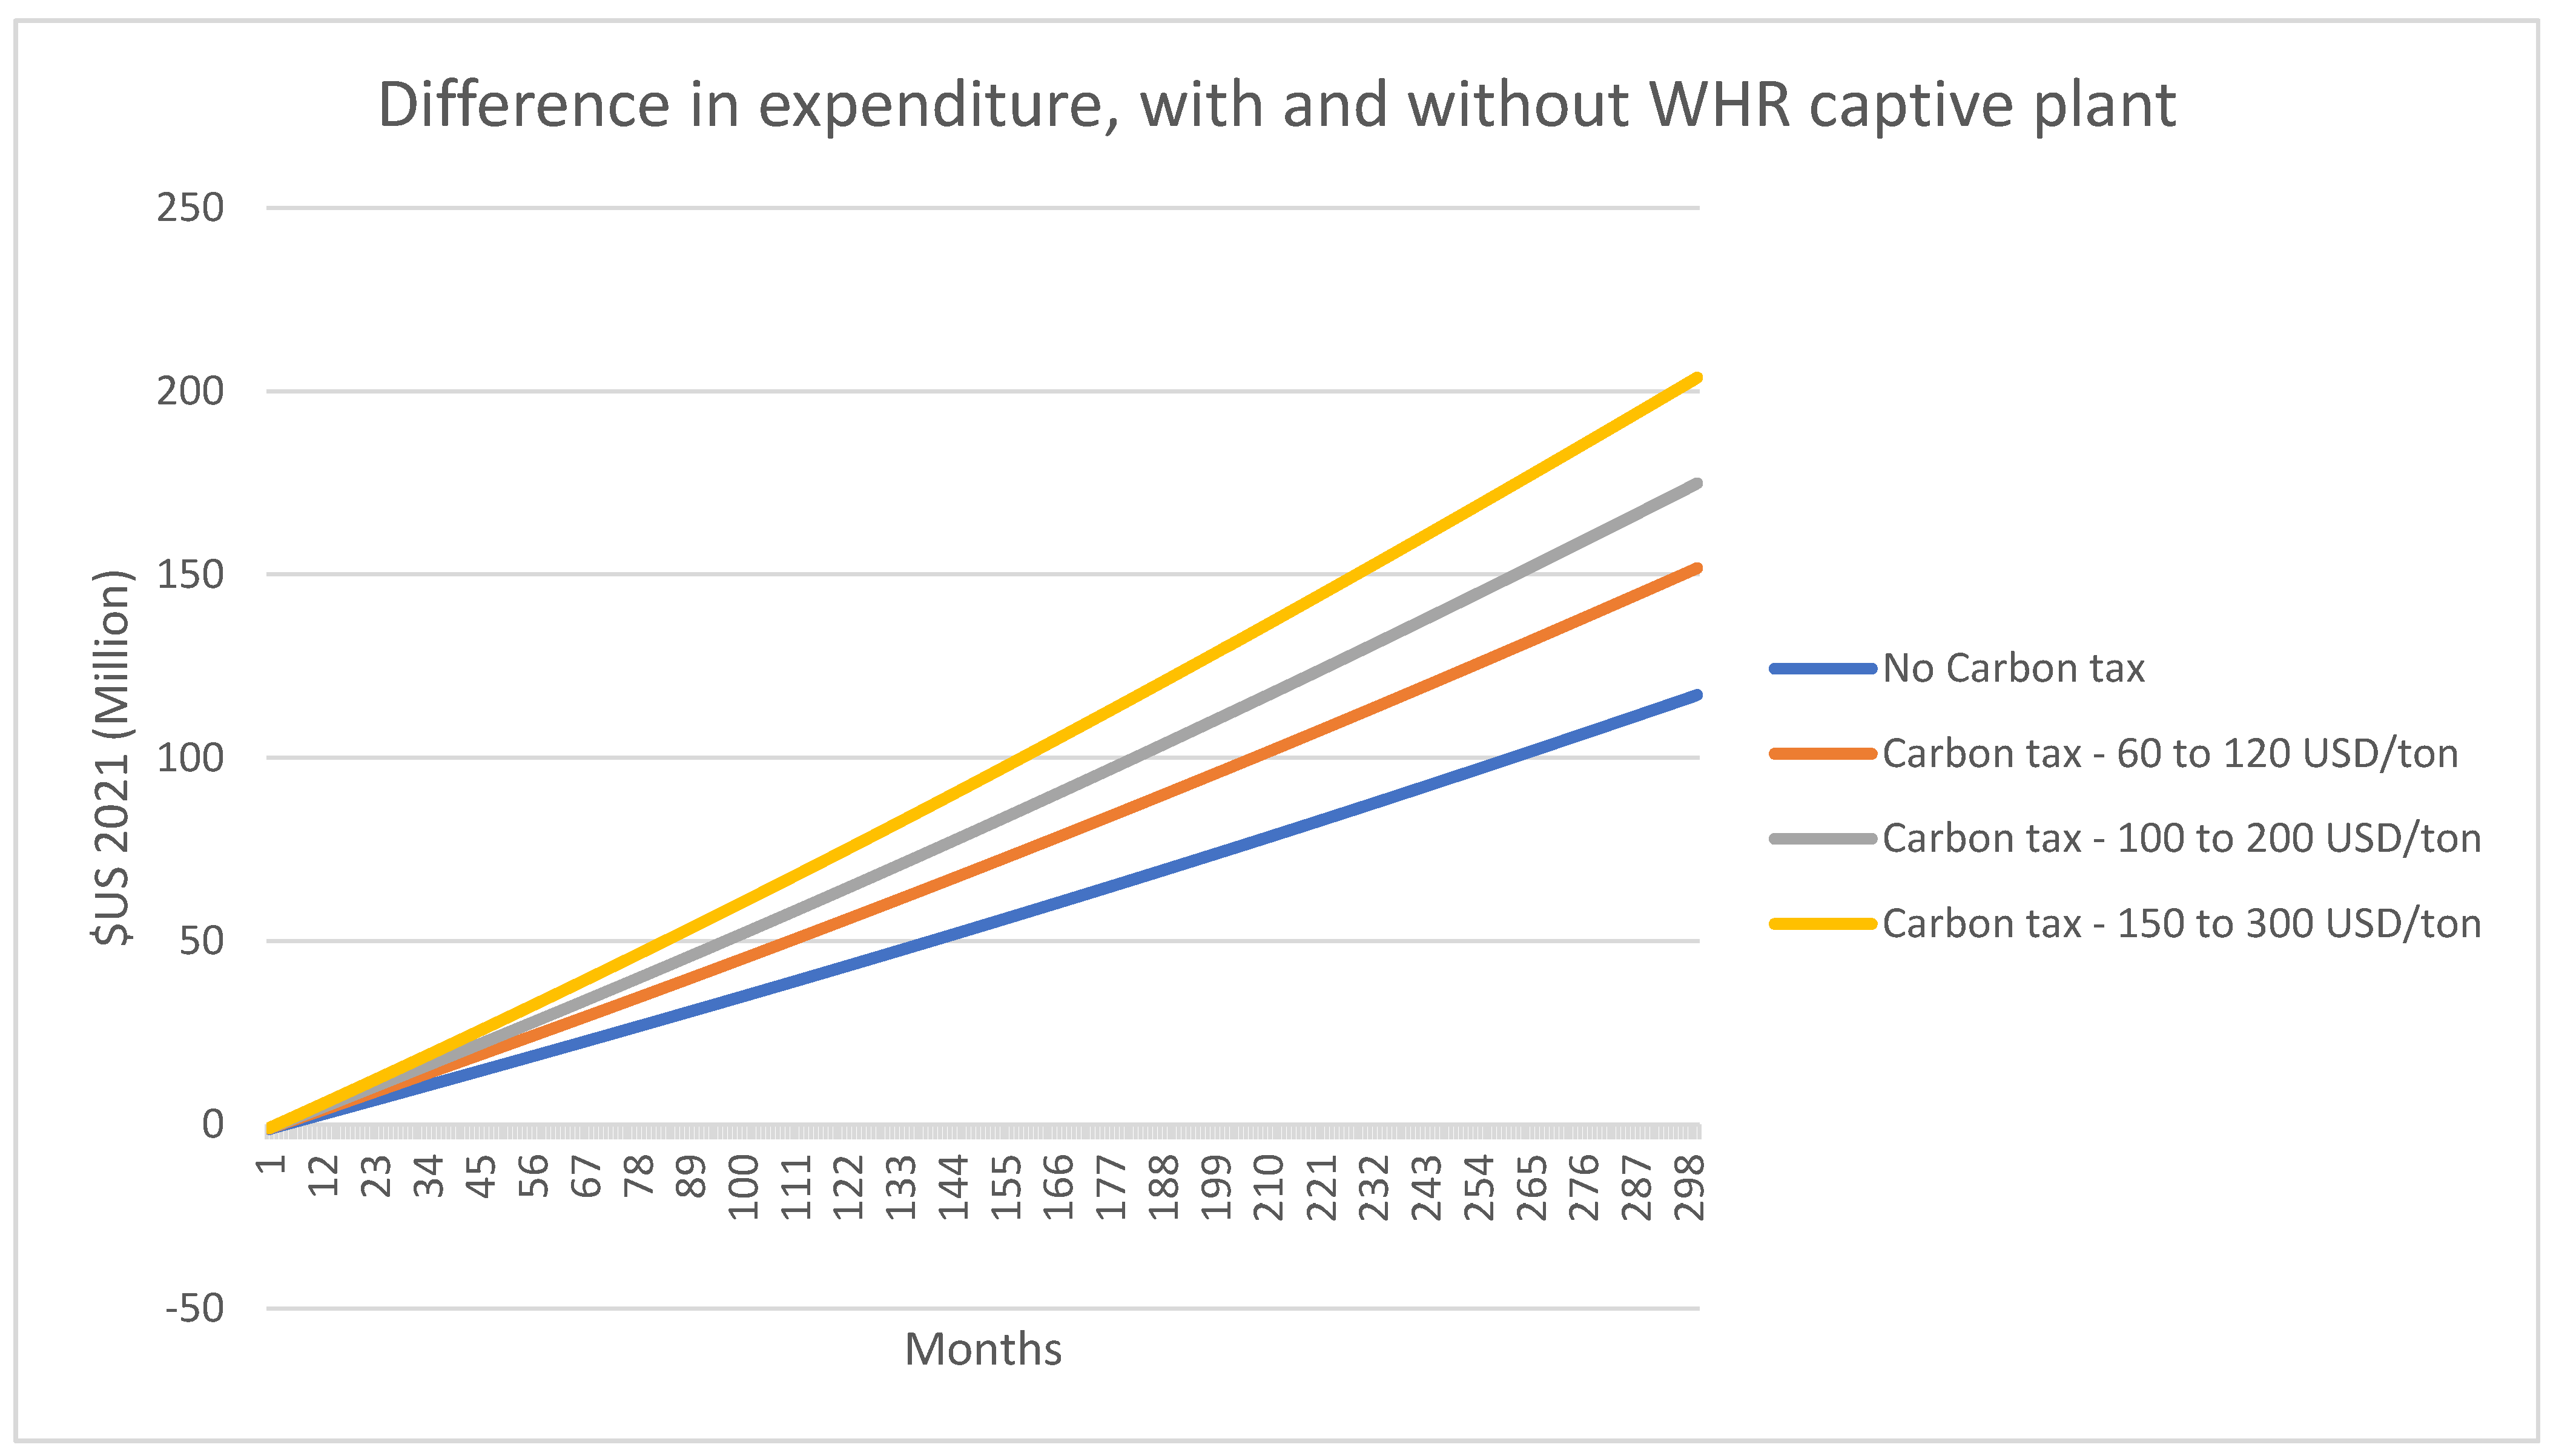
  • Specific test-case—payback period for WHR: WHR plants require a significant capital expenditure to set up, and carbon-tax could be utilised to influence the payback period for the project. For this scenario, three carbon-tax scenarios are considered for UAE, starting at 60 USD/ton, 100 USD/ton and 150 USD/ton of CO2 emissions and increasing by 100% through the course of the simulation. The cumulative expenditure with and without a WHR plant is compared for each scenario.
The datasets for grid electricity tariffs, grid emission factor and coal prices are precalculated for the duration of the simulation run based on long-term publicly available forecasts for UAE and DE. The respective capital and operational expenditure of mitigation projects is calculated based on combination of public reports and inputs from industry sources [13,14,15,16,17,18,19].

2.4. Dataset Preparation

The input parameters for the simulation are included as a Supplementary Dataset S1, which is prepared as follows for DE and UAE:
  • Grid emission factor: this is calculated based on the CO2 emission intensity of the production sources powering the regional electricity grid; the higher the ratio of renewable energy sources, the lower the grid emission factor. For DE, historic data for emission factor from 1990 to 2019 is sourced from Umwelt Bundesamt (Federal environment office) and is linearly extrapolated to 2045 [19]. For UAE, yearly milestones for share of renewable energy powering their national electricity grid are sourced from the National Climate Change Plan of the UAE for 2017–2050 [20]. The consequent grid emission factor is then calculated based on the share of electrical energy sources (the final milestone is 44% renewable, 6% nuclear, 38% natural gas and 12% coal in 2050).
  • Grid electricity tariffs: the historic average monthly electricity tariffs for DE from 2008 to 2021 are sourced from Statistische Bundesamt (Federal statistical office) and linearly extrapolated to 2045 for this simulation [18]. The historical industrial electricity tariffs for UAE have been sourced from slab tariffs provided by Dubai Electricity and Water Authority [14]. The tariffs in UAE have been constant since 2011 but are expected to change as part of the National Climate Change Plan, and based on the recommendations from industrial stakeholders, annual growth of 1.5% for electricity tariffs is considered for the purpose of this simulation.
  • Coal prices: the long-term global price forecast of bituminous coal from 2021 to 2045 is sourced from the U.S. Energy Information Administration [13]. The price of coal per unit of electricity is then calculated accordingly.
  • Capital expenditure for captive plants: the initial capital investment required for setting up the respective captive power plant is based on the report published by the International Finance Corporation [21]. The operations and maintenance costs are calculated as 2.5 percent of capital costs per year for conventional systems, and 1.25% for WHR and Solar PV. Furthermore, the annual changes in operations and maintenance costs are calculated to increase 5% annually to represent the changes in consumer price index.
  • Carbon tax: UAE currently has no planned implementation of carbon tax on industrial CO2 emissions as part of the National Climate Change Plan, as such, no carbon tax is considered for the simulation scenarios set in this region. For DE, historic data on European Union Emission Trading System’s average monthly spot prices from November 2016 to April 2021 is sourced and linearly extrapolated to 2045 [17]. November 2016 is chosen as the start date to reflect the changes in trends after the Paris Climate Agreement has entered into force within the European Union on 4 November 2016.

3. Results

The model is validated using sensitivity analysis and dimensional consistency checks before simulating a reference cement plant under different input datasets and scenarios for DE and UAE.

3.1. Model Validation

The model is constructed and executed using two types of simulation software, Vensim PLE (Ventana Systems Inc.) and InsightMaker (ScottFortmann-Roe [22]), for verifying consistency. Each simulation scenario is run for a period of 25 years, with timesteps of 1 month. Units of measures are utilised to check the model for dimensional consistency.

3.1.1. Boundary Adequacy

As per the objectives of the study, the model is designed to represent a single cement plant, therefore datasets for the parameters such as grid electricity tariffs, grid emission factor, coal and natural gas tariffs are all prepared exogenously based on published forecast data for applicable geographical regions. The metrics computed endogenously within the system include net monthly emissions and costs of captive power generation.

3.1.2. Sensitivity Analysis

Sensitivity analysis is conducted to check whether alterations in key parameters result in relatable shifts in model outputs. Net plant emissions and net plant expenditure are directly dependent on the grid emission factor and grid electricity tariffs, respectively, therefore the sensitivity of the model to these parameters is described as follows:
  • Baseline case, where the grid emission factor and grid tariffs are constant throughout the simulation period.
  • Moderate development case, where the grid emission factor moderately drops by 10% and grid tariffs increase by 10% linearly by the end of the simulation.
  • High development case, where the grid emission factor drops by 80% and grid tariffs increase by 80% linearly by the end of the simulation.
The impact of changes in net expenditure and CO2 emissions is examined by modifying the grid emission factor and grid electricity tariff respectively in Figure 3 and Figure 4. A moderate and high change cases have an equivalent impact on the observed variables; therefore, the model is deemed sensitive to changes in the key parameters.

3.2. Base Scenario

In the base scenario, a reference cement plant of 4000 tons per day capacity procures the entire electricity requirement from the regional grid supply, with no captive power plant installed. Figure 5 displays the cumulative emissions under base scenario, which shows diverging emission paths for UAE and DE with time. Germany’s emphasis on increasing the renewable energy share powering the national grid results in approximately 15% fewer emissions per cement plant at the end of 25 years.
Similar to cumulative emissions, the cumulative expenditure in the base scenario, Figure 6, also features diverging paths for UAE and DE, with DE’s commitment to renewable energy resulting in increasing trends for electricity tariffs. At the end of the simulation run, a reference cement plant in DE would spend 60.1% more than a similar plant in UAE when there is no captive power generation.

3.3. Scenario 1, with 30% Captive Power Generation

In Scenario 1, same reference cement plant of 4000 tons per day capacity is utilised but with a captive power generation facility providing 30% of the plant electricity requirement through WHR. A WHR captive plant is capital-intensive, and the initial costs to set up the plant are calculated for DE and UAE based on the calculations by International Finance Corporation and are added to the expenditure in the first time-step [19]. Figure 7 displays the cumulative emissions under the scenario 1 for DE and UAE, with a plant in DE having 15% fewer emissions than UAE, similar to base scenario. However, the emissions per plant in both regions are significantly lower than base scenario.
The cumulative expenditure in Figure 8 shows similar trends, with a typical cement plant in DE spending 61% more than a similar plant in UAE.

3.4. Scenario 2, with 80% Captive Power Generation

For Scenario 2, the same reference plant with 4000 tons per day capacity is considered for the simulation but with 80% of the electricity requirement met through captive power generation. In this scenario, the cement plant is assumed to invest into all three captive power plants supported in the model, i.e., WHR, Solar PV and coal-based thermal captive plant contributing to 30%, 25% and 25%, respectively, to the plant electricity requirement. The capital expenditure for each plant is calculated for DE and UAE is added to the expenditure in the first time-step. Figure 9 displays the cumulative emissions, which shows a lower divergence than the base and scenario 1. While comparatively more accessible, coal-based thermal captive plants have a higher carbon emission intensity than the regional electricity grids in both UAE and DE, leading to higher cumulative emissions than previous scenarios. A reference plant in DE generates 3.9% fewer emissions than a similar plant in UAE under this scenario at the end of 25 years.
The cumulative expenditure in Figure 10 shows that both reference plants in scenario 2 spend significantly less on electricity expenditure than previous scenarios, with a reference plant in DE spending 65.4% more than a similar plant in UAE.

3.5. Scenario Comparisons

The cumulative emissions and expenditure for the different scenarios are compared for DE in Figure 11 and Figure 12. The emissions from captive thermal coal plant in scenario 2 result in higher emissions in a reference cement plant than base scenario with captive power generation. Scenario 1 leads to a 23.6% decrease in electricity expenditure while still resulting in 30% lower emissions at the end of the simulation run. While Scenario 2 results in the least electricity expenditure, with 52.7% lower costs than base scenario, it also leads to an increase in cumulative emissions by 0.72%.
The cumulative emissions and expenditure for a reference plant in UAE are compared for the featured scenarios in Figure 13 and Figure 14. Scenario 1 results in the least cumulative emissions at the end of the simulation, with 30% and 21% lower emissions than Base and Scenario 2, respectively. However, the cumulative expenditure is the lowest in Scenario 2, with the reference plant spending 59% and 45.1% less than Base and Scenario 1, respectively.
Based on the comparison between the scenarios, it is evident that coal-based captive thermal power plants lead to lower expenditures over time in both DE and UAE but lead to higher cumulative emissions than other scenarios. The grid emission factor and the regional policies on renewable energy deployment have a significant impact on amount of emissions from the reference plant.

3.6. Impact of Carbon Tax on Payback Period of Captive WHR Plants

Setting up a captive WHR plant that utilises the waste heat from the exhaust gases to generate electricity is a capital-intensive affair, with the International Finance Corporation reporting an average cost of USD (2021) 1600 to 2200 per KW in Asian countries and USD (2021) 2000 to 3800 per KW in the European Union (2014) [20]. Based on industrial sources, the cost for setting up a WHR plant in UAE is estimated to be 1700 USD (2021) per KW in 2021.
For calculating the impact of carbon tax on payback period, a reference plant of 4000 tons per day is considered and the electricity requirement is estimated at 17.5 MW. It is assumed that the captive WHR plant is set up in the cement plant, which provides 30% of the total plant electricity requirement, which is 5.25 MW. The cost for setting up a 5.25 MW WHR captive plant in UAE is calculated at USD 8.925 million in 2021. Three carbon tax scenarios are then considered for calculating the pay-back period, starting at 60 USD/ton, 100 USD/ton and 150 USD/ton of CO2 emissions and increasing by 100% through the course of the simulation. For illustrating the impact of carbon tax on cement plants with captive power generations, the cumulative expenditure for the reference plant is simulated, both with and without a captive WHR plant, and the difference between them is calculated at each time-step to portray the cumulative savings in Figure 15 and Table 2.
Each row in Table 2 represents a time-step in the simulation, which is 1 month as specified earlier. Based on the calculation for setting up a 5.25 MW WHR captive plant, the payback period for USD 8.925 million is estimated by calculating the plant savings in electricity expenditure when a WHR plant is deployed. Without a carbon tax policy, the payback period for WHR plant is estimated at 30 months. However, enforcing carbon tax results in payback period decreasing to 23, 21 and 18 months for USD 60, USD 120 and USD 150 per ton carbon tax, respectively. Higher the carbon tax, the lower is the time required for payback period on the mitigation project.

4. Discussion

SD enabled a systematic approach to evaluate the impact of electricity tariffs and carbon taxation on plant expenditure and emissions, respectively. For the reference plant in DE, the significantly higher electricity tariffs (when compared to UAE) incentivise the plant stakeholders to invest into captive power generation in order to minimise expenditure on electricity utilisation during the lifespan of the cement plant. While thermal captive power plants based on coal are more accessible, the high carbon tax ensures that renewable generation through WHR and solar PV remains more attractive to the cement plants. In case of UAE, the increasing electricity tariffs incentivises captive power generation to a certain extent, but the duration of the payback period of capital investment acts as a deterrent to adopting mitigation strategies. The absence of carbon tax in UAE also absolves the plant stakeholders’ consensus on adoption of renewable captive power generation, potentially encouraging the use of coal based thermal captive power plants which have a higher CO2 emission intensity than the regional electricity grid (which primarily utilises natural gas for power generation). Table 2 outlines how different carbon taxation scenarios can influence this payback period and potentially encourage plants to adopt carbon mitigation measures to reduce the overall expenditure of the plant during its lifetime. High carbon tax policies would potentially incentivise quick adoption of mitigation strategies, not only for emission sources related to electricity utilisation but also for aspects of the cement manufacturing process.

4.1. Limitations

The exogenous datasets used in the simulation are prepared either as per published forecast data or linearly extrapolated historic trends, thereby the accuracy of the quantitative results is directly influenced by the accuracy of the forecasted data. As such, the quantitative data in this study are only considered as an approximation of future trends. The simulation model featured in this study exclusively calculates the emissions and expenditure resulting from the utilisation of electricity in a cement plant. The emissions and expenditure through transportation of raw materials for conventional captive power plants is omitted in the model.

4.2. Considerations for Future Work

Electricity use only makes up a small portion of the CO2 emissions in the cement manufacturing process. As such, multiple mitigation methods are currently explored within the cement industry to tackle different emission sources such as clinker substitution, use of low carbon fuels, efficiency improvements, and carbon capture. Each of these specified mitigation project has a definitive impact on the overall plant parameters such as net electricity requirement, heat availability and company reserves available for mitigation. Therefore, there is an opportunity to extend the current model to include all the major mitigation options and the causal relationships between them, as conceptualised in Figure 16. It would enable stakeholders to evaluate the performance of different combinations of mitigation options under different scenarios to determine the most effective strategy for minimising both emissions and expenditure simultaneously.

5. Conclusions

A SD model for CO2 emissions and expenditure resulting from electricity use in a cement plant was developed. The model was applied to simulate the impact of regional parameters such as grid electricity tariffs, emission factor and carbon tax on the plant emissions and expenditure for a period of 25 years, between 2021 and 2045 for a reference plant in Germany and United Arab Emirates. Captive power generation using renewable energy such as WHR and Solar PV results in both lower emissions and expenditure on electricity in both the geographic regions. While using captive thermal power generation using coal is more accessible, it leads to a higher cumulative emission than the base scenario in which the plant procures 100% of the electricity requirement from the regional grid. Furthermore, the impact of carbon tax on the payback period of WHR is evaluated on a reference plant under UAE conditions, with the observed payback period being inversely proportional to the amount of carbon tax.
The results from the study suggest that an appropriate carbon tax policy on emissions through electricity utilisation could be utilised to incentivise the cement plant stakeholders to adopt mitigation measures for minimising plant expenditure on the emissions. The increasing grid electricity tariffs also hasten the process to a certain degree, especially in regions with high grid emission factor. Despite the limitations related to the dataset used, SD simulation enabled the study and analysis of emissions and expenditure for cement plants with different configurations of captive power generation. The model presented in the study can also be additionally utilised for studying the impact of subsidies and taxation in other geographical regions. The study concludes with recommendations for model expansion, facilitating all the other major mitigation options applicable to the cement plant and the causal relationships between them.

Supplementary Materials

The following are available online at https://www.mdpi.com/article/10.3390/en14113115/s1. The contents of the supplementary dataset are explained in Section 2.4 (Dataset preparation) and as well as in data availability statement at the end of the manuscript. The same dataset is then utilised for performing the experiments whose results are documented in Section 3 and its inclusion enables reproducibility of the study in line with MDPI's data availability policy. Figure 2: Stock-and-flow diagram of the proposed model for captive power generation in a cement plant, Figure 16: Conceptualisation of the proposed model for the future encompassing all the major mitigation methods currently applicable to a cement plant.

Author Contributions

Conceptualisation, data curation, simulation and analysis of results, and writing—original draft preparation, A.K.; writing—review, supervision, funding acquisition, B.M. Both authors have read and agreed to the published version of the manuscript.

Funding

The APC was funded by Department of Operations Research and Business Intelligence, Wroclaw University of Science and Technology, 50-370 Wroclaw, Poland.

Institutional Review Board Statement

Not applicable.

Informed Consent Statement

Not applicable.

Data Availability Statement

Dataset used in the simulation is available as supplementary dataset S1.

Conflicts of Interest

The authors declare no conflict of interest.

References

  1. GNR Project. Available online: https://gccassociation.org/sustainability-innovation/gnr-gcca-in-numbers/ (accessed on 23 April 2021).
  2. Worrell, E.; Price, L.; Martin, N.; Hendriks, C.; Meida, L.O. Carbon dioxide emissions from the global cement industry. Annu. Rev. Energy Environ. 2001, 26, 303–329. [Google Scholar] [CrossRef]
  3. Levi, P.; Vass, T.; Mandová, H.; Gouy, A. Cement. Available online: https://www.iea.org/reports/cement (accessed on 17 May 2021).
  4. Paris 2015: Tracking Country Climate Pledges. Available online: https://www.carbonbrief.org/paris-2015-tracking-country-climate-pledges (accessed on 23 April 2021).
  5. Technology Roadmap Low-Carbon Transition in the Cement Industry Analysis-IEA. Available online: https://www.iea.org/reports/technology-roadmap-low-carbon-transition-in-the-cement-industry (accessed on 21 May 2021).
  6. Nehdi, M.; Rehan, R.; Simonovic, S.P. System dynamics model for sustainable cement and concrete: Novel tool for policy analysis. ACI Mater. J. 2004, 101, 216–225. [Google Scholar]
  7. Ansari, N.; Seifi, A. A system dynamics model for analyzing energy consumption and CO2 emission in Iranian cement industry under various production and export scenarios. Energy Policy 2013, 58, 75–89. [Google Scholar] [CrossRef]
  8. Proaño, L.; Sarmiento, A.T.; Figueredo, M.; Cobo, M. Techno-economic evaluation of indirect carbonation for CO2 emissions capture in cement industry: A system dynamics approach. J. Clean. Prod. 2020, 263, 121457. [Google Scholar] [CrossRef]
  9. Anand, S.; Vrat, P.; Dahiya, R.P. Application of a system dynamics approach for assessment and mitigation of CO2 emissions from the cement industry. J. Environ. Manag. 2006, 79, 383–398. [Google Scholar] [CrossRef] [PubMed]
  10. Jokar, Z.; Mokhtar, A. Policy making in the cement industry for CO2 mitigation on the pathway of sustainable development—A system dynamics approach. J. Clean. Prod. 2018, 201, 142–155. [Google Scholar] [CrossRef]
  11. Kunche, A.; Mielczarek, B. Application of syztem dynamic modelling for evaluation of carbon mitigation strategies in cement industries: A comparative overview of the current state of the art. Energies 2021, 14, 1464. [Google Scholar] [CrossRef]
  12. WWF-World Wide Fund for Nature. A Blueprint for a Climate Friendly Cement Industry. Available online: https://wwf.panda.org/wwf_news/?151621/A-blueprint-for-a-climate-friendly-cement-industry (accessed on 24 April 2021).
  13. Annual Energy Outlook 2021. Available online: https://www.eia.gov/outlooks/aeo/data/browser/ (accessed on 25 April 2021).
  14. Dubai Electricity & Water Authority. Available online: https://www.dewa.gov.ae/en/consumer/billing/slab-tariff (accessed on 25 April 2021).
  15. Gurney, J. British petroleum company. BP statistical review of world energy. J. Policy Anal. Manage. 1985, 4, 283. [Google Scholar] [CrossRef]
  16. Greenhouse Gas Emission Intensity of Electricity Generation. Available online: https://www.eea.europa.eu/data-and-maps/daviz/co2-emission-intensity-6 (accessed on 25 April 2021).
  17. Quandl. ECX EUA Futures, Continuous Contract #1 (C1) (Front Month). Available online: https://www.quandl.com/data/CHRIS/ICE_C1-ECX-EUA-Futures-Continuous-Contract-1-C1-Front-Month (accessed on 20 May 2021).
  18. Data on Energy Price Trends—Long-Time Series to February 2021. Available online: https://www.destatis.de/EN/Themes/Economy/Prices/Publications/Downloads-Energy-Price-Trends/energy-price-trends-pdf-5619002.html (accessed on 25 April 2021).
  19. Stallmann, M. Entwicklung der Spezifischen Kohlendioxid-Emissionen des Deutschen Strommix 1990–2018 [Development of the Specific Carbon Dioxide Emissions of the German Electricity Mix 1990–2018]. Available online: https://www.umweltbundesamt.de/bild/entwicklung-der-spezifischen-kohlendioxid-1 (accessed on 25 April 2021).
  20. National Climate Change Plan of the UAE 2017–2050—The Official Portal of the UAE Government. Available online: https://u.ae/en/about-the-uae/strategies-initiatives-and-awards/federal-governments-strategies-and-plans/national-climate-change-plan-of-the-uae (accessed on 26 April 2021).
  21. Waste Heat Recovery for the Cement Sector: Market and Supplier Analysis. Available online: https://www.ifc.org/wps/wcm/connect/topics_ext_content/ifc_external_corporate_site/sustainability-at-ifc/publications/report_waste_heat_recovery_for_the_cement_sector_market_and_supplier_analysis (accessed on 25 April 2021).
  22. Fortmann-Roe, S. Insight Maker: A General-Purpose Tool for Web-Based Modeling & Simulation. Simul. Model. Pract. Theory 2014, 47, 28–45. [Google Scholar]
Figure 1. CLD of the proposed model for captive power generation in a cement plant.
Energies 14 03115 g001
Figure 2. Stock-and-flow diagram of the proposed model for captive power generation in a cement plant. “Total CO2 emissions” refers to the emissions from the plant through electricity utilisation. Abbreviations: SPV—solar photovoltaic system; WHR—waste heat recovery; NG—natural gas; CAPEX—capital expenditure.
Energies 14 03115 g002
Figure 3. Sensitivity of the model to the impact of grid emission factor.
Energies 14 03115 g003
Figure 4. Sensitivity of the model to grid electricity tariff.
Energies 14 03115 g004
Figure 5. Cumulative emissions through electricity consumption for UAE and DE under the base scenario.
Energies 14 03115 g005
Figure 6. Cumulative expenditure through electricity consumption for UAE and DE under the base scenario.
Energies 14 03115 g006
Figure 7. Cumulative emissions through electricity consumption for UAE and DE under scenario 1.
Energies 14 03115 g007
Figure 8. Cumulative expenditure through electricity consumption for UAE and DE under scenario 1.
Energies 14 03115 g008
Figure 9. Cumulative emissions through electricity consumption for UAE and DE under scenario 2.
Energies 14 03115 g009
Figure 10. Cumulative expenditure through electricity consumption for UAE and DE under scenario 2.
Energies 14 03115 g010
Figure 11. Comparison of emissions through electricity consumption under different scenarios in a reference cement plant in DE.
Energies 14 03115 g011
Figure 12. Comparison of expenditure through electricity consumption under different scenarios in a reference cement plant in DE.
Energies 14 03115 g012
Figure 13. Comparison of emissions through electricity consumption under different scenarios in a reference cement plant in UAE.
Energies 14 03115 g013
Figure 14. Comparison of expenditure through electricity consumption under different scenarios in a reference cement plant in UAE.
Energies 14 03115 g014
Figure 15. Differences in electricity expenditure in a reference cement plant, with and without WHR captive plant, under different carbon tax scenarios.
Energies 14 03115 g015
Figure 16. Conceptualisation of the proposed model for the future encompassing all the major mitigation methods currently applicable to a cement plant. The colours indicate the grouping of elements as per the mitigation strategy; red—captive power generation, orange—efficiency improvements, purple—carbon capture, teal—fuel substitution and indigo —clinker substitution.
Energies 14 03115 g016
Table 1. Description of the variables utilised in the proposed model.
NomenclatureDescriptionEquation/ValueUnits/Timestep
Input Parameters and Exogenous Variables
<Plant electricity requirement>Amount of electricity required for plant operations.-KWh
<Percentage of captive power generation>Parameter is used to determine amount of electricity requirement is met through captive power generation.--
<Carbon tax rate>Parameter is used to set the carbon tax rate for a ton of CO2 emissions.-USD/ton
<Subsidy rate>Parameter is used to set the subsidy rate for renewable energy generation. -USD/kWh
<Percentage of captive power generated from WHR>Parameter is used to set the amount of captive power generated from WHR.--
<Percentage of captive power generated from SPV>Parameter is used to set the amount of captive power generated from Solar PV.--
<Percentage of captive power generated from NG/Coal>Parameter is used to set the amount of captive power generated from natural gas or coal.--
<Operations nad Maintenance cost—WHR>Cost of operation and maintenance per unit of electricity generated through WHR plant. Dataset for the duration of the simulation is prepared as per the trends in regional consumer price index.From input datasetUSD/kWh
<Operations and Maintenance cost—SPV>Cost of operation and maintenance per unit of electricity generated through solar photovoltaic panels. Dataset for the duration of the simulation is prepared as per the trends in regional consumer price index.From input datasetUSD/kWh
<Operations & Maintenance cost—NG/Coal>Cost of operation and maintenance per unit of electricity generated through natural gas or coal plant. Dataset for the duration of the simulation is prepared as per the trends in regional consumer price index.From input datasetUSD/kWh
<Cost of NG/Coal>Cost of natural gas/coal to generate a unit of electricity. Dataset for the duration of the simulation is prepared as per the forecasted trends of coal and natural gas prices. From input datasetUSD/kWh
<Grid electricity prices>Cost per unit of electricity purchased from the regional grid. Dataset for the duration of the simulation is prepared as per the forecasted trends of average industrial grid tariffs for applicable regions.From input datasetUSD/kWh
<Grid emission factor>CO2 emissions per unit of electricity procured from the regional grid. Dataset for the duration of the simulation is prepared as per the forecasted trends of average emission intensity.From input datasetTons/kWh
Constants
<CAPEX—WHR>Capital expenditure for constructing a WHR plant (per unit of electricity). Calculated based on inputs from industrial sources and public reports.Calculated as per target regionUSD/kWh
<CAPEX—SPV>Capital expenditure for constructing a SPV (per unit of electricity). Calculated based on inputs from industrial sources and public reports.Calculated as per target regionUSD/kWh
<CAPEX—NG/Coal>Capital expenditure for constructing a NG/Coal plant (per unit of electricity). Calculated based on inputs from industrial sources and public reports.Calculated as per target regionUSD/kWh
<CO2 emission factor for NG/Coal>CO2 emissions generated from NG/Coal plant per unit of electricity. Calculated based on the emission factor and calorific value of Bituminous coal. 0.95   ·   10 3 Tons/kWh
Dynamic Variables
Net electricity bought from gridAmount of electricity purchased from the regional grid.= <Plant electricity requirement> ∗ (1-<percentage of captive power generation>)KWh
Emissions through purchased electricityCalculated CO2 emissions for the purchased electricity.= Net electricity bought from grid ∗ <grid emission factor>Tons
Cost of purchased electricityCalculated cost of purchased electricity.= Net electricity bought from grid ∗ <grid electricity prices>USD
Net captive electricity generatedCombined captive electricity generated in the plant from WHR, SPV and NG/Coal.= <Plant electricity requirement> ∗ <percentage of captive power generation>KWh
Electricity generated from WHRAmount of electricity generated from the WHR plant.= Net captive electricity generated ∗ <percentage of captive power generated from WHR>KWh
Cost of power generation from WHRCalculated cost of electricity generated from the WHR plant.= (Electricity generated from WHR ∗ <operations and maintenance costWHR>) + (electricity generated from WHR ∗ <CAPEXWHR>)USD
Electricity generated from SPVAmount of electricity generated from SPV.= Net captive electricity generated ∗ <percentage of captive power generated from SPV>KWh
Cost of power generation from SPVCalculated cost of electricity generated from SPV.= (Electricity generated from SPV ∗ <operations and maintenance costSPV>) + (electricity generated from SPV ∗ <CAPEXSPV>)USD
Total renewable energy generatedCombined amount of renewable energy generated within the plant, WHR and SPV.= Electricity generated from SPV + electricity generated from WHRKWh
Electricity generated from NG/CoalAmount of electricity generated from the NG/Coal plant.= Net captive electricity generated ∗ <percentage of captive power generated from NG/Coal>KWh
Cost of power generation from NG/CoalCalculated cost of electricity generated from the NG/Coal plant.= (Electricity generated from NG/coal ∗ <operations and maintenance costNG/coal>) + (electricity generated from NG/coal ∗ <CAPEXNG/Coal>) + (electricity generated from NG/coal ∗ <cost of NG/coal>)USD
Emissions from captive power generationCalculated amount of CO2 emissions released from the captive natural gas/coal plant.= Electricity generated from NG/coal ∗ <CO2 emission factor for NG/coal>Tons
Cost of captive power generationCombined cost of electricity generated within the plant.= Cost of power generation from NG/coal + cost of power generation from SPV + cost of power generation from WHRUSD
Total emissions from electricity useCombined amount of CO2 emissions released from the plant through electricity usage (monthly).= Emissions from captive power generation + emissions through purchased electricityTons
Total plant electricity expenditureCombined amount of plant expenditure on electricity usage (monthly).= Cost of captive power generation + cost of purchased electricityUSD
Carbon tax on emissions from electricity useCalculated amount of tax levied for CO2 emissions from the plant (exclusively from electricity usage).= Total emissions from electricity use ∗ <carbon tax rate>USD
Subsidy for renewable power generationCalculated amount of subsidy awarded to the plant for renewable energy generation.= Total renewable energy generated ∗ <subsidy rate>USD
Stocks
Total CO2 emissions 1Holds the total amount CO2 emissions from the plant through electricity usage at the end of the simulation run (25 years). Initialised to 0. T o t a l   C O 2   e m i s s i o n s   ( t ) = t 0 t ( N e t   m o n t h l y   C O 2   e m i s s i o n s   ( s ) ) d s +   T o t a l   C O 2   e m i s s i o n s   ( t 0 ) Tons
Total electricity expenditure 1Holds the total expenditure on electricity usage at the end of the simulation run (25 years). Initialised to 0. T o t a l   e l e c t r i c i t y   e x p e n d i t u r e   ( t ) = t 0 t ( N e t   m o n t h l y   e x p e n d i t u r e ( s ) ) d s   + T o t a l   e l e c t r i c i t y   e x p e n d i t u r e   ( t 0 ) USD
Flows
Net monthly CO2 emissions (electricity module)Calculated monthly CO2 emissions from the plant (exclusively from electricity usage).= Total emissions from electricity useTons
Net monthly expenditure (electricity module)Calculated monthly expenditure on electricity usage.= (Total plant electricity expenditure + carbon tax on emissions from electricity usesubsidy for renewable power generation)USD
1 Where t is the current time-step, t0 is the initial time-step, and s is a time-step between t and t0.
Table 2. Quantitative simulation results of the first 31 time-steps calculating the differences in electricity expenditure, with and without WHR captive plant, under different carbon tax scenarios.
MonthNo Carbon TaxCarbon Tax—60 to 120 USD/TonCarbon Tax—100 to 200 USD/TonCarbon Tax—150 to 300 USD/Ton
1−1.132−1.039−0.977−0.899
2−0.776−0.590−0.465−0.310
3−0.420−0.1400.0470.280
4−0.0640.3100.5590.871
50.2930.7611.0721.462
60.6501.2121.5862.054
71.0071.6632.1002.647
81.3642.1152.6153.241
91.7222.5673.1313.836
102.0793.0203.6474.431
112.4373.4734.1645.027
122.7963.9274.6815.624
133.1544.3815.1996.221
143.5134.8365.7176.820
153.8715.2906.2367.418
164.2295.7446.7548.017
174.5876.1997.2738.616
184.9456.6537.7929.215
195.3037.1088.3119.815
205.6607.5628.83010.415
216.0178.0179.34911.015
226.3748.4719.86911.616
236.7318.92610.38812.217
247.0889.38010.90812.818
257.4449.83511.42813.420
267.80110.28911.94814.022
278.15810.74412.46914.625
288.51511.20012.99015.228
298.87211.65613.51215.833
309.22912.11314.03516.438
319.58712.57014.55817.044
Publisher’s Note: MDPI stays neutral with regard to jurisdictional claims in published maps and institutional affiliations.

