Article

In-Cylinder Pressure Based Engine Knock Classification Model for High-Compression Ratio, Automotive Spark-Ignition Engines Using Various Signal Decomposition Methods

School of Energy Systems Engineering, Chung-Ang University, 84 Heukseokro, Seoul 06974, Korea
Energies 2021, 14(11), 3117; https://doi.org/10.3390/en14113117
Submission received: 4 May 2021 / Revised: 19 May 2021 / Accepted: 24 May 2021 / Published: 26 May 2021
(This article belongs to the Section I2: Energy and Combustion Science)

Abstract

:
Engine knock determination has been conducted in various ways for spark timing calibration. In the present study, a knock classification model was developed using a machine learning algorithm. Wavelet packet decomposition (WPD) and ensemble empirical mode decomposition (EEMD) were employed for the characterization of the in-cylinder pressure signals from the experimental engine. The WPD was used to calculate 255 features from seven decomposition levels. EEMD provided total 70 features from their intrinsic mode functions (IMF). The experimental engine was operated at advanced spark timings to induce knocking under various engine speeds and load conditions. Three knock intensity metrics were employed to determine that the dataset included 4158 knock cycles out of a total of 66,000 cycles. The classification model trained with 66,000 cycles achieved an accuracy of 99.26% accuracy in the knock cycle detection. The neighborhood component analysis revealed that seven features contributed significantly to the classification. The classification model retrained with the seven significant features achieved an accuracy of 99.02%. Although the misclassification rate increased in the normal cycle detection, the feature selection decreased the model size from 253 to 8.25 MB. Finally, the compact classification model achieved an accuracy of 99.95% with the second dataset obtained at the knock borderline (KBL) timings, which validates that the model is sufficient for the KBL timing determination.

1. Introduction

Knocking is the most critical combustion phenomena in spark ignition engines. Knocks are considered as the noise perceived via the engine structure due to the spontaneous ignition of a portion of the end-gas [1]. Moreover, the end-gas area is larger in the knocking cycle than in the normal cycle [2]. Knocking can lead to severe damage in the in-cylinder components such as the piston, piston rings, cylinder liner, spark plug, and valves. In recent years, there has been an increase in the significance of knock phenomena due to the increased compression ratio and power density of modern gasoline engines. The knock tendency is a function of various parameters, which include the compression ratio, fuel grading, and spark timings. Knock suppression can be achieved by the use of exhaust gas recirculation (EGR), proper injection techniques, the enhancement of the tumble and squish flows [3], modification of the autoignition characteristics by hydrogen enrichment [4], and water addition [5]. For a specific engine under given operating conditions and a known fuel, the spark timing control is an effective method for the suppression of knocking. Although it soothes knocking, the spark timing retard deteriorates the fuel economy. Thus, the spark timing is generally set at the instance when the first knock is observed. Such a spark timing is referred to as the knock borderline (KBL) timing or knock-limited maximum brake torque timing [6]. Therefore, significant research attention has been directed toward the development of a reliable knock detection method, possibly by the examination of individual engine cycles in real-time and the distinction between knock cycles and normal non-knock cycles.
It should be noted that preprocessing can distort the in-cylinder pressure characteristics required for the accurate evaluation of the knock intensity. Maurya et al. [7] carried out various digital signal processing techniques on the in-cylinder pressure traces from a homogenous charge compression ignition (HCCI) engine. The power spectrum results revealed that smoothing and averaging eliminated most of the high-frequency components from the in-cylinder pressure signal.
Several knock intensity metrics have been developed for the quantification of the knocking intensity, most of which are based on the in-cylinder pressure oscillation. Shu et al. [8] evaluated two knock intensity parameters calculated using the maximum amplitude of pressure oscillation (MAPO) [9] and the knock intensity factor for the 20 crank angle (CA) range [10] methods at various engine speeds. It was concluded that the KI20 knock metric was superior to MAPO due to its more significant pressure oscillation information.
Shen et al. [11] developed a knock intensity metric based on the resonant frequency of the in-cylinder pressure. The in-cylinder pressure traces from the engine speed within the range of 800–2000 rev/min were employed for the development of the parameters. The proposed knock metric exhibited a high signal-to-noise ratio and required a shorter computational time than the reference knock parameter based on the average energy calculated over a frequency range of 6–25 kHz.
Ettefagh et al. [12] investigated knock detection based on the engine block vibration using an auto regressive moving average (ARMA) model. The vibration signal from an accelerometer was obtained during the operation of the experimental engine at 600 rev/min. It was found that the fourth moving average parameter of the ARMA model exhibited significant discrepancies between the non-knock and knock phenomena. Moreover, the proposed method could detect the weakest knock.
Bares et al. [13] suggested a knock probability estimation based on the in-cylinder temperature and exogenous noise. The trapped mass estimated from the in-cylinder temperature improved the accuracies of the air mass flow rate measurement and knock probability estimation. The results revealed that the random nature of knocking can be attributed to the irregularity in the in-cylinder temperature. Moreover, the model could predict the knock probability during the estimation of the trapped mass from the resonant content of the in-cylinder pressure.
Molinaro et al. [14] developed pattern classification techniques for knock detection based on the vibration signal from a piezoelectric accelerometer. The classification techniques were evaluated using 144 vibration cycles, which consisted of 88 knock cycles and 56 normal cycles. Based on the validation of the techniques based on 500 cycles and five engine speeds, the classification techniques decreased the false alarm rates to 0–5% at all of the engine speeds. Moreover, the conventional detector exhibited knock detection errors of 2–30%.
To obtain accurate results, an appropriate signal processing technique should be selected for the given in-cylinder pressure signals from the engine. Liu et al. found that the deflation method is effective in vibration signal separation [15]. Moreover, reweighted singular value decomposition (RSVD) exhibited a remarkable denoising performance in the detection of faults in rotary machines by enhancing the weak significant features [16].
Since Huang et al. first introduced the empirical mode decomposition [17], empirical mode decomposition (EMD) has been widely used in signal analysis and fault diagnosis [18]. Since it decomposes high-frequency oscillating signal components from low-frequency oscillating components [19], the EMD method is suitable for the in-cylinder pressure signal processing. The numbers of peaks, zero crossing, entropy, and sifting were extracted from the resultant intrinsic mode functions (IMF).
Wavelet packet decomposition (WPD) is one of the promising decomposition methods applicable for evaluating harmonic distortion in power systems [20]. WPD, essentially the same as discrete wavelet transform (DWT), provides 2n sets of wavelet coefficients, whilst DWT produces only n + 1 sets of wavelet coefficients. Subasi et al. [21] concluded that WPD was superior to EMD and DWT in the seizure onset determination in the electroencephalogram recordings.
Recent approaches based on neural networks exhibit improved knock prediction performances. Bennett et al. [22] reconstructed the in-cylinder pressure from accelerometer measurements using a recurrent nonlinear autoregressive with exogenous input (NARX) neural network. The neural network model was then trained using the robust adaptive gradient descent (RAGD) algorithm. The trained model exhibited a 5% error in the peak in-cylinder pressure values and 2-CA error in the peak in-cylinder pressure location at an engine speed of 1000 rev/min. A highly accurate in-cylinder pressure estimation technique based on the cylinder block vibration can provide a substantial cost reduction in knock prediction. Multilayer neural networks can potentially be used to extract the in-cylinder pressure information, peak pressure, and timing from the crank speed signal [23].
In this study, several conventional knock classification methods were thoroughly reviewed and applied to the present experimental data as comparison to the proposed machine learning model performance. Firstly, an algorithm was developed that can detect whether an individual cycle is a knock or normal cycle based on the in-cylinder pressure trace. The feature extraction was based on the WPD and EEMD, and it was trained via the supervised machine learning technique. In most previous studies, the in-cylinder pressure or accelerometer signals of several representative knock cycles from limited engine operating conditions were analyzed using various signal processing techniques. The proposed knock determination algorithm is a standalone model that can classify individual cycles in real time. The model algorithm was trained using several knock cycles with significantly different intensities under various operating conditions, and its accuracy was verified under a different dataset under normal operating conditions. In addition, the proposed model was sufficiently compact to be embedded in a microcontroller for real-time monitoring.

2. Materials and Methods

2.1. Instrumentation

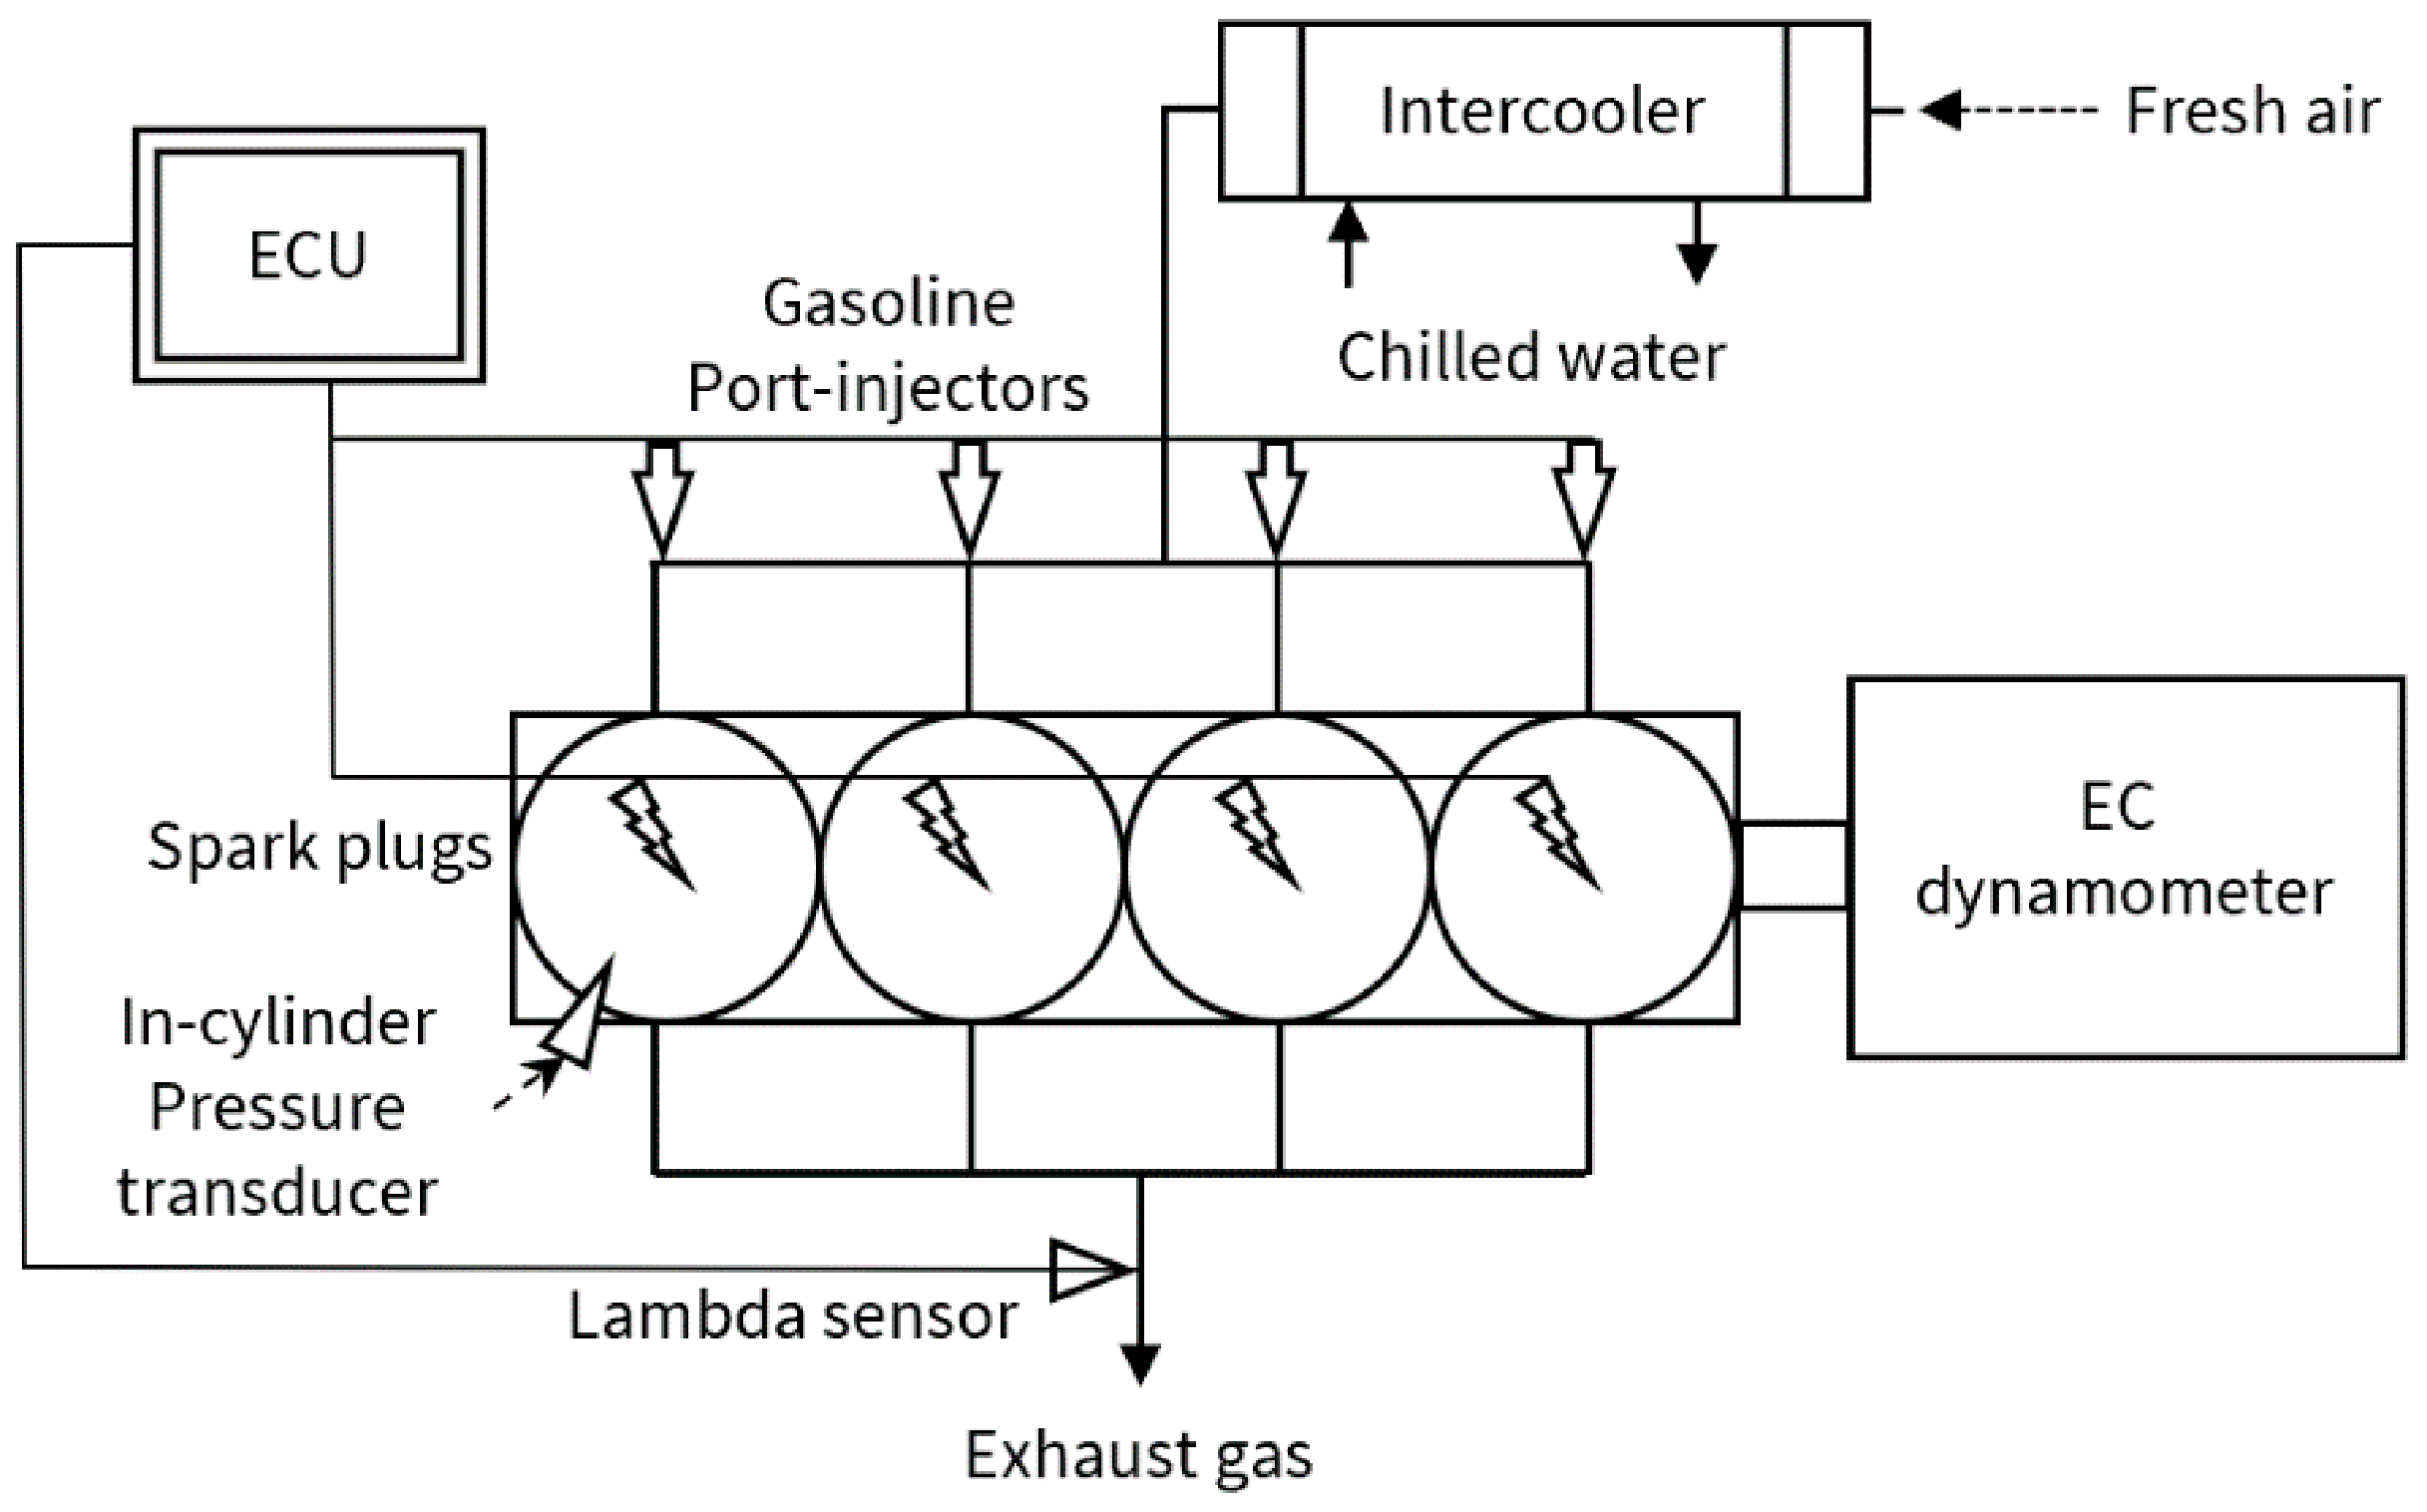
The experimental engine was a natural-aspired, four-cylinder, spark-ignition engine for automotive applications. The engine specifications are listed in Table 1. An eddy-current (EC) dynamometer was coupled with the engine for loading. A stock electric starter motor was employed to initiate the engine rotation, given that an EC dynamometer cannot start an engine. When the engine speed reached a given level, fuel injection and spark ignition were provided for the engine to run. The dynamometer controlled the engine for operation at the target engine speed. Figure 1 shows the schematic of the experimental facility.
The spark timing was controlled using the engine control system, which consisted of a stock engine control unit (ECU) and emulator (ETK, ETAS, Bosch). The fuel injection timings and valve timings were not changed. Moreover, the stock components in the fuel injection and spark ignition systems were employed as obtained.
The external engine cooling system circulated the engine coolant through a water-cooled heat exchanger. The stock engine thermostat was disabled; thus, the coolant fluid was consistently directed toward the external cooling system. The coolant temperature at the engine inlet was maintained at the desired temperature using a chilled water system from the laboratory and an electric heater. The heater was used only for the engine startup and low load operations.
Four piezo-electric pressure transducers (6113B, Kistler, Switzerland) were installed on the four cylinders for in-cylinder pressure measurements. Each transducer was installed on a hole with M10 thread machined on the engine head near the spark plug. It should be noted that the pressure transducer is a reliable tool for in-cylinder pressure measurements in internal combustion engine research. The specification of the pressure transducer is listed in Table 2. The crank angle was determined using an encoder installed on the crank shaft, with a CA resolution of 0.1. The corresponding sampling frequency was 180 kHz at the engine speed of 3000 rev/min. A high-speed data acquisition and combustion analyzer system (Indicom, AVL, Austria) was employed to display the real-time in-cylinder pressure traces, and to record the pressure data over 300 consecutive cycles.

2.2. Engine Experiments

Two experiments were conducted to obtain two separate datasets. The two datasets were obtained at three different speed levels and under two load conditions. In particular, the engine was operated under conditions that are common in daily use. The target engine speed and brake mean effective pressure (BMEP) of the two datasets are presented in Table 3 and Table 4. After the engine reached the steady condition at desired point, spark timing was advanced by 0.75 CA to induce knocking until severe knocking was observed. The resultant spark timings indicate substantial advance as shown in Table 3 and Table 4. Then, data was acquired repeatedly 5–15 times to obtain total 30 knock cycles at each point. Each run acquired 1200 consecutive cycles from four cylinders. The first dataset included 66,000 cycles from 55 runs under the six points, whereas the second dataset consisted of 25,200 cycles from 21 runs under five points. The first dataset was employed for the development of the model, whereas the second dataset was employed for the validation of the model, which was acquired at the KBL spark timings.
The KBL spark timing at each operating point was first determined from the spark timing sweep. The KBL timing was determined based on the knock audibility. A 10-mm diameter copper tube with a length of 6 m was fixed on a bolt head of the engine cylinder block near Cylinder 1. The sound due to knocking was transmitted through the copper tube; thus, rendering the knocking audible to an engine operator via the other end of the tube. Moreover, the test cell door was kept closed to filter out the engine noise from the knocking sound. This is the standard procedure in the spark timing calibration that has been employed in automotive industry for many decades.
In the first experiment, the spark timing of the Cylinder 1 was advanced to induce severe knocking, whereas the spark timings of the other three cylinders were kept at the KBL timing. The tables below reveal that a minimum of three sets of data logging were carried out at all operating points. The spark timing was advanced until the number of knock cycles reached 30 over 300 consecutive cycles. While advancing the spark timing, the operator acquired 300 cycles at each timing and then checked the knock intensities of the 300 cycles. The Indicom combustion analyzer provided the knock intensity parameter referred to as KI_AVL. As shown in Table 3, data logging was carried out more at Points 1, 3, and 5 than the other three points, given that knocking occurred less frequently under low load conditions.
Table 4 lists the second experiment, where spark timings of all the cylinders were maintained at the KBL timings for the normal engine operation. Thus, only a few and mild knock cycles were obtained from this experiment. The classification model was validated with the mild knock cycles from this second experiment. In order for the model to determine the KBL timing, it is crucial to be able to identify low-intensity knock cycles. Figure 2 shows the flow chart of the present study.

2.3. Classification Model Development

2.3.1. In-Cylinder Pressure Trace

The Kistler pressure transducer transmitted a voltage signal in the range of 0–5 V for a gauge pressure of 0–12 MPa. The voltage signal was first converted to the gauge pressure values using the calibration curve. The pressure was then pegged under the assumption of a polytropic process.
The 300 consecutive cycles from each of the four cylinders, which amounted to 1200 cycles, were obtained under each set of operating conditions. The individual in-cylinder pressure traces were used in several conventional knock determinations using the combustion timings, the knock intensity calculation, and signal processing procedures for the development of the classification model.

2.3.2. Heat-Release-Rate Analysis

A heat-release-rate (HRR) analysis was conducted to determine the combustion timings. The HRR also reveals the autoignition phenomena in knock cycles. The HRR was estimated from the measured in-cylinder pressure under the assumption of a uniform temperature throughout the cylinder during the combustion process [1]. A Savitzky–Golay filter was applied to the in-cylinder pressure for the elimination of the pressure oscillation [24]. Preliminary filter tests were then conducted, which confirmed that the characteristics of the combustion event were preserved in the smoothed pressure trace; whereas the oscillation amplitude decreased. The net heat release rate equation (Equation (1)) was derived from the 1st law of thermodynamics, whereas the heat transfer estimation was required to obtain the gross heat release rate.
d Q n d t = γ γ 1 p d V d t + 1 γ 1 V d p d t
The reliability of the net heat release rate can be significantly improved by the use of the temperature-dependent specific heat ratio in place of a constant value. Gatowski et al. [25] formulated the specific heat ratio equation (Equation (2)) based on a single-cylinder engine experiment with indolene (C18H25) under stoichiometric operation.
γ = 1.392 8.13 × 10 5 × T c y l   K
The in-cylinder gas was assumed to be an ideal gas. The mass of the gas in the cylinder was then calculated from the residual mass fraction in [26]. It should be noted that Equation (3) was formulated under the assumption that the exhaust process is a polytropic process. The ideal gas law with the trapped mass was used to determine the bulk-gas temperature during the combustion process, which was substituted into Equation (2) to determine the specific heat ratio. Moreover, the trapped mass can also be determined from the direct transformation of the in-cylinder pressure resonance phenomenon [27].
  y R % = 100 × V B V E V O × P B P E V O 1 / γ e x h

2.3.3. Knock Cycle Determination

There are many schemes to determine the engine knock. Since no particular one is widely accepted as a universal knock detector, several methods collaborated to identify individual knock cycles. While acquiring data during the engine experiments, the spark timing advance was performed based on the combustion sound transmitted from the copper tube and the knock intensity parameter provided by the combustion analyzer in the data acquisition (DAQ) system. Subsequent data analysis determined individual knock cycles based on the shapes of the in-cylinder pressure trace and knock intensity developed in the present study.
Engine knocking is initiated by autoignition, which can be revealed on the net apparent heat release rate. Subsequent high-speed pressure wave propagates through the entire cylinder, which exhibits the ringing pattern on the in-cylinder pressure trace. Visual examination on the in-cylinder pressure and heat release rate traces of each cycle was performed for the autoignition and ringing. However, when knocking occurred at late combustion phase, the autoignition and ringing patterns are rather indecisive.
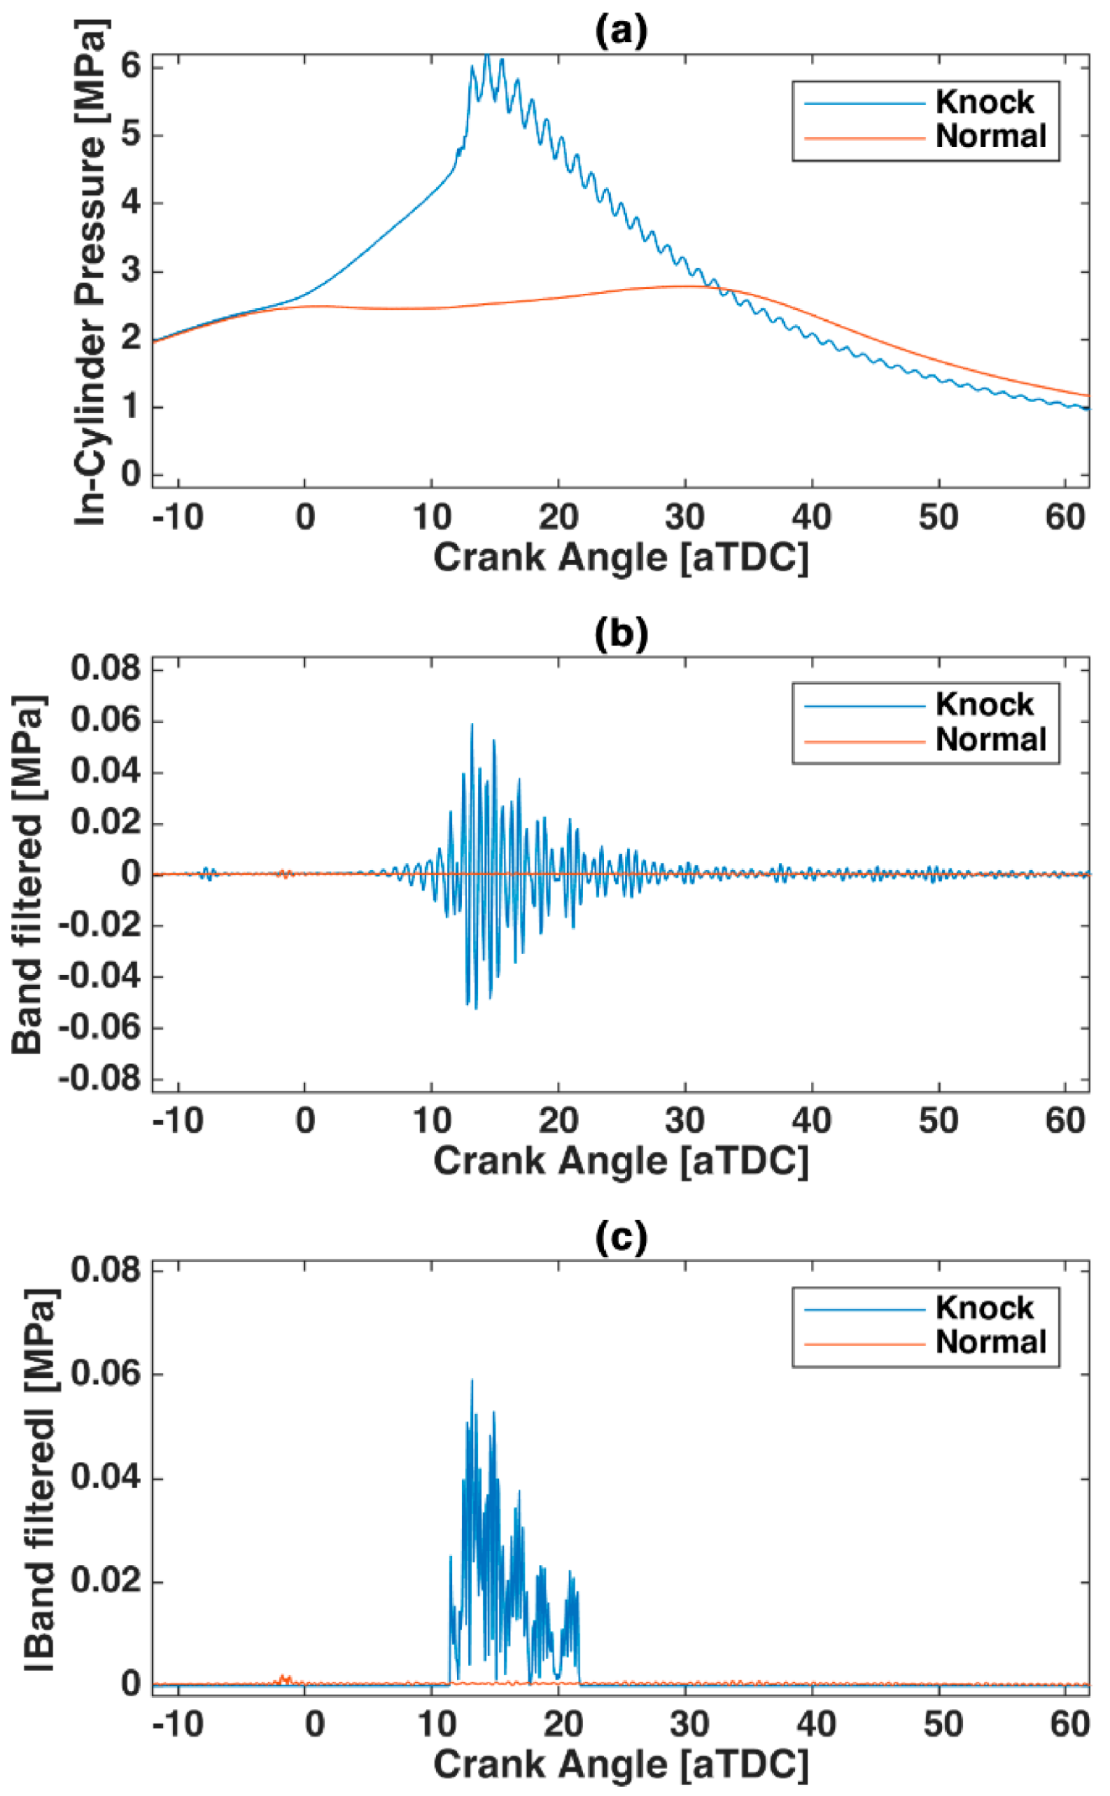
Figure 3 shows the signal processing procedure for individual knock cycle determination. First, the measured in-cylinder pressure trace was filtered using a bandpass filter as shown in Figure 3b. The high and low cut-off frequencies were then adjusted for optimal filtering. Then, the signal of which absolute values were lower than 0.012 MPa was filtered out. Figure 3c shows the substantial distinction between two cycles. Finally, the integration of the filtered signal in Figure 3c provided the quantitative intensity of the knocking. The resultant integration of knock intensity (IKI) in this study was compared with the knock intensity provided by the high-speed data acquisition system employed for the in-cylinder pressure measurements. The knock intensity parameter of the combustion analyzer in the DAQ system, which was denoted as KI_AVL, was used as the knock intensity in the automotive industry.

2.3.4. WPD Method

The knock detection model was developed using MATLAB. WPD was employed to extract features from the in-cylinder pressure signal [28]. Previous report has confirmed the effectiveness of the WPD method with respect to in-cylinder pressure characterization [29]. Although Fourier transform decomposes the signal using sines and cosines, the wavelet packet decomposes the signal into many subspaces using wavelet functions [28,30]. The decomposition includes the translation and scaling of the selected wavelet function, in addition to the projection of the signal onto the subspace. The number of decompositions was set as expressed by Equation (4). After decomposition, features were extracted from each subspace at each level, such as the root mean square, the variance of the signal, and other statistically significant parameters. The WPD method provided 255 features from seven decomposition levels for the training of the machine learning model. Table 5 lists the numbers of features from the seven decomposition levels.
N D = l o g L s i g n a l l o g   2

2.3.5. EEMD Method

The EEMD method is basically white noise added EMD. After a white noise is added onto the signal, the mode decomposition was performed as in EMD. The white noise forces the ensemble to exhaust all other components and averages them out, so that only the signal can remain. EEMD is superior to EMD since the white noise addition solves the mode-mixing problem in EMD [31].

2.3.6. Neighborhood Component Analysis (NCA)

Based on the prediction results, the feature selection was carried out by conducting an NCA for classification [32]. The NCA was conducted to evaluate the influence of the individual features on the prediction results. The NCA impact ranking of the features facilitated the selection of the significant features. The model was then retrained using the selected features. The retraining decreased the size of the model without impacting the prediction accuracy. The regularization parameter optimization was performed on basis of the regression loss. The value of the regularization parameter that exhibited the lowest regression loss was 1 × 10 5 .

2.3.7. Supervised Learning

A supervised learning algorithm was employed to obtain an inferred function based on the class labels. Moreover, several decision tree, k-nearest neighbors (KNN), and ensemble algorithms were evaluated. Although the singular value decomposition (SVD) is a well-known signal denoising tool [16], it was excluded because it required more computational time than the algorithms evaluated in this study, which were less complex. During the evaluations, 30% of the dataset was employed for validation. Two critical performance parameters considered were the accuracy and training time. Given that the training should be completed prior to embedding of the algorithm into the prediction model, the training time did not have an influence on the performance of the prediction model. However, a decrease in the training time of the selected algorithm decreased the overall time required for the development of the model.
The misclassification was weighted more significantly in the detection of all knock cycles. The misclassification of a normal cycle as a knock cycle was considered as overprediction, whereas the misclassification of a knock cycle as a normal cycle was considered as underprediction. It should be noted that the misclassification of several normal cycles as knock cycles was considered as acceptable, given that the model could identify all the knock cycles. Therefore, the resultant model tended to overpredict the knock cycles. In addition, the correction of the overpredicted cycles is more effective than the detection of missed knock cycles, given that the proportion of knock cycles is significantly greater than that of normal cycles.

3. Results and Discussion

From the knock cycle determination process 4158 cycles were classified as knock cycles from 66,000 cycles of 55 runs. Point 3 exhibited the highest number of knock cycles from 14 repeated runs. The number of knock cycles of the six operating points are listed in Table 6.

3.1. Combustion Characteristics

Figure 4 presents the in-cylinder pressure traces of one run at Point 6, which consisted of 209 knock cycles and 91 normal cycles. The 16 selected knock cycles varied from mild to severe ringing. Note that some retarded knock cycles exhibited only mild ringing. The significant increase in combustion with respect to the normal cycles indicated the autoignition prior to the knocking phenomena [2,33].
The heat release analysis results revealed the difference in the combustion timings between the knock and normal cycles, as shown in Figure 5. Three knock cycles with different knock intensities were selected for comparison. All three knock cycles exhibited autoignition with various magnitudes and similar onset timings. The net heat release rate traces indicate that the combustion advancement and autoignition were greater in the more severe knocking cases.
Given that the knock cycles exhibited a more rapid pressure rise and higher peak in-cylinder pressure than the average normal cycle, the pressure rise rate (PRR) and peak in-cylinder pressure (PIP) of the knock and normal cycles were investigated, as shown in Figure 6. With respect to the normal cycles, a linear relationship was observed between the PRR and PIP, whereas the two parameters of the knock cycles were slightly dispersed. Moreover, PRR and PIP were greater in the knock cycles than in the normal cycles. However, there was a substantial number of knock cycles in which PRR and PIP were similar to those of the normal cycles. As can be seen in Figure 5 (knock cycle + normal cycle average), there were several knock cycles that did not exhibit severe ringing, as observed from the in-cylinder pressure trace.
The knock cycles exhibited earlier CA10 (crank angle of 10% heat release) and CA50 (crank angle of 50% heat release), and consequently shorter durations between CA10 and CA50 than the normal cycles as shown in Figure 7 and Figure 8. Although the discrepancies between the knock and normal cycles were significant for all four parameters, the combustion timings and durations were insufficient in the individual knock cycle detection, given that several normal cycles exhibited combustion timings that were as advanced as the knock cycles.

3.2. The Conventional Knock Determinations

Figure 9 reveals that IKI and KI_AVL were in good agreement, with the exception of the cycles with very low knock intensities, i.e., normal cycles. The IKI analysis was applied only for the cycles wherein the filtered signal peaked above 0.12. Based on this criteria, 4158 cycles were identified as knock cycles. Thus, the IKI value of all the normal cycles was zero. Moreover, KI_AVL was calculated for all cycles. The two knock parameters indicated that the knock cycles in this study exhibited a wide range of knock intensities.

3.3. EEMD

Figure 10 shows that the first two IMF contained the high-frequency signal components due to the knocking phenomena. The peak and amplitude of the 1st and 2nd IMF seemed to be adequate for knock cycle determination. The pressure rise due to autoignition was not shown in any IMF, which was exhibited in the heat release rate traces as in Figure 5.

3.4. Supervised Learning Model for Knock Classification

All the algorithms demonstrated accuracies of 99.9–100%, as shown in Table 7. Thus, an algorithm was selected for the model development with respect to the training time. The boosted tree ensemble and random undersampling boost (RUSB) algorithms demonstrated the shortest training times of 6.5 and 5.9 s, respectively. Based on the comparison, the ensemble algorithm was selected for the predictive model.
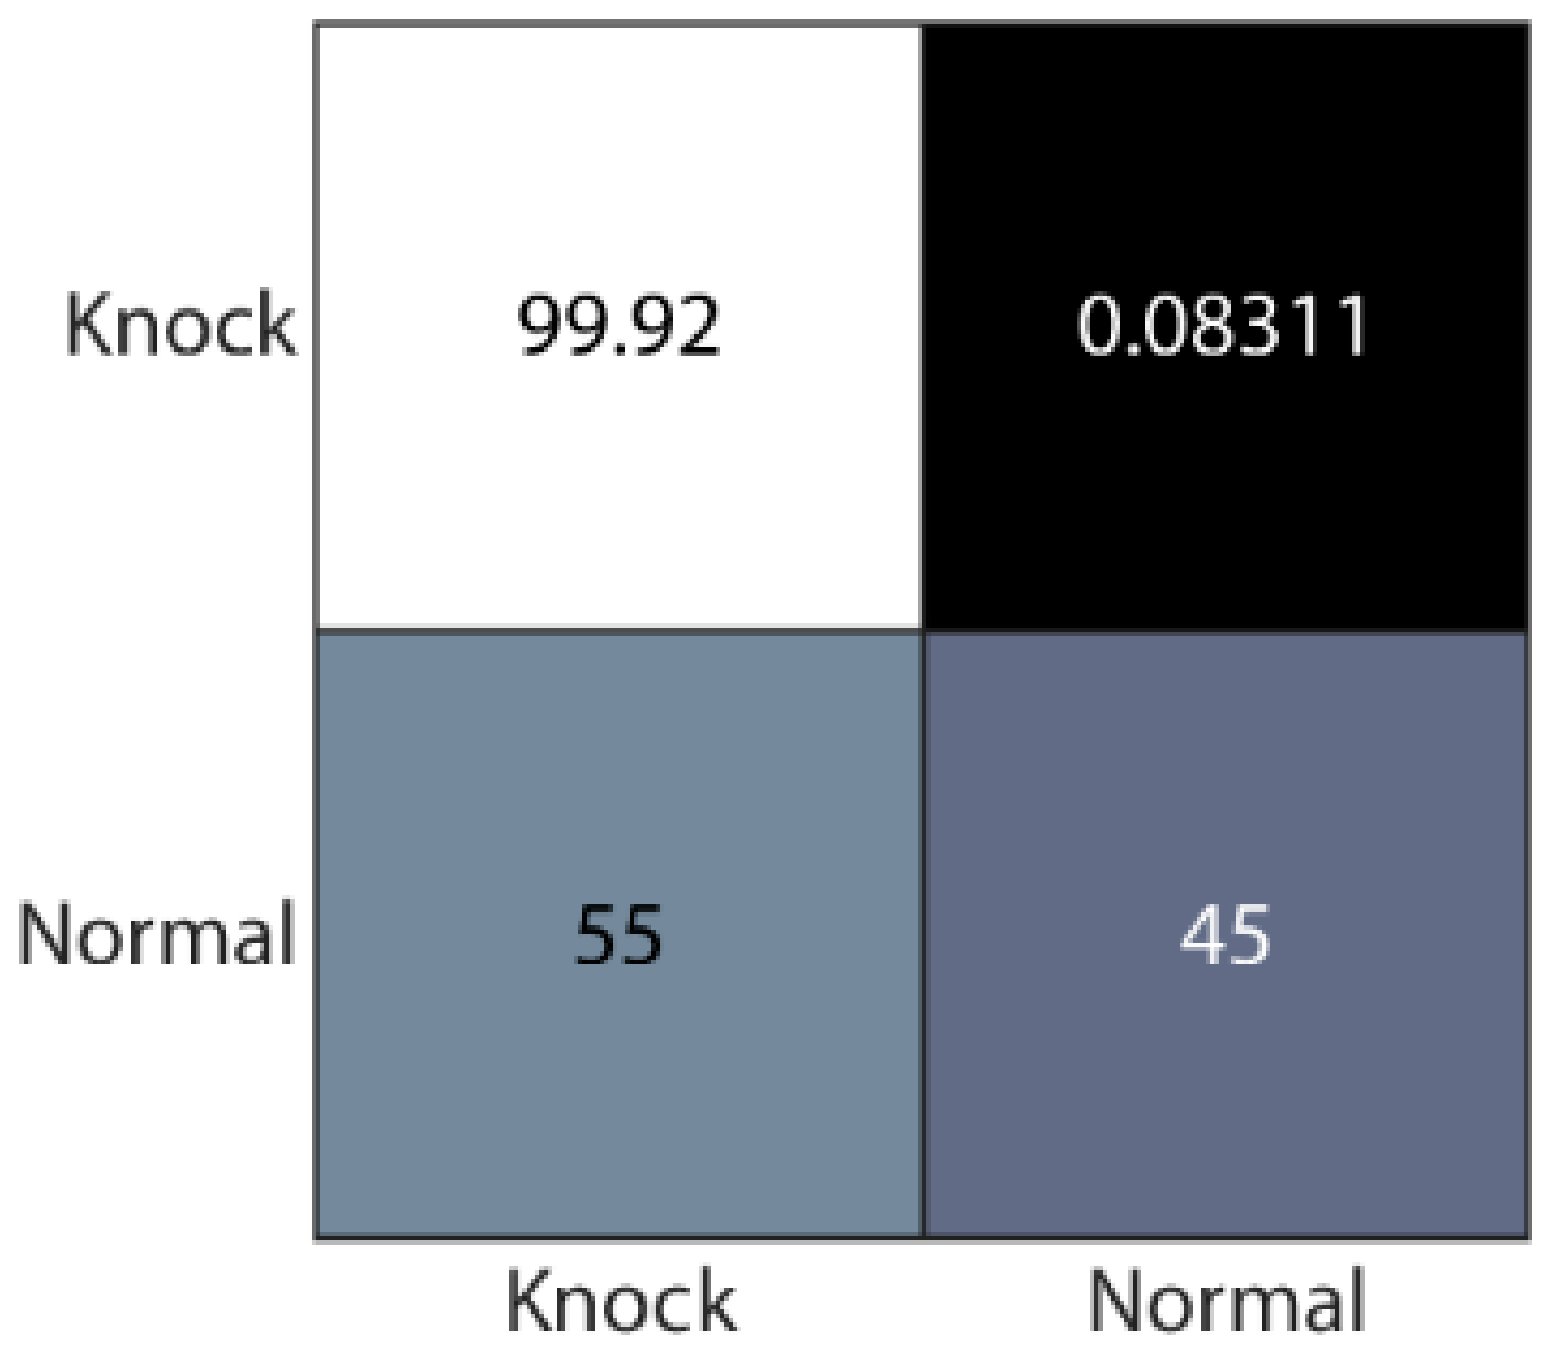
The proposed model was trained with 46,200 cycles, which amounted to 70% of the total dataset (66,000 cycles). The training dataset included 43,289 normal cycles and 2911 knock cycles. The remaining 30% of the dataset was employed for validation. The validation results in Figure 11 reveal that the proposed model detected 99.92% of the knock cycles, with a 55% misclassification of the normal cycles as knock cycles. The higher accuracy of the knock cycle prediction was because the misclassification weighting applied to the knock cycle prediction was greater by a factor of 10. In other words, the misclassification weighting was set such that the model does not misclassify knock cycles, although several normal cycles were misclassified as knock cycles.
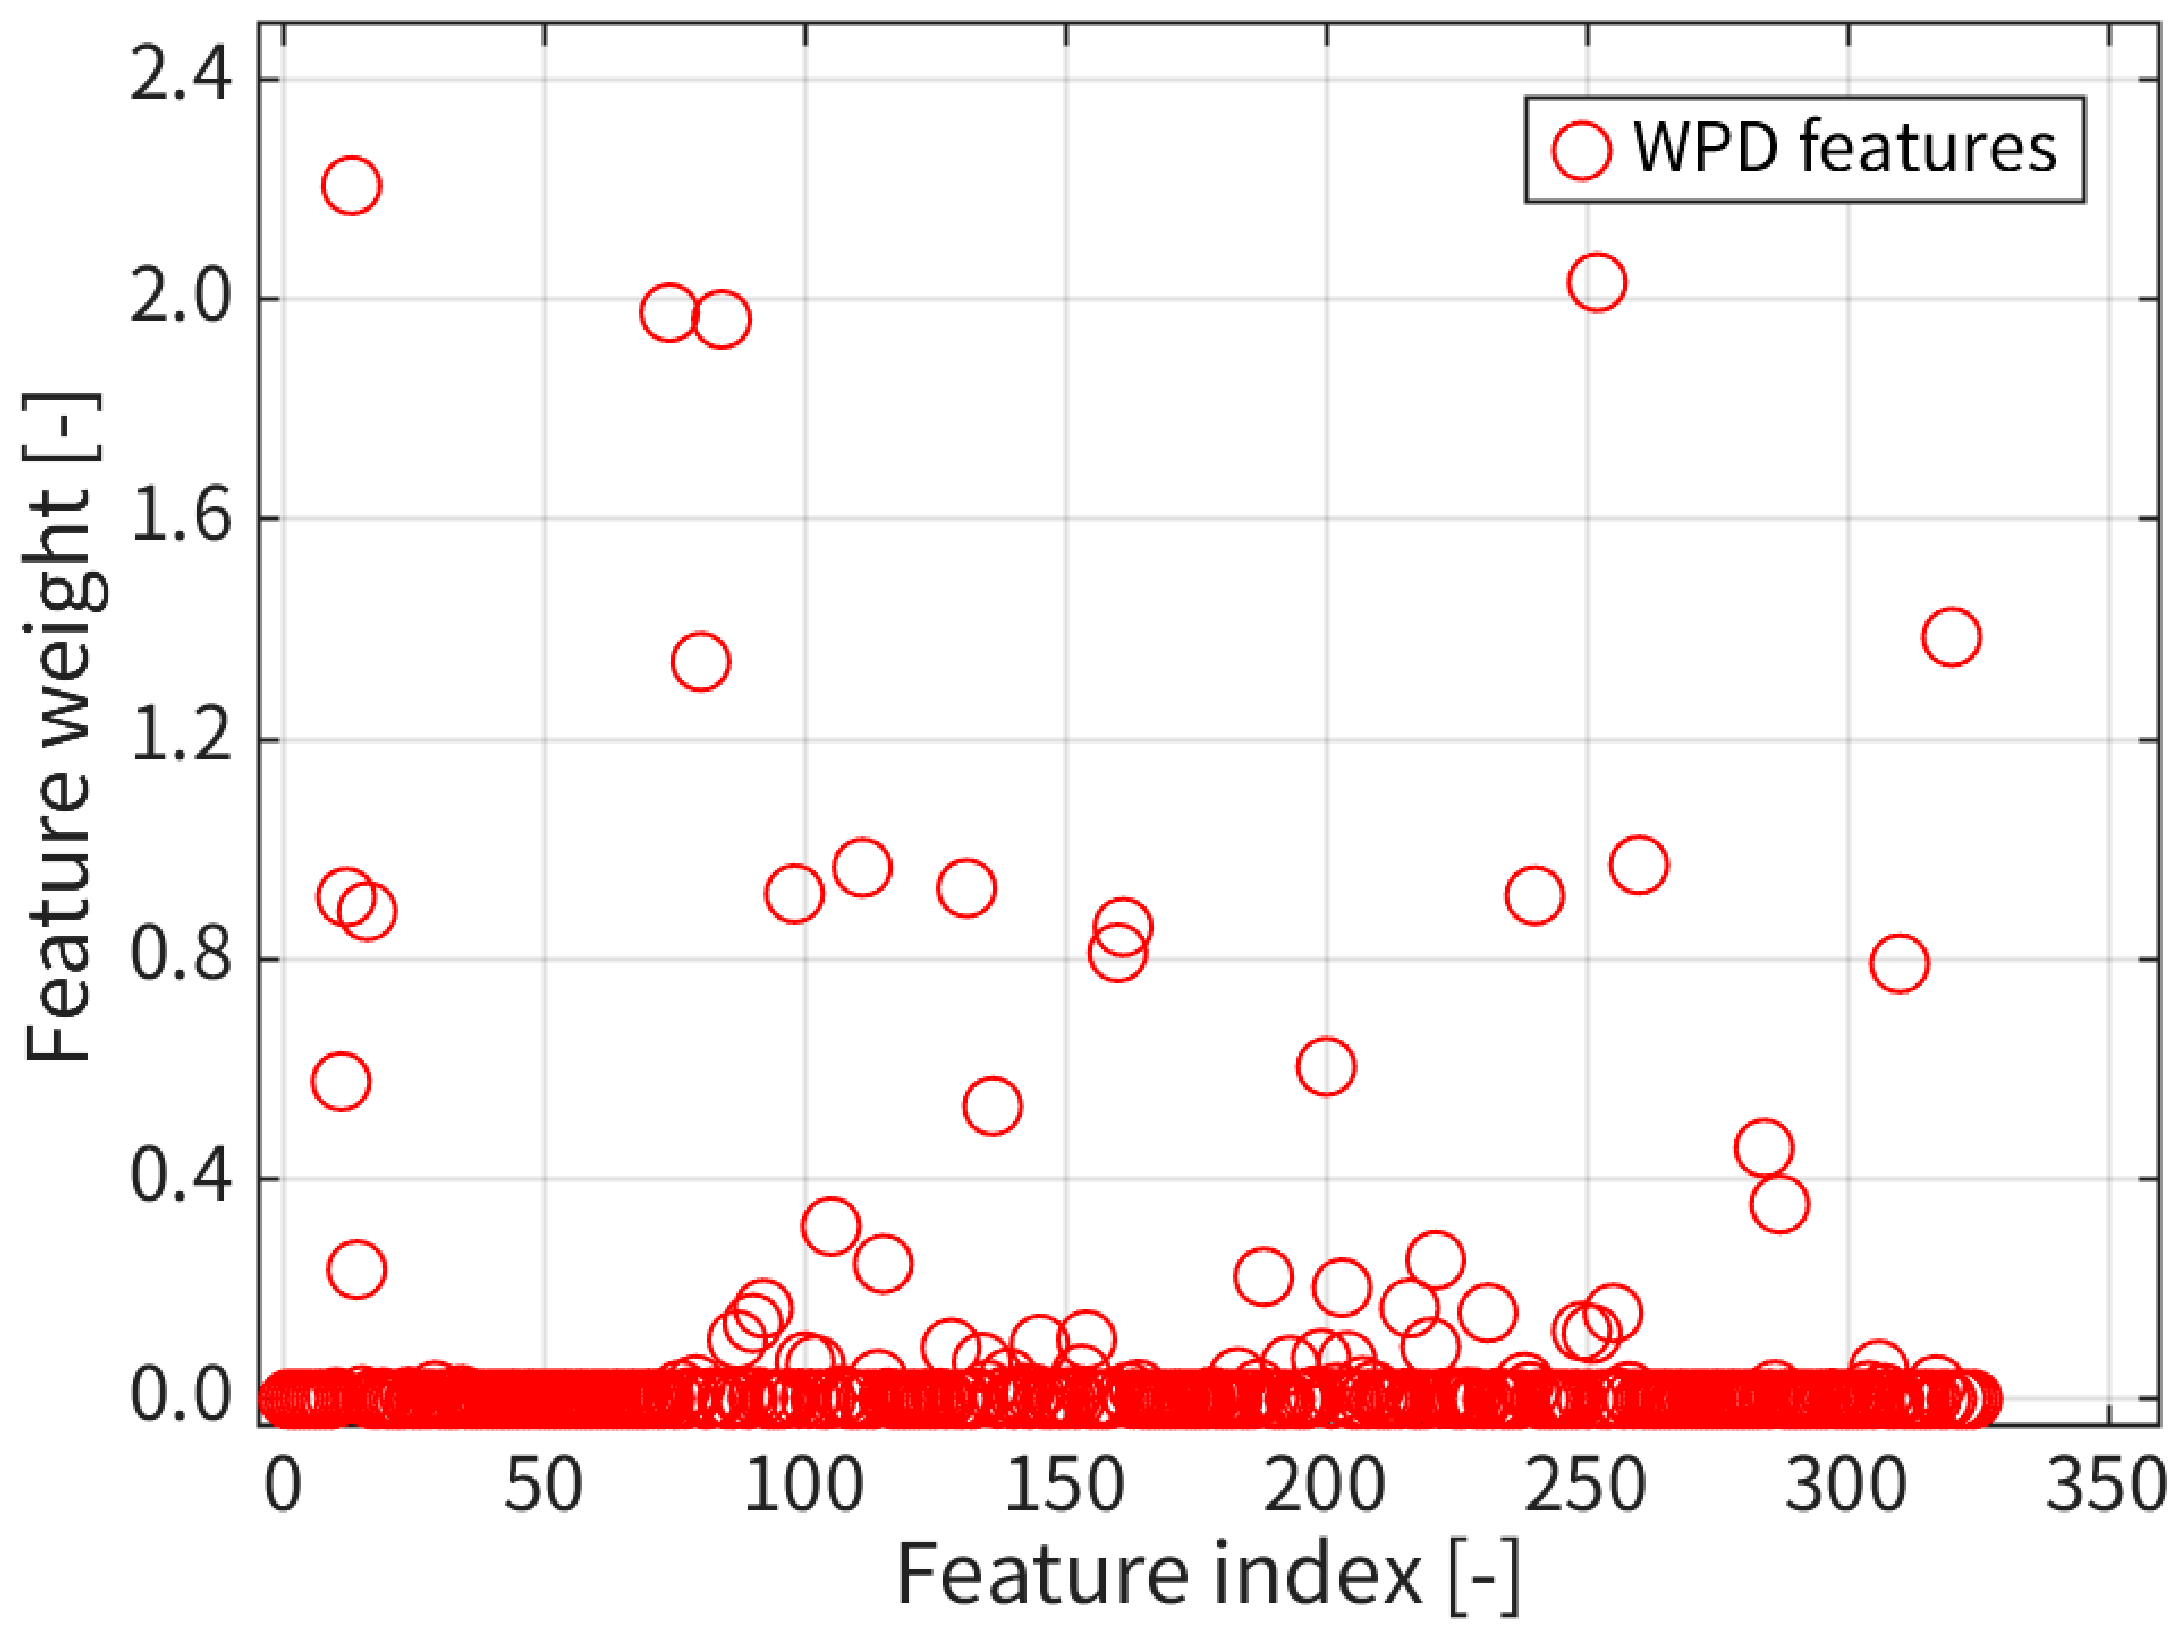
The NCA analysis was conducted to evaluate the weights of the 325 features obtained from the WPD. The feature weights represent the contributions to the classification accuracy. Figure 12 presents the weights of the 325 features employed in the proposed model. The NCA results indicated that 37 features were significant in the classification. The numbers of significant features from EEMD and WPD are 5 and 32, respectively. Only the peak values of IMF exhibited significance. The decomposition levels of the 32 significant features are listed in Table 8. As can be seen from the table, seven levels of decomposition were necessary to obtain all significant features.
The proposed model was retrained based on the same dataset using only the significant features. Based on the NCA analysis results, many features exhibited negligible weights. The features with near-zero weights contributed to the accuracy significantly less than those with high weights. Thus, low-weight feature elimination can significantly reduce the size of the model without impacting the accuracy. Figure 13 reveals that the reduced features improved the model accuracy. The retrained model with 37 selected features demonstrated exhibited substantial improvement in the normal cycle detection. In literature the use of selected features resulted in not only the computational time reduction, but also the classification accuracy improvement by minimizing possible misleading and overfitting [34].
The second dataset was employed for the validation of the determination model. The engine was operated under five different engine speed and load conditions. A total of 21 runs were taken from repeated operations. The operating conditions are presented in Table 1 and Table 2. Unlike the first experiment, the spark timings were set as the KBL timing to evaluate the performance of the classification model under normal engine operating conditions. Hence, the second dataset included only 25 knock cycles out of a total 25,200 cycles.
The validation results revealed that the original and retrained models achieved knock detection accuracies of 99.9% as shown in Figure 14. The two models demonstrated different performances in the normal cycle prediction. The removal of the insignificant features increased the overestimation rate from 10% to 30%.

4. Conclusions

A classification model was developed to distinguish between individual knock cycles and normal cycles using the machine learning algorithm with an in-cylinder pressure of 66,000 cycles under various engine speed and load conditions. The findings of this study are as follows:
The heat release analysis revealed that there were significant differences between the combustion timings of the normal and knock cycles. The CA10 and CA50 of the knock cycles were significantly earlier than those of the normal cycles. In addition, the knock cycles exhibited higher PRR and PIP values, which can be attributed to the progression of combustion with severe ringing. However, the parameters derived from the heat release analysis and in-cylinder pressure yielded an acceptable level of accuracy in the classification of the knock and normal cycles, given that several knock and normal cycles exhibited similar values.
The WPD and EEMD were effective signal processing techniques for the cycle characterization. The 325 features from seven decomposition levels were sufficient for the training of the classification model, which demonstrated an accuracy of 99.9% accuracy in the knock cycle detection. It should be noted that the model achieved a very high accuracy in the validation test and with the normal engine operation data, which included only mild knock cases.
The classification model using the features from the WPD and EEMD demonstrated an accuracy of 99.26% in the knock cycle detection. Moreover, the model demonstrated an accuracy of 99.96% using a different dataset. The second dataset was obtained from the engine experiments at the KBL spark timings. In particular, the model detected all the knock cycles, including those during the engine operation under the normal operating conditions. It should be noted that the knock intensities of the knock cycles from the normal operating conditions were significantly lower.
The NCA was found to effectively decrease the size of the classification model. When only the significant features, i.e., the significantly weighted features based on NCA, were employed to increase the compactness of the model; the size of the classification model decreased by 58%, whereas the knock detection accuracy was maintained at 99%. However, the compact model exhibited a marginal overestimation increase from 10% to 30% in the misclassification of normal cycles as knock cycles.
It should be noted that the knock cycles were initially classified based on the in-cylinder pressure trace, HRR, IKI, and KI_AVL. In actual engine calibration process, knock determination is often based on the engine sound. Even though the in-cylinder pressure-based determination is reliable, further investigation should be performed on the model validation with acoustic knock detection method as done in the spark timing calibration process. Once sufficiently validated, the proposed knock classification model can be implemented in the engine management system for real-time knock detection.
Funding

This work was supported by the National Research Foundation of Korea (NRF) grant funded by the Korea government (MSIT) (No. 2019R1F1A1056540), which also funded the article processing charge.

Institutional Review Board Statement

Not applicable.

Informed Consent Statement

Not applicable.

Data Availability Statement

Data sharing is not applicable to this article.

Acknowledgments

This work was supported by the National Research Foundation of Korea (NRF) grant funded by the Korea government (MSIT) (No. 2019R1F1A1056540). Author would like to convey special thanks to Hyundai-Kia Motor Company for invaluable support.

Conflicts of Interest

The author declares that there is no conflict of interest.

Nomenclature

EGRExhaust gas recirculation
KBLKnock borderline
HCCIHomogeneous charge compression ignition
MAPOMaximum amplitude of pressure oscillation
CACrank angle
ARMAAuto regressive moving average
RSVDReweighted singular value decomposition
EMDEmpirical mode decomposition
IMFIntrinsic mode functions
WPDWavelet packet decomposition
DWTDiscrete wavelet transform
NARXNonlinear autoregressive with exogenous input
RAGDRobust adaptive gradient descent
EEMDEnsemble empirical mode decomposition
ECEddy-current
ECUEngine control unit
BMEPBrake mean effective pressure
KBLKnock borderline
HRRHeat release rate
QnNet heat release
tTime
γSpecific heat ratio
PIn-cylinder pressure
VIn-cylinder volume
TcylIn-cylinder temperature
yRResidual mass fraction
VBIn-cylinder volume at exhaust manifold
VEVOIn-cylinder volume at exhaust valve opening
PBIn-cylinder pressure at exhaust manifold
PEVOIn-cylinder pressure at exhaust valve opening
DAQData acquisition
IKIIntegration of knock intensity
NDNumber of decompositions
LsignalSize of the signal
NCANeighborhood component analysis
KNNk-nearest neighbors
SVDSingular value decomposition
PRRPressure rise rate
PIPPeak in-cylinder pressure
RUSBRandom undersampling boost
CA10Crank angle of 10% heat release
CA50Crank angle of 50% heat release

References

  1. John, B. Heywood. In Internal Combustion Engine Fundamentals, 1st ed.; McGraw-Hill, Inc.: New York, NY, USA, 1988; ISBN 0-07-028637-X. [Google Scholar]
  2. Kawahara, N.; Kim, Y.; Wadahama, H.; Tsuboi, K.; Tomita, E. Differences between PREMIER Combustion in a Natural Gas Spark-Ignition Engine and Knocking with Pressure Oscillations. Proc. Combust. Inst. 2019, 37, 4983–4991. [Google Scholar] [CrossRef]
  3. Wang, Z.; Liu, H.; Reitz, R.D. Knocking Combustion in Spark-Ignition Engines. Prog. Energy Combust. Sci. 2017, 61, 78–112. [Google Scholar] [CrossRef]
  4. Jiang, X.; Deng, F.; Pan, Y.; Sun, W.; Huang, Z. Effect of Hydrogen Enrichment on the Auto-Ignition of Lean n-Pentane/Hydrogen Mixtures at Elevated Pressure. Int. J. Hydrog. Energy 2020. [Google Scholar] [CrossRef]
  5. Sun, W.; Huang, W.; Qin, X.; Deng, Y.; Kang, Y.; Peng, W.; Zhang, Y.; Huang, Z. Water Impact on the Auto-Ignition of Kerosene/Air Mixtures under Combustor Relevant Conditions. Fuel 2020, 267, 117184. [Google Scholar] [CrossRef]
  6. Daniel, R.; Tian, G.; Xu, H.; Wyszynski, M.L.; Wu, X.; Huang, Z. Effect of Spark Timing and Load on a DISI Engine Fuelled with 2,5-Dimethylfuran. Fuel 2011, 90, 449–458. [Google Scholar] [CrossRef]
  7. Kumar Maurya, R.; Pal, D.D.; Kumar Agarwal, A. Digital Signal Processing of Cylinder Pressure Data for Combustion Diagnostics of HCCI Engine. Mech. Syst. Signal Process. 2013, 36, 95–109. [Google Scholar] [CrossRef]
  8. Shu, G.; Pan, J.; Wei, H. Analysis of Onset and Severity of Knock in SI Engine Based on In-Cylinder Pressure Oscillations. Appl. Therm. Eng. 2013, 51, 1297–1306. [Google Scholar] [CrossRef]
  9. Sheppard, C.G.W.; Tolegano, S.; Woolley, R. On the Nature of Autoignition Leading to Knock in HCCI Engines; SAE International: Warrendale, PA, USA, 2002. [Google Scholar]
  10. Konig, G.; Sheppard, C.G.W. End Gas Autoignition and Knock in a Spark Ignition Engine; SAE International: Warrendale, PA, USA, 1990. [Google Scholar]
  11. Shen, X.; Zhang, Y.; Shen, T. Cylinder Pressure Resonant Frequency Cyclic Estimation-Based Knock Intensity Metric in Combustion Engines. Appl. Therm. Eng. 2019, 158, 113756. [Google Scholar] [CrossRef]
  12. Ettefagh, M.M.; Sadeghi, M.H.; Pirouzpanah, V.; Arjmandi Tash, H. Knock Detection in Spark Ignition Engines by Vibration Analysis of Cylinder Block: A Parametric Modeling Approach. Mech. Syst. Signal Process. 2008, 22, 1495–1514. [Google Scholar] [CrossRef]
  13. Bares, P.; Selmanaj, D.; Guardiola, C.; Onder, C. Knock Probability Estimation through an In-Cylinder Temperature Model with Exogenous Noise. Mech. Syst. Signal Process. 2018, 98, 756–769. [Google Scholar] [CrossRef]
  14. Molinaro, F.; Castanié, F. Signal Processing Pattern Classification Techniques to Improve Knock Detection in Spark Ignition Engines. Mech. Syst. Signal Process. 1995, 9, 51–62. [Google Scholar] [CrossRef]
  15. Liu, X.; Randall, R.B.; Antoni, J. Blind Separation of Internal Combustion Engine Vibration Signals by a Deflation Method. Mech. Syst. Signal Process. 2008, 22, 1082–1091. [Google Scholar] [CrossRef] [Green Version]
  16. Zhao, M.; Jia, X. A Novel Strategy for Signal Denoising Using Reweighted SVD and Its Applications to Weak Fault Feature Enhancement of Rotating Machinery. Mech. Syst. Signal Process. 2017, 94, 129–147. [Google Scholar] [CrossRef]
  17. Huang, N.E.; Shen, Z.; Long, S.R.; Wu, M.C.; Shih, H.H.; Zheng, Q.; Yen, N.-C.; Tung, C.C.; Liu, H.H. The Empirical Mode Decomposition and the Hilbert Spectrum for Nonlinear and Non-Stationary Time Series Analysis. Proc. R. Soc. Lond. Ser. Math. Phys. Eng. Sci. 1998, 454, 903–995. [Google Scholar] [CrossRef]
  18. Lan, Y.; Hu, J.; Huang, J.; Niu, L.; Zeng, X.; Xiong, X.; Wu, B. Fault Diagnosis on Slipper Abrasion of Axial Piston Pump Based on Extreme Learning Machine. Measurement 2018, 124, 378–385. [Google Scholar] [CrossRef]
  19. Ge, H.; Chen, G.; Yu, H.; Chen, H.; An, F. Theoretical Analysis of Empirical Mode Decomposition. Symmetry 2018, 10, 623. [Google Scholar] [CrossRef] [Green Version]
  20. Lodetti, S.; Bruna, J.; Melero, J.J.; Sanz, J.F. Wavelet Packet Decomposition for IEC Compliant Assessment of Harmonics under Stationary and Fluctuating Conditions. Energies 2019, 12, 4389. [Google Scholar] [CrossRef] [Green Version]
  21. Subasi, A.; Jukic, S.; Kevric, J. Comparison of EMD, DWT and WPD for the Localization of Epileptogenic Foci Using Random Forest Classifier. Measurement 2019, 146, 846–855. [Google Scholar] [CrossRef]
  22. Bennett, C.; Dunne, J.F.; Trimby, S.; Richardson, D. Engine Cylinder Pressure Reconstruction Using Crank Kinematics and Recurrently-Trained Neural Networks. Mech. Syst. Signal Process. 2017, 85, 126–145. [Google Scholar] [CrossRef]
  23. Taglialatela, F.; Lavorgna, M.; Mancaruso, E.; Vaglieco, B.M. Determination of Combustion Parameters Using Engine Crankshaft Speed. Mech. Syst. Signal Process. 2013, 38, 628–633. [Google Scholar] [CrossRef]
  24. Savitzky, A.; Golay, M.J.E. Smoothing and Differentiation of Data by Simplified Least Squares Procedures. Anal. Chem. 1964, 36, 1627–1639. [Google Scholar] [CrossRef]
  25. Gatowski, J.A.; Balles, E.N.; Chun, K.M.; Nelson, F.E.; Ekchian, J.A.; Heywood, J.B. Heat Release Analysis of Engine Pressure Data. SAE Trans. 1984, 93, 961–977. [Google Scholar]
  26. Yun, H.J.; Mirsky, W. Schlieren-Streak Measurements of Instantaneous Exhaust Gas Velocities from a Spark-Ignition Engine; SAE International: Warrendale, PA, USA, 1974. [Google Scholar]
  27. Broatch, A.; Guardiola, C.; Pla, B.; Bares, P. A Direct Transform for Determining the Trapped Mass on an Internal Combustion Engine Based on the In-Cylinder Pressure Resonance Phenomenon. Mech. Syst. Signal Process. 2015, 62–63, 480–489. [Google Scholar] [CrossRef]
  28. Feature Extraction Using Multisignal Wavelet Packet Decomposition—File Exchange—MATLAB Central. Available online: https://www.mathworks.com/matlabcentral/fileexchange/33146 (accessed on 18 October 2019).
  29. Bi, F.; Ma, T.; Wang, X. Development of a Novel Knock Characteristic Detection Method for Gasoline Engines Based on Wavelet-Denoising and EMD Decomposition. Mech. Syst. Signal Process. 2019, 117, 517–536. [Google Scholar] [CrossRef]
  30. Khushaba, R.N.; Kodagoda, S.; Lal, S.; Dissanayake, G. Driver Drowsiness Classification Using Fuzzy Wavelet-Packet-Based Feature-Extraction Algorithm. IEEE Trans. Biomed. Eng. 2011, 58, 121–131. [Google Scholar] [CrossRef] [Green Version]
  31. Wang, T.; Zhang, M.; Yu, Q.; Zhang, H. Comparing the Applications of EMD and EEMD on Time–Frequency Analysis of Seismic Signal. J. Appl. Geophys. 2012, 83, 29–34. [Google Scholar] [CrossRef]
  32. Neighborhood Component Analysis (NCA) Feature Selection—MATLAB & Simulink. Available online: https://www.mathworks.com/help/stats/neighborhood-component-analysis.html (accessed on 18 October 2019).
  33. Bradley, D.; Kalghatgi, G.T. Influence of Autoignition Delay Time Characteristics of Different Fuels on Pressure Waves and Knock in Reciprocating Engines. Combust. Flame 2009, 156, 2307–2318. [Google Scholar] [CrossRef]
  34. Malan, N.S.; Sharma, S. Feature Selection Using Regularized Neighbourhood Component Analysis to Enhance the Classification Performance of Motor Imagery Signals. Comput. Biol. Med. 2019, 107, 118–126. [Google Scholar] [CrossRef]
Figure 1. Schematic of the engine experimental facility.
Energies 14 03117 g001
Figure 2. Flow chart of the analysis and modeling procedures.
Energies 14 03117 g002
Figure 3. (a) In-cylinder pressure trace, (b) band filtered signal, and (c) modulus of band filtered knock-cycle and normal-cycle signals.
Energies 14 03117 g003
Figure 4. In-cylinder pressure traces of 16 knock cycles and the average traces of 91 normal cycles in Point 6 (spark timing: −30° aTDC).
Energies 14 03117 g004
Figure 5. In-cylinder pressure and apparent heat release traces of three knock cycles.
Energies 14 03117 g005
Figure 6. Maximum in-cylinder pressure and pressure rise rate of knock and normal cycles.
Energies 14 03117 g006
Figure 7. CA10 and CA50 of knock and normal cycles.
Energies 14 03117 g007
Figure 8. Duration 10–50 and ignition delay of knock and normal cycles.
Energies 14 03117 g008
Figure 9. KI_AVL with respect to IKI of Point 6.
Energies 14 03117 g009
Figure 10. EEMD results of a knock cycle under 1500 rev/min, 600 kPa BMEP (Point 2).
Energies 14 03117 g010
Figure 11. Classification accuracies of the original model with all features.
Energies 14 03117 g011
Figure 12. Feature weights of 325 features.
Energies 14 03117 g012
Figure 13. Classification accuracies of original and retrained models with the first experiment dataset.
Energies 14 03117 g013
Figure 14. Classification accuracies of original and retrained models with the second experiment dataset.
Energies 14 03117 g014
Table 1. Engine specifications.
ParametersUnitsNominal Values
Number of cylinders-4
Borem0.072
Strokem0.084
Displacement volumem31368
Compression ratio-14
Fuel injection type-Port injection
Ignition-Spark plug
Table 2. Specification of the 6113B pressure transducer.
ParametersNominal Values
Pressure range0–20 MPa
Overload capacity25 MPa
Linearity≤±0.5% full scale output
Operating temperature range−20–350 °C
Table 3. Target engine speed and brake mean effective pressure of the 1st experiment.
ParametersUnitsPoint 1Point 2Point 3Point 4Point 5Point 6
Engine speedrev/min150015002000200030003000
BMEPkPa400600400600400600
Spark timing −37−29−40−32−37−30
Runs-15514696
Table 4. Target engine speed and brake mean effective pressure of the 2nd experiment.
ParametersUnitsPoint 1Point 2Point 3Point 4Point 5
Engine speedrev/min15001500200020003000
BMEPkPa400600400600600
Spark timing −9−2−10.5−4.5−4.5
Runs-54543
Table 5. Number of features extracted by WPD with respect to decomposition level.
Decomposition LevelNumber of Features
01
12
24
38
416
532
664
7128
Table 6. The knock cycle determination results.
ParametersUnitsPoint 1Point 2Point 3Point 4Point 5Point 6
Total cycles-18,000600016,800720010,8007200
Knock cycles-8693031796396552242
Table 7. Accuracy and training times of various machine learning algorithms employed.
AlgorithmsAccuracy (%)Training Time (s)
Decision treeFine tree99.97.0
Medium tree99.98.2
Coarse tree99.97.5
k-nearest neighborsFine KNN100149.6
Medium KNN99.9149.7
Coarse KNN99.9151.1
Cosine KNN99.7149.9
Cubic KNN99.93115.5
Weighted KNN99.9150.6
EnsembleBoosted tree ensemble99.96.5
Bagged tree ensemble99.916.0
Subspace discriminant ensemble99.929.7
Subspace KNN ensemble10026,816.0
RUSB trees ensemble99.95.9
Table 8. The 37 significant features.
The Selected Features
EEMDIMF-1-
IMF-2-
IMF-3Peak
IMF-4Peak
IMF-5Peak
IMF-6Peak
IMF-7-
IMF-8Peak
WPDLevel-0-
Level-1-
Level-2#5
Level-3#11, 15
Level-4#18, 21, 23, 29
Level-5#36, 42, 46, 62
Level-6#67, 76, 85, 91, 92, 119
Level-7#131, 134, 147, 152, 162, 171, 180, 182, 183, 186, 191, 215, 218, 241, 251
Publisher’s Note: MDPI stays neutral with regard to jurisdictional claims in published maps and institutional affiliations.